Environmental Improvement Plan: Annual Progress Report
Published 16 July 2026

© Crown copyright 2026
This publication is licensed under the terms of the Open Government Licence v3.0 except where otherwise stated. To view this licence, visit nationalarchives.gov.uk/doc/open-government-licence/version/3 or write to the Information Policy Team, The National Archives, Kew, London TW9 4DU, or email: psi@nationalarchives.gov.uk.
Where we have identified any third party copyright information you will need to obtain permission from the copyright holders concerned.
This publication is available at https://www.gov.uk/government/publications/environmental-improvement-plan-annual-progress-report-2025-to-2026/environmental-improvement-plan-annual-progress-report
Executive summary
This report provides the annual assessment of progress in delivering the Environmental Improvement Plan (EIP) and the Environment Act 2021 targets over the statutory reporting period April 2025 to March 2026.
It is the first annual progress report since publication of the Environmental Improvement Plan (EIP) in December 2025 and shows that, in the first few months of this 5-year plan, government has progressed a broad and ambitious programme of reform, investment and delivery activity across the EIP. This included:
- publication of the Land Use Framework to transform national decision making on how we can use land more effectively
- securing through the farming budget the largest investment into nature in history, with over £7 billion directed into nature’s recovery
- expanding Air Quality Monitoring Networks with 21 new PM2.5 monitors to track statutory targets
- setting a new vision for water and plan to reform our water sector and the wider water system through the Water White Paper and a quadrupling of water company investment under Ofwat’s Price Review 2024, vital to cleaning up our rivers, lakes and seas
- publication of the UK’s first-ever perfluoroalkyl and polyfluoroalkyl substances (PFAS) plan
- committing £1.1 billion to improve local recycling services across England, enhancing waste management and community outcomes
- publication of the Good Food Cycle strategy and delivery of priority outcomes for healthier, more affordable, sustainable and resilient 21st century UK food system
- publication of the Carbon Budget Growth Delivery Plan and Methane Action Plan
- response to the Climate Change Committee’s biennial adaptation progress report, highlighting action government is taking across the natural environment sector to improve climate resilience
- announcing at least £10.5 billion will be invested by March 2036 to construct new flood and coastal erosion schemes and repair existing defences
- announcing investment of over £1 billion in the next stage of development of a new national biosecurity centre at Weybridge
- announcing 2 new national forests, in addition to the Western Forest. The second new national forest will be in the Oxford-Cambridge growth corridor, and the third will be in the North or Midlands of England
The report brings together progress on delivery of all the EIP’s goals, commitments and actions, progress towards statutory and interim Environment Act targets, and the latest evidence on changes in the natural environment.
Overall, delivery of the EIP is underway across all goals. Of the 308 actions contributing to EIP25 goals, around 88% were in progress by the end of March 2026, around 8% had been completed, and around 5% had either not yet started or were off track, with work underway to address delivery risks.
The framework supporting monitoring and evaluation of EIP delivery has also continued to develop. All 91 EIP25 commitments are supported by metrics and actions set out in the EIP Monitoring Plan 2025. This is being strengthened across the EIP through programme-level evaluation and a growing range of action- and commitment-level evaluations. Over time, this will improve the evidence available to assess delivery and inform future decisions.
Progress is being made towards statutory and interim Environment Act targets, and many interim targets are broadly consistent with expected delivery trajectories. In some cases, however, it remains too early to draw firm conclusions from the available data. The targets are ambitious and will require sustained delivery at pace and scale over several years.
Challenges remain in some areas, including where delivery depends on major infrastructure, behaviour change, regulatory reform or the combined effect of multiple interventions.
The Environmental Indicator Framework (EIF) provides a short-term (5‑year) assessment of how different aspects of the natural environment are changing, showing where conditions are improving, deteriorating or remaining broadly stable. Figure 1 summarises the short-term assessment of the 66 indicators in the EIF. In environmental monitoring and reporting there is often a delay in the observable response to both environmental stressors and policy interventions which can temporarily mask both negative and positive trends in the health of nature. For example, there may be a delayed response in species population to conservation interventions because they will need to go through multiple breeding cycles to result in a growing population.
For this reason, environmental indicators are most reliably considered over a period of multiple years (5 years for short term assessment). Where indicators do not have a trend assessment this is mainly due to there not being a long enough time series. As environmental monitoring continues, the time series will build, and we will be able to publish more trend assessments.
Within most goals, indicators move in different directions, highlighting the complexity of environmental change and the time lag between intervention and measurable impact. Latest evidence presents a mixed picture of environmental change in the short-term. Seven goals contain improving indicator components, including strong performance in the Air Goal (where 9 out of 11 components are improving) and the Chemicals and Pesticides Goal (where 12 out of 14 components are improving).
Six goals include components that are deteriorating, underlining the continued scale of environmental pressures and the need for sustained delivery. For some areas there is not yet a sufficient time series to support a robust trend assessment.

Figure 1: Short-term assessment of EIF indicators relevant to the 10 EIP goals
This stacked bar chart shows the percentage of indicator components within each goal area that have been assessed as improving, showing little or no change, deteriorating or have not yet been assessed against the stated goal.
Note that the EIF is now updated on a rolling basis, and so indicators referenced in this progress report may have been updated. For the version of the EIF referenced in this document see Environmental Indicator Framework.
Alongside this report, we have set out the government’s response to the Office for Environmental Protection (OEP) annual assessment of progress for 2024 to 2025. The OEP made 53 recommendations. Government accepts the majority in full or in part, is undertaking further work before responding fully to a small number and rejects 3 where existing frameworks are considered sufficient or where the recommendations duplicate existing processes.
Taken together, the evidence in this report shows that implementation of the revised EIP has begun across all goals, with progress made during the first year of EIP25 delivery. Considerable work remains, but the report shows continued activity across the programme and a strengthening evidence base to support long-term environmental improvement.
Delivery progress
This report is organised into chapters based on the 10 EIP goals and the cross-cutting enablers for delivery of the EIP. Each chapter follows a consistent format:
-
Delivery summary: provides headline summary of delivery over the reporting period, including key achievements covering both the previous EIP23 (April to November 2025) and the current EIP25 (December 2025 to March 2026).
-
Delivery progress: provides an assessment of progress against each commitment and statutory Environment Act target, including, where available, the latest data on key metrics used to measure progress and a summary of progress against supporting actions. Delivery status will vary across actions depending on the proximity of the deadline and complexity of the action. Progress against supporting actions is summarised as either:
-
completed
-
in progress
-
not started – on track
-
off track
A full list of the status of all EIP25 actions is available in Annex 1 for reference.
-
Trends in the natural environment presents the latest available data, primarily from the Environmental Indicator Framework, showing short-, medium- and long-term environmental trends relevant to the goal.
-
Evaluation updates: summarises the status and findings of recent evaluation activity related to goal delivery.
Alongside the EIP25, we published Environment Act target delivery plans and committed to keep plans up to date through the annual reporting cycle. Each target delivery plan has been updated to reflect latest delivery information and can be found at: Environmental Improvement Plan.
Cross-cutting enablers
Delivery summary
Cross-cutting enablers will help drive delivery of the EIP. We are delivering these through commitments and actions, including mobilising private finance and partnerships, supporting local delivery and land managers, building green skills, and enabling sustainable behaviours.
Over the reporting year, progress had been made on the commitments and 21 supporting actions that contribute to delivery of the EIP’s cross-cutting enablers. As of March 2026, 10% of actions have been completed, with 90% in progress. Full details of the actions can be found in Annex 1.
Since April 2025, we have taken decisive action to deliver these cross-cutting enablers. In particular, we have:
- published the Land Use Framework for England setting out how we can use land more effectively
- provided over £110 million direct funding to Protected Landscapes Organisations to support local action on nationally important priorities, including nature restoration and access for all
- launched 2 new market standards for the supply of biodiversity and nutrient reduction benefits, as part of the suite of UK Nature Investment Standards, sponsored by Defra and led by the British Standards Institution
- published 33 Local Nature Recovery Strategies (LNRS) with 10 more consulted on and awaiting publication; progress has continued into the current reporting year, with 41 out of 48 published as of the end of June 2026
- published Energising Britain: Your voice in our Clean Energy Superpower Mission, setting out how we will work with businesses and communities across the country to raise awareness of and ensure everyone can benefit from climate and nature action
Commitment delivery progress
We are delivering cross-cutting activity to enable and drive delivery of the EIP.
Table 1: sets out delivery and measurement of progress against EIP25 commitments for cross-cutting enablers between April 2025 to March 2026.
| Reference | Commitment | Progress update |
|---|---|---|
| 1 | Mobilise private investment and finance to restore and protect nature in England. | Responded to the call for evidence on the role of the private sector in nature recovery (March 2026). Launched 2 new standards for the British Standards Institution in BSI Flex 702 v2,0 Nature Markets - Supply of Biodiversity Benefits and BSI Flex 704 V2 Nature Markets – Supply of Nutrient Benefits. Launched a public consultation on a new Communities Code of Practice to give national capital projects a comprehensive framework for community engagement and benefit sharing. Alongside last year’s Overarching Principles standard (Flex 701), this creates the world’s most comprehensive suite of Nature Market Standards. An agri-food pathway will be completed by the end of 2026, with a full government response to the Nature Markets Accelerator consultation due later this year. |
| 2 | Publish LNRS to cover the whole of England for use by public, private and voluntary sectors to deliver on nature recovery and wider environmental commitments by the end of 2025 or shortly after. | 35 LNRSs have been published, including 33 in the reporting period. 10 have completed consultation. 3 are yet to go to consultation. Progress has continued into the 2026 to 2027 reporting year, with 41 out of 48 published as of the end of June 2026. Regulations from the Levelling Up and Regeneration Act 2023 (March 2026) have been implemented, requiring planning documents to ‘take account’ of LNRSs. Spatial Development Strategies (SDS), expected later in 2026, will also need to ‘take account’ of LNRSs. |
| 3 | Use the National Estate for Nature (NEN) group to support the delivery of statutory nature targets and 30by30 on members’ estates, trial innovative land management approaches and provide engagement routes to support and replicate action. | NEN met quarterly and members published estate management plans (April 2026). Minutes available on the National Estate for Nature (NEN) group page. |
| 4 | Enable Protected Landscapes organisations to make land greener, wilder, and more accessible to all. | Provided over £110 million direct funding to Protected Landscapes Organisations (by April 2026). Ongoing work with National Parks Partnerships and the National Landscapes Association on national communications to improve access. |
| 5 | Build green skills for the future, including in agriculture, land management and water. | Working with water companies on schemes such as skills bootcamps and sharing information and data with EU Skills and Water UK. |
| 6 | Address barriers to sustainable choices across society. | Progress towards this commitment is being delivered across the EIP, and key developments include the Simpler Recycling reforms, convening of the Circular Economy Taskforce, pilot initiatives on sustainable public sector food procurement, along with a public consultation on domestic solid fuel burning and the Land Use Framework commitment to empowering communities to improve local land. Published Energising Britain: Your voice in our Clean Energy Superpower Mission (December 2025) setting out how we will work with businesses and communities to ensure everyone can benefit from the Clean Energy Superpower Mission. |
| 92 (new) | Coordinate delivery of the Land Use Framework through the Land Use Unit so that land is used more effectively to support delivery of government targets and goals including on nature. | To reflect the importance of the LUF, we are adding a new commitment to be reported on in future annual progress reports. New supporting actions are set out in Annex 1. |
Evaluation updates
The Local Nature Recovery Strategies (LNRS) Evaluation is a Defra-led project, employing process evaluation (including case studies, interviews, and surveys), impact evaluation using theory-based approaches, and value-for-money analysis and will help us understand how LNRSs improve environmental decision-making and influence outcomes.
Goal 1: Restored nature
Our vision for this goal is to create a network of bigger, better and more resilient habitats to help nature thrive. We are delivering this through commitments and actions, including:
- creating and restoring habitats at scale
- supporting nature‑friendly farming
- targeting species conservation
- expanding and connecting nature‑rich areas (including woodland and hedgerows)
- protecting our marine environment
The full list of interim and statutory Environment Act targets for the Restored nature goal can be found at Annex 2.
Goal delivery summary
Over the reporting year, progress had been made on the commitments and 33 supporting actions that contribute to delivery of this goal. As of March 2026, 94% of actions are in progress, with 3% off track and 3% reported as being off track during the reporting period but completed after. Full details of the actions can be found in Annex 1.
Since April 2025, we have taken decisive action to deliver this goal. In particular, we have:
- introduced major reforms to environmental regulation to boost economic growth while strengthening protections for nature (April 2025)
- launched a £360 million fund to support fishing and coastal communities, driving local growth and investment (May 2025)
- announced a £30 million boost to support farmers leading nature restoration (May 2025)
- designated a new National Nature Reserve to protect the Garden of England (May 2025)
- put forward proposals to introduce further restrictions on bottom trawling to better protect marine environments (June 2025)
- extended regulations protecting deep peat from unnecessary burning were extended to cover 676,628 hectares of deep peat, to protect wildlife and sensitive peatland habitats (September 2025)
- introduced landmark legislation to strengthen protection of the world’s oceans (September 2025)
- announced new funding to strengthen protection for threatened species and vulnerable habitats through overseas conservation projects (October 2025)
- extended Countryside Stewardship to support farming and nature recovery (October 2025)
- introduced a new strategy to support overseas wildlife hotspots and strengthen global conservation efforts (November 2025)
- secured the largest investment into nature in history through the farming budget, with over £7 billion directed into nature’s recovery. This includes environmental farming schemes (£5.9 billion), tree planting (£816 million) and peatland restoration (£85 million) and will make a significant contribution to Environment Act targets (November 2025)
- published the Animal Welfare Strategy which reaffirmed our manifesto commitment to bringing an end to the use of snare traps in England (December 2025)
- published the Grey Squirrel Policy Statement (January 2026) and Deer Impacts Policy Statements (February 2026)
Environment Act target delivery progress
There are 6 statutory and 6 interim Environment Act targets contributing to delivery of the Restored nature goal. Progress towards each target is set out below.
Commitment 8: By December 2030 50% of SSSI features to have actions on track to achieve favourable condition (Environment Act interim target).
The interim target for Site of Special Scientific Interest (SSSI) features to have actions on track remains ambitious but achievable. It contributes to the statutory species targets. As set out in the Protected sites Environment Act target delivery plan, delivery requires coordinated action across landowners, farmers, delivery bodies and government programmes to address multiple, interacting pressures affecting feature condition.
Progress update
Our approach prioritises progressing actions on features, while continuing to improve the underlying condition assessment base. Progress towards the EIP23 interim target on condition assessments was slower than anticipated, given the scale and complexity of the SSSI network and the resource required to undertake condition assessments. Natural England is addressing this through improvements in monitoring approaches, including greater use of new technologies, such as remote sensing, and increased use of data from third parties.
To drive delivery of actions on features, Natural England is focusing on larger and more complex SSSI sites, where bringing a full suite of actions ‘on track’ can be more challenging and time intensive. Improving feature condition requires a broad and collaborative effort. Defra is now chairing the Major Landowner Group to strengthen its role as a delivery board.
To assess the impact that actions on track are having on improving the condition of SSSI features, Natural England is developing change detection tools using Earth Observation data. Coupled with recording and monitoring of actions, this will provide a means of determining whether features are moving towards favourable condition.
What the data show
Natural England has developed a metric that measures progress towards achieving this interim target and can be found on Natural England’s Designated Sites database. Figure 2 shows the percentage of SSSI features with actions on track to achieve favourable condition (EIP25 interim target) and Figure 3 shows the percentage of SSSI features with an up-to-date condition assessment (previous EIP23 interim target and ambition in EIP25).
As of the end of November 2025 around 23% of SSSI features had actions on track to achieve favourable condition, rising to just under 26% by the end of March 2026 in line with the anticipated trajectory.
As of the end of November 2025, around 33% of features had an up-to-date condition assessment, increasing to approximately 35% by the end of March 2026. This remains below the required trajectory and is being addressed by Natural England through improvements in monitoring approaches, including greater use of new technologies, such as remote sensing, and increased use of data from third parties.

Figure 2: Percentage of SSSIs features with actions on track to achieve favourable condition
Source: Natural England: Designated Sites View, historical monthly data recorded by Department for Environment, Food & Rural Affairs and Natural England.
Figure 2 shows quarterly data on the percentage of features with actions on track between December 2022 and March 2026. The actual percentage (solid purple line) increase from 8% in December 2022 to 26% in March 2026, with some short-term fluctuations. The trend is broadly upward and closely tracks the linear projection (dashed orange line), which rises steadily toward the 50% interim target value by December 2030.

Figure 3: Percentage of SSSIs features with an up-to-date condition assessment
Source: Designated Sites View, historical monthly data recorded by Department for Environment, Food & Rural Affairs and Natural England.
Figure 3 shows quarterly data on the percentage of features with an up-to-date condition assessment from December 2022 to March 2026. The actual percentage (solid purple line) increases from 15% in December 2022 to 35% in March 2026, with some short-term fluctuations, and remains slightly below the linear projection (dashed orange line) which rises steadily toward 100% by December 2032.
Commitment 10: Restore or create a total of 250,000 hectares of a range of wildlife-rich habitats outside of protected sites by December 2030 (Environment Act interim target).
This interim target also reports on the statutory Environment Act target:
- to restore or create in excess of 500,000 hectares of a range of wildlife-rich habitats outside protected sites by 2042
The target is delivered through a mix of delivery measures set out in the Habitat creation and restoration Environment Act target delivery plan. Many of these will rely on voluntary action from landowners, farmers, environmental non-governmental organisations, businesses, and the public.
Progress update
The level of delivery so far is consistent with expectations for this point in the target delivery pathway. The most recent evidence shows that work to create and restore habitat is well underway. We do not expect delivery towards the interim or Environment Act target to be linear and expect later years to have increased delivery as Landscape Recovery projects start to deliver.
The Environment Act Habitat Target - Evidence Report 2026 shows that, as expected, agri-environment schemes have delivered most of the target to date. This is because many schemes are well established meaning creation of habitat could happen relatively quickly. Most delivery to date has come from arable field margins with comparatively smaller areas delivered for habitats such as heathland, ponds, and coastal and riparian habitats. Arable field margin habitats are relatively easy to create, and because we need to ensure the full range of wildlife-rich habitats are restored or created, the contribution of wildflower rich arable field margins is capped at 40,000 hectares. This cap has now been reached. This does not mean that no further arable field margins will be created or funded. Rather, additional delivery of this habitat type will not be added to the reported total, and over the lifetime of the target some arable field margins are likely to fall out of schemes and be replaced by others.
This report expands data coverage compared to 2025, including with data from external partners for the first time where suitable data is available. A map visualising progress has also been published for the first time.
What the data show

Figure 4: Cumulative delivery of wildlife-rich habitat creation and restoration since January 2023, as reported annually
Source: Environment Act Habitat Target - Evidence Report 2026 - JP075 , Environment Act Habitat Target – Evidence Report 2025 - JP063.
Figure 4 shows cumulative delivery of wildlife-rich habitat creation and restoration since January 2023. In 2025 there was a cumulative total 38,877 hectares where action has been taken that is reasonably expected to create or restore wildlife-rich habitats. This rises to a cumulative total of 77,638 hectares in 2026. This represents an increase on the previous year’s reported figure, reflecting both additional delivery on the ground and the inclusion of further datasets.
Commitment 11: Increase England’s tree canopy and woodland cover by 0.33% of land area by December 2030 from the 2022 baseline of 14.9%. (Equivalent to a net increase of 43,000 hectares) (Environment Act interim target).
This interim target also reports on the statutory Environment Act target:
- to increase tree canopy and woodland cover to at least 16.5% of total land area by 2050
Progress update
We expect to meet the interim and statutory tree canopy and woodland cover targets through a mix of delivery measures set out in the Tree canopy and woodland cover Environment Act target delivery plan.
In 2025 to 2026, 5,250 hectares of new woodland was planted in England, of which 5,105 hectares received government funding, mostly over 90% of which was through the Nature for Climate Fund. In addition, 925,000 trees were planted outside woodland, equivalent to 1,137 hectares of new canopy, bringing the total area of tree canopy established and numbers of trees planted in 2025 to 2026 to 6,386 hectares and 7.8 million trees, respectively.
A total of 22,700 gross hectares of tree canopy and woodland cover has been established since 31 March 2022. Woodland planting rates in the year 2025 to 2026 were 9% lower than in 2024 to 2025 but 133% higher than those achieved in 2021 to 2022. 87% of the woodland created in 2025 to 2026 was broadleaf woodland, with the remaining 13% conifer.
For the first time, the data includes statistics for new intended woodland establishment through natural colonisation. There have been updates in the Trees Outside Woodland map, for which an updated version is due for publication later in 2026.
Information on woodland creation and trees planted, that are not grant-aided or notified to the Forestry Commission is limited and is likely an underestimate. However, new woodland and trees planted that are not reported annually in the Forestry Commission’s Key Performance Indicators Report will be assessed, together with woodland and tree canopy loss, using remote sensing in the next full progress report in 2031, when all contributory datasets will be reconciled.

Figure 5: New planting of woodland and trees outside of woodland in England, 2021 to 2022 to 2025 to 2026
Source: Forestry Commission Key Performance Indicators: Report for 2025 to 2026.
Figure 5 shows the area of new planting of woodland and canopy-equivalent area of trees outside woodland in England, from for the financial years 2021 to 2022 to 2025 to 2026. Total planting increased between the financial years 2021 to 2022 and 2024 to 2025, before decreasing in the most recent year shown.
In the most recently reported year (2025 to 2026), provisional figures indicate that new woodland planting decreased from 5,765 hectares (in 2024 to 2025) to 5,250 hectares, and planting of trees outside woodland decreased from 1,399 hectares (in 2024 to 2025) to 1,137 hectares.
The financial years 2022 to 2023 and 2023 to 2024 are marked with [r] to indicate revised figures, and 2025 to 2026 is marked with [p] to indicate these are provisional figures.
No target line is included in the figure as the interim target is for tree canopy and woodland cover as a percentage of England’s land area, while the chart shows the area of new planting each year.
What the data show
The target metric is a composite indicator based on administrative data and remote sensing to measure new planting and natural establishment of trees as well as losses of trees to development, open habitat restoration, pests, diseases and natural mortality.
While the gross area of tree canopy and woodland newly established since March 2022 is more than half of the area required to meet the 2030 interim target, woodland loss and tree mortality also need to be accounted for, as the target is a net target. Data on the annual change in net woodland area is only available up to and including 2023 to 2024. This is found on pages 35 to 36 of the 2025 to 2026 Forestry Commission Key Performance Indicator report.

Figure 6: Net change in woodland area, based on the balance between new planting of woodland and woodland removal, 2021 to 2022 to 2023 to 2024
Source: Forestry Commission Key Performance Indicators: Report for 2025 to 2026.
Figure 6 shows the net change in woodland area, based on the balance between new woodland planting and woodland removal for development and open-ground habitat restoration, for the financial years 2021 to 2022 to 2023 to 2024. Net change in woodland area increased in each year shown in the figure, indicating a rising net gain over the period. In the most recently reported year (2023 to 2024), the net change in woodland area was 4,138 hectares. No target line is included in the figure as the interim target is for tree canopy and woodland cover as a percentage of England’s land area, while the chart shows net change in woodland area each year and only presents a partial picture.
Progress towards the target is assessed using four indicator components. These provide a current picture of progress. As data availability differs between components, the most recent available figures are presented below. A full reconciliation of all datasets will be published in 2031, including analysis of remote sensing data that goes beyond the information given below.
- Area of new woodland established between April 2022 and March 2026: 18,698 hectares.
- Canopy equivalent area of tree canopy outside woodland established between April 2022 and March 2026: 4,043 hectares.
- Area of woodland repurposed due to development between April 2022 and March 2024: 365 hectares.
- Area of priority open-ground habitat restored from woodland between April 2022 and March 2026: 376 hectares.
Improve the Red List Index (RLI) for England for species extinction by 2042 compared to 2022 levels (Environment Act target).
This is an over-arching statutory target, delivered through a number of interim targets and EIP25 commitments, as set out in the Statutory species targets Environment Act target delivery plan.
Progress update
Delivery progress on contributing interim targets and EIP25 commitments is set out throughout this report. In August 2025, Natural England published the Threatened Species Recovery Actions (TSRA) dataset which sets out key and bespoke recovery actions for 1,800 threatened species in England. This will be used to inform delivery, prioritisation of actions and can be used to support the development of monitoring towards the Environment Act target.
What the data show
Progress in delivery of the species extinction target is measured using the RLI for England (the EIF D5 indicator). The RLI indicator is partially updated on a 5-yearly basis and fully updated every 10 years. The next partial update is due in 2027. As such, there is no update for this reporting period. Shorter-term metrics and the trajectory are under development and are not yet finalised.
We are currently examining species-specific action data that could be used to track progress, as well as short-term species recovery indicators. The aim of these indicators would be to highlight when relevant environmental changes are or are not happening at the expected timescales.
Commitment 15: Halt the decline in species abundance by 2030 (Environment Act target).
This also covers reporting on the statutory Environment Act targets to ‘Halt the decline in species abundance by 2030 and increase species abundance so that by 2042 it is greater than in 2022 and at least 10% greater than in 2030’. They are reported on within this commitment for ease of reference, however, meeting the species abundance targets requires delivery of actions and commitments across the EIP. These are set out in the Statutory species targets Environment Act target delivery plan. The delivery plan also sets out how we are improving the evidence base and how this allows us to adapt and improve our delivery plans over time.
Progress update
We published an update to the all-species abundance indicator for England as an official statistic in development on 28 April 2026. Once fully developed, the all-species abundance measure will be used to assess whether government has met the statutory target of halting the decline in species abundance by 2030, and to track progress towards our target to reverse these declines by 2042.
As this is an ‘Official Statistic in Development’ it cannot currently be used to assess whether we are on track to meet our statutory species abundance targets. Future revisions to the methodology or inclusion of new datasets may result in changes to current trends.
New modelling work done by the UK Centre for Ecology & Hydrology and the National Plant Monitoring Scheme has enabled us to include several species of plants in the all-species and priority species indicators. Existing plant species in the indicator have also been updated so that their trends are reflective of England, rather than full UK, abundance. See the Indicators of species abundance in England: Technical annex for the full list of species added and for more detail on how these changes have impacted the indicators.
Following feedback from last year’s release of these statistics (see the Indicators of species abundance in England: Response to feedback), we noted that there was no consensus on a preferred smoothing option and so have retained both levels of smoothing this year. Our refreshed plan for moving towards one smoothing option is reflected in the Development plan for the indicators of species abundance in England.
We have adjusted the way we calculate short and medium-term trends, which now involves re-running the models over that specific period only. This is to avoid biasing these assessments with the long-term trend and is a more statistically appropriate comparison than used previously due to the propagation of uncertainty.
We have published an all-species distribution index, plus an updated priority species distribution index as an official statistic in development in the 2025 publication of the England Biodiversity Indicators.
What the data show
Between 1970 and 2024 the index of change in relative abundance of species in England declined by around 40%. This metric is reported annually however there is a two-year reporting lag, reflecting the number of species brought together and the multiple steps and external partners involved in producing the data. Although recent decades showed some signs of stabilisation, more recently the index has fallen again. In the short term (2019 to 2024), 47% of species declined and 38% increased. The adverse weather pattern in 2024 will be partially responsible for the sharp drop in the indicators in this year.
The latest data point will have a disproportionate impact on the most recent trends however, as more data becomes available and the 2025 data point is added to the time series in 2027, we will have a better understanding of whether the drop in 2024 is an unusual year or a more stable downward trend.

Figure 7: Change in relative abundance of 1,185 species in England from 1970 to 2024 shown using 2 smoothing options
Source: Indicators of species abundance in England.
Figure 7 shows the 2 options for the smoothed trend (solid line) with their 95% credible intervals (shaded area). See discussion of smoothing in the Caveats and limitations section of the Indicators of species abundance in England report. 2 possible versions of the indicator are presented, one with a greater degree of smoothing applied (option 1) and one with a lesser degree of smoothing (option 2).
Index values represent change from the baseline value in 1970; the credible interval widens as the index gets further from the 1970 value and confidence in the estimate of change relative to the baseline falls.
The credible intervals capture the variation in trends across species, but not uncertainty in the underlying species abundance indices for individual species. They do not capture uncertainty associated with the spatial locations of sample points, nor the degree to which the species represent non-sampled species.
A description of the overall trends shown in the figure can be found under the heading ‘What the data show’.
Commitment 16: By December 2030, double the number of farms providing sufficient year-round resources for farm wildlife, compared with 2025 (Environment Act interim target).
This interim Environment Act target was set in the revised EIP in December 2025 and contributes to the statutory species Environment Act targets. It is delivered through agri-environment scheme actions, as set out in Farm wildlife Environment Act target delivery plan.
Progress update
The Sustainable Farming Incentive (SFI) and Countryside Stewardship (CS) schemes deliver agri-environment agreements to incentivise farmers to provide resources for farm wildlife. To achieve the target, agreements for farms which provide year-round resources need to be maintained and additional farms encouraged to uptake actions in the appropriate effective combination.
Following the full reopening of SFI expected in September 2026, we expect to see an increase in the number of farms providing resources for farm wildlife, alongside further progress towards achieving this target.
What the data show
As of 1 April 2026, 23% of farm businesses in England were meeting the requirements to provide sufficient year-round resources for farm wildlife. This involves having farm wildlife actions on at least 7% of their farm area, while undertaking an effective combination of actions, at any given time.
This is a small increase relative to the baseline of 21% of farm businesses with the required action combinations on at least 7% of their farm (as of April 2025).
Delivery of this target will be monitored by the percentage of land managers and farmers that are doing the required combination of actions to support farm wildlife. Further detail on these requirements can be found in the Farm wildlife Environment Act target delivery plan. Agri-environment scheme uptake data for CS and SFI agreements are provided by the Rural Payments Agency (RPA).
The RPA create the administrative primary data from their application and payments process. Defra validate and analyse this data and use it to calculate the number of qualifying farm businesses.

Figure 8: Percentage of farm businesses in England meeting the requirements to provide sufficient year-round resources for farm wildlife
Source: Baseline Farm wildlife Environment Act target delivery plan, 2026 internal data Department for Environment, Food & Rural Affairs.
Figure 8 shows the percentage of farm businesses in England meeting the requirements to provide sufficient year-round resources for farm wildlife in 2025 and 2026. The percentage increased slightly over this period but remains below the 2030 interim target value of double the 2025 baseline.
Commitment 17: Make sure at least 49% of MPA protected features are in favourable condition and at least 46% in recovering condition, by December 2030 (Environment Act interim target).
Every 5 years we review progress towards the statutory Environment Act target to ensure that at least 70% of designated features in Marine Protected Areas (MPAs) are in a favourable condition by 2042, with the remainder in recovering condition. This is reported with the interim target using the same reporting mechanisms.
These targets are delivered through a range of MPA management measures and byelaws, as set out in Marine protected areas (MPA) Environment Act target delivery plan.
Progress update
We are working with the Inshore Fisheries and Conservation Authorities (IFCAs), the Marine Management Organisation (MMO), and other delivery partners to implement management measures to support our EIP commitments. Within the reporting period April 2025 to March 2026, we have achieved the following:
- Southern IFCA implemented a byelaw to limit bottom towed fishing within 20 MPAs
- the MMO consulted on proposed management measures for fishing in 42 MPAs in English waters. The MMO are carefully analysing responses before decisions are made
- Natural England delivered and published 85 MPA condition assessments
What the data show
Delivery of these targets is measured by percentage of MPA features in favourable condition.
A baseline of 44% of features in favourable condition within English MPAs was reported in 2022. There will be no update on whether the percentage of features within favourable condition are increasing or decreasing until the next assessment in 2030. This is because marine species and habitats can have extremely slow recovery rates and a higher assessment frequency is unlikely to show significant change.
However, we are focused on ensuring MPAs are properly protected by seeking to remove damaging human activities within or near MPAs and ensuring the use of the mitigation hierarchies within legislation including to compensate for unavoidable damage, which should bolster feature condition to favourable condition over time.
Assessing the condition of features designated within MPAs is undertaken by Statutory Nature Conservation Bodies (SNCBs) – Natural England and the Joint Nature Conservation Committee (JNCC) - using survey data. In the absence of survey data, a vulnerability assessment is performed, which estimates the sensitivity of protected features to human activity occurring within their vicinity. The results will give the likely condition of the feature at the site. These assessments will be used to determine the achievement of the English statutory and interim MPA target.
We have invested in research and development to improve assessment methods, particularly where direct evidence is unavailable. This will support the assessment of management measures. We are also investing in innovative approaches for assessment.

Figure 9: Baseline and projected percentage of designated features in MPAs in favourable condition by interim and statutory target dates.
Source: Marine protected areas (MPA) Environment Act target delivery plan.
Figure 9 shows the baseline percentage of designated features in MPAs in favourable condition (44% in 2022), compared to the interim target (49% by 2030) and long-term Environment Act target (70% by 2042).
Commitment delivery progress
We are taking coordinated and measurable action to restore nature.
Table 2: sets out delivery and measurement of progress against EIP25 commitments for Restored Nature goal between April 2025 to March 2026.
| Reference | Commitment | Progress update |
|---|---|---|
| 7 | Effectively conserve and manage 30% of the UK’s land by 2030 (30by30). | In the current reporting year, we published the 30by30 on land in England: delivery plan in July 2026. |
| 8 | By December 2030 50% of Sites of Special Scientific Interest (SSSIs) features to have actions on track to achieve favourable condition (Environment Act interim target). | See Environment Act target delivery progress section. |
| 9 | Increase the contribution that Protected Landscapes are making to Environment Act and EIP targets, measured through the Protected Landscapes Targets and Outcomes Framework. | Statistics for the Protected Landscapes will be available annually with a national progress report every 5 years from 2025 in line with most Protected Landscape management plan review cycles. Published the first national progress report, Protected Landscape Targets and Outcomes Framework (PLTOF) Progress Report 2023 to 2025 (July 2025). This outlines the data which can be used to measure against the PLTOF targets, presenting a current baseline. Currently limited data is available, so future years’ data will enable trends to measure against this commitment. Data can be found in the Protected Landscapes Targets and Outcomes Framework Headline Statistics 2025. |
| 10 | Restore or create a total of 250,000 hectares (ha) of a range of wildlife-rich habitats outside of protected sites by December 2030. (Environment Act interim target) | See Environment Act target delivery progress section. |
| 11 | Increase England’s tree canopy and woodland cover by 0.33% of land area by December 2030 from the 2022 baseline of 14.9%, equivalent to a net increase of 43,000 hectares (Environment Act interim target). | See Environment Act target delivery progress section. |
| 12 | Support farmers and land managers to create or restore 48,000km of hedgerows by 2037 and 72,500km of hedgerows by 2050. | As stated in the Countryside Stewardship, Environmental Stewardship and Sustainable Farming Incentive Option Summaries, as of 1 April 2025, 7,050 kilometres of hedgerows had been committed to be newly planted or restored through live Countryside Stewardship Capital grants. Developed and supported the ELM hedgerow offers through stakeholder engagement. A new Hedgerow Map will be available later this year. |
| 13 | By 2043, increase saltmarsh by 15%, compared to 2009 levels, seagrass by 15% compared to 2024 levels, and create functional oyster reef habitat at ecosystem scales in 5 to 8 suitable English water bodies. | Scaling up delivery of saltmarsh, seagrass and oyster habitats. Provided funding for 16 coastal restoration projects, which are expected to deliver a 0.23% increase from a 2009 baseline of saltmarsh (91 hectares / 0.912km2), 0.47% increase from 2024 baseline of seagrass (2.65 hectares / 0.0265km2), and 0% increase of oyster reef (1 hectare / 0.01km2). The Environment Agency collected this data for the ReMeMaRe project as part of annual project reporting from lead project delivery partners. They reported this data directly to Defra with the purpose of monitoring progress against this commitment. The data was quality assured by providing reporting guidelines to partners and was reviewed by Environment Agency’s Area project managers. The Marine Enhancement Directory (MEnD) is live as a national platform to map and manage restoration activity. This is alongside new tools including a saltmarsh feasibility methodology and a native oyster feasibility study. Published New Analysis-Ready Data on saltmarsh and seagrass extent and change. |
| 14 | Take targeted action to conserve and recover threatened species. | Allocated £4.5 million through the £60 million Species Recovery Programme to projects supporting the conservation or recovery of 278 rare and threatened species across 140 projects. |
| 15 | Halt the decline in species abundance by 2030. (Environment Act statutory target). | See Environment Act target delivery progress section. |
| 16 | By December 2030, double the number of farms providing sufficient year-round resources for farm wildlife, compared with 2025. (Environment Act interim target). | See Environment Act target delivery progress section. |
| 17 | At least 49% of Marine Protected Area (MPA) protected features are in favourable condition and at least 46% in recovering condition, by December 2030. (Environment Act interim target). | See Environment Act target delivery progress section. |
| 18 | Effectively conserve and manage 30% of the UK’s seas for nature by 2030. | We will be able to comment on progress against feature condition percentages at the next MPA network assessment in 2030. However, we can comment on the delivery of management measures. 181 MPAs designated in English waters including 3 Highly Protected Marine Areas (HMPAs), covering 40% of English waters. The UK Marine Protected Area network statistics has the latest data. Within the reporting period: • progressed work on the English MPA network review • JNCC and Natural England developed a HPMA monitoring strategy • worked with our delivery partners IFCA and MMO to implement management measures to support the delivery of effective MPA management |
Trends in the natural environment
We collect data for all indicator components within the EIF. However, to be able to provide a robust assessment, we require data over a number of years. For 22 of the Goal 1 components, we do not have data covering enough time to present a trend assessment. As we collect data in subsequent years, these assessments will be carried out. The trends are:
-
short term: 2 components showed improvement, 3 showed little or no change and 5 showed deterioration
-
medium term 4 components showed improvement, 1 showed little or no change and 5 showed deterioration
-
long term: 4 components showed improvement, and 6 showed deterioration
Figure 10 shows Environmental Indicator Framework indicator components corresponding to Goal 1. Further details can be found in Environmental Indicator Framework: Assessments - Goal 1: Restored nature.

Figure 10: Short, medium and long-term progress towards Goal 1 Restored nature, based on EIF indicators
Source: Environmental Indicator Framework: Assessments.
Evaluation updates
Table 3: Overview and status of relevant policy evaluations for Restored Nature goal.
| Evaluation | Status | Overview |
|---|---|---|
| Biodiversity Targets Evaluation Programme | Planned | The Biodiversity Targets Evaluation Programme is a Defra-led evaluation supporting delivery of the statutory Biodiversity Targets set out in the Environment Act 2021 and Environmental Improvement Plan 2025. It is being designed to take a long-term, adaptive approach, combining process, impact and value for money evaluation, where findings will be regularly fed back into delivery plans to support continuous improvement. |
| Nature Restoration Fund evaluation | Planned | Evaluation will be undertaken by Defra and Natural England, exploring impact, process and value for money. |
| Biodiversity Net Gain (BNG) evaluation | Ongoing | Evaluation of the 2023 to 2025 rollout reported that overall processes are in place and functioning effectively, although implementation is inconsistent in places due to variable capacity, capability, and interpretation. It is too early for robust impact assessment, though stakeholders view BNG as improving habitat preservation and compensation for habitat loss. |
| Nature for Climate Fund Tree Programme evaluation | Ongoing | The 3-stage evaluation (2022 to 2026) includes process, impact, and value-for-money components, as well as a series of deep dives into specific elements of programme delivery. The final phase is underway, and reporting is expected later in 2026. Interim evaluation findings indicate that from a slow start, progress is being made to increase tree planting in England. The new Trees Programme will seek to address challenges identified such as economic viability, operational barriers to planting, data systems and reporting. |
Goal 2: Air
Our vision for this goal is to achieve clean air. We are delivering this through commitments and actions, including meeting emissions‑reduction targets across key pollutants, improving local air quality standards and communication of air quality information. The full list of interim and statutory Environment Act targets for the Air goal can be found at Annex 2.
Goal delivery summary
Over the reporting year, progress had been made on the commitments and 33 supporting actions that contribute to delivery of this goal. As of March 2026, 3% of actions have been completed, with 88% in progress, 6% not started but on track and 3% reported as being currently off track with work underway to maintain progress. Full details of the actions can be found in Annex 1.
Since April 2025, we have taken decisive action to deliver this goal. In particular, we have:
- launched a consultation to reform industrial and energy permitting for a future-ready framework (August 2025)
- expanded Air Quality Monitoring Networks (April 2025 to March 2026) with 21 new PM2.5 monitors to track statutory targets
- updated Daily Air Quality Index (DAQI) health advice to improve public understanding of short-term pollution risks (November 2025) and launched a new ‘Get Data’ service (August 2025)
- launched Zero Emission Truck Grant and the Depot Charging Scheme to support the decarbonisation of the UK heavy goods vehicle (HGV) fleet (March 2026)
- consulted on a new HGV emissions regulatory framework for the UK and will respond in due course (January to March 2026)
Progress has continued into the current reporting year with the publication of the new statutory local transport plan guidance for local transport authorities, setting out the government’s expectations for improving air quality as part of local transport planning (April 2026). We have also consulted on the introduction of new Euro 7 standards for road vehicles, based on internationally harmonised regulations to limit brake and tyre wear emissions (April 2026), and published the third Cycling and Walking Investment Strategy (June 2026).
Environment Act target delivery progress
There are 2 statutory and 2 interim Environment Act targets contributing to delivery of the Air goal. Progress towards each target is set out below.
Commitment 21: Deliver air quality targets for PM2.5 concentration and exposure:
a) an annual mean concentration target of 10 micrograms per cubic metre (µg per m3) to be achieved by December 2030 (Environment Act interim target).
b) a population exposure reduction target of 30% compared to 2018 to be achieved by December 2030 (Environment Act interim target).
These interim targets are reported on together with the statutory Environment Act targets:
- by 31 December 2040 the maximum annual mean level of PM2.5 in ambient air must be equal to or less than 10 µg per 3(annual mean concentration target (AMCT))
- to achieve at least a 35% reduction in population exposure to PM2.5 by 31 December 2040 compared to 2018 levels (population exposure reduction target (PERT))
These targets are delivered through a range of measures designed to reduce emissions from major sources of PM2.5, as set out in Air quality Environment Act target delivery plan.
Annual mean concentration target
The statutory and interim target are reported together as they use the same monitoring mechanism. The assessment focuses on the EIP25 interim target.
Progress update
To support the measurement of the Annual Mean Concentration Target (AMCT), the monitoring network is being expanded. Over the past year (April 2025 to March 2026) 21 new PM2.5 monitors have been added to the network, all of which will report against the AMCT. The AMCT is assessed by using monitoring sites that have been located in all site locations across England. This will include sites in both rural and urban areas and those likely to have the highest concentrations.
What the data show
Figure 11 shows a decrease in the PM2.5 concentrations measured at individual monitoring sites over the time series. The majority of established monitoring sites now measure below 10 µg per m3and the maximum measured concentration in 2025 was 12 µg per m3. This is slightly higher than in 2024 (11 µg per m3), most likely due to the weather conditions in spring 2025. The AMCT is more influenced by annual variation than the Population Exposure Reduction Target (PERT). Although good progress has been made, concentrations can go up as well as down, for example due to weather conditions.
Until the final monitoring network is in place in late 2027 it is not possible to fully assess if the interim target would be met. The current trend suggests good progress is being made towards the 2030 interim target. However, our modelling indicates that there is a significant degree of uncertainty associated with achieving the targets and this is discussed further in the Air Quality delivery plan.
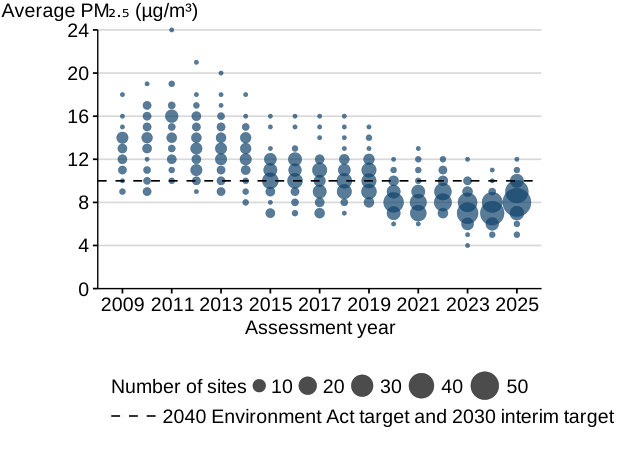
Figure 11: Progress towards PM2.5 annual mean concentration target
Source: Air quality statistics.
Figure 11 shows the average PM2.5 concentration measured at individual monitoring sites from 2009 to 2025. There is a decrease in measurements at all sites over time and a narrowing in the range of concentrations. The graph shows that in 2025 the majority of monitoring sites measured below the interim target value (10 µg per m3), and the maximum measured concentration was 12 µg per m3.
Population Exposure Reduction Target (PERT)
The statutory and interim target are discussed together as they use the same monitoring mechanism. The assessment focuses on the EIP25 interim target.
Progress update
To support the measurement of the Population Exposure Reduction Target (PERT), an expansion of the monitoring network is underway. Over the past year (April 2025 to March 2026), 21 new PM2.5 monitors have been added to the network, 13 of which are PERT sites. The PERT is assessed by using monitoring sites that are in urban background and suburban background locations across England. The expansion is set to continue over the next 2 years to ensure the minimum sampling requirements specified in the legislation are met.
What the data show
Figure 12 shows that population exposure has reduced over time, with large improvements from 2020. The substantial progress made towards the PERT is reflected in the more ambitious interim target set in the EIP25 compared to EIP23.
The reduction in population exposure compared to 2018 is 26%, in comparison to 25% in 2024. As the metric is a 3-year average, recent annual reductions have been impacted by the large step change in concentrations seen in 2020 to 2021. The 2025 trend is a return to a more gradual reduction. Concentrations were also impacted by adverse spring weather conditions in 2025.
Whilst good progress has been made, concentrations may go up as well as down. In addition, localised factors can have significant effects on individual site concentrations, meaning that until the final monitoring network is in place in 2027 it is not possible to fully assess if the interim target will be met. The current trend suggests good progress is being made towards the 2030 interim target.
However, our modelling indicates that there is a significant degree of uncertainty associated with achieving the targets and this is discussed further in the Air Quality delivery plan.
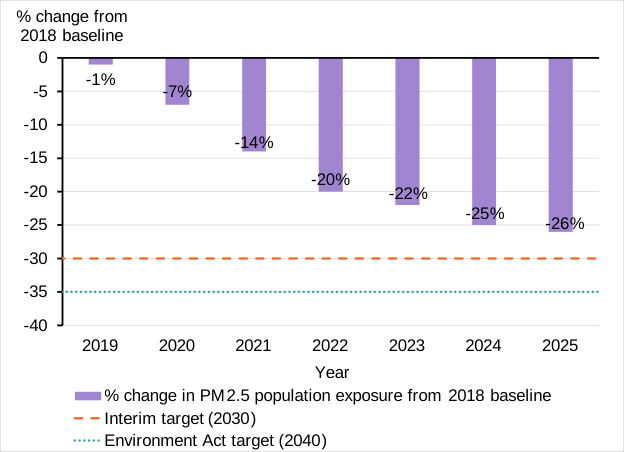
Figure 12: Change in PM2.5 population exposure compared to a 2018 baseline
Source: Air quality statistics.
Figure 12 shows the cumulated percentage change in PM2.5 population exposure compared to 2018 for years 2019 to 2025. The figure shows a consistent decrease in population exposure, with 2025 data showing a 26% reduction in exposure since 2018.
Commitment delivery progress
We are taking coordinated and measurable action to achieve clean air.
Table 4: sets out delivery and measurement of progress against EIP25 commitments for the Air goal between April 2025 to March 2026.
| Reference | Commitment | Progress update |
|---|---|---|
| 19 | Deliver 2030 emissions targets to reduce anthropogenic emissions for the following pollutants against a 2005 baseline level: • ammonia (NH3) 16% reduction • nitrogen oxides (NOx) 73% reduction (This is a correction to EIP25: from NO2 to NOx) • sulphur dioxide (SO2) 88% reduction • particulate matter (PM2.5) 46% reduction • non-methane volatile organic compounds (NMVOCs) 39% reduction |
Environmental Indicator Framework Theme A: Air (up to the year 2023) show that emissions of air pollutants for which we have reduction targets reduced in England since 2005, with emissions of: • ammonia down 8% • nitrogen oxides down 67% • sulphur dioxide down 88% • fine particulate matter down 46% • non-methane volatile organic compounds down 45% The commitment targets apply to the whole UK and not just England. Current projections (published in March 2026) suggest that we will be compliant in the UK with 2030 emissions reduction commitments for all air pollutants. However, for ammonia this is only achieved with the inclusion of an approved technical adjustment. Government is taking forward the actions set out in the EIP clean air chapter which will continue to reduce emissions of the 5 key air pollutants. |
| 20 | Deliver air pollution levels set out in the Air Quality Standards Regulations in local areas. | In 2024, England was compliant with most concentrations targets but our UK-wide air quality assessment showed there were persistent NO 2 annual mean exceedances in 5 reporting zones, and local data shows some additional local NO 2 hotspots remain. Defra and DfT have worked with, and funded, local authorities to target local NO 2 exceedances and put measures in place to address remaining NO 2 exceedances. The NO 2 programme has supported development and implementation of a wide range of measures across Local Authorities including: • Clean Air Zones • support for zero emission buses • vehicle upgrade grant schemes • traffic management and signal improvements • active travel, cycling and walking schemes and improvements, and behavioural campaigns The NO 2 Programme formally closed on 31 March 2026, with remaining work transitioning to business-as-usual activity in teams in Defra and DfT, who continue to work with Local Authorities to address NO 2 . We are taking forward the actions set out in the EIP clean air chapter which are in progress and will continue to reduce emissions and concentrations of air pollutants. The A5 indicator in the EIF shows trends against this commitment. |
| 21 | Deliver air quality targets for PM2.5 concentration and exposure: a. an annual mean concentration target of 10 micrograms per cubic metre (µg per m 3) to be achieved by December 2030 (Environment Act interim target). b. a population exposure reduction target of 30% compared to 2018 to be achieved by December 2030 (Environment Act interim target). |
See Environment Act target delivery progress section. |
| 22 | Improve communication of air quality information. | Government makes a wide range of air quality information available. With the support of the UK Health Security Agency, Defra conducted a review of air quality information and communications, with recommendations published in 2025: Report: Air Quality Information System Review: Final Report and Recommendations. Implementation has started, by updating the Daily Air Quality Index, which provides the public with current pollution levels, 5-day forecasts, and health advice and developing a new alert system, allowing people to sign up for notifications when air pollution is forecasted or measured high in their area. Defra has also modernised how air quality data is shared through a new Defra UK Air GOV.UK page. |
Trends in the natural environment
We collect data for all indicator components within the EIF. However, to provide a robust assessment, we require data over a number of years. For 1 component, we do not have data covering enough time to present a medium- or long-term trend assessment. As we collect data in subsequent years, these assessments will be carried out. The majority of EIF air quality indicators are improving. The trends are:
-
short term: 9 components showed improvement, 1 showed little or no change and 1 showed deterioration
-
medium term 7 components showed improvement, 2 showed little or no change and 1 showed deterioration
-
long term: 8 components showed improvement, 1 showed little or no change and 1 showed deterioration
Figure 13 shows the proportion of assessable indicator components corresponding to Goal 2. Further details can be found in Goal 2: Air (summary)Environmental Indicator Framework: Assessments - Goal 2: Air.

Figure 13: Short, medium and long-term progress towards Goal 2 Air, based on EIF indicators
Source: Environmental Indicator Framework: Assessments.
Goal 3: Water
Our vision for this goal is to ensure English waters are clean, resilient and plentiful. We are delivering this through commitments and actions, including reform of the water sector, reducing pollution, driving investment in infrastructure and strengthening regulation and accountability of water companies. The full list of interim and statutory Environment Act targets for the Water goal can be found at Annex 2.
Goal delivery summary
Over the reporting year, progress had been made on the commitments and 49 supporting actions that contribute to delivery of this goal. As of March 2026, 8% of actions have been completed, with 90% in progress, and 2% reported as being not started but on track. Full details of the actions can be found in Annex 1.
Since April 2025, we have taken decisive action to deliver this goal. In particular, we have:
- introduced stronger enforcement measures to hold water companies obstructing investigations to account, including potential prison sentences for executives (April 2025)
- launched a record 81 criminal investigations into water companies as part of a strengthened crackdown on environmental breaches (May 2025)
- announced plan to deliver new reservoir infrastructure to secure long-term water supply (May 2025)
- introduced new legislation to ban unfair bonuses at water companies (June 2025)
- introduced new standards to improve drainage systems and tackle pollution in communities across England (June 2025)
- published the Independent Water Commission’s (IWC) final report setting out its recommendations to improve the water regulatory system in England and Wales (July 2025)
- announced the winners of the Water Restoration Fund, funded from water company fines – with 51 projects now delivering environmental improvements in communities (October 2025)
- announced that 87% of bathing waters were rated excellent or good as new reforms came into force (November 2025)
- responded to IWC’s report through a Water White Paper, setting out once-in-a-generation reforms to secure a fair deal for customers, investors and the environment, and to rebuild trust in the system (January 2026)
Alongside this, in April 2025 water companies began delivery of their PR24 business plans under Asset Management Period 8 (AMP8). This includes a four-fold increase in investment to clean up our rivers, lakes and seas, and ensure resilient, reliable, safe supply of water into the future.
Environment Act target delivery progress
There are 4 statutory and 8 interim Environment Act targets contributing to delivery of the Water goal. Progress towards each target is set out below.
Commitment 25: Reduce phosphorus loadings from treated wastewater by 55% by December 2030 against a 2020 baseline (Environment Act interim target).
This interim target is reported on together with the statutory Environment Act target:
- to reduce phosphorus loadings from treated wastewater by 80% by 31 December 2038, against a 2020 baseline
The target is delivered through wastewater treatment improvement schemes and permitting regime as set out in Wastewater Environment Act target delivery plan. Progress towards the statutory target is measured using the same metrics as the interim target.
Progress update
Progress towards the target is assessed by tracking the number of schemes that are delivered or planned within each 5‑year investment cycle, known as Asset Management Plan (AMP) periods. These schemes involve upgrading or adding wastewater treatment processes to reduce phosphorus levels in treated effluent before it is discharged into freshwater bodies.
This approach provides a proxy measure of progress, reflecting the water industry’s increasing capacity to reduce total phosphorus loads from treated wastewater in England. Most phosphorus removal schemes planned for Asset Management Period 7 (AMP7; 2020 to 2025) have been delivered as expected. Although a small number have not yet been completed, both interim and long-term wastewater targets remain on track.
The schemes that have not been delivered are limited in number and are not indicative of a wider pattern of delivery issues across the water industry. As such, the current level of non-delivery is not considered to pose a significant risk to achieving the targets. The Environment Agency expects all water companies to meet deadlines set out in the Water Industry Natural Environment Programme (WINEP) and is varying permits in line with the deadlines set out in this. The Environment Agency will monitor compliance against the permits and regulate in line with their Enforcement and Sanctions Policy.
What the data show
In last year’s annual progress report, the data showed that 783 phosphorus improvement schemes were planned for the 2024 to 2025 financial year, of which 652 were delivered on schedule. Table 5 shows the latest position for the remaining 131 schemes, including those that have since been delivered, rescheduled or remain undelivered.
The table is based on the same May 2025 dataset used in last year’s report to ensure consistency with previously reported figures. An updated dataset shows some minor differences from the earlier version; however, these do not materially affect the overall assessment of progress.
Defra and the Environment Agency are working to improve the underlying data and develop a metric for formally reporting total phosphorus loadings in future. This will enable like-for-like comparisons across years and provide a more robust measure of progress towards the Environment Act interim target.
Table 5: Update on 131 phosphorus improvement schemes which remained from the 2024-25 scheduled schemes.
| Sign off Status | 2024 to 2025 | 2025 to 2026 | 2026 to 2027 | 2027 to 2028 | Total |
|---|---|---|---|---|---|
| Rescheduled | 0 | 0 | 35 | 2 | 37 |
| Not Delivered | 53 | 0 | 0 | 0 | 53 |
| Delivered | 30 | 11 | 0 | 0 | 41 |
| Total | 83 | 11 | 35 | 2 | 131 |
Source: Environment Agency.
The data in Table 6 show the number of phosphorus reduction schemes included in AMP8 (2025 to 2030).
33 AMP8 phosphorus schemes were due for delivery in the 2025 to 2026 financial year, of which 32 have been delivered.
906 phosphorus schemes in total are currently planned as part of AMP8, 837 of which are due for delivery in 2029 to 2030. The reason for this uneven delivery profiling is that water companies typically plan to complete their agreed water infrastructure upgrades in the final year of the AMP. A minority of schemes are completed in other years, where agreed between water companies and regulators. The specific details of these plans are agreed within the WINEP planning framework. The number of schemes planned during the AMP8 period may change due to alterations across the WINEP.
Table 6: Number of phosphorus improvement schemes planned and completed during AMP8.
| Year | 2025 to 2026 | 2026 to 2027 | 2027 to 2028 | 2028 to 2029 | 2029 to 2030 | 2030 to 2031 | Total |
|---|---|---|---|---|---|---|---|
| Schemes planned | 33 | 3 | 10 | 1 | 837 | 22 | 906 |
| Schemes completed | 32 | To be confirmed | To be confirmed | To be confirmed | To be confirmed | To be confirmed | 32 |
Source: Environment Agency.
Commitment 26: Reduce total nitrogen, phosphorus and sediment pollution from agriculture to the water environment by at least 12% by December 2030, compared to 2018 levels and by at least 18% in catchments containing protected sites in unfavourable condition due to nutrient pollution by December 2030 (Environment Act interim target).
This interim target is reported on together with the statutory Environment Act target:
- to reduce total nitrogen, total phosphorus and sediment pollution from agriculture into the water environment by at least 40% by 2038, compared to a 2018 baseline. (Environment Act target)
The target is delivered through 4 pillars of delivery (regulatory compliance, voluntary scheme uptake, land use change and innovation) as set out in Agriculture water quality Environment Act target delivery plan.
Progress update
Delivery of this commitment is at an early but foundational stage. A programme of work has been established to bring together the disparate regulatory, advisory, grant and innovation workstreams across Defra Group and its arm’s length bodies that contribute to reducing agricultural pollution.
Increasing compliance with regulations is a ‘foundation’ to achieving the EIP25 targets for agricultural water quality. The Environment Agency’s farm inspection programme is critical to raising compliance, and 2025 to 2026 illustrates the programme’s impact in bringing farms into compliance. As we double the inspection programme’s funding over the coming 3 years, we anticipate an accelerated improvement in compliance. Inspection and enforcement sit alongside advice to farmers, including through the Catchment Sensitive Farming programme.
Through the Addressing Pollution from Agriculture programme, we are working with farming representatives, environmental groups and other sectors to ensure reforms are fit-for-purpose. We will consult in due course on new regulations, including proposals to strengthen standards and address multiple forms of pollution, such as water, air and soil - through a streamlined approach that minimises the burden on farming businesses.
In delivering against voluntary scheme uptake and land use change, we will spend £2 billion a year by the end of the spending period on Environmental Land Management schemes, optimised for water outcomes, alongside other nature and environmental outcomes. This will be alongside other delivery measures, for example, future contributions from private investment in nature and carbon schemes. The Land Use Framework England was published in March 2026. It set out the importance of land management for water quality and set out our intention for policy changes, including spatial targeting of some public payments, that would help to improve water quality outcomes.
We will also support innovations and technology to improve farm practices, especially the use of nutrients and farming inputs. This includes optimising agro-economic benefits of the nutrient circular economy, which we have supported through the launch of a free-to-use nutrient management planning tool to help farmers and land managers plan and manage the use of nutrients on their land (see Action 116).
This year we have run a further round of the Farming Equipment and Technology Fund, including a dedicated slurry management theme with a provision budget value of £10 million. We have awarded grant agreements to around 900 successful applicants to this slurry theme.
Through the Farming Innovation Programme (FIP), Defra launched a £15million research round in 2024 that focussed on nutrient management. This funds 29 research projects, running to 2028, to develop ideas and technology enabling farmers to manage their inputs and reduce environmental risk more effectively. For example, the SMART Fast‑Tracking On‑Farm Land Management project is testing real‑time nitrogen monitoring on commercial farms, using soil sensors to inform fertiliser decisions, reduce over‑application, lower input costs, and cut nutrient loss risks while maintaining yields. Further funding of £123 million has been announced for FIP projects in this financial year.
A programme of field and laboratory trials on bio stimulants aims to increase understanding of the most appropriate method for the safe and effective use of plant bio stimulant products in the UK, including exploring the environmental impacts. Results are expected at the end of 2026.
While the evidence programme is developed and delivered, proxy measures will be used to monitor progress against the target, as direct measurement of diffuse pollution outcomes is limited by monitoring constraints and time lags in nutrient and sediment movement. A programme of evidence work has been designed and is underway. This will look to improve our understanding of the real-world improvements our interventions are making. Over time, this will move us away from over-reliance on proxy measures, though these remain an important indicator of the broader environmental impact of our interventions. Credible assessment requires a modelling-led framework, underpinned by monitoring, because diffuse agricultural pollution cannot be robustly attributed or tracked using monitoring alone. The approach will likely include a combination of real-world data collected through monitoring and improved modelling, to understand where we have driven change and areas that require further intervention.
Strengthening the evidence base and enhancing our monitoring and modelling capabilities will improve our ability to robustly report against the interim and long-term targets.
If progress towards the targets is insufficient, we will consider further measures to drive the improvements in tackling water pollution that are needed. This may include further strengthening of compliance and standards.
What the data show
At this stage, there is no single quantified metric demonstrating progress against the headline percentage reduction targets. Progress is currently assessed through a suite of developing indicators and proxy measures. Taken together, these indicators provide a growing picture of progress in the systems, behaviours and management practices that underpin long‑term reductions in agricultural pollution.
Overall, delivery activity continues across regulation, advice, investment and innovation, demonstrating good engagement with the agricultural sector. Catchment Sensitive Farming (CSF) has supported the delivery of around 100,000 on‑farm actions to reduce agricultural pollution since 2006, contributing to measurable improvements in water quality. Evidence shows sustained advice is also associated with a reduction in water pollution incidents.
In 2025 to 2026, Environment Agency farm inspection activity exceeded targets at Quarter 3 (see the Environment Agency corporate scorecard 2025 to 2026 - quarter 3), Investment in slurry management and growing uptake of nutrient planning tools are strengthening on-farm capability.
Innovation is also supporting more precise nutrient use. For example, the SMART Fast‑Tracking On‑Farm Land Management project is testing real‑time nitrogen monitoring on commercial farms, using soil sensors to inform fertiliser decisions, reduce over‑application, lower input costs, and cut nutrient loss risks while maintaining yields.
However, the Environment Agency’s Agriculture and the water environment: 2026 report shows that in 2025 to 2026, farming remained a significant cause of pollution incidents affecting water bodies through diffuse pollution and caused 48 Category 1 and 2 pollution incidents (having a major or significant detrimental impact on water bodies).
The number of reported major and significant incidents linked to farming declined slightly compared with the previous year. The report also elicits that there were 12 prosecutions for farming pollution incidents determined in the 2025 to 2026 fiscal year.
From a nutrient loading perspective, Soil Nutrient Balance and fertiliser use indicators show that whilst there is a trend for marginally declining nutrient inputs up to 2024, the surplus entering soils remains broadly unchanged; with continued nitrogen and phosphorus surpluses and no clear sustained downward trend at national level.
In 2024, the overall balances of nitrogen and phosphorus were 86.3 kilograms per hectare and 2.3 kilograms per hectare respectively.
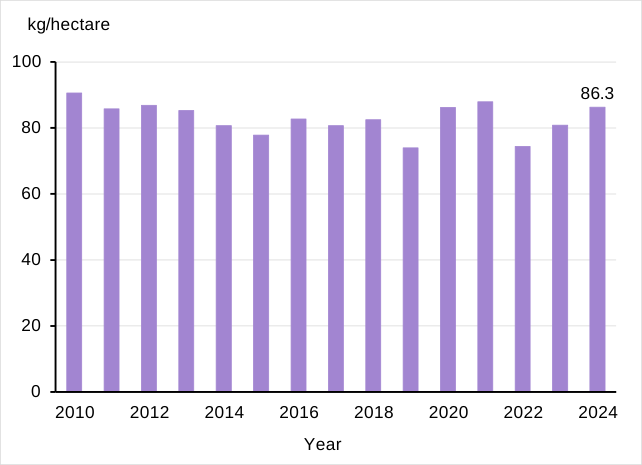
Figure 14: Nitrogen soil nutrient balances
Source: Soil nutrient balances England, 2024 - statistics notice.
Figure 14 shows the overall balance of nitrogen in soils in England between 2010 and 2024. This is calculated by total inputs (such as manures and fertilisers) minus total offtakes (crop production and fodder for livestock, such as grazing). The figure shows fluctuation in nitrogen balance over the period, with no clear long-term trend. In the most recent reported year (2024), the balance increased to 86.3kg per hectare from 80.8kg per hectare in 2023. This chart reflects a proxy measure for the interim target; hence a target value is not included in this figure.
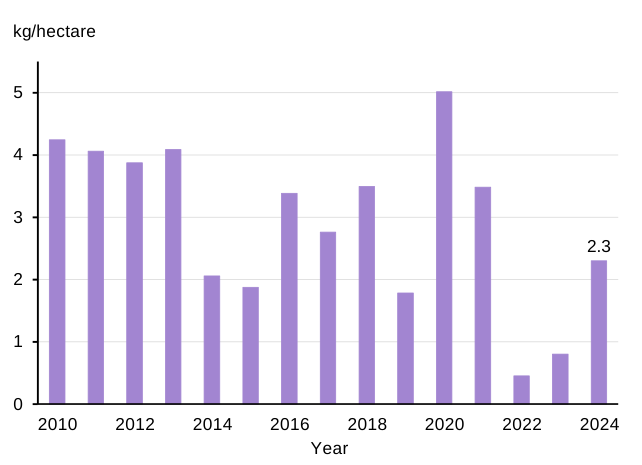
Figure 15: Phosphorus soil nutrient balances
Source: Soil nutrient balances England, 2024 - statistics notice.
Figure 15 shows the overall balance of phosphorus in soils in England between 2010 and 2024. This is calculated by total inputs (such as manures, fertilisers) minus total offtakes (crop production and fodder for livestock, such as grazing). The figure shows fluctuation in phosphorus balance over the period, with no clear long-term trend. In the most recent reported year (2024), the balance increased to 2.3kg per hectare from 0.8 kg in 2023. This chart reflects a proxy measure for the interim target; hence a target value is not included in this figure.
Commitment 27: Construct 8 mine water treatment schemes and 20 diffuse interventions to control inputs of target substances to rivers, and complete 55 catchment studies by December 2030 (Environment Act interim target).
This interim target is reported on together with the statutory Environment Act target to:
- to halve the length of rivers polluted by harmful metals from abandoned metal mines by 2038, against a baseline of 1,491 kilometres
The target is delivered through mine water treatment schemes as set out in Water and abandoned metal mines Environment Act target delivery plan.
The interim target uses action-based metrics instead of an output (kms) metric, as used for the statutory target, to ensure mine water treatment schemes and diffuse interventions are being completed at the rate necessary to achieve the statutory target.
Progress update
Two of the required interim metrics (Mine Water Treatment Schemes (MWTS) and Catchment Studies (CS)) are in progress. One of the interim target metrics (diffuse interventions (DI)) has been delivered in full before its due date.
What the data show
In 2025 to 2026, 2 of the required 8 mine water treatment schemes are constructed and operational. All 20 of the required 20 diffuse interventions have been delivered, and 5 of the required 55 catchment studies are completed. The illustrative trajectory in the Water and abandoned metal mines Environment Act target delivery plan shows the number of catchment studies ramping up in future years. The delivery plan indicates the planned delivery of these studies until 2030.

Figure 16: Interim target metrics, current progress and 2030 target values (Mine water treatment schemes, diffuse interventions and catchment studies)
Source: Data from Environment Agency and Mining Remediation Authority.
Figure 16 shows the number of MWTS and DI we have constructed since EIP23, and the number of CS completed since EIP25 as part of the interim target. The figure shows that the DI target has already been achieved, while the MWTS and CS figures remain below the 2030 target values.
Environment Act target: Halve the length of rivers polluted by harmful metals from abandoned metal mines by 2038, against a baseline of 1,491 kilometres (Environment Act target).
Progress update
We are working with delivery partners to find policy solutions to achieving the statutory target in rivers where it is technically infeasible to decrease metal concentrations to the Environmental Quality Standards (EQS) levels required by the statutory target. This can be due to the mineralised underlying geology of these areas and/or the water bodies being heavily modified.
We are also working with our delivery partners to review options for reporting progress towards the statutory target as a result of remediation measures being constructed.
What the data show
After MWTSs and DIs are constructed, water quality improvements are evaluated. Monitoring can take 15 to 24 months. There are no values currently available for progress towards the statutory target and length of rivers improved. When data becomes available, it will confirm the kilometres of river improved, following the installation of remediation measures in those rivers. This will reflect a reduction in metal mine pollution in those rivers.
Commitment 30: Reduce the use of public water supply in England per head of population by 9% by 31 March 2027 and 14% by 31 March 2032, from a 2019 to 2020 baseline (Environment Act interim target).
This interim target is reported on together with the statutory Environment Act target to:
- reduce the use of public water supply in England per head of population by 20% by 2038 from a 2019 to 2020 baseline (Environment Act target)
The target is delivered through measures on water efficiency and action by water companies to reduce leakage as set out in Water demand Environment Act target delivery plan. Progress towards the statutory target is measured using the same metrics as the interim target.
Progress update
Monitoring of progress against this target is ongoing. The next formal update will be published as part of the Environment Agency’s Annual Review of Water Resource Management Plans (WRMP) expected in Autumn. Based on most recent available results, the trajectory shows it may be challenging to meet the interim target. Defra and regulators are continuing to quality assure the underlying data before confirming our latest position in the next WRMP Annual Review.
Defra continues to work closely with the Environment Agency, Ofwat and the water industry to improve monitoring and reporting on this target , including improving risk identification and mitigations. The recent Water White Paper sets out new interventions, including accelerated smart meter rollouts, enabling water reuse through the planning system, and the Government’s wider ambition to go further to help to reduce demand.
Water companies are aiming to deliver approximately 10.4 million smart meters by 2030, the largest rollout to date. This will increase coverage to 50% for households and businesses (from 12% households and 9% non-households in 2024 to 2025). We are committed to removing barriers to further accelerate smart meter rollouts which will play a critical role in achieving reductions by using near-real time data to identify and respond to water loss from leaks more quickly and accurately.
What the data show
The latest WRMP Annual Review from the Environment Agency provided a progress update on the target. We expect reporting on years 2025 to 2026 to be published in the Autumn this year.
As of 2024 to 2025, public water supply per person in England had decreased by 5.1% compared to a 2019 to 2020 baseline.

Figure 17: Change in public water supply in England per head of population compared to a 2019 to 2020 baseline
Source: Water resources 2024 to 2025: analysis of the water industry’s annual water resources performance.
Figure 17 shows the percentage change in public water supply per person in England compared to a 2019 to 2020 baseline figure from 2020 to 2021 to 2024 to 2025. Public water supply per person has been below the baseline in the most recent 4 reporting years. In the latest reported year (2024 to 2025), public water supply per person in England had decreased by 5.1% compared to a 2019 to 2020 baseline. The figure shows that the interim target values (for 2027 and 2032) and the Environment Act target value (for 2038) have not yet been reached.
Commitment 33: Reduce leakage by 20% by 31 March 2027 and by 30% by 31 March 2032, from a 2017 to 2018 baseline (Environment Act interim target).
This interim target is reported on together with the statutory Environment Act target to:
- reduce the use of public water supply in England per head of population by 20% by 2038 from a 2019 to 2020 baseline.
The target is delivered through measures on water efficiency and action by water companies to reduce leakage as set out in Water demand Environment Act target delivery plan. Progress towards the statutory target is measured using the same metrics as the interim target.
Progress update
Responsibility for leakage reduction sits with water companies. They previously made a public interest commitment to halve leakage by 2050; with both the water demand target and the interim target created to align with this. Water companies set out how they will reduce leakage in their 5-yearly WRMPs. Progress on their projected leakage reduction is then monitored as part of the Environment Agency’s Annual Review process
Our recent Water White Paper set out a series of commitments including enabling the rollout of smart metering. We are working with Ofwat to ensure that customers can realise the leakage reduction benefits offered by smart metering and will provide an update on progress around this as part of the Environment Agency’s WRMP Annual Review.
Read the Water resources 2024 to 2025: analysis of the water industry’s annual water resources performance for further information.
What the data show
As of 2024 to 2025, leakage has reduced by 12.4% from the 2017 to 2018 baseline showing some progress but risks to interim leakage targets remain.
We report progress against the EIP interim leakage targets as a percentage reduction from the 2017 to 2018 baseline. We are using the Environment Agency baseline for this calculation because it provides a stable basis for year‑on‑year comparison in the annual progress report. Ofwat’s leakage baseline can be revised over time as companies restate data, following data collection improvements, which can change the calculated percentage reduction and reduce comparability with future reporting. As a result, historic progress report percentage figures may differ from the series shown here, where a different baseline was previously used.
National leakage decreased by 12.4% in 2024 to 2025 compared with the 2017 to 2018 Environment Agency baseline. Our targets are a 20% reduction by 2026 to 2027 and 30% by 2031 to 2032. The current asset management period (AMP8) includes £720 million investment Ofwat price review in smart technology including metering which will assist in identifying and reducing leakage. While progress towards interim targets is not yet fully on track, we are taking decisive steps to address barriers, accelerate smart meter rollout, and strengthen water company delivery so that we can achieve further reductions and return to the expected target trajectory.

Figure 18: Change in water leakage levels compared to a 2017 to 2018 baseline
Source: Environmental Indicator Framework: E8a: Water leakage in England, 2005 to 2006 to 2024 to 2025.
Figure 18 shows the change in water leakage levels, based on a 2017 to 2018 baseline figure from 2020 to 2021 to 2024 to 2025. In all years shown in the figure, leakage is below the baseline, indicating a reduction since 2017 to 2018. In the most recently reported year (2024 to 2025) leakage was 12.4% lower than the 2017 to 2018 baseline.
Figure 18 shows the change in water leakage levels, based on a 2017 to 2018 baseline figure from 2020 to 2021 to 2024 to 2025. In all years shown in the figure, leakage is below the baseline, indicating a reduction since 2017 to 2018. In the most recently reported year (2024 to 2025) leakage was 12.4% lower than the 2017 to 2018 baseline. The figure shows that the interim target values (for 2027 and 2032) have not yet been reached. Note: due to changes in how this progress against this target is monitored (see above) historic progress report percentage figures may differ from the series shown here, where a different baseline was previously used.
Commitment delivery progress
We are taking coordinated and measurable action to ensure English waters are clean, resilient and plentiful.
Table 7: sets out delivery and measurement of progress against EIP25 commitments for the Water goal between April 2025 to March 2026.
| Reference | Commitment | Progress update |
|---|---|---|
| 23 | Support catchment partnerships as a framework for coordinating action between the public, private and third sectors. | Doubled funding for catchment partnerships, giving them an additional £1.7 million per year over the next 2 years, and published the Water White Paper. Published annual Catchment Based Approach (CaBA) Benefits report covering 2024 to 2025. The government is working closely with catchment partnerships to ensure that they are fully incorporated into the new system of regional planning under design. |
| 24 | Require standardised sustainable drainage systems (SuDS) in all new developments with drainage impacts and ensure sustainable maintenance arrangements are in place by 2029. | Published a new National Standards for SuDS in June 2025. The proposed National Planning Policy Framework (NPPF), due to be published Summer 2026, makes a clear reference to the standards. (See Action 92 and 93 for further details). |
| 25 | Reduce phosphorus loadings from treated wastewater by 55% by December 2030 against a 2020 baseline. (Environment Act interim target) | See Environment Act target delivery progress section. |
| 26 | Reduce total nitrogen, phosphorus and sediment pollution from agriculture to the water environment by at least 12% by December 2030, compared to 2018 levels and by at least 18% in catchments containing protected sites in unfavourable condition due to nutrient pollution by December 2030. (Environment Act interim target) | See Environment Act target delivery progress section. |
| 27 | Construct 8 mine water treatment schemes and 20 diffuse interventions to control inputs of target substances to rivers, and complete 55 catchment studies by December 2030. (Environment Act interim target) | See Environment Act target delivery progress section. |
| 28 | Restore chalk streams to better ecological health, ensuring protections and investment towards these habitats. | Under the Price Review 2024 (PR24) framework, water companies in England will invest £2 billion over the 2025 to 2030 period specifically earmarked for chalk stream restoration and protection. Monitoring and delivery progress can be found in the 2025 progress report on the storm overflows discharge plan (SODRP) ‘Ecological Target’ section. We are also ensuring chalk streams feature prominently across our wider water reforms as part of our Water White Paper commitment. We are investing £1.8 million through the Water Restoration Fund and Water Environment Improvement Fund for locally led chalk stream clean-up projects across affected regions. |
| 29 | Drive further investment to improve the water environment. | Under the PR24 water companies will invest £24 billion to improve the water environment: reducing pollution, reducing harm from storm overflows, improving river water quality, and increasing biodiversity. Announced that we are reinvesting £29 million from water company fines into local projects which clean up our environment over the next 2 years. This includes the first down-payment of the Thames Water fine which forms part of the commitment, alongside other environmental fines received since October 2023. |
| 30 | Reduce the use of public water supply in England per head of population by 9% by 31 March 2027 and 14% by 31 March 2032, from a 2019 to 2020 baseline (Environment Act interim target). | See Environment Act target delivery progress section. |
| 31 | Reduce household water use to 122 litres per person per day by 2038 from a 2019 to 2020 baseline. | 2024 to 2025 Average household per capita consumption was 136.5 litres per person per day, continuing the overall downward trend. The trajectory remains on track for the statutory target, with the latest planned savings from water company leakage reduction and metering measures Water resources 2024 to 2025: analysis of the water industry’s annual water resources performance. (See also Action 116). |
| 32 | Reduce non-household water use by 9% by 2038. | In 2024 to 2025, non-household water use shows a reduction of 3.15% since 2019 to 2020, showing we are on track to meeting 9% by 2038. Further work on how we achieve this target is being explored through water reuse in the upcoming Water reform bill and through working with government estates to ensure our facilities are becoming more water efficient where possible. |
| 33 | Reduce leakage by 20% by 31 March 2027 and by 30% by 31 March 2032, from a 2017 to 2018 baseline. (Environment Act interim target) | See Environment Act target delivery progress section. |
| 34 | Ensure water companies deliver their water resources management plans, eliminating the water supply demand gap that grows to 5 billion litres a day by 2050. | On track overall given plans recently launched, but risks are emerging with supply scheme delivery and faster progress needed on leakage and household consumption reduction. See Environment Agency’s summary of progress for further details and joint regulatory letters to water companies. |
| 35 | Modernise the abstraction licensing system, including moving it into the Environmental Permitting Regulations (EPR). The government is considering the recommendations of the IWC. | The Water White Paper recommitted our intention to move abstraction and impoundment regulation into the Environmental Permitting Regulations to improve how we use water resources this is likely to be following the passage of the Clean Water Bill. |
| 36 | Support the agricultural sector in ensuring collaborative sustainable water use, through enabling an increase in the number of water abstractor groups from 7 to 14 by 2030. | The number of water abstractor groups (WAGs) has increased to 14, meeting this commitment. A further 3 are expected in 2026 to 2027. |
| 37 | Reduce the impact of storm overflows on the environment and human health by reducing spill numbers and prioritising sensitive sites, in line with the SODRP. | Water companies are investing over £10 billion in PR24 to improve around 2,500 storm overflows in England. In line with the [SODRP]Storm overflows discharge reduction plan: progress report - GOV.UK, investment is being prioritised at overflows affecting the most sensitive sites for ecological and human health. The first progress report on the SODRP covers the first 3 years of the 28-year SODRP programme. This shows: • Ecological target: Improving - the number and percentage of storm overflows meeting the 10 or fewer threshold for spills into or near high priority sites has progressively increased each year, from 1,114 (22.6%) in 2022 to 2023 to 1,641 (33.7%) in 2024 to 2025, but still some way from full compliance • Public health target (2035): ‘Substantial progress required to be on track’ - performance has declined, with fewer overflows meeting the bathing water spill standards (down from 55.3% in 2022 to 44.8% in 2024) • Rainfall target (2050): Encouraging early progress - 27.6% of storm overflows spilled 10 times a year or less in 2022 to 2023, increasing to 42.9% in 2024 to 2025 The next progress report, due in 2030, will have the benefit of 5 more years of data and the impacts of PR24 investment, so should give a more definitive assessment of the SODRP’s effectiveness. |
| 38 | Review the regulatory framework for sewage sludge spreading to agricultural land to ensure it effectively manages the risks to the environment and health. | Consulted on options to reform regulatory framework for sludge use in agriculture (January to March 2026). Results are being analysed and we will set out our next steps in due course. We have been bringing together diverse stakeholders to review the current state of knowledge on contaminants in sludge, help identify key evidence gaps, and shape future research and development priorities. |
| 39 | Better understand the health impacts associated with polluted waters. | Analysis and a draft report of preliminary findings from 2 systematic reviews comprising the first phase of the Faecal-Oral transmission research project action is complete, and study proposals for the second phase of the research under consideration by DHSC. |
Trends in the natural environment
We collect data for all indicator components within the EIF. However, to provide a robust assessment, we require data over a number of years. We do not have data covering enough time to present a short-term trend assessment for 24 components, nor to present a medium- or long-term trend assessment for 23 components. As we collect data in subsequent years, these assessments will be carried out. The trends are:
- short term: 4 components showed improvement and 2 showed deterioration
- medium term: 3 components showed improvement, 1 showed little or no change and 3 showed deterioration
- long term: 6 components showed improvement, and 1 showed deterioration
Figure 19 shows the proportion of assessable indicator components corresponding to Goal 3. Further details can be found in Environmental Indicator Framework: Assessments - Goal 3: Water.

Figure 19: Short, medium and long-term progress towards Goal 3 Water, based on EIF indicators
Source:Environmental Indicator Framework: Assessments.
Evaluation updates
The planned Evaluation of the Water Restoration Fund is a theory-based evaluation which will utilise contribution analysis, primary research and cost-benefit analysis. It will assess impact, process and value for money. Final results are expected in 2028.
Goal 4: Chemicals and pesticides
Our vision for this goal is to minimise environmental risks from chemicals and pesticides. We are delivering this through commitments and actions, including robust regulation and management of chemicals and pesticides, promoting safer and more sustainable alternatives and meeting international obligations.
Goal delivery summary
Over the reporting year, progress had been made on the commitments and 20 supporting actions that contribute to delivery of this goal. As of March 2026, 15% of actions have been completed, with 85% in progress. Full details of the actions can be found in Annex 1.
Since April 2025, we have taken decisive action to deliver this goal. In particular, we have:
- reduced regulatory fees for the chemicals sector to support industry growth and competitiveness (April 2025)
- published a plan to address chemicals from pet treatments in UK waterways, strengthening protections for water quality and wildlife (July 2025)
- published the UK REACH restriction for lead in ammunition Decision Report, making clear Defra’s decision to ban the placing on the market and use of lead ammunition, with some limited exemptions (July 2025)
- introduced the Control of Mercury (Amendment) Regulations 2025 to restrict the manufacture, import and export of additional mercury added products in line with the requirements of the Minamata Convention on Mercury (December 2025)
- published the UK’s first-ever perfluoroalkyl and polyfluoroalkyl substances (PFAS) plan (February 2026)
Commitment delivery progress
We are taking coordinated and measurable action to minimise environmental risks from chemicals and pesticides.
Table 8: sets out delivery and measurement of progress against EIP25 commitments for the Chemicals and pesticides goal between April 2025 to March 2026.
| Reference | Commitment | Progress update |
|---|---|---|
| 40 | Reform UK Registration, Evaluation, Authorisation, and Restriction of Chemicals (REACH) to enable protections that address chemical pollution to be applied more quickly, efficiently and in a way that is more aligned with our closest trading partners, especially the EU, by December 2028. | Restrictions on lead ammunition implemented (April 2026) (see action 140). Reviewed the interim principles for additions to the UK REACH Candidate List of SVHCs (see action 144). We intend to make legislative changes by the end of 2028, at the latest. |
| 41 | Take action on PFAS through a new PFAS plan. | Published the PFAS Plan (February 2026). Review and reporting of this plan will become part of our EIP statutory reporting cycle. The plan sets out 49 actions underway, with governance structures being established to oversee delivery, including the use of Environment Agency registers. |
| 42 | Implement targets and obligations agreed through multilateral environmental agreements and other forums. | Brought into force the Control of Mercury (Amendment) Regulations 2025 in December 2025 prohibiting the manufacture, import and export of additional mercury added products, as agreed at COP 4 and COP 5 of the Minamata Convention. Consulted on draft legislation which includes provisions implementing updates to the Stockholm Convention on Persistent Organic Pollutants (POPs) (March 2026). The consultation closed on 13 May 2026, after which the draft and timetable may be revised. Entry into force is currently planned for 16 December 2026, in line with Convention deadlines. Established the UN Intergovernmental Science-Policy Panel on Chemicals, Waste and Pollution (June 2025). |
| 43 | Substantially increase the destruction of POPs found in waste by 2030. | Data on the destruction of POPs found in waste is published under J5 of the Environmental Indicator Framework. Indicator J5 of the EIF tracks changes in the stockpiles of POPs over time. The indicator was last updated in December 2025; however, the most recent underlying dataset currently runs to 2023. This data indicates a positive direction of travel, with an increasing share of POPs in waste being sent for destruction. |
| 44 | Seek to eliminate the use of Polychlorinated Biphenyls (PCBs) in equipment by the end of 2025 to make sure there are negligible emissions to the environment in line with our commitments under the Stockholm Convention. | The final figures for the end of 2025 will be available later this year when all waste tracking paperwork has been received from equipment holders. |
| 45 | Review the delivery of the contaminated land regulatory regime by assessing the use of existing powers and local authority performance through a new State of Contaminated Land Report by 2026. | All individual English local authorities were invited to complete an online survey and provide necessary information required under the Environmental Protection Act 1990. The survey closed in February 2026. Responses are currently being reviewed. A State of Contaminated Land report is currently on track to be published by the end of 2026. |
| 46 | Deliver the domestic pesticides reduction target, as set out in the 2025 UK Pesticides NAP, to reduce each of the 20 metrics of the Pesticides Load Indicator (PLI) by at least 10% by 2030 in the arable sector compared to 2018. | Continued to pursue the actions set out in the UK Pesticides National Action Plan 2025 (NAP) and monitor progress to the PLI target. The NAP was published in March 2025, biennial reports will follow in due course. |
| 47 | End the use of neonicotinoid pesticides (clothianidin, imidacloprid and thiamethoxam) that are known to carry substantial risks to pollinator populations. | Leveraged opportunities such as the new EU-UK Sanitary and Phytosanitary (SPS) agreement. No emergency authorisations for products containing these neonicotinoids have been approved since 2024. |
Trends in the natural environment
We collect data for all indicator components within the EIF. However, to provide a robust assessment we require data over a number of years. We do not have enough data covering enough time to present a medium- or long-term trend assessment for 2 components. As we collect data in subsequent years, these assessments will be carried out. The trends are:
- short term: 12 components showed improvement and 2 showed deterioration
- medium term: 11 components showed improvement and 1 showed deterioration
- long term: 11 components showed improvement and 1 showed deterioration
Figure 20 shows the proportion of assessable indicator components corresponding to Goal 4. Further details can be found in Environmental Indicator Framework: Assessments - Goal 4: Chemicals and pesticides.

Figure 20: Short, medium and long-term progress towards Goal 4 Chemicals and Pesticides, based on EIF indicators
Source: Environmental Indicator Framework: Assessments.
Goal 5: Waste
Our vision for this goal is to minimise waste by designing it out of the system, reusing and recycling materials wherever possible. We are delivering this through commitments and actions, including transformative collection and packaging reforms and measures to tackle waste crime and transition to a circular economy. The full list of interim and statutory Environment Act targets for the Waste goal can be found at Annex 2.
Goal delivery summary
Over the reporting year, progress had been made on the commitments and 13 supporting actions that contribute to delivery of this goal. As of March 2026, 31% of actions have been completed, with 54% in progress, and 15% reported as being currently off track with work underway to maintain progress. Full details of the actions can be found in Annex 1.
Since April 2025, we have taken decisive action to deliver this goal. In particular, we have:
- introduced Simpler Recycling for businesses (excluding micro businesses) (March 2025)
- introduced new powers enabling councils to seize and crush vehicles used in fly-tipping, helping to clean up communities (April 2025)
- phased in, Extended Producer Responsibility (EPR) for packaging (April 2025)
-
introduced legislation to ban the supply and sale of single use vapes in England (June 2025)
-
instructed PackUK to use its existing regulatory powers under the pEPR Regulations to ensure that funds are only spent on waste collection, recycling and disposal activities (June 2025)
- committed £1.1 billion to improve local recycling services across England, enhancing waste management and community outcomes (July 2025)
- published Vehicle Seizure Powers – Local Authority Guidance to support local councils to seize and crush more vehicles used for fly-tipping (February 2026)
- published a Waste Crime Action Plan (March 2026)
- implemented the legal requirement for local authorities to collect a core set of recyclable waste streams from all households in England. This includes weekly food waste collections for all homes, unless a transitional arrangement applies (a transitional arrangement is where a local authority has agreed a later implementation date set in regulations) (March 2026)
Environment Act target delivery progress
There are 1 statutory target and 8 interim targets contributing to delivery of the Waste goal.
Commitment 48: Ensure that by December 2030 the total mass of:
-
residual waste excluding major mineral waste in the most recent full calendar year does not exceed 437kg per capita
-
residual waste excluding major mineral waste in the most recent full calendar year does not exceed 25.5 million tonnes
-
residual municipal waste in the most recent full calendar year does not exceed 333kg per capita
-
residual municipal plastic waste in the most recent full calendar year does not exceed 42kg per capita
-
residual municipal paper and card waste in the most recent full calendar year does not exceed 74kg per capita
-
residual municipal metal waste in the most recent full calendar year does not exceed 10kg per capita
-
residual municipal glass waste in the most recent full calendar year does not exceed 7kg per capita (Environment Act interim targets)
Commitment 48d: Ensure that by December 2030 the total mass of:
- residual municipal food waste in the most recent full calendar year does not exceed 64kg per capita (Environment Act interim target)
These interim targets are reported together with the statutory Environment Act target to
to ensure the total mass of residual waste excluding major mineral waste for the calendar year 2042 does not exceed 287 kg per capita.
The interim targets will be mainly achieved through delivery of our collection and packaging reforms. Further policies on reducing residual waste will be informed by the Circular Economy Growth Plan for England and work carried out by the wider circular economy programme in Defra. The current delivery pathway is set out in the Residual waste reduction Environment Act target delivery plan. Progress towards the statutory target is measured using the same metrics as the interim target.
Progress update
Within the current reporting period, key delivery milestones have been achieved, including the introduction of Simpler Recycling for businesses (excluding micro businesses) and the phased implementation of extended producer responsibility for packaging in 2025. Additionally, the introduction of Simpler Recycling for households on 31 March 2026 marks a significant step towards reducing residual waste and supporting delivery of the interim targets.
Following implementation of the collection and packaging reforms, residual waste excluding major mineral waste per capita is expected to be just under 24% lower than 2019 levels by the end of 2029. Depending on the specific interim target, there is evidence that these reforms will deliver the majority (90 to 100% depending on the specific target) of the reduction required to meet the interim targets. Additional policies to close any gaps will be informed by the Circular Economy Growth Plan for England and work carried out by the wider circular economy programme in Defra. We would not expect to see the impacts of the collection and packaging reforms or additional policies in the reporting metrics at this time as the latest data available is for 2024.
The estimated delivery gaps are calculated by internal Defra modelling, further details on this modelling can be found in the Residual waste reduction Environment Act target delivery plan.
We intend to publish the Circular Economy Growth Plan soon. After publication we will be able to assess the anticipated impacts of further policies on reducing residual waste.
Work is ongoing to strengthen the monitoring methodology for residual municipal waste, including a project looking into the composition of residual municipal waste in England. Once complete, this project will provide updated composition data that will be available for use in the reporting metrics of the material-specific interim targets.
What the data show
The metric uses Environment Agency regulatory data on waste treatment, including Waste Data Interrogator, incinerator monitoring reports, and international waste shipments data. These include tonnages of waste sent to landfill, put through incineration, and sent overseas for energy recovery. These datasets rely on data returns from waste companies and/or exporters and are produced with a lag due to the time needed to cleanse the data and carry out quality assurance. For these reasons, data for the 2025 calendar year will be available in Spring 2027.
The metric is reported annually and data reporting against the long-term and interim targets have been published for the calendar years 2019 to 2024.
In 2024, the estimated amount of residual waste excluding major mineral waste in England was 31.4 million tonnes, representing a decrease of 2.6% from 2023 (32.2 million tonnes), and a decrease of 3% from 2019 (32.3 million tonnes).
This estimate amounts to 535 kilograms (kg) per capita of residual waste excluding major mineral wastes, representing a decrease of 3.7% from 2023 (556kg per capita), and a decrease of 6.9% from 2019 (575kg per capita).
In 2024, the estimated amount of municipal residual waste was 26.1 million tonnes, representing a decrease of 0.1% from 2023 (26.1 million tonnes), and a decrease of 1.1% from 2019 (26.4 million tonnes). This amounts to 445kg per capita, representing a decrease of 1.3% from 2023 (451kg per capita), and a decrease of 5.1% from 2019 (469kg per capita).
Material-specific breakdowns are estimates based on applying existing material composition split estimates to the annual residual municipal waste tonnages, so they share the same trend as each other and the total residual municipal waste figures.
Waste levels are expected to fall significantly over the next few years as our reforms take effect and are expected to deliver most of the reduction required for the interim targets. Additional policies to close any gaps will be informed by the Circular Economy Growth Plan for England and work carried out by the wider circular economy programme in Defra.

Figure 21: Residual waste excluding major mineral wastes, kilograms per capita, England, 2019 to 2024
Source: Estimates of Residual Waste and Municipal Residual Waste in England.
Figure 21 shows the amount of residual waste excluding major mineral wastes in England from 2019 to 2024 in kilograms (kg) per capita. An illustrative linear trajectory to the amounts of residual waste excluding major mineral wastes necessary in 2029 and 2042 to achieve the interim and long-term targets is also included. The figure shows fluctuation in residual waste excluding major mineral wastes (solid line), but overall, a decrease since 2019, falling to 535kg per capita in the most recent reported year (2024).

Figure 22: Municipal residual waste, kilograms per capita, England, 2019 to 2024
Source: Estimates of Residual Waste and Municipal Residual Waste in England.
Figure 22 shows the amount of municipal residual waste in England from 2019 to 2024 in kilograms (kg) per capita together with an illustrative linear trajectory to the amount of municipal residual waste necessary in 2029 to achieve the interim target. The figure shows some fluctuation in municipal residual waste (solid line), but overall, a slight decrease since 2019, falling to 445kg per capita in most recent reported year (2024).

Figure 23: Municipal residual waste by types of material, kilograms per capita, England, 2019 to 2024
Source: Estimates of Residual Waste and Municipal Residual Waste in England.
Table 9: Municipal residual waste by types of material, kilograms per capita, England, 2019 to 2024.
| Year | Total | Food | Paper and card | Plastic | Metal | Glass |
|---|---|---|---|---|---|---|
| 2019 | 469 | 127 | 99 | 75 | 16 | 12 |
| 2020 | 451 | 122 | 95 | 72 | 16 | 12 |
| 2021 | 467 | 126 | 98 | 75 | 16 | 12 |
| 2022 | 464 | 126 | 98 | 74 | 16 | 12 |
| 2023 | 451 | 122 | 95 | 72 | 16 | 12 |
| 2024 | 445 | 120 | 94 | 71 | 16 | 12 |
| Change (2019 to 2024) | -5.1% | -5.1% | -5.1% | -5.1% | -5.1% | -5.1% |
| Change (2023 to 2024) | -1.3% | -1.3% | -1.3% | -1.3% | -1.3% | -1.3% |
Figure 23 and Table 9 show estimates of municipal residual waste in England from 2019 to 2024 in kilograms per capita, broken down for different material streams (food, paper and card, plastic, metal, and glass). The estimates of the amount of municipal residual waste for each material are made by applying estimates of the material composition of municipal residual waste to the total amount of municipal residual waste. For further details about how these estimates are obtained, refer to Estimates of Residual Waste and Municipal Residual Waste in England - Section 6: Methodology.
Figure 23 shows some amounts fluctuating somewhat across the period for most materials but overall decreasing slightly since 2019.
Commitment delivery progress
We are driving action across government, businesses, and the public to transition to a circular economy and tackle waste crime.
Table 10: sets out delivery and measurement of progress against EIP25 commitments for Waste goal between April 2025 to March 2026.
| Reference | Commitment | Progress update |
|---|---|---|
| 48 | Ensure that by December 2030 the total mass of: a. residual waste excluding major mineral waste in the most recent full calendar year does not exceed 437kg per capita. b. residual waste excluding major mineral waste in the most recent full calendar year does not exceed 25.5 million tonnes. c. residual municipal waste in the most recent full calendar year does not exceed 333kg per capita. d. residual municipal plastic waste in the most recent full calendar year does not exceed 42kg per capita. e. residual municipal paper and card waste in the most recent full calendar year does not exceed 74kg per capita. f. residual municipal metal waste in the most recent full calendar year does not exceed 10kg per capita. g. residual municipal glass waste in the most recent full calendar year does not exceed 7kg per capita. h. residual municipal food waste in the most recent full calendar year does not exceed 64kg per capita. (Environment Act interim targets) |
See Environment Act target delivery progress section. |
| 49 | Reduce illegal waste sites from 2023 to 2024 levels by 2029 to 2030. | Our Waste Crime Action Plan published in March 2026, adopts a zero-tolerance approach to waste crime. The plan sets out the steps we are taking to reduce the number of illegal waste sites and fly-tipping incidents which deliver objectives to prevent waste crime activity, take more effective enforcement action, and take remedial action to clean up the worst sites. We are also supporting the remediation of other illegal waste sites, developing with local authorities a Landfill Tax rebate scheme. We are working with the insurance industry to explore new models to protect farmers, businesses and landowners from bearing the cost of waste dumped illegally on their land. Indicator J6 of the EIF tracks the number of illegal waste sites in England. The trend for illegal waste sites has some volatility. After falling from over 1,000 sites to around 500 sites from 2011 to 2012 to 2013 to 2014, the numbers have shown some increases and decreases. In 2024 to 2025 the total number of active illegal waste sites increased to 451 from 344 sites in 2023 to 2024. A key limitation of this data is that waste crime is underreported and partly hidden, meaning the true scale and trends may not be fully captured in official data. |
| 50 | Reduce fly-tipping incidents from local authority reported 2023 to 2024 levels by 2029 to 2030. | See commitment 49 delivery progress update for details on publication of a Waste Crime Action Plan. Indicator J6b of the EIF tracks the number of reported fly-tipping incidents in England with the latest available data covering 2024 to 2025. In 2024 to 2025, local authorities in England reported 1.26 million incidents, an increase of 9% from the 1.15 million reported in 2023 to 2024. As fly-tipping data is self-reported, increases in the reported number of incidents across the years can be driven by local authorities being more pro-active and rigorous in identifying incidents as well as changes in the underlying number of incidents. The Fly-tipping statistics for England provide annual statistics. |
| 51 | Publish the circular economy growth plan in early 2026, followed by its implementation. | We are finalising a plan and will publish the Circular Economy Growth Plan for England shortly. The plan will set out how this government will deliver a more circular and more prosperous economy. |
Trends in the natural environment
We collect data for all indicator components within the EIF. However, to provide a robust assessment, we require data over a number of years. We do not have enough data covering enough time to present a short-term trend assessment for 1 component, nor to present a medium- or long-term trend assessment for 5 components.
As we collect data in subsequent years, these assessments will be carried out. The trends are:
-
short term: 5 components showed improvement, 1 showed little or no change and 2 showed deterioration
-
medium term: 3 components showed improvement and 1 showed little or no change
-
long term: 4 components showed improvement
Figure 24 shows the proportion of assessable indicator components corresponding to Goal 5. Further details can be found in Environmental Indicator Framework: Assessments - Goal 5: Waste.

Figure 24: Short, medium and long-term progress towards Goal 5 Waste, based on EIF indicators
Source: Environmental Indicator Framework: Assessments.
Evaluation updates
The Defra-led Resources and Waste Policy Programme Evaluation (formerly known as the Resources and Waste Strategy evaluation) will include coverage of the Collection and Packaging Reforms (CPR). It was extended in 2024 to explore UK-wide elements of the CPR (Extended Producer Responsibility, Deposit Return Schemes and Digital Waste Tracking). The programme-level evaluation launched in February 2022 is currently scheduled to report in March 2029. This theory-based evaluation will utilise contribution analysis, outcome harvesting and process tracing to assess impact, as well as cost-benefit analysis to understand value for money of the CPR. The Evaluation Plan was published in 2020. Since then, we have published 2 editions of Monitoring Progress, an Impact Evaluation Methodology note, Baseline Data Report, the Year 2 Data Report, and the completed Single-use Plastics process evaluation.
Goal 6: Resources
Our vision for this goal is to ensure that natural resources are produced, managed and consumed sustainably. We are delivering this through commitments and actions, including measures relating to timber, fishing, soil and genetic resources and our broader strategies for food and farming.
Goal delivery summary
Over the reporting year, progress had been made on the commitments and 18 supporting actions that contribute to delivery of this goal. As of March 2026, 100% of actions are in progress. Full details of the actions can be found in Annex 1. Since April 2025, we have taken decisive action to deliver this goal. In particular, we have:
- mapped non-woodland trees across England for the first time to improve environmental data and support nature recovery (April 2025)
- invested more than £45 million in new food security technologies to strengthen resilience and support sustainable food production (April 2025)
- announced £50 million equipment and technology grants to boost food production and farm profitability (May 2025)
- published the Food Strategy and progressed delivery of priority outcomes for healthier, more affordable, sustainable and resilient 21st century UK food system (July 2025)
- announced £150 million in farming grants successfully allocated (August 2025)
- announced the new Fishing and Coastal Growth Fund to modernise and revitalise the fishing fleet (October 2025)
- published first indicator of soil health in England (March 2026)
- In the 2026 to 2027 reporting year, we have also published the farming roadmap (June 2026)
Commitment delivery progress
We are taking coordinated and measurable action to ensure that natural resources are produced, managed and consumed sustainably.
Table 11: sets out delivery and measurement of progress against EIP25 commitments for resources goal between April 2025 to March 2026.
| Reference | Commitment | Progress update |
|---|---|---|
| 52 | Increase the proportion of conifer species contributing to national tree planting. |
As stated in the Forestry Commission Annual Key Performance Indicators report 2025 to 2026, 87% of new planting of woodland in England was broadleaf (4,580 hectares), with the remaining 13% conifer (670 hectares). This is a minor increase on the figure for 2024 to 2025 (12%). We are exploring how to increase the rate of conifer planting. We are continuing to invest in research and development projects to diversify species suitable for timber and to expand the timber evidence base, with delivery planned over the next 3 years. |
| 53 | Increase the use and manufacturing of hardwood species from 2024 levels. | As stated in UK Wood Production and Trade: 2024 Provisional Figures, 814,000 green tonnes of UK hardwood were delivered in 2024. We are conducting an evaluation of the Woods into Management Forestry Innovation Fund (WiMFIF) to identify lessons learned to embed into new design and iteration of the fund which will target innovations to harness more English timber, deliverable over the next 4 years. |
| 54 | Make sure there is sufficient capacity, skills and innovation in the timber and forestry sector to support tree planting and timber production. | As stated in the Tree and seed production case studies - The Tree Production Capital Grant (TPCG) provides capital support to organisations to enhance domestic production of tree seed and saplings. The Tree Production Innovation Fund (TPIF) has been used to overcome barriers to tree and seed production. The Tree Production Innovation Fund has now re-opened for a fifth round. Round 4 of the Tree Production Innovation Fund funded 12 projects across 12 organisations. We are continuing Forest Research projects aimed at diversifying species suitable for timber and expanding the timber evidence base. |
| 55 | Increase the use of safe, best practice, high-performing timber in construction. | We are continuing cross government delivery of key commitments in the Timber in Construction Roadmap through 7 themed working groups. |
| 56 | Manage our marine fisheries in a way designed to maintain or restore stocks to a sustainable level to achieve the environmental, economic and social commitments as required under the Joint Fisheries Statement and Fisheries Act 2020. | We are progressing this work by developing and implementing fisheries management plans (FMPs) and through wider activity, including international consultations on shared stocks. FMPs set out short-, medium- and long-term policies and actions to restore or maintain fish stocks at sustainable levels. We monitor progress through stock assessments, including stocks assessed by the International Council for the Exploration of the Sea, and FMP implementation monitoring. We have published the first Joint Fisheries Statement report and the 2026 annual report on consultation outcomes. |
| 57 | Bring at least 40% of England’s agricultural soil into sustainable management by 2028, increasing to 60% by 2030. | We are on track to publish a set of Sustainable Soil Management (SSM) principles in 2026. We will use these to measure SFI action uptake (as a proxy for SSM). |
| 58 | Improve the quality, consistency and availability of soil data by 2029. | The first year of soil data (initial statistic of soil health) was published in March 2026. We intend to update this annually. |
| 59 | Create and implement a new farming roadmap. | The farming roadmap was published on 24 June 2026. |
| 60 | Create and implement a new food strategy. | We are delivering the 10 priority outcomes set out in the Food strategy document (published in July 2025) through activity across government. We are also developing a monitoring and evaluation framework for these outcomes, although we have not yet established formal monitoring and reporting mechanisms. The Food Strategy Advisory Board (FSAB) was established in March 2025 to advise on the delivery of the Good Food Cycle outcomes across government. Work is taking place to improve public sector food procurement to deliver better value for money and stronger outcomes on sustainability and local economic growth. Announced funding to support this in 5 local authorities (March 2026). Defra is supporting growth in the food sector while managing regulatory impacts through the development of the Food Inflation Gateway. |
| 61 | Strengthen the conservation of genetic resources by 2030. |
Defra is funding 3 national plant gene banks to continue core conservation activities, as well as projects to genetically and physically characterise material in these collections. For animal genetics, we are improving the quality and consistency of data for the annual breed inventory. The inventory provides a dataset over time to monitor changes in livestock breed populations. Additionally, native breeds categorised as ‘at risk’ on the UK Native Breeds at Risk (NBAR) list, after 1 April 2026 the UK Native Breeds Support (NBS) list, are eligible to apply for payments under the Environmental Land Management schemes native breed supplements in England. |
Trends in the natural environment
We collect data for all indicator components within the EIF. However, to provide a robust assessment, we require data over a number of years. For 2 components we do not have data covering enough time to present a trend assessment.
As we collect data in subsequent years, these assessments will be carried out. The trends are:
- short term: 2 components showed improvement, 1 showed little or no change and 4 showed deterioration
- medium term: 2 components showed improvement, 2 showed little or no change and 3 showed deterioration
- long term: 5 components showed improvement, 1 showed little or no change and 1 showed deterioration
Figure 25 shows the proportion of assessable indicator components corresponding to Goal 6. Further details can be found in Environmental Indicator Framework: Assessments - Goal 6: Resources.

Figure 25: Short, medium and long-term progress towards Goal 6 Resources, based on EIF indicators
Source: Environmental Indicator Framework: Assessments.
Evaluation updates
Table 12: Overview and status of relevant policy evaluations.
| Evaluation | Status | Overview |
|---|---|---|
| Fisheries Management Plan (FMP) evaluation | Ongoing | This Defra-led evaluation is supporting continual improvements to how FMPs are designed and delivered. Findings have been used to improve the efficiency and effectiveness of guidance and supporting processes, and the evidence collation processes involved in FMP development. The evaluation has also identified good practice for fostering collaborative approaches. The evaluation draws on the Defra Fishing Industry Social Survey. Other evaluation methods have involved observation of events and working groups, focus groups and interviews with stakeholders and FMP delivery teams, and analysis of FMP documentation. |
| Developing indicators for the monitoring of the government Agri-Food Chain | Complete | In 2025, Defra undertook a baselining exercise for the monitoring of government agri-food chain policy areas, to ensure delivery of meaningful and measurable outcomes for the food system. This involved developing theories of change and a structured log frame of key indicators and baseline measures for assessing progress towards agri-food chain outcomes. These have provided the foundation for monitoring and evaluation of the UK government food strategy for England and other key programmes. |
Goal 7: Climate change
Our vision for this goal is to reduce greenhouse gas emissions to accelerate to net zero and work to prepare the natural environment for the effects of climate change. We are delivering this through commitments and actions, including measures to reduce emissions from key sectors, scale up climate adaptation and resilience measures, and embed climate considerations across the EIP programme.
Goal delivery summary
Over the reporting year, progress had been made on the commitments and 30 supporting actions that contribute to delivery of this goal. As of March 2026, 7% of actions have been completed, with 90% in progress, and 3% reported as being not started but on track. Full details of the actions can be found in Annex 1.
Since April 2025, we have taken decisive action to deliver this goal. In particular, we have:
- extended regulations protecting deep peat from unnecessary burning (October 2025)
- published the Carbon Budget Growth Delivery Plan and Methane Action Plan (October 2025)
- responded to the CCC’s biennial adaptation progress report, highlighting action government is taking across the natural environment sector to improve climate resilience (October 2025)
- published the National Adaptation Monitoring, Evaluation and Learning Framework (October 2025)
- published the Energising Britain Plan, setting out our commitment to enabling the public to access the benefits of the transition to net zero (December 2025)
- published the Climate Adaptation Strategy for Transport (December 2025)
- completed the deployment of offshore wind through the Offshore Wind Environmental Improvement Package and the launch of the Marine Recovery Fund (December 2025)
Commitment delivery progress
We are taking coordinated and measurable action to reduce greenhouse gas emissions to accelerate to net zero and prepare the natural environment for the effects of climate change.
Table 13: sets out delivery and measurement of progress against EIP25 commitments for Climate Change goal between April 2025 to March 2026.
| Reference | Commitment | Progress update |
|---|---|---|
| 62 | Reduce and report carbon emissions from farming and agriculture practices in line with Carbon Budget 4 (2023 to 2027), Carbon Budget 5 (2028 to 2032), and Carbon Budget 6 (2033 to 2037). | We published the Carbon Budget and Growth Delivery Plan and the UK methane action plan (October 2025). This sets out how the government meets its statutory carbon budgets and secures the benefits of this transition for people and businesses. This includes key agricultural policies such as Countryside Stewardship Higher Tier (CSHT) and Sustainable Farming Incentive (SFI) which are continuing to reduce the impact of farming on nature and helping to deliver climate goals. As of 31 December 2025, 6.1 million hectares were in live agreements in agri-environment schemes. The new SFI 26 offer is expected to open fully in September and will continue to offer support for sustainable farming practices that help reduce carbon emissions. Further details will be published later in the year. In 2024, net territorial agriculture emissions in England were 28.1 MtCO2e, with emissions falling by 1% between 2023 and 2024. This indicates a positive direction of travel. |
| 63 | Restore approximately 280,000 hectares of peatland in England by 2050. | The one-year extension until April 2027 to the Nature for Climate Peatland Grant Scheme is expected to bring more than 4,000 additional hectares of peatlands into active restoration. A Forestry-England led restoration programme is expected to bring a substantial amount into active restoration by 2030. The remainder of peatland restoration delivery will be supported through Environmental Land Management schemes, in particular Landscape Recovery and Countryside Stewardship Higher Tier. |
| 64 | Increase the number of trees on farms, with a focus on silvoarable (trees with crops) and silvopastoral (trees with livestock) agroforestry systems. | Agroforestry is being actively delivered through live SFI and CSHT offers for silvoarable and silvopastoral systems. As stated in the Forestry Commission Key Performance Indicators: Report for 2025 to 2026 - there were 2,650 hectares (ha) of land in agroforestry systems in England at 31 March 2026. This composed of 1,310ha silvoarable and 1,330ha silvopastoral. This is based on land being in receipt of annual maintenance payments and represents a 56% increase compared with 31 March 2025. |
| 65 | Integrate climate resilience into decision making across the EIP programme to support the delivery of our outcomes in the context of climate change. | Development of outcome-focused adaptation objectives and delivery plans for the National Adaptation Programme (NAP4) will include those for Defra owned climate risks. |
| 66 | Enhance the adaptive capacity and resilience of the treescape by increasing its extent, connectivity and diversity, improving its condition and conserving the genetic diversity within and between species. | As stated in Forestry Commission Key Performance Indicators: Report for 2025 to 2026, new tree planting in 2025 to 2026 was reported as 5,250 hectares of woodland and 1,137 hectares of tree canopy equivalent cover from trees outside woodlands. England’s total woodland area has increased from 1,330 thousand hectares in March 2022 to 1,350 thousand hectares at the end March 2026. The area of woodland in management, a key determinant of condition, remained constant in 2025 to 2026 at 57%. In 2025 to 2026, 58% of the species newly planted in woodland funded by the England Woodland Creation Offer were ‘non-core species’, helping to increase the species diversity of England’s woodlands. |
| 67 | Make terrestrial protected site designation and management more dynamic and adaptive to the changing climate. | A climate change risk assessment (CCRA) is undertaken when SSSIs are condition assessed. Revised internal CCRA guidance has been issued and the process is underway. Where climate change is identified as a high risk, appropriate responses will be identified through the development of adaptive delivery plans for at least 10% of these SSSIs by 2030. Adaptive delivery plans are currently being piloted. |
| 68 | Support the Clean Power 2030 pillar of the government’s clean energy superpower mission whilst protecting and enhancing the environment. | See Commitment 62 for progress update. In 2024, net territorial emissions in England were 278.7 MtCO2e. Defra sectors accounted for 18% of these emissions, with agriculture contributing 10%, waste contributing 6%, F-gases contributing 2%, and Land Use, Land-use Change and Forestry providing a net emissions sink of 1.3 MtCO2e. Between 2023 and 2024, Defra sector net territorial emissions in England fell by 3%. The Marine Recovery Fund (MRF) was launched in December 2025 as part of the UK’s Clean Power Action Plan. In May 2026, the Environmental Compensatory Measures Reforms Statutory Instrument came into force enabling the offshore wind sector to use a wider range of compensatory measures through the MRF. This will contribute to the accelerated deployment of offshore wind whilst protecting the marine environment. The MRF’s effectiveness will be regularly assessed including through a non-statutory review by 2032. |
| 69 | Support the Accelerate to Net Zero pillar of the clean energy superpower mission by reducing carbon emissions from other environment-related sectors beyond land-use and marine habitats to ensure reporting in line with the government’s Carbon Budget 4 (2023-27), Carbon Budget 5 (2028-2032), and Carbon Budget 6 (2033-2037). | In 2024, net territorial waste and F-gas emissions in England were 17.8 MtCO2e and 5.5 MtCO2e respectively. Between 2023 and 2024, net territorial waste emissions in England fell by 4% and net territorial F-gas emissions fell by 8%. See Commitment 62 for information on The Carbon Budget and Growth Delivery Plan. See Commitment 68 for information on the Marine Recovery Fund and the Environmental Compensatory Measures Reforms Statutory Instrument. |
| 70 | Enable societal shift towards sustainable practices, to contribute to achieving net zero and adapting our society and environments to the impacts of climate change. | The Energising Britain Plan, published in December 2025, sets out our commitment to enabling the public to access the benefits of the transition to net zero. This is already being progressed through policies aimed at enabling the public to shift towards sustainable practices, such as those set out in the Warm Homes Plan, The Boiler Upgrade Scheme and Clean Energy campaign, and government’s investment of £4.5 billion to support industry and consumers switch to electric vehicles. As part of our ongoing work to support the public to adapt to climate change, the government has invested £2.65 billion into flood defences since 2024. Work is also underway to progress Action 214. Full metrics are currently under development. |
| 71 | Enable business to contribute towards achieving net zero and adapt our economy and environments to the impacts of climate change. | The Net Zero Council provides advice to government to support net zero strategy development and helped shape the Carbon Budget and Growth Delivery Plan and Energising Britain. The Council for Sustainable Business has helped to develop Sector Roadmaps and Nature-Positive Transition Pathways. |
Trends in the natural environment
We collect data for all indicator components within the EIF. Both components show improvements in the short, medium and long term.
Figure 26 shows the proportion of assessable indicator components corresponding to Goal 7. Further details can be found in Environmental Indicator Framework: Assessments - Goal 7: Climate change.

Figure 26: Short, medium and long-term progress towards Goal 7 Climate Change, based on EIF indicators
Evaluation updates
The ongoing Food Data Transparency Partnership (FDTP) evaluation was commissioned by Defra and is a 2-year mixed‑methods programme delivering a process, impact, and value‑for‑money evaluation. The programme is currently establishing a robust baseline and undertaking the process evaluation to understand how the FDTP is being implemented.
Goal 8: Reducing environmental hazards
Our vision for this goal is to reduce the risk of harm to people, the environment and the economy from natural hazards. We are delivering this through commitments and actions, including investing in flood and coastal defences, strengthening drought resilience, and embedding long-term resilience to climate risks and natural hazards.
Goal delivery summary
Over the reporting year, progress had been made on the commitments and 19 supporting actions that contribute to delivery of this goal. As of March 2026, 16% of actions have been completed, with 79% in progress, and 5% reported as being currently off track with work underway to maintain progress. Full details of the actions can be found in Annex 1.
Since April 2025, we have taken decisive action to deliver this goal. In particular, we have:
-
announced at least £10.5 billion will be invested by March 2036 to construct new flood and coastal erosion schemes and repair existing defences (October 2025)
-
announced investment of at least £300 million in natural flood management over 10 years – the highest figure to date for the floods programme
-
announced major changes to our flood and coastal erosion funding policy (October 2025)
-
published the FloodReady report setting out how to accelerate building practical and affordable flood resilience measures for homes and businesses (October 2025)
-
announced £1.1 million funding for a scheme to tackle on-farm drought risk (June 2025)
-
announced that £1.4 billion will be spent on flood and coastal defences between April 2026 and March 2027, the first year of the new floods investment programme. This includes more than 600 flood schemes spanning every region of England (March 2026)
-
announced £30 million for Coastal Adaptation Pilots which will deliver adaptation actions such as those for selective property purchases and the development of long-term financing solutions (January 2026)
Commitment delivery progress
We are taking coordinated and measurable action to reduce the risk of harm to people, the environment and the economy from natural hazards.
Table 14: sets out delivery and measurement of progress against EIP25 commitments for Reducing Environmental Hazards goal between April 2025 to March 2026.
| Reference | Commitment | Progress update |
|---|---|---|
| 72 | Monitor the delivery of water company drought resilience measures annually and review every 5 years to ensure that by 2040 we meet the target of only needing emergency measures once in 500 years. | Draft drought plans were submitted in April 2026. Drought actions will be reviewed and assessed by the Environment Agency to monitor effectiveness and suitability for undertaking during a drought. |
| 73 | Better protect 52,000 properties from flooding by March 2026. | As stated in the British Flood Protection target press release, over 60,000 properties were better protected from flooding and coastal erosion between April 2024 and March 2026 - well above the original goal of 52,000, with over 34,000 properties protected during the reporting year. |
| 74 | Make sure that 92% of Environment Agency maintained flood and coastal risk management assets are at or above target condition by March 2026. | Between April 2024 and March 2026, £108 million was reprioritised into asset maintenance, maintaining or restoring expected levels of protection for an additional 14,500 properties. As a result, the Environment Agency’s Flood and coastal erosion risk management report: 1 April 2025 to 31 March 2026 shows that 93% of Environment Agency maintained high consequence assets were at target condition by the end of 2025 to 2026. |
| 75 | Consider whether further reforms to the planning system are required to manage flood risk and coastal change in new developments as part of a planning reform consultation this year. | We published a consultation on a new National Planning Policy Framework in December 2025. |
| 76 | Deliver an improved evidence base to monitor wildfires, through fire and rescue service incident data. | Ministry of Housing, Communities and Local Government with Defra have agreed a joint programme of work to develop wildfire management and policy. This will draw together key departments and agencies to strengthen the evidence base through improved data collection and definitions. |
| 77 | Fund research to address the risk of wildfire. | We are evaluating 5 wildfire-related bids to the external research budget associated with the Science and Innovation Strategy for Forestry in Great Britain. |
| 78 | Work with local authorities to provide further tools and support through Natural England’s Green Infrastructure Framework and associated Green Flag Award standards to plan and deliver trees, quality green spaces and other natural features in towns and cities to support communities, help reduce peak temperatures, and support resilient ecosystems. | Delivery has focused on enhancing the tools, evidence and national support available through Natural England’s Green Infrastructure Framework (GIF). Key updates from the Green Infrastructure Framework include updated national mapping (version 2.2), new datasets on environmental equity and deprivation, and user-informed enhancements to guidance, data and the GIF platform, enabling more consistent, transparent and evidence-led planning and investment decisions. Further, the Nature Towns and Cities accreditation programme supports ambition and leadership through updated criteria and Level 2 accreditation, helping deliver more resilient, higher quality green infrastructure and improved outcomes for communities. |
| 79 | Continue to support woodland creation and peatland restoration projects to protect soils, rivers and biodiversity, and provide natural flood management and climate mitigation and resilience benefits, through funding and by recording hectares planted or restored. | The full hectarage that has come into restoration will not be available until the end of the Nature for Climate Peatland Grant Scheme evaluation in 2027. We are awaiting final reporting from grantees but are confident our metric has been attained. |
Trends in the natural environment
We collect data for all indicator components within the EIF. However, to provide a robust assessment, we require data over a number of years. None of the 3 indicators comprising 5 assessable components have data covering enough time to present a trend assessment across any of the time periods within the EIF. These indicators will be assessed in future years when suitable data series become available.
Further details can be found in Goal 8: Reducing environmental hazards (summary)Environmental Indicator Framework: Assessments - Goal 8: Reducing environmental hazards.
Goal 9: Biosecurity
Our vision for this goal is to enhance biosecurity to protect our natural environment and boost the health and resilience of plants, animals, ecosystems and people. We are delivering this through commitments and actions, including measures to predict, prevent, detect and respond to threats from invasive non-native species (INNS), animal and plant pests and diseases. The full list of interim and statutory Environment Act targets for the Biosecurity goal can be found at Annex 2.
Goal delivery summary
Over the reporting year, progress had been made on the commitments and 29 supporting actions that contribute to delivery of this goal. As of March 2026, 3% of actions have been completed, with 100% in progress. Full details of the actions can be found in Annex 1.
Since April 2025 we have taken decisive action to deliver this goal. In particular we have:
- supported research to tackle plant pests and diseases in woodlands, helping to protect tree health and biodiversity (May 2025)
- raised awareness of Plant Health along with over 30 participating organisations at our fifth National Plant Health week and the APHA exhibition at the RHS Chelsea Flower show (May 2025).
- announced investment of over £1 billion in the next stage of development of a new national biosecurity centre at Weybridge (June 2025)
- expanded funding to land managers from the Animal Health and Welfare Pathway to allow each business to undertake animal health and welfare reviews and endemic disease follow ups for multiples herds and flocks of the same species (July 2025)
- acted to strengthen protections for bees and other pollinators from harmful pesticides (September 2025)
- introduced the new Spruce Site Assessment grant, offering a fixed payment of £2,000 for landowners (or their agents) to assess their woodland and plan to help reduce the risks of Ips typographus outbreaks (October 2025)
- announced that a major potato pest has been eradicated from the UK, following extensive operational investigative work and surveillance (December 2025)
- started new avian influenza vaccine trials in turkeys as part of the fight to protect wild and captive birds (March 2026)
- issued 53 new Tree Health Pilot grant agreements involving 91 landowners (2025 to 2026)
Environment Act target delivery progress
There is 1 interim Environment Act target contributing to delivery of the Biosecurity goal. Progress towards the target is set out below.
Commitment 81: Reduce the rate of establishment of INNS by at least 50% by December 2030, compared to 2000 levels (Environment Act interim target).
This interim target also contributes to the Restored Nature goal and the statutory species Environment Act targets. The target is mainly achieved through inspections, horizon scanning, enforcement and eradication programmes. The current delivery pathway is set out in the Invasive non-native species Environment Act target delivery plan.
Progress update
Key milestones in delivery of the Great Britain Invasive Non‑Native Species Strategy have progressed:
-
completed a risk management exercise in 2025 to identify additional priority species for eradication, with over 100 species reviewed by experts using published evidence and datasets on species distribution, population size, and habitat. This identified 28 species as potential priorities for eradication, with further work underway in 2026 to finalise priorities and accelerate progress towards the 2030 target
- consulted on INNS pathway action plans and a joint government response was published in 2025. Defra is now working with devolved governments to update these plans in response to consultation findings. 3 plans are expected to be finalised and published by the end of 2026, with the remaining 3 by mid‑2027
- strengthened processes to ensure that all confirmed reports are systematically reviewed by relevant authorities, supporting consistent decision‑making on action, management, or further investigation. This has improved the ability to identify and respond to emerging threats at an early stage
Since April 2025, progress has also been made in strengthening the monitoring approach for invasive non‑native species, improving both the coverage and timeliness of data. This includes enhanced integration of data from operational delivery, surveillance systems, and public reporting, alongside increased use of datasets from the Great Britain Non‑native Species Information Portal (GBNNSIP) and the GB Non‑native Species Secretariat (GBNNSS).
We have also funded an independent interim evaluation of the Great Britain Invasive Non‑Native Species Strategy 2023 to 2030. This focuses on a process evaluation of early implementation, alongside a review of available monitoring and administrative data to establish a partial impact evaluation baseline.
What the data show
Data from 1970 to 2000 indicates that approximately 14 new non-native species (NNS) establish in Great Britain every year, of which, according to the Non-native Species Secretariat (NNSS), around 10% to 15% are likely to become invasive. This means that approximately 2 potentially INNS are likely to establish in Great Britain each year. Given current lack of England specific data, Great Britain data have been used as a proxy to estimate the target. To meet the target, we will therefore need to prevent at least one invasive or potentially invasive non-native species from establishing in Great Britain per year.
We use 2 complementary measures to track progress on this target: an interim outcome‑based indicator on native species established across or along 10% or more of the land area or coastline of Great Britain (1969 to 2024) (H1) and an actions ‑ based metric developed by Animal and Plant Health Agency (APHA) and UK Centre for Ecology & Hydrology (UKCEH).
The interim outcomes-based indicator (H1: Cumulative net total number of INNS established across or along 10% or more of the land area or coastline of Great Britain) provides a long‑term, outcome‑focused measure of biosecurity pressures by tracking the accumulation of widely established invasive non‑native species over time.
These data are published annually as UK Biodiversity Indicator – Pressure from invasive species. However, due to inherent data collection and validation lags, monitoring data are not yet available for the most recent reporting period, the latest complete dataset currently extends to 2024.
Based on data from 2024, there are 3,343 non-native species in Great Britain, 2,074 of which are classified as established (reproducing in the wild). The indicator contains 200 non-native species (49 freshwater, 40 marine and 111 terrestrial) that are considered to be exerting a negative impact on native biodiversity and are therefore termed invasive. In total, 108 of these invasive non-native species (14 freshwater, 30 marine and 64 terrestrial) are established across or along 10% or more of the land area or coastline of Great Britain and are hence included in this interim indicator. Further development is required to compare these data against a predicted trend.
An outcome-based indicator is in development, known as H1: Abatement of the number of invasive non-native species entering and establishing against a baseline (interim version available in the Environmental Indicators Framework: Theme H (Biosecurity, Chemical and Noise)). This aims to show how the number of INNS entering Great Britain has been abated (reduced) by comparing a predicted trend for establishment of INNS against actual establishment. The difference to the trend in actual establishment then provides a measure of the success of biosecurity measures.
To address the data collection and validation lags of the outcome-based indicator, we use the actions‑based metric as a proxy to provide a timelier indication of progress. This metric relies on locally reported actions to prevent newly arrived species from successfully establishing.
Indicative data from the England INNS Prevention Metric: Actions Based Approach for EIP show that between 1 April 2025 and 31 March 2026, 128 target relevant reports were recorded in England, of which around 50% or 60 reports were confirmed, involving 53 different species. This has contributed toward activity preventing the establishment of 3 species. This data indicates continued pressure from new and emerging invasive non-native species, however the prevention of establishment in 2 cases shows that early detection and rapid response can be effective in reducing long-term impacts.
Commitment delivery progress
We are taking coordinated and measurable action to enhance biosecurity to protect our natural environment and boost the health and resilience of plants, animals, ecosystems and people.
Table 15: sets out delivery and measurement of progress against EIP25 commitments for Biosecurity goal between April 2025 to March 2026.
| Reference | Commitment | Progress update |
|---|---|---|
| 80 | Maintain UK capacity and science capability to predict, detect and assess, respond to and recover from threats from INNS, animal and plant pests and diseases. |
Defra continues to invest in scientific research and capability with respect to Invasive Non-Native Species (INNS). Ongoing projects such as the Great Britain Non-Native Species Information Portal (GBNNSIP), which allows us to detect and respond to species incursions, and biocontrol, which allows us to respond and manage problematic species, are on track and being delivered. Eight new pests were added to the plant health risk register whilst an additional 31 pests underwent a full review. The UK is home to some of the world’s leading research centres, which are key to protecting against biosecurity risks, both now and in the future. We have more than 25 International Reference Laboratories accredited by the World Organisation for Animal Health (OIE), World Health Organisation (WHO) and Food and Agriculture Organisation of the United Nations (FAO). The UK has an established Veterinary Risk Group (VRG) which identifies and assesses how to manage new and re-emerging animal health and welfare threats in the UK. The VRG is directly supported by a network of expertise across all UK policy areas, animal health and welfare delivery agencies, and enforcement bodies. |
| 81 | Reduce the rate of establishment of INNS by at least 50% by December 2030, compared to 2000 levels. (Environment Act interim target) | See Environment Act target delivery progress section. |
| 82 | Maintain the effective structures, systems and governance processes the UK has in place to support the prevention of INNS, animal and plant pests and diseases. | The INNS Programme Board allows us to support the prevention of INNS in the UK. We are also developing enhanced contingency response plans to allow us to prevent incursions from INNS even more effectively. One completed Pathway Action Plan has been published for INNS, and 2 more will be published by early 2027. The UK has a comprehensive and well tested system for rapidly detecting and identifying incursions and outbreaks of animal and plant health pests and diseases. Early detection enables us to minimise spread through a tailored and timely response. When a pest, disease or invasive non-native species is detected, the UK is fully prepared to respond decisively. We have tried and tested contingency plans in place, to manage and eradicate outbreaks with specific plans for high-risk pest and disease threats. These contingency plans and control strategies set out what government, agencies and people who keep animals and plants must do in an outbreak. We regularly test and refine these plans through desktop and real-time exercises to ensure they remain robust if needed. Further guidance on Poultry Biosecurity Review funding is available for poultry keepers and vets. |
| 83 | Maintain UK capacity and technical capability to carry out surveillance and diagnosis of INNS, animal and plant pests and diseases. |
Defra continues to maintain its capacity to carry out surveillance of INNS through investment in the non-native species information portal. On plant health we continue to monitor progress on annual surveillance and annual tree surveys. In 2025 to 2026 all annual and multi-annual surveys agreed with Defra and delivered by APHA and the Forestry Commission were completed. The Animal and Plant Health Agency (APHA) publish monthly summary reports of disease data gathered by its Veterinary Investigation Centres. This is part of the disease surveillance system which is used to monitor new diseases in cattle, sheep, pigs and poultry, and to monitor changing trends in existing diseases. The Veterinary Record published the reports. Annual Priority pest surveys inspecting for the presence or absence of 13 regulated tree pests were completed by the Forestry Commission for 2025. As in schedule 1 of The Plant Health (Amendment etc.) (EU Exit) Regulations 2020, this relates to the following pests: Agrilus anxius, Agrilus planipennis, Thaumetopoea pityocampa, Thaumetopoea processionea, Xylella fastidiosa, Ceratocystis platani, Anoplophora glabripennis, Anoplophora chinensis, Aromia bungii, Ips typographus, Ips aminatus, Ips duplicatus, Fusarium circinatum. |
| 84 | Have plans and resources to respond to prioritised risks and issues, ensuring the delivery of contingency responses to, and recovery from, INNS and animal and plant pest and disease outbreaks. |
Defra is working to develop enhanced contingency response plans for INNS. We are developing our capacity to identify and target priority species through the NNSIP and are continuing to invest in the NNSI to allow for those responses to be delivered on the ground. Plant health contingency plans continue to be updated. We have revised plans for Colorado beetle and Meloidogyne chitwoodi, following outbreaks, and we have revised the Popillia japonica plan. We are also carrying out a review of the generic contingency plan, developing new plans for brown rot, beech leaf disease and Ips spp., and are revising plans for Agrilus anxius and canker stain of plane. Defra’s Contingency plan for exotic notifiable diseases of animals in England outlines how the government will respond to and manage an outbreak of exotic notifiable disease including the command, control, and communication structures, and disease control principles. Disease control strategies are in place for foot and mouth disease, rabies, African swine fever including control in wildlife. |
| 85 | Increase public and stakeholder awareness of the impact of INNS, animal and plant pests and diseases to drive positive behaviour change, including through strong community-based partnership. | We planned and delivered over 10 awareness raising events, for example National Plant Health Week, and Plant Health Action notes 32 organisations are now Signatories to the Public Engagement in Plant Health Accord. We ran a new Forestry Commission ‘week in your shoes’ campaign to highlight the simple steps the public can take to prevent the spread of pest and diseases. We continue to work towards developing greater levels of stakeholder awareness, for example through the work of the Local Action Group coordinator within APHA. Alongside this the NNSI continue to raise awareness of INNS through engagement with key sectors in both an information sharing and enforcement capacity. The GBNNSS will also be conducting INNS week. |
Trends in the natural environment
We collect data for all indicator components within the EIF. However, to provide a robust assessment we require data over a number of years. We do not have enough data covering enough time to present a short-term trend assessment for 3 components, nor to present a medium trend assessment for 3 components. As we collect data in subsequent years, these assessments will be carried out. The trends are:
-
short term: 1 showed little or no change
-
medium term: 1 component showed improvement
-
long term: 1 component showed improvement and 3 showed deterioration
Figure 27 shows the proportion of assessable indicator components corresponding to Goal 9. Further details can be found in Environmental Indicator Framework: Assessments - Goal 9: Biosecurity.

Figure 27: Short, medium and long-term progress towards Goal 9 Biosecurity, based on EIF indicators
Source: Environmental Indicator Framework: Assessments.
Goal 10: Access to nature
Our vision for this goal is to ensure inclusive access to nature and protect nature’s beauty and heritage. We are delivering this through commitments and actions, including measures to address barriers, boost connection to nature and improve responsible access across our landscapes.
Goal delivery summary
Over the reporting year, progress had been made on the commitments and 42 supporting actions that contribute to delivery of this goal. As of March 2026, 12% of actions have been completed, with 81% in progress, around 2% not yet started but on track and around 5% reported as being currently off track with work underway to maintain progress. Full details of the actions can be found in Annex 1.
Since April 2025, we have taken decisive action to deliver this goal. In particular, we have:
- completed 631 miles of the King Charles III Coastal Path and new rights commenced during 2025 to 2026 bringing the total to 2,099 miles of the 2,700-mile national trail fully established (as of March 2026)
- delivered a new National Trail along the route of the Coast-to-Coast path (March 2026)
- announced 2 new national forests , in addition to the Western Forest. The second new national forest will be in the Oxford-Cambridge growth corridor, and the third will be in the North or Midlands of England (November 2025)
- announced the First new National River Walk (December 2025)
- published an evaluation framework to improve how health and wellbeing outcomes from outdoor interventions are evaluated and included in decision making across sectors (March 2026)
- extended the delivery of our Farming in Protected Landscapes (FiPL) programme to the end of March 2029, enabling farmers to support nature recovery and improve responsible access to landscapes (January 2026)
Commitment delivery progress
We are taking coordinated and measurable action to ensure inclusive access to nature and protect nature’s beauty and heritage.
Table 16: sets out delivery and measurement of progress against EIP25 commitments for Access to Nature goal between April 2025 to March 2026.
| Reference | Commitment | Progress update |
|---|---|---|
| 86 | Make sure that everyone has access to green or blue spaces within a 15-minute walk from home. | Published the Access to green and blue space in England statistics (March 2026), showing that 80% of households in England have access to at least one green or blue space within a 15-minute walk. A programme of work is underway to increase the number of households with access to green and blue space. This includes the River Walks Programme and the first of 9 new National River Walks, the Mersey Valley Way (completed in March 2026) and 3 new national forests. Three towns and cities have achieved Level 1 of the urban greening and access accreditation; Level 2 criteria are due to be published in 2026. |
| 87 | Reduce physical and intangible barriers to accessing green and blue spaces to increase the frequency of visits from those currently least likely to access them. | Nature Community Principles are in development to support consistent and effective community engagement with nature, with principles and recommendations due for publication in mid-2026 and underpinning standards to be finalised later in 2026. Work is also underway to use 15-minute access data to identify localised areas with limited access to green and blue spaces, enabling targeted action to reduce barriers. This includes incorporating deprivation and access criteria into River Walks mapping and assessments. The Adult People and Nature Survey (A-PaNS) for England (January to December 2025) highlighted several key barriers to spending time outdoors, including bad weather (35%) and poor physical health (27%). The Children’s People and Nature Survey (C-PaNS) indicated that in 2025, 43% of children reported spending time outside every day at school, down from 60% in 2021. A Trees Action Plan in development will include a focus on public engagement with trees and woodlands, supporting increased access. |
| 88 | Develop measures to improve responsible access that protect and enhance nature and visitor experiences, aiming to increase the number of people visiting the countryside and coast for leisure and tourism purposes. | Progress is being monitored using Natural England’s Environmental Attitudes and Behaviours metric from within the People and Nature surveys for England, with further work underway to align supporting access and usage data. In 2024 to 2025, 87% of adults reported that protecting the environment was important to them. We delivered programmes supporting responsible access and visitor experiences continue, including the extension of Farming in Protected Landscapes to March 2029 and ongoing funding for Forestry England and the Woodland Trust to support accessible woodlands and coastal environments. Delivery of major access routes continues to improve responsible access to the countryside and coast. Wainwright’s Coast-to-Coast route launched as a National Trail in spring 2026, and over 2,000 miles of the King Charles III England Coast Path are now open to the public. |
| 89 | Reduce barriers to access, boost children’s connection with nature and increase their understanding of the natural world and how to protect it. | Progress is being monitored using number of registrations to National Education Nature Parks. Over 9,000 education settings have registered with the National Education Nature Park (which includes over 33% of schools). 4,327 sites of these mapped their habitats, totalling 23,720,473 square metres of habit mapped. The Department for Education’s Education Estates strategy, published February 2026, sets out plans for an estate that supports opportunity for all with an education estate that is safe, suitable, sustainable and sufficiently sized. New nature focused standards will make every new school a ‘garden school’ by improving outdoor facilities and supporting inclusive access. |
| 90 | Improve the condition, diversity and character of our landscapes and the condition of the historic environment and heritage features, including designated geological sites and scheduled monuments. | Work is ongoing across all Commitment 90 actions, with progress towards updated Landscape and Seascape Character Assessment advice on track for publication in 2026. Activity during the reporting period has focused on embedding landscape, historic environment and geodiversity across nature recovery initiatives, including marine plans, agri-environment schemes, enhanced guidance and advice, and large-scale nature recovery initiatives. Work is also in progress to address Heritage at Risk priorities across Natural England’s NNR estate. Together these activities are improving the condition of heritage features, including scheduled monuments, as reflected in the slight positive trend reported in EIF indicator G2b, based on the latest available update (May 2025, using 2023 data). In 2025, the Heritage at Risk Register for England recorded 4,891 entries, with 138 entries added and 129 removed for positive reasons (including 8 directly as a result of agri-environment schemes). |
| 91 | Increase people’s time spent in nature for physical activity and nature-based activities to support both physical and mental health. | We are progressing work on the final evaluation report of the Green Social Prescribing phase 2 extension, as well as to establish a metric on the number of people accessing green or blue space specifically to improve health. Given the complexity of healthcare data, further work is underway to assess metric viability and explore alternative data sources. This includes using existing surveys This includes using existing surveysto estimate participation in health-related nature-based activities including, the: • People and Nature Survey • Defra’s Attitudes Survey • Sport England’s Active Lives Survey • National Academy for Social Prescribing Link Worker Survey |
Trends in the natural environment
We collect data for all indicator components within the EIF. However, to provide a robust assessment, we require data over several years. We do not have enough data covering enough time to present a short-term trend assessment for 27 components, nor to present a medium- or long-term trend assessment for 26 and 27 components respectively. As we collect data in subsequent years, these assessments will be carried out. The trends are:
-
short term: 2 components showed little or no change
-
medium term: 2 components showed improvement, 1 component showed little or no change
-
long term: 2 components showed improvement
Figure 28 shows the proportion of assessable indicator components corresponding to Goal 10. Further details can be found in Environmental Indicator Framework: Assessments - Goal 10: Access to nature.

Figure 28: Short, medium and long-term progress towards Goal 10 Access to Nature, based on EIF indicators
Source: Environmental Indicator Framework: Assessments.
Evaluation updates
Table 17: Overview and status of relevant policy evaluations.
| Evaluation | Status | Overview |
|---|---|---|
| Process evaluation of the River Walks Demonstrator Project | Ongoing | This Defra-led evaluation utilises qualitative methods including focus groups, interviews and observational studies. Findings are due for publication in 2026 and will inform the wider rollout of the National River Walks programme. |
| Evaluation of the Farming in Protected Landscapes (FiPL) programme | Complete | This evaluation covered 2021 to 2024 and demonstrated positive contributions to supporting farmers and land managers across nature recovery, climate action, access to nature, and strengthening local landscapes. A variety of farmers and land managers participated, including those in severely disadvantaged areas and protected sites. <br? Approximately 10% were new to agri-environment schemes, and as the programme matured, the projects increased in size and complexity. Satisfaction was high, with over 9 in 10 survey respondents reporting the programme met or exceeded expectations, and that they felt well supported (both 91%). Challenges identified through the evaluation were largely external, including poor weather, difficulties obtaining machinery or contractors, planning constraints, and complexities of coordinating activity across multiple land holdings. Overall, the evaluation supports the decision to extend FiPL. |
| The National Education Nature Park Process Evaluation | Ongoing | The National Education Nature Park programme has been evaluated across Years 1 and 2, using mixed methods to assess implementation, early progress towards outcomes, and emerging value for money. Settings were mainly motivated by improving school grounds, pupil wellbeing, and skills development, alongside environmental ambitions. Barriers to participation included timetable pressures, staff capacity, and resource constraints for outdoor learning. Primary schools accounted for 3 quarters of the total grant take-up. Grant reach was evenly distributed amongst regions with a notable minority (38%) with higher-than-average eligibility for Pupil Premium and free school meals. Delivery most commonly took place through classroom-based activities and extra-curricular clubs linked primarily to science, geography, and citizenship curriculum. Reported benefits for both pupils and educators included increased time in nature, improved wellbeing, enhanced school grounds, and greater knowledge of biodiversity and climate change. |
Annex 1: Full reference list of action status
Table 18: Full list of actions.
| Action | Action description | Status |
|---|---|---|
| 1 | Develop Nature Positive Pathways for key sectors of the economy (including water quality and supply, agri-food supply chain and the built environment) through work led by the Green Finance Institute, the Worldwide Fund for Nature, and the UK Centre for Ecology and Hydrology with input from stakeholders in the private sector such as the Aldersgate Group and the Broadway Initiative, government, civil society and academia. We provided seed funding to enable the development of a pilot pathway for the agri-food system in 2026 | In progress |
| 2 | Respond to the call for evidence on the role of the private sector in nature recovery by early 2026. Use the findings of the call for evidence to support corporate and financial institutions to play their part in achieving environmental targets. | Completed |
| 3 | Set out next steps later in 2026 on plans to streamline and strengthen nature market governance following the recent consultation on Voluntary Carbon and Nature Markets and Corry Review recommendation to explore a Nature Markets Accelerator. | In progress |
| 4 | Sponsor the British Standards Institution’s (BSI) Nature Investment Standards Programme and introduce new standards for biodiversity, natural carbon and nutrient markets, to boost confidence and scale up investment for nature and sustainable farming. | In progress – due by March 2027 |
| 5 | Provide £250,000 funding to the Taskforce on Nature related Financial Disclosures (TNFD) in financial year 2026 to 2027. Encourage UK organisations to familiarise themselves with the TNFD nature related risk management and disclosure framework through the Defra-funded GFI-led TNFD UK Consultation Group. | In progress |
| 6 | Increase private investment through blended finance approaches, including our £30 million investment in the Big Nature Impact Fund to support woodland creation, peatland restoration and biodiversity net gain habitat bank projects, with first close expected by the end of the 2025 to 2026 financial year. The fund supports the England strategy of the UK Nature Impact Fund platform aiming to raise £120 million of investment and deliver long-term, risk-adjusted financial returns and measurable impact for a range of professional investors. | In progress |
| 7 | Improve sustainability reporting by UK entities where they can play a role in supporting the climate and nature transition and the development of UK sustainability reporting standards. | In progress |
| 8 | Increase private investment in woodland creation, restoration and management during this Parliament. Decide on inclusion of high-quality UK woodland removals under the Woodland Carbon Code in the UK Emissions Trading Scheme (ETS). | In progress |
| 9 | Look at the development of a Woodland Carbon Purchase Fund, a financial transactions mechanism to support woodland developers and investors by purchasing woodland carbon up front. | In progress |
| 10 | Complete preparation of the strategy for their area and oversee delivery of the actions proposed, with ongoing support from Natural England, Environment Agency and Forestry Commission (FC). | In progress |
| 11 | Bring a new legal requirement into force for all tiers of planning to ‘take account’ of LNRSs. | In progress |
| 12 | Determine and announce timing for the first review and republication of all LNRSs to ensure that all LNRS are updated where necessary and continue to help us meet our targets. | In progress |
| 13 | Meet the NEN’s agreed minimum standard for environmental improvement on members’ estates, including application of the Land Use Framework principles (as currently published) and publication of estate management plans by April 2026 with SMART targets as clear contributions to terrestrial nature targets. | In progress Due to be published in Spring 2026 |
| 14 | Provide over £110 million direct funding to Protected Landscapes Organisations by April 2026 to support local action on nationally important priorities, including nature restoration and access for all. | Completed Scheme running until April 2029. |
| 15 | Champion Protected Landscapes by refreshing our national vision for these special places, eliminating bureaucratic barriers and ensuring teams have the tools and resources to achieve our ambitions. | In progress |
| 16 | Fund land-based providers to deliver a broad range of courses and programmes, including T Levels, and expand provision for apprenticeships in a range of subjects including agriculture, horticulture, land security, land management, and forestry. | In progress |
| 17 | Work with the water sector to ensure there is workforce planning and access to the skills required to deliver the planned investment over the next 5 years to improve infrastructure, following a Skills Summit in July 2025. | In progress |
| 18 | Deliver on the Water Skills Pledge and explore delivery of water-specific sector-based work academic programmes. | In progress |
| 19 | Reflect land management skills feedback submitted through the Land Use consultation in the LUF and farming roadmap. | In progress |
| 20 | Implement the approach set out in our upcoming public participation plan, which will set out how we will involve people and communities in our Clean Energy Superpower Mission and support them to access the benefits of climate and nature action. | In progress |
| 21 | Design for, support and promote engagement with sustainable behaviours, to enable delivery by the public across relevant EIP goals, in alignment with the public participation plan principles and in partnership with government, civil society and research institutions. | In progress |
| 22 | Support farmers and land managers to manage wildlife-rich habitat using appropriate agri-environment options for the habitat type, so the habitat can stay, or become of, sufficient quality. | In progress |
| 23 | Foster multi-landscape, large scale nature recovery initiatives such as Big Chalk and Coastal Wildbelt through the Protected Landscape Partnership. | In progress |
| 24 | Deliver agri-environment schemes to support farmers and land managers taking actions that improve the condition of SSSIs, like addressing water pollution, changing grazing regimes, tackling invasive species and restoring rivers and lakes. | In progress |
| 25 | Deliver Protected Site Strategies for up to 12 sites - including the 5 current pilots - by March 2026 to restore and improve their condition, helping to address upstream environmental pressure such as pollution and habitat degradation. Use this evidence to inform the rollout to other protected sites, including by updating relevant site condition assessments. | In progress |
| 26 | Use the Nature Restoration Fund to pool developer contributions for environmental mitigations, allowing for strategic conservation measures at scale. In 2026 we will launch the first set of Environmental Delivery Plans to enable the roll-out of the fund. Note: EIP25 correction: this action is also delivered by Natural England. | In progress |
| 27 | Complete the King’s Series of 25 new or large extensions to National Nature Reserves (NNRs) by 2028. | In progress |
| 28 | Publish a Trees Action Plan in 2026 to set out how we will improve the resilience and condition of England’s trees, woods and forests. | In progress |
| 29 | Set a target to increase woodland management in 2026 to improve woodland condition, resilience and biodiversity. | In progress |
| 30 | Manage the impact of mammals on woodlands better so that woodlands are more biodiverse, resilient and commercially viable. | In progress In early 2026 the Grey Squirrel Policy Statement and Deer Impacts Policy Statements were published. |
| 31 | Maintain current protections in the National Planning Policy Framework for ancient woodland and ancient and veteran trees and improve the implementation of the policy. Publish and complete updates to our Ancient Woodland Inventory by summer 2027. | In progress |
| 32 | Build upon and review the evidence base for the value of long-established woodlands and consider their biodiversity status. Publish the Long-Established Woodland Inventory by the end of 2026. | In progress |
| 33 | Deliver up to 300,000 hectares of wildlife-rich habitat creation and restoration by 2042 through agri-environment scheme agreements running since 2023. Deliver up to 200,000 hectares of peatland restoration and woodland creation. | In progress |
| 34 | Introduce the mandatory biodiversity net gain (BNG) requirement for Nationally Significant Infrastructure Projects by May 2026 to ensure nature considerations are placed at the heart of development. | Off-track BNG for NSIPs will be implemented in November 2026. |
| 35 | Implement mandatory BNG for Town and Country Planning Act development by working through the consultation response on small, medium, and brownfield sites. Ensure that the nature market for off-site BNG continues to develop and grow so that developers have a good selection of competitively priced and high-quality biodiversity units available to meet their 10% gain | In progress |
| 36 | Incentivise the planting of high-quality woodlands and trees outside of woodland with a further £816 million of funding between 2026 to 2027 and 2029 to 2030 financial years, including by continuing the England Woodland Creation Offer. | In progress |
| 37 | Improve the condition of ancient semi-natural woodland and restore plantations on ancient woodland sites back to semi-natural woodland habitat through our agri-environment schemes. We will monitor delivery of this action through our woodland management target. | In progress |
| 38 | Deliver on our commitment to enhance the biodiversity of all unrestored plantations on ancient woodland sites on the public forest estate. By 2042, we will increase the proportion of native tree species on all unrestored plantations on ancient woodland sites. | In progress |
| 39 | Incentivise farmers and land managers to create and restore hedgerows through our hedgerow offers in agri-environment schemes and integrate hedgerow data into spatial mapping in England. | In progress |
| 40 | Lead restoring meadow marsh and reef, a practical initiative working with our partners towards a more resilient English coast by restoring, recovering and enhancing priority habitats such as seagrass, saltmarshes and native oyster reefs. | In progress |
| 41 | Ensure government land contributes proportionately to achieving statutory environment targets and EIP goals for the government estate. We will set this out by March 2026 | Off track Government Estate for Nature Plan (GENP) published 26 June. |
| 42 | Use the Species Recovery Programme to support projects taking targeted action to conserve and recover our most threatened species, tracking the number of priority actions taken for threatened species | In progress |
| 43 | Incentivise farmers and land managers through our agri-environment schemes to support the recovery of threatened species. | In progress |
| 44 | Provide opportunities for conservation translocations and reintroductions of native species where benefits to the environment and people are clear. | In progress |
| 45 | Support the England Species Reintroduction Taskforce to provide evidence-led advice and guidance on existing and potential species conservation translocations in England. | In progress |
| 46 | Publish a new Pollinator Action Plan in 2026, setting out the activities required to support pollinator populations by all responsible parties. | In progress |
| 47 | Manage widespread invasive species, through Local Action Groups and public awareness campaigns. | In progress |
| 48 | Build the evidence base for delivering the species targets, including the biodiversity targets modelling programme, monitoring and evaluation programme and supporting on the ground surveys and monitoring. | In progress |
| 49 | Assist the National Wildlife Crime Unit to help prevent and detect wildlife crime by obtaining and disseminating intelligence, highlighting local or national threats through detailed analysis, and assisting law enforcement investigations. Work with international partners to ensure the legal and sustainable trade in wildlife. | In progress |
| 50 | Protect human health and safety and protect wildlife from harmful human activity, through compliance with wildlife management measures. Publish an animal welfare strategy later this year, which will include reaffirming our manifesto commitment to bringing an end to the use of snare traps in England. | In progress The Animal Welfare Strategy was published in December 2025. |
| 51 | Incentivise farmers and land managers through our agri-environment schemes to implement measures to support farm wildlife alongside productive farming, by providing year-round resources for farmland species. | In progress |
| 52 | Protect MPAs and HPMAs by implementing fisheries management byelaws by the end of 2026, other fisheries measures by the end of 2028 and management measures for other damaging activities by the end of 2030. | In progress |
| 53 | Review England’s MPA network by the end of 2028 | In progress |
| 54 | Implement the Marine Strategy Regulations 2010 and work toward targets under the UK Marine Strategy for Good Environmental Status. | In progress |
| 55 | Refresh guidance, webinars and materials aimed at local authority air quality officers during 2025 to 2026, reducing the time and investment needed to take action at a local level. | In progress |
| 56 | Pilot a new approach to streamline assessment of PM2.5 in the planning system with local authorities and developers, with work starting in 2025. | In progress |
| 57 | Enhance data access to inform local interventions in communities where those most vulnerable to air pollution are exposed to higher levels, working in partnership with NHS and local authority public health bodies. We will target local authorities with the highest levels of air pollution linked to deprivation, using a tool that shows neighbourhood-level information based on demographic characteristics. | In progress |
| 58 | Consult on new measures that cut emissions from domestic combustion, whilst minimising the impact on those that need to burn and respecting traditional celebratory festivals such as Bonfire Night and Diwali. | In progress |
| 59 | Consider responses to the recent consultation on reforms to industrial permitting. This includes considering sectoral reforms for combustion, batteries and anaerobic digestion, and wider reforms to the overall framework. | In progress |
| 60 | Explore options to reduce emissions from small industrial combustion plants. | Not started – on track |
| 61 | Deliver a pathway for 100% of new sales of cars and vans to be zero emission by 2035, supporting reductions in air pollution and CO2 emissions from road transport. This will be achieved through measures such as the Zero Emission Vehicle Mandate and vehicle incentives, including the Electric Car Grant; supporting the rollout of equitable access to widespread public charging infrastructure; and supporting private charge points in areas facing additional challenges (revision from EIP25 wording) | In progress |
| 62 | Take steps to decarbonise the UK heavy goods vehicle (us) fleet, including consulting on potential regulatory options to support the phase out of the sale of new non-zero emission HGVs by 2040. Support the transition to zero emission HGVs through a mix of policy measures and guidance, including the Zero Emission HGV and Infrastructure Demonstrator (ZEHID), the Zero Emission Truck Grant, and the Depot Charging Scheme (revision from EIP25 wording). | In progress |
| 63 | Support transitioning to a zero-emission bus (ZEB) fleet, including by: working with the Bus Manufacturing Expert Panel to develop a clear pipeline of future orders by the end of 2025 (This is a correction to the EIP25); using powers in the Bus Services Act 2025 to lay regulations by the end of 2026 to end the use of new non-ZEBs on local routes in England from a date no earlier than 2030; and supporting investment with devolved funding settlements. | In progress |
| 64 | Maintain air quality monitoring in up to 72 train stations across Great Britain until March 2030. Train operators and Network Rail will implement Air Quality Improvement Plans, including idling reduction and rail station ventilation improvements. | In progress |
| 65 | Deliver the interim decarbonisation goal set through the Maritime Decarbonisation Strategy to reduce domestic shipping fuel lifecycle GHG emissions by 30% by 2030 (compared to 2008 levels) and 80% by 2040, on the pathway to zero emissions by 2050. We will assess the impacts on air quality as we develop maritime decarbonisation policies and will set out next steps in 2026 including through a formal consultation on domestic fuel regulations (revision from EIP25 wording). | In progress |
| 66 | Work for adoption and implementation of the North Atlantic Emission Control Area (AtlECA) at the earliest opportunity, extending air pollution controls to all UK waters. For SOx emissions this will be from September 2028, with NOx emissions implementation staggered until December 2030 (revision from EIP25 wording). | In progress |
| 67 | Support the International Civil Aviation Organization’s review of the existing aircraft engine emissions standard for NOx, recommending any updates in 2028. | In progress |
| 68 | Deliver aviation decarbonisation, including through increasing the uptake of sustainable aviation fuels to 10% by 2030, delivering airspace modernisation, and supporting the development of low and zero emission aerospace technologies. This includes improving understanding of the wider environmental implications of these measures, such as on-air quality and non-CO2 impacts. | In progress |
| 69 | Publish new statutory local transport plan guidance for local transport authorities in due course, which will set out the government’s ambitions for local transport plans. This will include expectations on improving air quality in the local transport context | In progress – the Local Transport Plan guidance was since published in April 2026, during the current reporting year. |
| 70 | Pursue legislative reform for micromobility vehicles, when parliamentary time allows, to provide a proportionate and more agile regulatory process. This will support our commitment to make smaller, lighter vehicles an everyday transport option and help make air quality improvements in our urban environments. | In progress |
| 71 | Continue to support councils with a £616 million investment to build and maintain walking and cycling infrastructure. This is in addition to wider funding to support active travel including the £15.6 billion Transport for City Regions settlements, £2.3 billion Local Transport Grant and £24 billion for strategic and local roads. | In progress |
| 72 | Publish the third Cycling and Walking Investment Strategy in early 2026, setting out the government’s objectives for active travel. | In progress The third cycling and walking investment strategy was since published in June 2026, during the current reporting year. |
| 73 | Publish an updated ‘Well Managed Highways Infrastructure’ Code of Practice. This will reflect best practices, technological advancements, policy and legislative changes relevant to a range of topics, including environment and air quality. Publication is planned incrementally to enable the earliest access. | In progress |
| 74 | Draw on findings from published research on brake and tyre wear emissions to take a leading role in developing internationally harmonised regulations for limiting these emissions through the United Nations Economic Commission for Europe, targeting adoption by November 2026. | In progress |
| 75 | Conduct a follow-up study in 2026 to assess air quality onboard trains, with a focus on newer bi-mode, tri-mode, and electric trains, and revisit trains with implemented mitigations to evaluate whether levels of NO 2 and Particulate Matter have improved. | In progress |
| 76 | Conduct research in 2026 to assess the feasibility of introducing in-service emissions testing for diesel trains, including whether cost-effective testing requirements could be developed for the rail industry. | In progress |
| 77 | Funding the UK Shipping Office for Reducing Emissions (UK SHORE) programme by providing a further £448 million of research and development funding to accelerate technologies necessary to decarbonise the domestic maritime sector, while addressing air quality impacts and supporting coastal communities and green growth. | In progress |
| 78 | Publish the final report of the first stage of the UK SHORE programme evaluation in early 2026, including assessment of the relevant impacts on greenhouse gas emissions. Future evaluation will consider non-greenhouse gas air pollutants. | In progress |
| 79 | Use Environmental Outcomes Reports, the planned new approach to environmental assessment, to better identify and manage the impact of development on air quality to protect health and the environment whilst streamlining the assessment process and focusing on outcomes. | In progress The Environmental Outcomes Reports: roadmap to reform, published in March 2026, sets out that Environmental Outcomes Reports will be introduced by the end of 2027 |
| 80 | Reduce ammonia emissions by supporting farmers and land managers to invest in low emission farm equipment and infrastructure, such as slurry storage covers, low emissions spreaders and slurry scrapers available through capital grant offers. | In progress |
| 81 | Monitor the success of the industry-led approach to reducing ammonia from urea fertilisers, delivered through Red Tractor farm assurance standards and Fertiliser Advisers Certification and Training Scheme farm advisers, and introduce new regulation if necessary. | In progress |
| 82 | Work with stakeholders to reduce ammonia emissions from farming through streamlined regulation and develop detailed proposals on the extension of environmental permitting for dairy and intensive beef farms for consultation. | In progress |
| 83 | Provide farmers and land managers with information around options and actions they can take to reduce ammonia emissions through programmes such as Catchment Sensitive Farming. | In progress |
| 84 | Publish updates to the health advice accompanying the Daily Air Quality Index (DAQI), Defra’s tool for communicating short-term changes in pollution levels, by March 2026. | Completed |
| 85 | Publish, where an emission target is missed or projected to be missed, an analysis of the abatement potential of the policies and measures under development. | In progress |
| 86 | Provide the public with information about longer-term trends in local pollution levels, to complement the DAQI, on our updated air quality web services by March 2027. | Not started – on track |
| 87 | Launch a new air quality alert system by March 2026 to provide advanced warning of pollution to the people who need it most. Update: We are taking a phased approach to launching the alert system to ensure progress The first part was launched on 28th May, with the second stage due to be launched by the end of July. |
Off track |
| 88 | Work with the Royal College of Physicians and other professional bodies to ensure health care professionals have adequate knowledge to improve awareness and understanding of health impacts of air pollution by January 2029. | In progress |
| 89 | Include a regional element within the new water regulator to ensure greater local involvement in water planning, as announced following the IWC. | In progress - Announced in White Paper commitment to introduce an enhanced regional planning function. |
| 90 | Support the catchment-based approach to facilitate wider public participation in local water systems in preparation for engagement with reforms suggested by the IWC. | In progress |
| 91 | Provide up to £1 million funding for comprehensive cross-border research to understand pollution and other pressures in the Wye catchment and develop plans to tackle these issues. | In progress - £1 million funding awarded to University of West of England |
| 92 | Consult on a set of national policies to support decisions including those relating to SuDS. | In progress |
| 93 | Consult on legislative and policy options to reduce the prevalence of unadopted amenities on residential estates. The consultation will consider long-term maintenance and adoption options for SuDS. | In progress |
| 94 | Require water companies to upgrade 440 wastewater treatment works by 2030 to meet stricter phosphorus permit limits. | In progress |
| 95 | Double the funding for Environment Agency advice-led farm inspections over the 3 years to 2029 to ensure farmers are compliant with water quality regulation. | Completed |
| 96 | Provide advice, guidance and training to encourage voluntary farmer action to reduce diffuse water pollution from agriculture, in addition to meeting regulatory requirements, for example through Catchment Sensitive Farming. | In progress |
| 97 | Streamline and improve regulations controlling agricultural water pollution. To support this, we have reviewed and published updated statutory guidance for the Farming Rules for Water. | In progress |
| 98 | Provide grants to improve slurry management, with impact shown by progress towards the interim target. | In progress |
| 99 | Provide funding to encourage farmers and land managers to protect and enhance watercourses, such as through agroforestry, riparian and wider catchment woodland creation, boundary features and buffer strips. | In progress |
| 100 | Provide grants to spark innovation and use technology to develop solutions which address challenges related to farming pollution. | In progress |
| 101 | Launch a free-to-use nutrient management planning tool to help farmers and land managers plan and manage the use of nutrients on their land in winter 2025. | Completed The Nutrient Management Planning Tool launched in February 2026. |
| 102 | Develop a programme to boost delivery and monitoring of the agricultural water quality targets, including Environment Agency’s National Agricultural Programme for monitoring water quality improvements, so farmers adopt choices which reduce pollution. | In progress |
| 103 | Identify priority sources of pollution for remediation and evaluate water quality improvements after construction of mine water treatment schemes and diffuse interventions. | In progress |
| 104 | Develop options for treatment scheme design and make recommendations on potential scheme locations. Design and plan schemes, apply for necessary planning and regulatory permissions. | In progress |
| 105 | Construct and maintain new mine water treatment schemes and diffuse interventions. | In progress The final 6 diffuse interventions of the 20 required by the interim target of EIP25 have been delivered. |
| 106 | Investigate treatment and delivery options to improve treatment performance or lower lifecycle costs of remediation measures, or both. | In progress |
| 107 | Invest in chalk stream restoration through the Water Restoration Fund and Water Environment Improvement Fund over the next 2 years. | In progress |
| 108 | Support and facilitate 11 flagship chalk stream restoration projects across England, through the Environment Agency’s area and national teams, and through research and funding, and holding water companies to account for delivery. | In progress |
| 109 | Drive over £2 billion investment from water companies into the restoration of chalk streams. This includes prioritising chalk streams as part of the record £11 billion of investment to improve nearly 3,000 storm overflows in England and Wales during PR24, with 75% of high priority sites needing to be improved by 2035 and the rest by 2045. | In progress |
| 110 | Implement the Environment Agency’s National Framework for Water Resources, a plan for securing long-term, resilient water supplies whilst protecting the environment, using cross-sector regional water resources groups’ work, and deliver water resources management plans. | In progress |
| 111 | Reduce water company abstraction from chalk streams by 126 million litres per day by 2030. | In progress |
| 112 | Support delivery of £24 billion of water company expenditure to improve the environment. This includes investment of over £10 billion to improve around 2,500 storm overflows in England. | In progress |
| 113 | Direct funding to local catchment projects to improve the water environment and attract match funding through the Water Environment Improvement Fund. Funding allocations will run from April 2026 until 2028 or 2030, depending on spend type. | In progress |
| 114 | Deliver the Water Restoration Fund and direct £11 million of funding based on water company fines and penalties back into the water environment. The fund will be in operation until March 2028. | In progress |
| 115 | Invest over £100 million in fines and penalties levied against water companies since October 2023, as well as future fines and penalties, into projects to clean up our waters, which could include local environmental programmes to address pollution and improve water quality. | In progress |
| 116 | Introduce a Mandatory Water Efficiency Labelling scheme on water products, such as showers and toilets, in 2026. | In progress |
| 117 | Work with the manufacturing and retail sectors to improve or remove wasteful products and enable innovative water-saving products. Following the launch of a mandatory label, we will consider introducing minimum product standards and design guidance to reduce water wastage and remove inefficient or unclear products from the market. | Not started – on track |
| 118 | Review planning policy and processes in new household development. Progress work to consider the role of water companies in large scale developments, following the recommendations of the Independent Water Commission for an enhanced role in this process. | In progress |
| 119 | Review water efficiency, water recycling and drainage standards to tighten standards, and explore opportunities to increase water efficient housing through technological innovation, including piloting water reuse systems in Ox-Cam, to drive increased water efficiency. | In progress |
| 120 | Investigate dual-pipe systems and water reuse options for new housing development and consider a labelling and record system to map dual pipes for maintenance. As part of this, we will review and amend legislation to address wasteful product issues with toilets and enable new water efficient technologies. | In progress Set up the Water Skills Strategic Group which will focus on identifying where skills are needed most across the sector and ensure the right training and qualifications are in place. |
| 121 | Review planning policy and processes and investigate water reuse options for new non-household development. Consider voluntary schemes for non-household buildings and work with MHCLG and local authorities to improve knowledge and guidance of water reuse in planning processes. | In progress Exploring options to drive water recycling and reuse in new non-household developments through the Clean Water Bill 2026. |
| 122 | Work with the retail market operator MOSL, retailers, regulators and water suppliers, to identify options to reduce non-household demand. This includes through MOSL’s Market Performance Framework standards, Ofwat’s new non-household performance commitment for water companies to reduce business demand for water (including managing penalties and rewards) and reviewing tariff structures in the non-household market to better understand incentives for water efficiency and demand reduction. | In progress Ofwat consulted on wholesale charging schemes including removing the falling block tariff. |
| 123 | Work with Ofwat to hold water companies to delivery of leakage reduction targets – set at 17% for 2025 to 2030 in this period – through Ofwat’s rewards and penalties. | In progress |
| 124 | Implement policies or standards associated with water usage data that enable water companies to incentivise more water efficient behaviours, reduce leakage, and amplify the benefits of their smart meter rollouts. This includes considering recommendations for government from Ofwat’s Baringa report and supporting its Smart Water Metering Delivery Group. | In progress Will respond to recommendations from Ofwat’s Baringa Smart Metering Report. |
| 125 | Rapidly develop critical new water supply infrastructure, supported by a joint team called the Regulators’ Alliance for Progressing Infrastructure Development (RAPID) and the National Framework for Water Resources. | In progress |
| 126 | Review water company delivery regularly as part of the planning for water delivery taskforce meetings. | In progress |
| 127 | Work with abstractors to find voluntary local solutions to reduce unsustainable abstraction or, if required, using powers to modify these abstraction licences. | In progress |
| 128 | Consider the recommendations of the IWC and respond in this year. | Completed The Water White Paper published (January 2026). |
| 129 | Deliver Local Resource Options screening studies to encourage farmers to work together to identify local water resilience solutions such as reservoirs, hydrocycles or water trading. Each group of farmers will receive a report detailing the best options for their area. | In progress |
| 130 | Create new Water Abstractor Groups. | In progress |
| 131 | Crack down on sewage pollution by holding water companies to account for delivering the targets set out in the SODRP. | In progress |
| 132 | Invest over £10 billion into storm overflow improvements in England from 2025 to 2030 to improve over 2,500 overflows. | In progress |
| 133 | Publish a progress report on delivery against the SODRP by the end of 2025 and then every 5 years. | Completed |
| 134 | Hold water companies accountable for meeting their statutory requirements, including the prevention of harm from storm overflows. | In progress |
| 135 | Use newly published guidance – setting out our expectations on targets, legal duties and prioritising – with water and sewerage companies, and regulators, to ensure a clear planning framework. | In progress |
| 136 | Consider the recommendation for reform of sewage sludge regulations made by the Independent Water Commission. Outline next steps as part of Defra’s wider work on water reform. | In progress |
| 137 | Undertake research to assess the human health risks from human faecal-oral transmission of disease relating to wastewater contamination of inland waterways, including persistence of viable human pathogens from treated sewage and associated health burden. This will support in addressing a key evidence gap and improve understanding of the public health risks associated with recreational water activities (revision from EIP25 wording). | In progress |
| 138 | Take regulatory decisions made by other trusted jurisdictions as the starting point for UK regulatory decisions to enable new protections to be applied more quickly and more efficiently, and to align regulation more closely with our closest trading partners unless there are compelling reasons to diverge. We will protect people and the environment while reducing business complexity and trade barriers and provide industry with the certainty they need to grow and invest. | In progress |
| 139 | Extend the industry deadlines for submitting transitional registration data under UK REACH, through legislation to be made by October 2026, following consultation which launched in July this year. | In progress Statutory instrument laid before Parliament in March 2026. |
| 140 | Work in partnership with the devolved governments of Scotland and Wales, to implement a UK REACH restriction on lead in ammunition through legislation to be made by the end of August 2026. | In progress Legal amendment to implement restriction on lead ammunition has since come into legal effect in April 2026, during the current reporting year. |
| 141 | Assess and, where appropriate, add substances to Annex XIV of UK REACH (‘the Authorisation List’) by the end of December 2027 to manage the risks they pose, and to encourage industry to use alternatives. | In progress |
| 142 | Run the UK REACH authorisation process, to ensure that the risks related to substances of very high concern (SVHCs) on the authorisationlist are properly controlled and encourage their replacement. | In progress |
| 143 | Publish an annual UK REACH work programme to set out priorities for UK REACH. | In progress |
| 144 | Review the interim principles for additions to the UK REACH Candidate List of SVHCs by the end of December 2026, with a view to updating the candidate List. | Completed |
| 145 | Publish a PFAS Plan in 2026. In this plan, we will set out a range of regulatory and non-regulatory interventions, measures and initiatives with specific actions and delivery milestones. These will raise understanding and awareness of PFAS in the environment, identify and address releases of harmful PFAS and protect people and the environment from harm relating to PFAS exposure. The plan will set out a coordinated response, extending across government and industry. | Completed |
| 146 | Provide advice, guidance and tools to support the management of PFAS at contaminated sites on an ongoing basis in response to contamination becoming apparent. This includes ensuring that technical guidance and tools are reviewed and updated as necessary. | In progress |
| 147 | Make a decision in 2027 on implementing a potential UK REACH restriction on PFAS in firefighting foams, based on a prior proposal to be provided by the HSE and with the consent of the devolved governments of Scotland and Wales. | In progress |
| 148 | Implement updates to the Stockholm Convention on POPs, through legislation to be made in accordance with the deadlines expected to be set by the convention in late 2025. | In progress |
| 149 | Restrict the manufacture, import and export of additional mercury added products in line with the requirements of the Minamata Convention on Mercury, through domestic legislation that will come into force by the end of 2025. | Completed |
| 150 | Deliver a series of compliance campaigns related to the sampling and testing of waste for POPs to identify which waste streams are affected on an ongoing basis. This includes providing industry with practical guidance as necessary relating to the identification, classification and disposal of waste containing POPs. | In progress |
| 151 | Deliver audits, sampling and testing at waste treatment sites on an ongoing basis to support the effective regulation of waste management facilities treating waste streams which have been identified as including POPs. This should ensure that POPs are destroyed and that appropriate monitoring and control of releases are in place. | In progress |
| 152 | Take enforcement action where we find that equipment is in use beyond the legal deadline. | In progress |
| 153 | Make sure that equipment taken out of use is decontaminated or disposed of appropriately as soon as possible. | In progress |
| 154 | Survey all English local authorities to assess the condition of contaminated land in their respective area and report on these findings by spring 2027. | In progress |
| 155 | Work with stakeholders to encourage uptake of Integrated Pest Management (IPM) by developing and promoting tools and knowledge over the course of the NAP timeline (the NAP sets out a multi-year programme of actions). | In progress |
| 156 | Develop guidance to pesticide users and improve inspection and compliance regimes over the course of the NAP timeline to encourage the safe and responsible use of pesticides. | In progress |
| 157 | Identify and assess potential changes to legislation that would stop the use of emergency authorisations for products containing clothianidin, imidacloprid or thiamethoxam. We will work with the devolved governments to do this by the end of 2027. | In progress |
| 158 | Implement Extended Producer Responsibility for packaging (pEPR) to move the cost of dealing with household packaging waste to packaging producers. | Completed |
| 159 | Instruct PackUK, the pEPR scheme administrator, to recover pEPR money paid to local authorities that are not spent on waste management services. This will ensure sufficient investment for improving recycling performance. | Completed |
| 160 | Introduce the Deposit Return Scheme for drinks containers from October 2027. This will include single-use drinks containers from 150ml to 3 litres made of polyethylene terephthalate plastic, steel, and aluminium. | In progress |
| 161 | Introduce Simpler Recycling in England from 2025, ensuring the same recyclable waste streams are collected for recycling from all households and workplaces. | In progress |
| 162 | Implement the Design for Life roadmap to transition the UK away from all avoidable single-use medtech products by 2045. | In progress |
| 163 | Introduce measures to drive the reduction and near-elimination of biodegradable municipal waste to landfill from 2028. We will support this through the collection and packaging reforms. Potential options beyond this include expanding the list of separately collected materials that are banned from landfill without some form of treatment process to include paper and card, food, garden waste, wood and textiles. Update: We are taking steps towards diverting biodegradable waste from landfill - the introduction of mandatory food waste collections and increasing recyclability in the collection and packaging reforms are part of our first steps in reducing biodegradable waste streams in our residual waste. Whilst we are not currently proposing a ban on biodegradable waste to landfill, we are working with HM Treasury (HMT) to ensure that landfill tax continues to work effectively in encouraging further diversion. We will be developing and bringing forward options to further take biodegradable waste out of landfill. To progress this action, we are meeting with stakeholders to develop our broader thinking in the future of landfill and considering how wider changes in the waste sector, such as the Emissions Trading Scheme’s expansion into Energy from Waste, can influence greater diversion of biodegradables from landfill. |
Off track |
| 164 | Pursue the near elimination of biodegradable non-municipal waste to landfill from 2028, identifying during 2026 which further wastes could be restricted from entering landfill. The Circular Economy Growth Plan will set out options to promote greater circularity in sectors which will be key to reducing residual waste, including that entering landfill. Update: We are taking steps towards diverting biodegradable waste from landfill - the introduction of mandatory food waste collections and increasing recyclability in the collection and packaging reforms are part of our first steps in reducing biodegradable waste streams in our residual waste. Whilst we are not currently proposing a ban on biodegradable waste to landfill, we are working with HMT to ensure that landfill tax continues to work effectively in encouraging further diversion. We will be developing and bringing forward options to further take biodegradable waste out of landfill. To progress this action, we are meeting with stakeholders to develop our broader thinking in the future of landfill and considering how wider changes in the waste sector, such as the Emissions Trading Scheme’s expansion into Energy from Waste, can influence greater diversion of biodegradables from landfill. |
Off track |
| 165 | Introduce separate food waste collections for all households from 2026. | Completed |
| 166 | Stop criminals using permit exemptions to hide illegal waste activity by removing 3 permit exemptions and tightening 7 more, stop allowing multiple exemptions on a single site or on sites with a permit, and introduce record-keeping requirements. | In progress |
| 167 | Reform carriers, brokers and dealers regulation by moving into the tougher environmental permitting system with stronger penalties to ensure that only the right people can transport and manage waste, making it easier for regulators to act against non-compliant operators. | In progress Legislation laid in May 2026, during the current reporting year. |
| 168 | Introduce a digital waste tracking service to modernise existing waste record keeping from 2026 to enable regulators to better detect illegal activity and tackle waste crime. Update: Launched phase 1 of implementation in April 2026 with the first element of the service for permitted and licensed waste receivers in public beta and open to all relevant parties to integrate with. First set of Regulations has also been laid in Parliament and the service will be mandatory from October. |
In progress |
| 169 | Publish guidance in early 2026 to support local councils to seize and crush more vehicles used for fly-tipping, including using new technologies. | Completed (Guidance to support local councils published February 2026). |
| 170 | Monitor and evaluate progress towards circularity through the Circular Economy Growth Plan, showing how we expect government initiatives to effect change and achieve our wider goals and targets. | In progress |
| 171 | Leverage current grant schemes and green finance to increase conifer planting. | In progress |
| 172 | Collaborate with Local Nature Recovery Strategies to encourage productive woodlands. | In progress |
| 173 | Invest in targeted innovations to harness private investment and develop more efficient ways to harness timber. | In progress |
| 174 | Build resilience in the supply chain to extreme weather, biosecurity threats and economic shocks by supporting innovation, productivity and capital investment in tree and seed production. | In progress |
| 175 | Facilitate initiatives to enhance the quality, quantity and genetic diversity of domestically produced tree seed and planting stock. This includes investment in tree improvement programmes to select for resilience and productive traits, including through the Centre for Forest Protection and other Defra funded research. | In progress |
| 176 | Work with key sector partners to implement actions in the Forestry Sector Skills Plan 2025, overcoming barriers to the take up and provision of forestry training at all levels. | In progress |
| 177 | Implement actions in the Timber in Construction Roadmap 2025. This roadmap sets out how the government will promote the use of timber to help reduce embodied carbon in the built environment and at end-of-life, and drive investment into tree planting, forest management and domestic supply chains. It will create new green jobs and industries. | In progress |
| 178 | Deliver the Fisheries Management Plans (FMP) programme, which focuses on the sustainable management of stocks. This includes the publication of the next 5 plans in English waters by the end of 2025 and continuing to deliver the actions in the 6 existing published plans. Our delivery partners are leading on the preparation of a further 4 FMPs, to be published by the end of 2026. | In progress |
| 179 | Negotiate with our international fisheries partners to seek to increase the overall number of stocks fished at sustainable levels. | In progress |
| 180 | Extend the requirements for Vessel Monitoring Systems to all English-licensed fishing vessels and non-English fishing vessels operating in English waters this year. This is to ensure regulators have as accurate as possible an understanding of the spatial activities of all vessels, enabling better informed management of the marine environment. | In progress |
| 181 | Deliver the Fishing and Coastal Growth Fund, investing £360 million over the next 12 years to support the next generation of fishermen and breathe new life into our coastal communities. The investment will secure our fishing industry for decades to come and make it fit for the 21st century. We will work with the industry to target investment where it matters most. | In progress |
| 182 | Publish principles of sustainable soil management by 2026. Encourage farmers and land managers to sustainably manage and protect their soils through agri-environment schemes. | In progress |
| 183 | Publish a methodology and guidance for consistent soil health monitoring by 2026, empowering farmers and land managers to establish baselines and implement sustainable soil management practices. | In progress |
| 184 | Publish an initial statistic of soil health for England during 2026, aim to establish a soil health baseline by 2029. | In progress |
| 185 | Create the farming roadmap, setting out the government’s vision for England’s farming system in 2030 and 2050 and the long-term strategy for achieving this. This will provide clarity and stability for farmers, land managers and the wider supply chain. | In progress The Farming Roadmap has since been published in June 2026, during the current reporting year. |
| 186 | Transform our food system through achieving the 10 priority outcomes of the Food Strategy. This will maintain food security by building resilience in the face of climate shocks, geopolitical changes and protect the supply chain which keeps us fed. It will support the farming roadmap to improve the impact of farming on soil, nature and biodiversity, as well as sustainable fisheries management in accordance with the Joint Fisheries Statement and Fisheries Act 2020. | In progress |
| 187 | Work with stakeholders and update the UK Farm Animal Genetic Resources inventory, Breeds at Risk list and Native Breeds at Risk list, or their equivalents, annually. This will help monitor changes in native livestock populations, identify trends and potential threats and safeguard livestock diversity to conserve native breeds most at risk. | In progress |
| 188 | Conserve plant genetic resources using gene banks and increase the utilisation of plant genetic resources through research. | In progress |
| 189 | Support farmers and land managers to decarbonise agricultural emissions through advice, regulations and incentives to adopt sustainable land-management approaches, new technology, and innovative practices. | In progress |
| 190 | Continue to internally monitor uptake of relevant actions through agreements under our farming schemes and publish data on a quarterly basis, as calculated from agreements data from the Rural Payments Agency. | In progress |
| 191 | Review Farming and Countryside Programme objectives annually to ensure alignment with carbon budget delivery requirements. | In progress |
| 192 | Work with industry to reduce methane emissions from livestock such as through our existing Animal Health and Welfare Pathway, and through new support mechanisms to stimulate the market and encourage uptake of new technologies like methane suppressing feed products from 2025. | In progress |
| 193 | By 2028, develop and publish new quantified assessments for how at least 6 non-peat habitats – specifically, species-rich grasslands, floodplain mosaic habitats, saltmarsh, hedgerows and scrub – contribute to carbon storage and sequestration, with linked assessments of their biodiversity. | Not started – on track Natural England is on track to deliver new quantified assessments for the non-peat habitats. |
| 194 | Develop guidance setting out minimum technical requirements that farm carbon accounting tools should meet to generate an actionable farm carbon audit, as well as a suite of standard calculation methodologies to support farm carbon accounting tools, by 2028. | In progress |
| 195 | Work with industry (through the Defra Food Data Transparency Partnership) to better assess the environmental impact of food and drink across supply chains by standardising priority environmental footprint methodologies, including for carbon emissions, by 2030 and creating governance mechanisms for data sharing. | In progress |
| 196 | Legislate for a ban on the sale of peat and peat containing products when parliamentary time allows. Update: Officials are working with all 3 devolved governments on detailed preparatory proposals for how a UK ban could be delivered, with consideration of timelines, impacts, governance and enforcement options and trade considerations. |
In progress |
| 197 | Invest £85 million by 2030 in improving and restoring our peatlands, supporting us in our long-term ambitions to unblock delivery for up to 23MtCO2e savings by 2050. | In progress |
| 198 | Fund water infrastructure, facilitation grants and paludiculture trials. This funding will enable farmers and land managers to make changes to their water management and undertake more sustainable actions on peat. | In progress |
| 199 | Work with partners, farmers and land managers to restore 40,000 hectares of peat before April 2030. The Nature for Climate Peatland Grant scheme will continue until March 2027. Peatland restoration will then be supported by Landscape Recovery and Countryside Stewardship, which will provide long-term funding to support large-scale restoration projects and plan future restoration projects. | In progress |
| 200 | Mobilise private investment, including supporting the emergence of voluntary marketplaces for peat such as the Peatland Code. | In progress |
| 201 | Publish the Peatland Restoration Register in 2026 as part of further investment in improving the new England Peat Map. The register will be a centralised geospatial record of restoration projects across England, allowing us to track progress and make it easier to identify peatland areas requiring restoration management. | In progress |
| 202 | Incentivise land managers to integrate tree planting and food production into individual fields through our agri-environment schemes. | In progress |
| 203 | Develop new measurable and timebound climate resilience objectives and standards to support the next National Adaptation Programme (NAP4). Clarify the underpinning planning assumptions for the objectives and standards and develop suitable indicators of progress. | In progress |
| 204 | Publish NAP4 in 2028 to report relevant actions and policies that will contribute towards our legal requirements under the Climate Change Act 2008 and our EIP goals. | In progress |
| 205 | Promote the use of the National Adaptation Monitoring, Evaluation and Learning Framework throughout the development of NAP4 up to publication in 2028. | In progress |
| 206 | Explore options to increase the diversity of climate-resilient forestry species. Identify core future species for productive forestry to focus research and tree breeding on, supported by an enhanced regulatory framework for emerging forestry species by 2028. | In progress |
| 207 | Make sure that new woodlands have current and future climate conditions considered in their design and species choice. Consider options for spatial targeting of woodland creation grants for resilient woodlands, integrating with the Land Use Framework. We will evaluate grant applications for new woodland by 2030 to assess progress against this action. | In progress |
| 208 | Revise the UK Forestry Standard Practice Guide on building wildfire resilience into forest management planning by 2028. | In progress |
| 209 | Complete initial climate change risk assessments for all Sites of Special Scientific Interest (SSSIs) as part of condition assessments by 2032. | In progress |
| 210 | Implement climate change adaptive delivery plans for at least 10% of SSSIs identified as being at high risk by 2030. | In progress |
| 211 | Further develop the adaptive management for features identified to be at high risk on Natural England-managed National Nature Reserves to support management planning by April 2026. | In progress |
| 212 | Aid the National Energy System Operator to create a Strategic Spatial Energy Plan (SSEP) to align the rapid deployment of energy infrastructure with wider land use objectives. Throughout its development, the SSEP will consider wider demands on land and sea, including food production, transport, water supply, nature recovery and fisheries. The development of the SSEP is being informed by the analysis which underpins the Land Use Framework. The final methodology for the SSEP has now been published. | In progress |
| 213 | Accelerate deployment of offshore wind through the Offshore Wind Environmental Improvement Package. We have consulted on proposed environmental compensation measures reforms for offshore wind for the sector this year and will launch a new Marine Recovery Fund by the end of 2025. | Completed |
| 214 | Provide UK Research and Innovation with £15 million to deliver a research programme to fund world-leading research projects to help improve the UK’s resilience to climate change impacts, including new approaches to managing climate impacts in urban areas, on vulnerable people and supporting increasing private investment in climate adaptation. | In progress |
| 215 | Publish the transport adaptation strategy, following a consultation in 2024, aimed at enabling progress ahead of NAP4. | Completed Published the transport adaptation strategy December 2025 |
| 216 | Partner with business on an ongoing, cross-government basis to jointly work towards positive environmental outcomes. The Net Zero Council will help address cross-economy challenges and maximise opportunities. Ensure that objectives of the Council for Sustainable Business, which advises Defra on how businesses can help deliver the EIP, are aligned. | In progress |
| 217 | Set out how the government’s integrity principles for voluntary carbon and nature markets, published in 2024, could be applied through policy, guidelines and regulatory oversight. This will build on the consultation paper published in April 2025, which the government will publish a response to early in 2026. | In progress |
| 218 | Enable businesses to take informed decisions on sustainability through more consistent and accurate data on their emissions. For example, develop standard methods and infrastructure to improve how emissions from food and drink are understood across the supply chain through the Defra Food Data Transparency Partnership (FDTP). Research recommendations on standardised product level emissions are expected in 2025 and new models and guidance for farm level emissions are expected in 2028. | In progress |
| 219 | Implement the Environment Agency National Framework for Water Resources, using cross sector regional water resource groups’ work. The water industry is expected to deliver sustained reductions in leakage through active management, mains pipe renewals and supporting customers with customer supply pipe leakage. Regional groups have an important strategic role in monitoring and tracking overall water demand and leakage regionally, as part of their wider monitoring and adaptive planning approach. | In progress |
| 220 | Deliver water resources management plans, through the water industry building new water resources infrastructure and delivering sustained reductions in leakage through active management, mains pipe renewals and supporting customers with customer supply pipe leakage. | In progress |
| 221 | Implement drought management actions in drought plans to ensure a secure water supply. | In progress |
| 222 | Deliver Local Resource Options screening studies to encourage farmers to work together to identify local water resilience solutions such as reservoirs and create new water abstractor groups. | In progress |
| 223 | Invest a record £2.65 billion over 2 years, from April 2024 to March 2026 as part of the Plan for Change. In the first year the target of 25,000 was exceeded with over 27,500 properties better protected from flooding. | Completed |
| 224 | Restore and repair existing high-consequence defences by the end of March 2026, including those damaged in storms over recent and ongoing flood events. | Completed |
| 225 | Publish a consultation on further planning reform by the end of 2025, including potential changes to manage flood and coastal risk. | Completed |
| 226 | Work with stakeholders to develop the statistics and evidence base to enable their own analysis and research. This may include sharing incident data, supporting secondary analyses. | In progress |
| 227 | Provide support and guidance to local authorities and other statutory bodies to ensure effective communication during high wildfire-risk periods. For example, Fire Kills provides resources to support prevention activities. | In progress |
| 228 | Review the Wildfire Framework for England to provide clarity on roles and responsibilities. | In progress |
| 229 | Include a category for wildfires in the fire and rescue service incident data, via the Fire and Rescue Data Platform (FaRDaP), following approval of the change to the Single Data List. | In progress |
| 230 | Monitor usage and quality of the data supplied through the new categories in FaRDaP. | In progress |
| 231 | Develop and publish wildfire statistics. | In progress |
| 232 | Conduct research on increasing the natural resilience of habitats to wildfires, such as through re-wetting or restoring hydrological function, including case studies of success, by 2030. An initial scoping review will be reported on in the annual progress report (APR) in 2027. This will develop our understanding of actions we can take to naturally reduce the risk of wildfires. | In progress |
| 233 | Develop the Urban Greening indicator and baseline by 2026. | In progress |
| 234 | Publish the Urban Tree Canopy Cover Standard User Guide by the end of December 2025. Update: Publication timelines have been extended to allow newly produced data and supporting evidence to be fully incorporated, alongside further stakeholder consultation on proposed revisions. |
Off track |
| 235 | Work with 100 local authorities to embed the Green Infrastructure Framework in their local plans and strategies, by 2030. This will involve engagement with local planning authorities before and during the plan-making process. | In progress |
| 236 | Incentivise the planting of high-quality woodlands and trees outside of woodland with a further £816 million of funding between the 2026 to 2027 and the 2029 to 2030 financial years, including by continuing the England Woodland Creation Offer. | In progress |
| 237 | Deliver up to 300,000 hectares of wildlife-rich habitat creation and restoration by 2042 through agri-environment scheme agreements running since 2023. Deliver up to 200,000ha of peatland restoration and woodland creation. | In progress |
| 238 | Horizon scan at least every 5 years, for INNS likely to arrive and establish over the next 10 years, with the results feeding into an INNS risk management exercise to identify priority species for contingency responses. The next scanning exercise will be completed by the end of March 2030. | In progress |
| 239 | Review and update the Plant Health Risk Register monthly and use it to inform risk-based decision making. | In progress |
| 240 | Maintain the Human Animal Infections and Risk Surveillance group’s specialist expertise and capability in host and pathogen interactions, environmental threats to human and animal health and risk assessment methodology across UK government. The group will continue meeting monthly to effectively identify signals to emerging and potentially zoonotic infections which may pose a threat to public or animal health. | In progress |
| 241 | Make sure that Defra and Cefas Fish Health Inspectorate can provide resources, staffing levels and training that ensure specialist expertise is developed and maintained to stay up to date on the identification and characterisation of emerging aquatic animal diseases and aquatic animal diseases of concern under climate change. | In progress |
| 242 | Continue to use the UK’s Veterinary Risk Group (VRG) to effectively identify and assess how to manage new and re-emerging animal health and welfare threats in the UK, including wildlife threats, and report monthly to Defra and devolved governments. | In progress |
| 243 | Enable the Non-native Species Inspectorate (NNSI) to focus on meeting our interim target of a 50% reduction of establishment by 2030 by ensuring clear prioritisation of action and the maintenance of their capacity and resource through 6-monthly reviews at the GB INNS Programme Board. | In progress |
| 244 | Complete INNS pathway action plans consultation by the end of 2025, with an annual review of progress on their implementation conducted through the GB INNS Programme Board. | In progress |
| 245 | Undertake eradicative actions in response to newly detected INNS and monitor the success of those actions through annual review at the Great Britain INNS Programme Board. | In progress |
| 246 | Operate a SPS imports regime which supports the protection of the UK’s biosecurity, public health and environment, with risks reviewed regularly and controls relevant to current threats. | In progress |
| 247 | Set out commitments and timescales for reducing the risk of pests and diseases in the Trees Action Plan next year. | In progress |
| 248 | Incentivise more biosecure plant supply chains by ensuring that plant biosecurity requirements continue to be effectively incorporated into relevant government grants and contracts and ensuring that version 1.3 of the Plant Health Management Standard is used for audits. | In progress |
| 249 | Deliver the Animal Health and Welfare Pathway to support land managers by offering financial support, encouraging market demand, and enacting regulatory changes to promote higher animal health and welfare standards – all review and follow-up visits to be completed by 19 June 2027 and all claims to be submitted by 19 September 2027. | In progress |
| 250 | Update the England Wildlife Health Strategy by the end of 2026, focusing on tackling disease incursion into the wildlife population and improving wildlife health and resilience. | In progress |
| 251 | Provide UK leadership and support the United Nations in establishing and operationalising a new independent evidence panel on anti-microbial resistance in early 2026, providing up to 5 years of financial support to help shape the Panel’s ways of working and priorities. | In progress |
| 252 | Maintain an effective NNSIP through quarterly oversight meetings to assess ongoing delivery. | In progress |
| 253 | Continue daily inspections by the NNSI to detect and respond to breaches of INNS related legislation, and quarterly oversight meetings with Defra. | In progress |
| 254 | Invest in new technologies, such as novel diagnostics, remote sensing and artificial intelligence, to optimise the quality and efficiency of diagnostics and surveillance for quarantine pests and diseases of trees and wood products at the border and inland by 2028. | In progress |
| 255 | Establish a new National Biosecurity Centre at Weybridge by 2034 with: completion of design by the end of 2026, approval of business cases for main build in summer 2027, completion of construction by the end of 2032, new animal and laboratory science buildings fully operational by the end of 2034, and completion by 2037. | In progress |
| 256 | Apply outputs from the Genomics of Animal and Plant Health Disease Centre Phase 2 research programme to increase our ability to use novel techniques to diagnose, sequence and survey at the border, in wildlife, in the environment and to track disease outbreaks, with programme completion scheduled for March 2027. | In progress |
| 257 | Prevent, eradicate, contain and/or manage INNS in our environment, prioritised by greatest impact and the likelihood of success, by 2030. | In progress |
| 258 | Manage a continuing programme of biocontrol feasibility studies, research and development (such as the Stenopelmus rufinasus weevil on Azolla Filiculoides water fern) alongside other management options for highly impactful INNS, animal and plant pests and diseases, enabling integrated management options to reduce ongoing costs and use of pesticides. | In progress |
| 259 | Review, update and test contingency plans ensuring outbreak readiness for future plant health threats up to 2028 and up to date response protocols are in place. | In progress |
| 260 | Continue to implement official management programmes for eradication or containment of regulated plant pests and diseases already present up to 2028. | In progress |
| 261 | Provide targeted data, advisory services and funding to landowners and land managers to enable effective response and recovery from tree pest and disease outbreaks, up to 2028. | In progress |
| 262 | Make sure that the Fish Health Inspectorate within the Centre for Environment, Fisheries and Aquaculture Sciences has the right people, skills, knowledge and objectives to carry out disease control work for serious diseases of aquatic animals. To support this there is an annual review of the memorandum of understanding between Defra and Cefas on the provision of aquatic animal health services, covering elements like the delivery and enforcement of legislation, the provision of epidemiological risk, scientific and veterinary advice, investigation of emerging issues, diagnostic functions, and research programmes. | In progress |
| 263 | Increase public and stakeholder awareness of INNS and animal and plant pest and disease outbreaks in England by conducting annual awareness raising campaigns, events-based education and guidance and training targeted to sectors, so that the public and stakeholders feel empowered to identify, report, or where possible take action to prevent or manage these. | In progress |
| 264 | Increase public awareness of plant health and promote behaviour change, by 2028, by delivering annual National Plant Health week campaigns along with tailored communications, education and training programmes each year. | In progress |
| 265 | Provide information to stakeholders on statutory responsibilities, disease recognition, biosecurity, trade matters and associated issues for aquatic animals in a clear, understandable way that supports effective delivery. This means using plain English, clear formatting, links to relevant legislation and practical examples where possible. | In progress |
| 266 | Build awareness of, and compliance with, the English code and guidance for reintroductions and other conservation translocations, using qualitative disease risk evaluations particularly where wildlife is sourced from abroad or bred in captivity, guided by a clear product plan to 2034. | In progress |
| 267 | Create 9 new National River Walks, one in every region of England. | In progress |
| 268 | Establish 3 new national forests. | In progress |
| 269 | Consult on measures to ensure that everyone has access to nature close to home and to strengthen the public’s legal rights to access through the Access to Nature Green Paper, to be published during this Parliament. This will include exploring the feasibility of increased access onto unregulated waterways. | In progress |
| 270 | Launch an accreditation model by April 2026 for towns and cities to improve urban greening and access to green and blue space in areas with high environmental and social need. Ensure that up to 10 towns and cities achieve accreditation by the end of 2026. | In progress |
| 271 | Repeal the cut-off date for recording historic rights of way by 2031. | Not started – on track |
| 272 | Provide advice on applying the accessible green space and urban greening factor standards as part of the green belt golden rules set out in the National Policy Planning Framework, to ensure that new residents in developments from 2025 can access good-quality green and blue spaces. | In progress |
| 273 | Work with 100 local authorities and developers to embed Natural England’s Green Infrastructure Framework in development designs and planning decisions. | In progress |
| 274 | Identify how best to improve the quality and sustainability of parks and green spaces, including issues relating to planning, finance and inclusion, by working with third sector stakeholders. | In progress |
| 275 | Refresh the Green Flag Award scheme by 2026 to allow for a greater focus on biodiversity, addressing local environmental and health priorities and increasing community empowerment. | In progress |
| 276 | Provide financial support to landowners and land managers using grants to improve access to nature through environmental land management schemes, the England Woodland Creation Offer and the Community Forests and Woodland Creation Partnerships. | In progress |
| 277 | Develop indicators to measure the impact of the green infrastructure standards by the end of 2026. | In progress |
| 278 | Strengthen legislation to give National Parks and National Landscapes a clear mandate to widen the public’s access to nature by the end of this Parliament. | In progress |
| 279 | Extend our Access for All programme to include National Trails from 2025. This will support accessibility infrastructure in the countryside such as improved paths, installation of disabled toilets and replacement of stiles with accessible alternatives. | Completed |
| 280 | Champion Protected Landscapes by refreshing our national vision for these special places, eliminating bureaucratic barriers and ensuring teams have the tools and resources to achieve our ambitions. Publish further details on supporting access to woodlands in a new Trees Action Plan, to be published in 2026. | In progress |
| 281 | Publish further details on supporting access to woodlands in a new Trees Action Plan, to be published in 2026. | In progress |
| 282 | Develop and publish Nature Community Principles and underpinning standards for engaging communities with nature in 2026. | In progress |
| 283 | Deliver a new National Trail along the route of the Coast-to-Coast path by spring 2026. | Completed |
| 284 | Complete delivery of the King Charles III England Coast Path by spring 2026. | In progress |
| 285 | Create new publicly accessible woodlands, as part of the government’s tree canopy and woodland cover target, through expansion of the Public Forest Estate, with over 780 hectares of woodland added to the Public Forest Estate by the end of 2026. | In progress |
| 286 | Create better facilities and infrastructure in the Public Forest Estate to increase the numbers of visitors and improve their experience. This includes investing £3 million in the financial year 2025 to 2026 in access for all facilities, such as accessible bike trails, all-terrain mobility scooters for hire and new changing facilities. | In progress |
| 287 | Extend the delivery of our Farming in Protected Landscapes (FiPL) programme to the end of March 2026, enabling farmers to support nature recovery and improve responsible access to landscapes. | Completed The FiPL programme was extended to March 2029. |
| 288 | Invest £1.5 million fishing licence income annually from 2025 to the end of 2028 to deliver partnership projects which support and promote access to angling while contributing to nature recovery across England’s water bodies. | In progress |
| 289 | Work with more education providers to add their grounds to a virtual National Education Nature Park (NENP). NENP brings together education providers to improve their sites for nature, participate in activities and learning, and contribute to community science. 25% of all schools are already engaged, nearly 3,500 settings have mapped more than 14 million square meters of habitat. | In progress |
| 290 | Work with all education settings to develop a holistic climate action plan which will include engaging young people in nature and enhancing the biodiversity of their sites. | In progress |
| 291 | Work with land managers and owners to offer educational visits to woodland, farmland and the countryside. | In progress |
| 292 | Evaluate the health and wellbeing benefits to pupils of increased green infrastructure in new school buildings, including biophilic pilot schools, with an evaluation starting in 2026. | In progress |
| 293 | Develop a new GCSE in natural history to give young people the opportunity to learn about the natural world. The GCSE will help young people understand and respect the natural world and contribute to its protection and conservation. | In progress |
| 294 | Enhance the climate education content which is already present in the national curriculum in the subjects of geography, science and citizenship, and include sustainability within the design and technology programme of study. Ensure that the relevant programmes of study introduce key concepts on climate education at primary level and make citizenship compulsory in key stages 1 and 2, ensuring primary aged children are introduced to key climate education content. | In progress |
| 295 | Protect marine historic landscape and historic sites such as heritage coasts and protected wreck sites, when implementing marine plans, in line with the UK marine policy statement. These marine plans guide and direct licensing decisions in the waters adjacent to England, ensuring that developers must conserve and protect heritage assets. | In progress |
| 296 | Improve the condition of natural and cultural heritage, through an integrated approach with other action on nature, including through the delivery of agri-environment schemes, and the National Lottery Heritage Fund’s Heritage 2033 strategy. | In progress |
| 297 | Protect and conserve the historic environment, through the collation and sharing of national data sets and sensitivity maps, including working with 47% of all local authorities by the end of 2026. This work will allow information sharing on non-designated heritage assets, which will inform decisions on land management activities, for example tree planting or felling. | In progress |
| 298 | Provide Protected Landscape teams training and resources on building partnerships with diverse and underrepresented groups and collect data on the diversity of visitor groups to National Parks and National Landscapes to inform where outreach needs to be targeted by April 2026. | Completed |
| 299 | Update Landscape and seascape character assessments advice by the end of 2026 to better inform future landscape and seascape change and help deliver the Land Use Framework. | In progress |
| 300 | Complete the King’s Series of 25 new or large extensions to National Nature Reserves (NNRs) by 2028. | In progress |
| 301 | Mentor and support partnerships of business, communities, Non-Government Organisations (NGOs), and others who manage existing and aspiring UNESCO Global Geoparks, through contribution to the quality assurance and evaluation process, including new applications from the Charnwood Forest Aspiring Geopark and the Cross-Channel/Transmanche Aspiring Geopark in 2026. | In progress |
| 302 | Deliver multifunctional benefits from England’s land, such as enhanced natural and cultural heritage, by reviewing implementation of the Council of Europe’s Landscape Convention by end of 2026. | In progress |
| 303 | Achieve a year-on-year reduction in the number of heritage assets on the Heritage at Risk register through Defra’s existing Environmental Land Management schemes, the development of future farming schemes and Natural England’s work in NNRs. | In progress |
| 304 | Publish an evaluation framework by April 2026 to improve how health and wellbeing outcomes from outdoor interventions are evaluated and included in decision making across sectors. | Completed The Evaluation Framework in March 2026. |
| 305 | Publish an evaluation report of phase 2 of the Green Social Prescribing programme by spring 2026. The report will build on findings from the previous evaluation and deepen understanding of value for money, data tracking through the GSP pathway, and explore sustainable funding options. Update: The evaluation report for Phase 2 of the GSP programme has been delayed slightly, reflecting the time required for final review and alignment with the external evaluation partner. Publication is expected shortly. |
Off track |
| 306 | Establish a metric on the number of people accessing green or blue space for nature-based activity specifically to improve health by March 2026, helping to track the impact of Green Social Prescribing. Update: Defra and Natural England commissioned the National Academy for Social Prescribing (NASP) and the National Centre for Social Prescribing Data Analysis at University College London to assess the suitability of electronic health record data for tracking usage of GSP codes within routine GP practice. A report was submitted in March 2026 with findings and recommendations. In summary, the data we have access to and complex reporting on healthcare means that we need more time to investigate whether a metric is viable and identify alternative data sources that could be used such as Natural England’s People and Nature Survey (PaNS). This action is on track but will require a further 6 months to explore the complex challenges. A new deadline is set for the end of this calendar year (December 2026). |
Off track |
| 307 | Create a nature for health investment partnership by the end of 2026 to develop investment pathways to create new markets and drive integrated funding models for nature-based solutions that deliver health benefits and economic growth. | In progress |
| 308 | Create a nature for health investment partnership by the end of 2026 to develop investment pathways to create new markets and drive integrated funding models for nature-based solutions that deliver health benefits and economic growth. | In progress |
| 309 | Define the Land Use Unit’s role and scope. Responsible: Defra | New 2026 |
| 310 | Establish a proportionate monitoring approach. Responsible: Defra | New 2026 |
Annex 2: Full list of statutory and interim Environment Act targets contributing to EIP25 Goals
Goal 1: Restored nature
The statutory Environment Act 2021 targets for restoring nature are:
- halt the decline in species abundance by 2030
- increase species abundance so that by 2042 it is greater than in 2022 and at least 10% greater than in 2030
-
improve the Red List Index for England for species extinction by 2042 compared to 2022 level
- restore or create more than 500,000 hectares of a range of wildlife-rich habitats outside protected sites by 2042
- increase tree canopy and woodland cover to at least 16.5% of total land area by 2050
- ensure that at least 70% of protected features in Marine Protected Areas (MPAs) are in favourable condition by the end of 2042, with the remainder in recovering condition
We have set the following interim targets for restoring nature:
- restore or create a total of 250,000 hectares of a range of wildlife-rich habitats outside of protected sites by December 2030
- by December 2030, 50% of Site of Special Scientific Interest (SSSI) features to have actions on track to achieve favourable condition
- by 2030, double the number of farms providing sufficient year-round resources for farm wildlife, compared with 2025
- reduce the rate of establishment of invasive non-native species (INNS) by at least 50% by December 2030, compared to 2000 levels (see also Biosecurity goal)
- increase England’s tree canopy and woodland cover by 0.33% of land area by December 2030 from the 2022 baseline of 14.9%. (Equivalent to a net increase 43,000 hectares)
- at least 49% of Marine Protected Area (MPA) protected features are in favourable condition and at least 46% in recovering condition, by December 2030
Goal 2: Air
The statutory Environment Act 2021 targets for PM2.5 in air are:
- to achieve at least a 35% reduction in population exposure to PM2.5 by 31 December 2040 compared to 2018 levels
- by 31 December 2040 the maximum annual mean level of PM2.5 in ambient air must be equal to or less than 10 micrograms per cubic metre
We have set the following updated interim targets for PM2.5 in air:
- an annual mean concentration target of 10 micrograms per cubic metre to be achieved by December 2030
- a population exposure reduction target of 30% compared to 2018 to be achieved by December 2030
Goal 3: Water
The statutory Environment Act 2021 targets for water are:
- halve the length of rivers polluted by harmful metals from abandoned metal mines by 2038, against a baseline of 1,491km
- reduce total nitrogen, total phosphorus and sediment pollution from agriculture into the water environment by at least 40% by 2038, compared to a 2018 baseline
- reduce phosphorus loadings from treated wastewater by 80% by 2038 against a 2020 baseline
- reduce the use of public water supply in England per head of population by 20% by 2038 from a 2019 to 2020 baseline
We have set the following updated interim targets for water:
- construct 8 mine water treatment schemes and 20 diffuse interventions commitments to control inputs of target substances to rivers, and complete 55 catchment studies by December 2030
- reduce total nitrogen, phosphorus and sediment pollution from agriculture to the water environment by at least 12% by December 2030 compared to a 2018 baseline
- reduce total nitrogen, phosphorus and sediment pollution from agriculture to the water environment by at least 18% in catchments containing protected sites in unfavourable condition due to nutrient pollution by December 2030
- reduce phosphorus loadings from treated wastewater by 55% by December 2030 against a 2020 baseline
- reduce the use of public water supply in England per head of population from a 2019 to 2020 baseline by 9% by 31 March 2027 -reduce the use of public water supply in England per head of population from a 2019 to 2020 baseline by 14% by 31 March 2032
- reduce leakage by 20% from a 2017 to 2018 baseline by 31 March 2027
- reduce leakage from a 2017 to 2018 baseline by 30% by 31 March 2032
Goal 5: Waste
The statutory Environment Act 2021 target for waste is:
- by 31 December 2042, the total mass of residual waste excluding major mineral waste for the calendar year 2042 does not exceed 287kg per capita, this is roughly the same as a 50% reduction from 2019 levels
We have set the following updated interim targets for waste:
-
by December 2030, the total mass of residual waste excluding major mineral waste in the most recent full calendar year does not exceed 437kg per capita (24% reduction)
-
by December 2030, the total mass of residual waste excluding major mineral waste in the most recent full calendar year does not exceed 25.5 million tonnes (21% reduction)
- by December 2030, the total mass of residual municipal waste in the most recent full calendar year does not exceed 333kg per capita (29% reduction)
- by December 2030, the total mass of residual municipal food waste in the most recent full calendar year does not exceed 64kg per capita (50% reduction)
- by December 2030, the total mass of residual municipal plastic waste in the most recent full calendar year does not exceed 42kg per capita (45% reduction)
- by December 2030, the total mass of residual municipal paper and card waste in the most recent full calendar year does not exceed 74kg per capita (26% reduction)
- by December 2030, the total mass of residual municipal metal waste in the most recent full calendar year does not exceed 10kg per capita (42% reduction)
- by December 2030, the total mass of residual municipal glass waste in the most recent full calendar year does not exceed 7kg per capita (48% reduction)
Goal 9: Biosecurity
The following interim target is important for delivering both restored nature and biosecurity outcomes:
- reduce the rate of establishment of invasive non-native species (INNS) by at least 50% by December 2030, compared to 2000 levels