Young people and work: interim report
Updated 10 August 2026

© Crown copyright 2026
This publication is licensed under the terms of the Open Government Licence v3.0 except where otherwise stated. To view this licence, visit nationalarchives.gov.uk/doc/open-government-licence/version/3 or write to the Information Policy Team, The National Archives, Kew, London TW9 4DU, or email: psi@nationalarchives.gov.uk.
Where we have identified any third party copyright information you will need to obtain permission from the copyright holders concerned.
This publication is available at https://www.gov.uk/government/publications/young-people-and-work-interim-report/young-people-and-work-interim-report
Foreword
One million lives.
Nearly one million young people aged 16 to 24 in the United Kingdom are not in education, employment or training. One in 8 young people. And rising. Behind the statistics lie individual lives: aspirations thwarted, opportunities lost, futures placed on hold.
Numbers on that scale should command national attention in their own right. Too often they haven’t. The NEET rate has barely crept below 10% in 25 years. What should have been treated as an urgent national crisis has been absorbed into the background noise of public life.
That tolerance is no longer acceptable.
This Review exists because today Britain faces a generational fault line. Britain not only has a chronic problem. It is one that is getting worse not better. It is no longer simply a question of temporary youth unemployment. Today the deeper problem is youth detachment from the labour market. Nearly 60% of young people who are NEET now are economically inactive. They are not just out of work. They are not looking for work.
Shockingly, 6 in 10 young people who are NEET today have never had a job, up from 4 in 10 in 2005. At the very point when they should be starting adult life, gaining confidence, building skills, learning the habits of work and taking their first steps towards independence, too many are becoming detached from education and employment altogether. We are at risk of a lost generation.
That is a moral crisis. It has economic consequences. Every month a young person spends detached from education or work adds cost. Cost to them, above all else. To their confidence. Their health. Cost to their future income. Of today’s 24-year-old NEETs, 45% have never had a job. We estimate that even if they re-enter the labour market, they will lose up to £300,000 in earnings over their lifetime as a result. There is a long-term scarring effect which being NEET exacts on a young life.
And then there is the cost to the taxpayer and to the economy. The longer a young person is outside work or learning, the harder and more expensive it becomes to help them back. In this Review we estimate the cumulative annual cost to our country of almost 1 million NEET young people at £125 billion. That is more than we spend on education each year. The question is no longer whether the current position is affordable. It is whether it is sustainable.
Youth disengagement is fast becoming a strategic economic risk for Britain. We cannot complain about labour shortages, low growth, rising welfare costs and pressure on public services while allowing the talent of nearly one million young people to go to waste. As an ageing population becomes increasingly reliant on the next generation to sustain it, every young person has to have more opportunities to learn or earn.
This review unashamedly extols the virtues of work. Not any work, at any price, under any conditions. But good work. Work that gives structure to the day, purpose to the week, confidence to the person and contribution to the country. Work is not only about income, although income matters. It is about connection. It is about self-respect. It is about independence. For young people especially, the first steps into work are often the first steps into adult life.
I start from a simple proposition. Every young person has something to give: a skill, an aptitude, a potential. No young person should be written off because of where they start in life: the family they are born into, the school they attend, the health condition they have, or the barriers they face. The NEET problem is grounded in social disadvantage. The people and places that suffer most are too often those with the least. The risk factors for becoming NEET as a young person are well-known. We document them in this report. But risks can be overcome. Becoming NEET does not have to be inevitable.
Other countries prove what is possible. A decade ago, our NEET rate was closer to the average of European Union countries. Today, Britain is an outlier. By 2025, only Romania recorded a higher youth NEET rate. While we have tumbled down the league table, other countries have improved. That should also tell us that this problem can be solved. But only if we change course.
To do so we have to understand what is causing the UK’s chronic NEET problem to worsen in the first place. That is what this diagnostic report seeks to do. There is no singular explanation. But there is one stand-out change. Over the past decade, the proportion who say they are NEET due to a work-limiting health condition has increased by 70%. The proportion of disabled NEETs citing mental health as their primary condition has almost doubled to more than four in ten. Among disabled NEET young people, anxiety, depression, neurodevelopmental conditions and other forms of distress are no longer peripheral factors. They are among its defining features.
Once health-related inactivity takes hold, it sticks. That’s what makes the problem different and worse than before. Of those who fell into health-related economic inactivity between 2017 and 2019, almost eight in ten were still NEET more than two years later. Successive cohorts of young people are doing worse than their predecessors. A young person first claiming health and disability benefits in 2019 is a third more likely to be NEET 5 years later than those who first claimed in 2010. Today around seven in 10 young people claiming a health and disability benefit are still claiming a decade later. The damage done to the life chances of these young people is almost incalculable.
This is now an interlocked health, disability and participation issue. The sharp rise in young people suffering ill-health has coincided with another shift, in the labour market, to create a perfect storm and a national crisis of opportunity. The youth share of the labour market has decreased even as employment overall has increased. Entry-level roles have become less plentiful and more demanding. Recruitment has become more remote, more automated and less human. The young person who once might have walked into a shop, spoken to a manager and been given a chance in the past is now screened by a portal, a test, a recorded interview or an algorithm before anyone has looked them in the eye. Apprenticeship starts for young people have declined by over 40%. In other words, the first rungs on the old career ladder have weakened.
For too long, public policy has treated youth disengagement mainly as a supply-side problem. The answer has been to make young people more employable: more skills, more CV support, more job search, more benefits conditionality. Those things matter. But they are not enough if the labour market itself is no longer reliably bringing young people in. Better-prepared young people arriving at a labour market that has thinned its entry routes will still be left outside. It is striking that of the NEET population, nearly 30% are now getting good GCSEs or equivalent, over 21% have a Level 3 qualification and 15% have a degree. Yet the labour market is not absorbing them. There is evidence of a structural weakening of the transition into work.
Part of the reason this has not had enough focus is that the labour market doing less has been, in part, compensated for by the education system doing more. But over recent years the education ‘shock absorber’ has weakened. Overall, by age 18, a lower proportion of young people were in education or apprenticeships in 2024 than 10 years earlier. Of those who were, more were in higher education and fewer in further education or apprenticeships, even though the latter two routes are the ones that are most accessible to the potentially NEET cohort. More young people are being exposed to the risk of becoming NEET as a result.
In other words, the demand side matters as much as the supply side. That is why it is a core focus of this Report. When I have engaged with employers over these last few months, I encountered an overwhelming enthusiasm to do more to address the NEET crisis. But willingness was tempered with concern. Employers described a growing pastoral burden. They talk of a generation that is less work-ready. Many young people arrive in the workplace with anxiety, low confidence and, in some cases, health needs employers do not feel equipped to support. A large employer may be able to absorb that. A small firm often cannot. The result is caution. The safer hire is the older worker with experience. The young person with potential but no track record loses out.
If employers are being asked to take on more of the work of induction, confidence-building and support, they need a system around them that makes doing so easier, not harder. Taking on a young person is always a risk for an employer, precisely because they are unproven. If public policy aims to increase youth participation, it has to minimise risks and maximise incentives. Policies have to be judged through a participation lens.
Running through every conversation conducted by this Review - whether with employers, mayors or charities – and in every part of the country, was the same diagnosis. There is neither a system nor a plan to increase youth participation. Worse than that: the institutions that were designed for a different era, a different cohort and a different set of problems, are now escalating rather than defusing the NEET crisis.
Time and again the system from education through health to welfare fails to enable labour market participation. Instead, all too often it ends up putting young people on a path to a life on benefits. These faultlines are limiting the opportunities for too many young people to learn or earn.
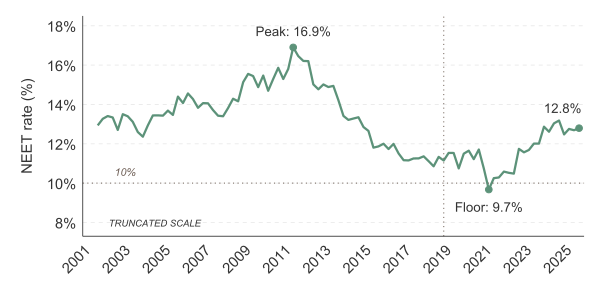
Education should be the bridge between childhood and the world of work. For many young people it is. There are excellent schools, colleges and teachers doing remarkable work. Good qualifications are still one of the best defences against a young person becoming NEET. But for too many of those most at risk, the system does not provide the foundations they need. It knows early who is likely to struggle. Becoming NEET does not start at age 16. Children who are not school-ready at ages 4 to 5 are nearly 3 times as likely to be NEET at ages 16 to 17. It sees absence, poor attainment, SEND, family adversity and disengagement. But too often it acts too late, or not at all. Schools - like colleges - are measured overwhelmingly on attainment, not on outcomes. Ensuring fewer young people leave school at risk of becoming NEET depends on getting the right balance in the school curriculum and the right exposure to work experience and careers guidance. That balance is still not right. Careers guidance has improved, but remains too unequal. Work experience is too often an afterthought. The young people who most need exposure to work are the least likely to receive it.
If the school and college system does not have labour market participation as a sufficiently core objective, the same is true in spades for the health system. Ill-health is now a primary driver of who becomes NEET and who stays NEET. For the first time in perhaps two centuries, changes in health, especially mental health, are impeding economic growth and causing a contraction in the supply of labour. All too often the way the NHS works inhibits rather than enables participation. The NHS treats symptoms. But for too many young people, diagnosis, treatment and discharge do not lead back to education, training or work. They are being categorised as unfit to work not least through the fit note process, when with help, support and earlier intervention, they would be able to do so. As thousands of disabled people prove every day, it is entirely possible to have a diagnosis and a disability and still be able to participate with the right support. All too often a diagnosis becomes a gateway into the health and welfare system and to a life outside the labour market. Instead of assuming that people with a diagnosis cannot participate, the first question the system should be asking is what can they do and how can it enable that to happen.
The welfare system must always protect those who cannot work and provide proper financial security for people with severe or enduring disabilities. That is non-negotiable. But for young people who could participate with the right support, the welfare system should be more than a safety net. It should be a springboard. Today it is not. It is focussed more on income replacement than enabling people towards participation. The benefits system is founded on a deficit model of disability, one that pays for what a young person cannot do rather than investing in what they could become. Analysis for this Review has revealed that of the young people who are NEET in England, only around one in five are getting meaningful employment support from the welfare system. Less than half of the total £8.1 billion currently spent on key benefits for young people aged 16 to 24 years old has any participation support or requirements attached to it. For a young person with a health condition who is unemployed and potentially seeking work, taking a pathway to inactivity can offer higher income, less hassle and lower risk. This is a perverse incentive. It is the polar opposite of what a participation-first welfare system should be providing and means more and more people are being trapped on benefits. Perhaps unsurprisingly their employment prospects are deteriorating as a result. Today, of those who first claimed a health and disability benefit aged 16 to 24 almost half are not in work or education fifteen years later. This is a catastrophic failure.
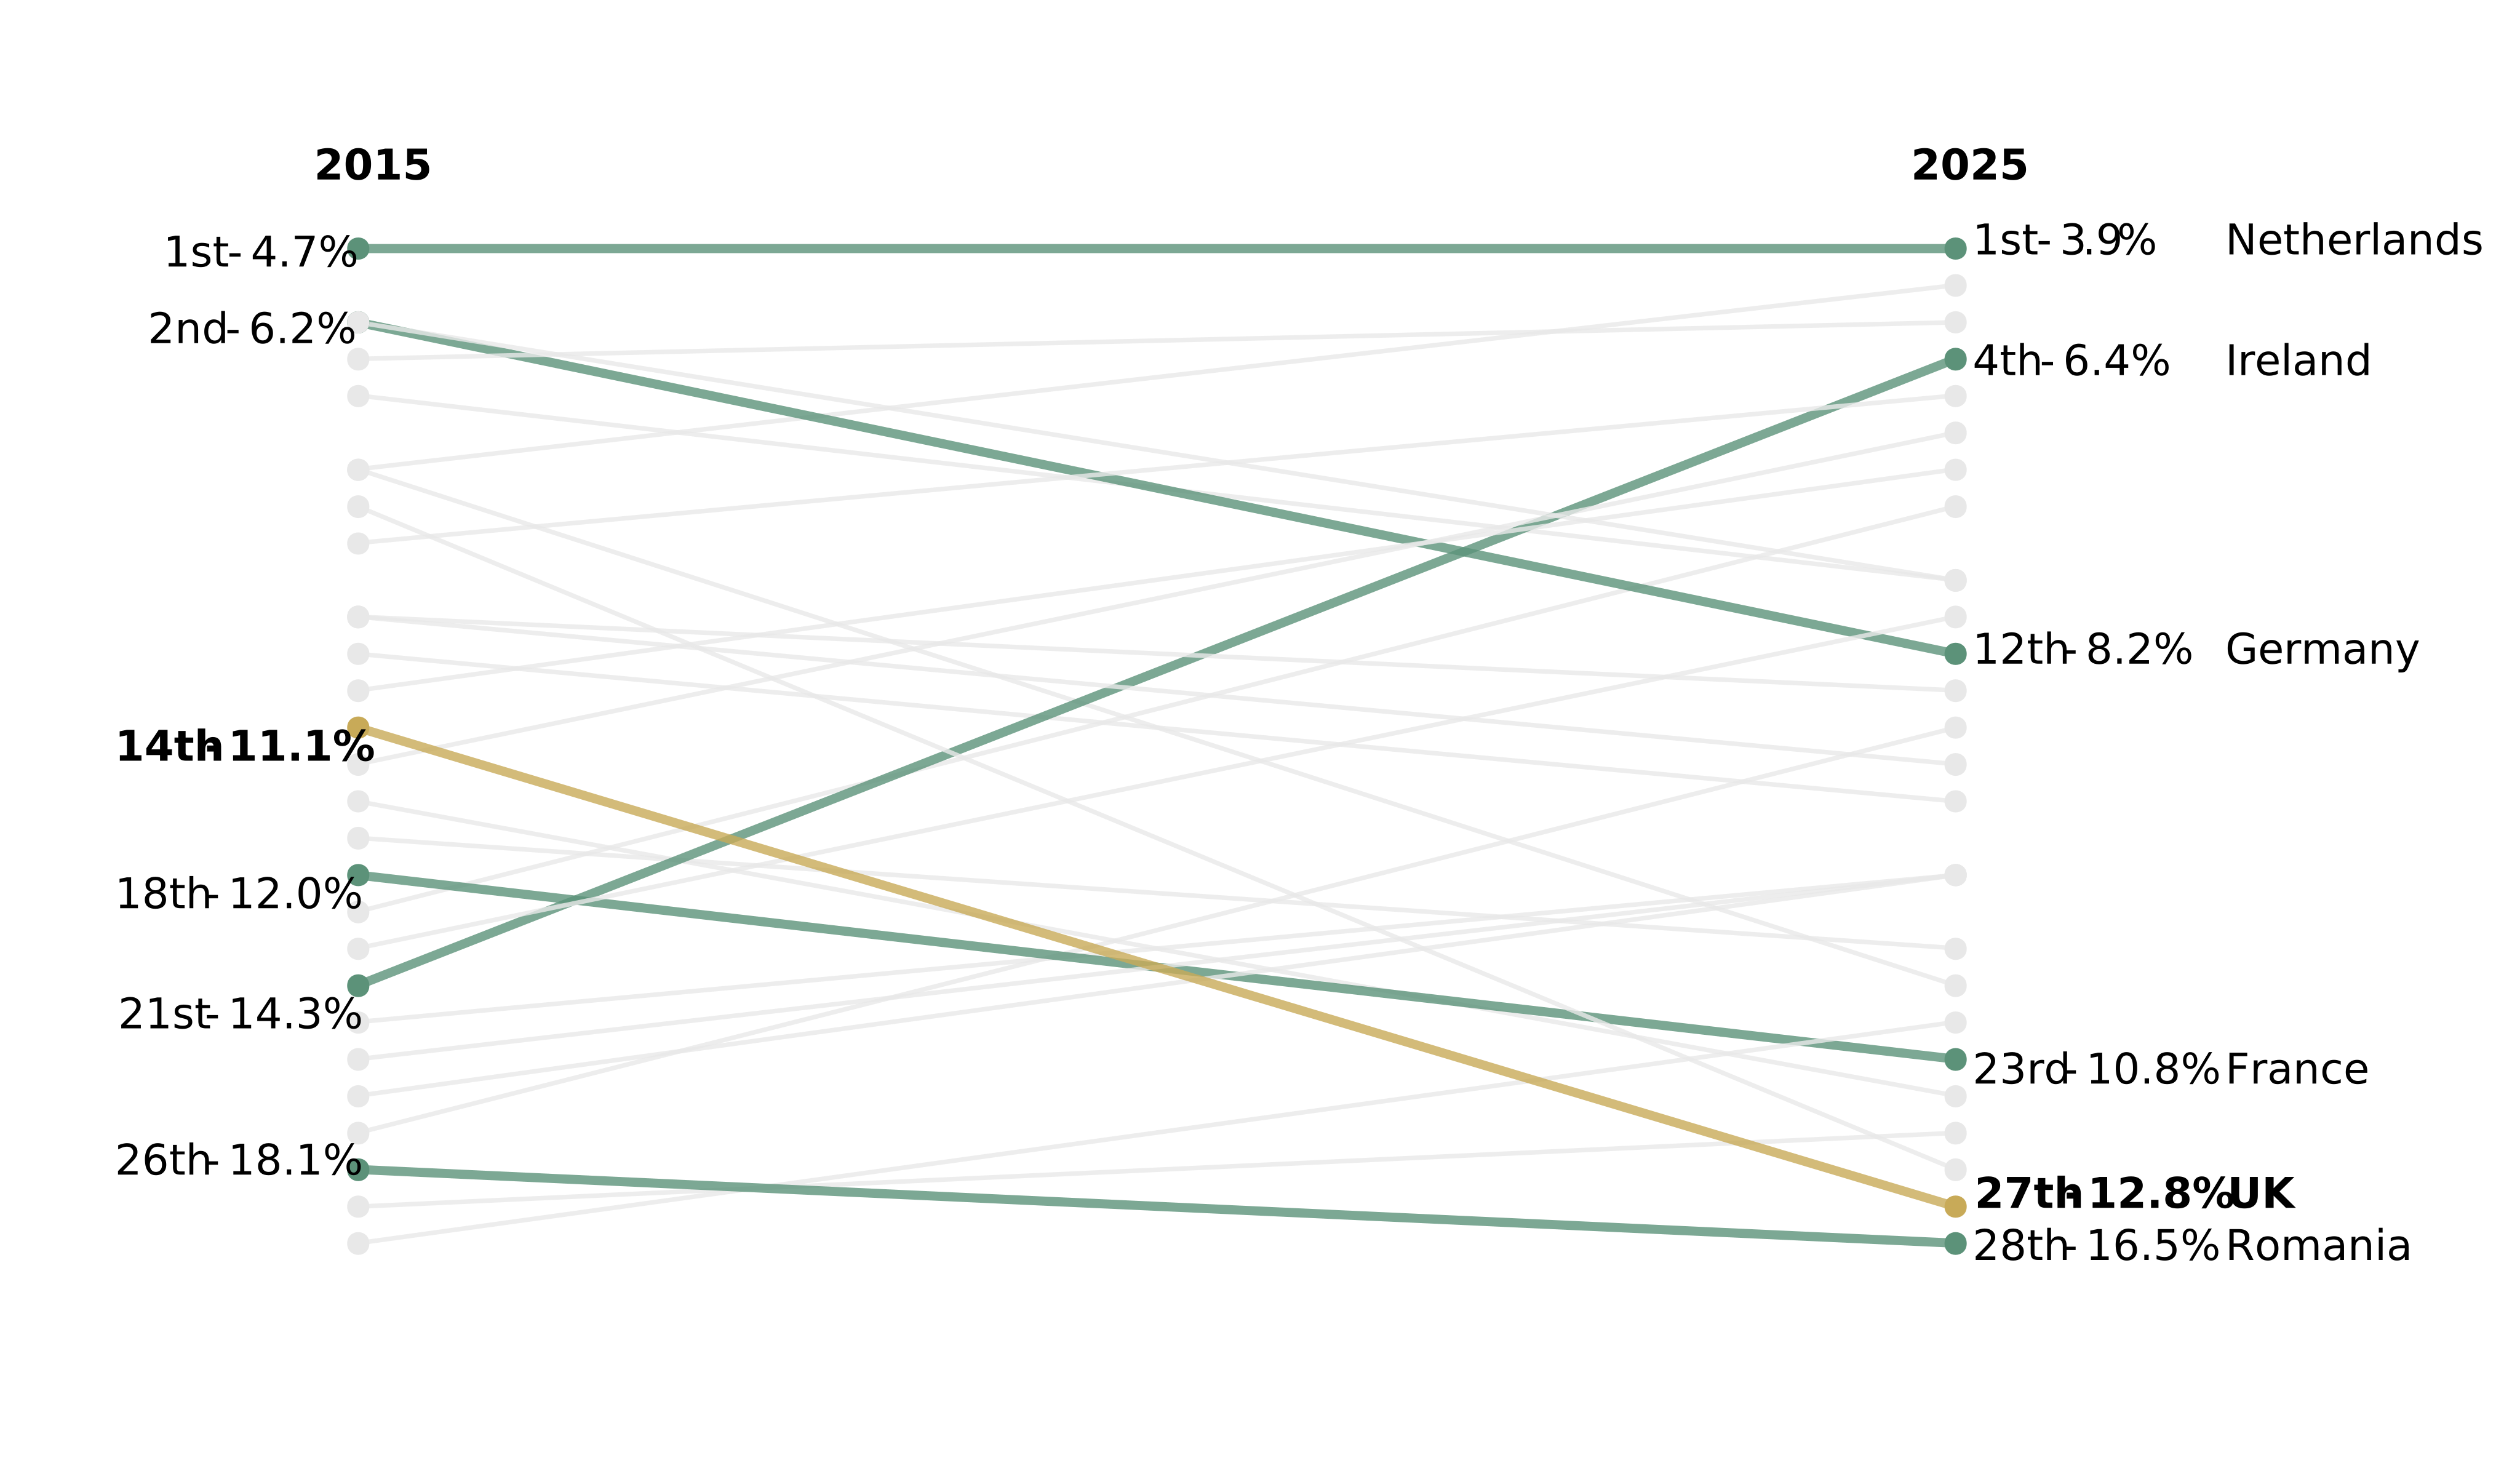
It is obvious from this assessment that reform is long overdue. In education, skills, health, and welfare. There is much focus on the latter, but welfare reform without wider state reform will not deliver the goods for this generation. The same is true for labour market reform. A whole system reset is needed.
The conclusion I have reached is stark. Britain has institutions for young people, but it does not have a participation system that is capable of taking young people from the world of education into the world of work. The labour market does not provide enough early entry opportunities. The education system produces qualifications but does not guarantee transitions. The health system is configured for treatment, not participation. The welfare system replaces income but does not build pathways.
Responsibility is dispersed across many organisations. But there is no shared accountability and no clear governing philosophy. Confusion reigns between what happens nationally and what is owned locally. Data is not shared. No amount of reform to individual policy areas or institutions alone will fix this. The architecture itself is the problem.
The incentive structure reinforces the problem. A school is recognised, regulated and rewarded for examination results, not on where the student ends up. The same is true of a college. The money it attracts is dependent on student numbers, retention and completion, rather than sustained outcomes beyond it. Health services are rewarded for activity but not outcomes. The welfare system compounds this. It measures incapacity. It does not plan for capability.
Young people fall through these structural faultlines. One of the most troubling findings of this Review is how many are hidden from the very systems meant to help them. In England alone in 2023/24, around 314,000 18 to 24-year-olds were neither in work nor in education and are not themselves receiving benefits. They are out of work and out of sight. No institution is responsible for finding them or helping them. A system serious about participation would know who these young people are. Ours does not.
What I find hardest to accept is that we often know enough to act earlier. Risk is identified early. Poor school readiness, persistent absence, low attainment, SEND, family adversity, poor mental health and weak exposure to work are not mysteries. These are signals that are seen. They are recorded. Often, they are measured. But they are not acted on. No one is accountable for what happens next. And to compound the felony, prevention has been cut at every level: early years, public health, youth services, further education. What has grown is crisis spending: late intervention and income replacement. The tragedy is that we are paying more to manage the consequences of disengagement than being prepared to invest in preventing it. We end up spending more to achieve less.
This is a whole system failure. And the price is paid by a generation of young people. Overwhelmingly they want to work. In a survey carried out for this review, 84% of NEET young people said they want to find a job, education or training. I do not accept the caricature of a generation that is not interested in employment. I do not accept that mental health is simply an excuse. Nor do I accept that the answer is to tell young people who are struggling simply to try harder. These are myths. Sometimes cruel ones. Young people are not to blame. Institutions that should have provided opportunities to them are the ones that have failed.
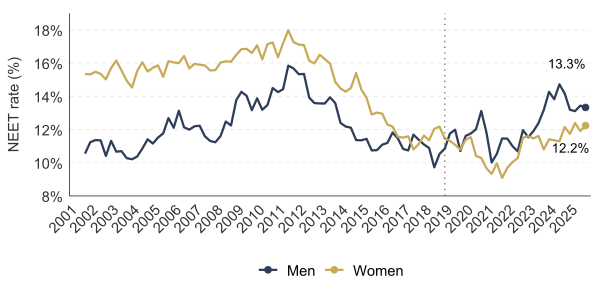
During this review I have spent months with the evidence. But I did not find the truth of this issue only in data tables or research papers. I found it in communities. I sat with young people in youth hubs, colleges, voluntary sector drop-ins and community organisations. Their voices are not an appendix to this Review. They are part of the evidence. I heard young people describe applying for dozens, sometimes hundreds, of jobs and hearing nothing back. I heard about interviews followed by silence, automated rejections months later, and entry-level jobs that somehow required previous experience. What I heard, more often than not, was effort matched with frustration. Young people were trying. They were tired of being ignored, tired of being rejected, and tired of being judged by people who had not listened to them.
It is hard not to be pessimistic when you examine the data. But the reason to be optimistic is young people themselves. In almost every conversation I had, there was an interest, a passion, a talent just under the surface. A young person who wanted to work with children. Another who wanted to care for older people. Another who had taught herself how to build a business online. Another who wanted to make things, fix things, design things, help people. Too often those strengths had gone unnoticed and overshadowed by the labels attached to them: absent, anxious, difficult, behind, disabled, care-experienced, NEET.
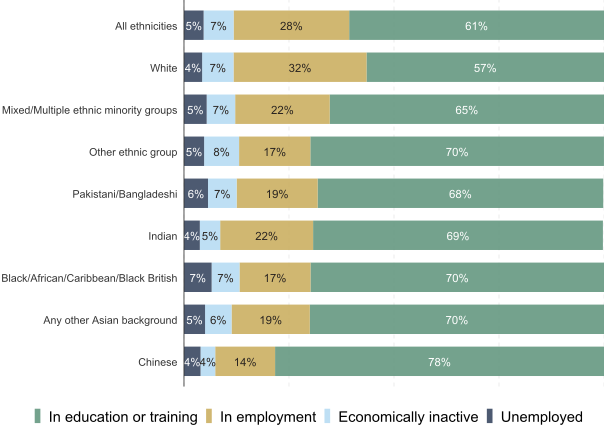
The question is not whether young people are different today. They are. Not worse. Not less intelligent or less capable. But different because they have grown up in different conditions. A new digital world in which they live so much of their lives. And a pandemic that hit them hard and amplified the greater anxiety they were already feeling. But the NEETs crisis is just the tip of a far bigger iceberg. Wherever I have been and whoever I have talked to about this issue over these last months, I have encountered a concern, bordering on a fear, across our country about what the future holds for the next generation as a whole. Parents are more worried than ever. Grandparents too. About their youngsters’ prospects for a job, a home, a decent future. For decades in Britain, the foundation of our unwritten social contract has been that each generation would be able to do better than the last. That great British promise for this generation is being broken.
Our job is to fix it. The question is whether we are willing to embrace what is different about today’s generation and meet them where they are, rather than where we wish they were. Every previous generation was different from the one before it. The systems that existed to transport them from the world of education into the world of work had to adapt. This time, they have not. That is not a failure of young people, but a failure of a system stuck in the past.
It would be easier to blame one thing: covid, smartphones, benefits, schools, employers, parents or young people themselves. The evidence does not support a single explanation. It supports something harder to accept: that the institutions we built to support young people into adulthood are no longer fit for that purpose, and that the country has known this for some time.
None of this is to argue that personal responsibility does not matter. Effort matters. Habits matter. Families matter. Families are not a peripheral influence but are central. The roots of youth disengagement are formed well before the end of the school years. The state and the market cannot do all the heavy lifting to give young people the best chance in life. Nor should they be expected to do so. Parents have responsibilities too. Young people have the same. Aspiration is not something that can be gifted to them. Governments and employers can do more to help young people succeed. But young people and their parents have to contribute too. They have agency and obligations. But it is dishonest to pretend that individual effort alone can overcome systems that are badly designed, poorly connected and, too often, indifferent to whether young people actually make it into sustained participation.
If we go on as we have been doing the NEET problem will only deepen and grow. Forecasting conducted for this Report suggests that the NEET rate could increase to over 16%, or more than 1.25 million young people not fully able to participate in society, within 5 years. That is not a price we can ask those young people to pay.
This interim report does not pretend to contain the final answer. It is a diagnosis. It sets out who young people who are NEET are, what they face, why the systems around them fail, and what the consequences are. It follows the journey from risk to detachment: through family and early years, school and skills, the labour market, health, welfare and the architecture that is meant to join them together. Too much past policy has leapt to programmes before facing the deeper design failure beneath them. The final report will set out what a coherent participation system for early adulthood should look like.
Britain has had no shortage of initiatives. Many have helped the individuals they reached. Some have been excellent. But none has altered the architecture that produces sustained disengagement. Another short-term programme layered on top of fragmentation will not be enough. We need to change the way the system works.
The old Welfare State was built for a different age. It was designed to protect people against the risks of unemployment, sickness and poverty. That mission remains vital. But for this generation it is not sufficient. The task now is to build a Working State: one that protects those who cannot work but actively enables every young person who can participate to do so. One that does not wait for young people to fail before it intervenes. It must ask less often, “what can’t you do?” and far more often “what would help you take the next step?”
Government cannot solve this crisis alone. Employers, schools, colleges, health services, councils, mayors, charities, families and young people themselves all have a role to. But only government can set the architecture, incentives and accountability that allow those efforts to add up to a system. One that increases opportunities for every young person to be able to learn or earn.
This is a generational challenge. Our country’s future rests on the next generation. We all have a responsibility to ensure they are set up to succeed. Young people have not given up on work. We must not give up on them.
Introduction: The review
1. It is a generational fault line that nearly one million young people aged 16 to 24 in the UK are not in education, employment or training. The proportion has only once fallen below 10% in the past 25 years. The risk of a lost generation has prompted the government to act. Through the Get Britain Working White Paper it established the Youth Guarantee and is investing in Pathways to Work and the Right to Try. But the scale and complexity of the challenge requires a broader and more integrated response: one that bridges education, skills, health, employment, and welfare systems and draws on both public and private sector innovation. That is why the Secretary of State for Work and Pensions, supported by the Secretaries of State for Health and Social Care and for Education, commissioned this independent review into the drivers of youth economic inactivity, with a particular focus on young people with health conditions and disabilities.
2. I was asked to analyse the trends and drivers behind the recent rise in young people who are NEET, economically inactive and claiming health and disability benefits. To identify how the interaction between education, health and employment systems may be contributing to poor transitions into the labour market. To assess the effectiveness of current interventions. To explore the fiscal and productivity implications of inaction. And to propose recommendations for reform.
3. The final report I will publish later this year will set out what a coherent participation system for early adulthood should look like: who is responsible, how it is funded, what it is accountable for, and how it reaches the young people the current system fails. This interim report sets out my diagnosis and establishes why that coherent system is needed. It makes the case that the current architecture is itself the problem, and that no amount of reform to individual policy areas will fix it.
4. A note on terms. Throughout this report, the ugly phrase “NEET” refers to young people aged 16 to 24 who are not in employment, education or training. “Economic inactivity” describes those who are neither working nor looking for work. It is a statistical convention. It does not imply that these young people are not contributing to their families or communities. “The system” refers to the interconnected architecture of education, skills, welfare, health and employment services through which young people are supposed to be supported into participation in the labour market. Where policy areas discussed are devolved to Scotland, Wales or Northern Ireland, this is noted.
How I went about it
5. I was supported throughout by a project team comprising a secretariat and analytical team based in the Department for Work and Pensions, working across government with the Department for Education and the Department of Health and Social Care, and PwC, who provided analytical and strategic support. I established an expert panel drawn from across the education, skills, health, welfare, strategic authorities, labour market and youth policy sectors, as well as from industry, including representatives from major employers. I also drew on a wider community of subject matter experts. Their input has been invaluable. The content and conclusions of this Report, however, are mine.
6. We issued a public call for evidence and received submissions from local authorities, combined authorities, mayors, employers, trade bodies, charities, voluntary organisations, health bodies, education providers, young people and members of the public. We held roundtables with employers and with voluntary and community sector organisations. We convened sessions with local authority leaders, health professionals and frontline practitioners. We spoke with hundreds of young people. We drew on data analysis from across government. We commissioned new research and undertook surveys of employers, teachers and health professionals. We did the same with young people who are NEET, asking about their hopes, aspirations and barriers.
7. We applied a systems lens. We examined the supply-side systems that are supposed to passport young people from the world of education into the world of work: from parenting and early years through schools and skills, employment support and the health and welfare systems. We also looked at the demand-side: how the labour market is working, or not, for young people. This unique approach allowed us to build up for the first time a holistic assessment of what is not working and why we have almost one million young people who are NEET.
What I found
8. I have spent months with this evidence. But I did not find it only in data tables and research papers. I found it in communities, where one in five young adults are outside education and work, and where the local economy can feel like it consists of little more than a supermarket and a care home.
9. I talked to young people and heard them say the same story in different ways: a system that sees them but does not help them, that assesses them but does not support them, that refers them but does not follow them. I heard from a young man where I grew up in Newcastle’s west end who dropped out of school in his early teens, then applied for dozens of jobs and pulled himself up by his bootstraps to get qualified as a community worker so he could help other young people succeed where he had been failed. His story was not unusual. It is not the story that is sometimes told of a soft generation who lack the appetite to get a job. The story I heard most often was of endeavour, of trying, of a desire to work.
10. I heard from employers, large and small, across hospitality, retail, construction, social care and professional services. They are not hostile to young people. Many are desperate to hire them. What they described was a growing gap between what the workplace demands from day one and what a significant proportion of young applicants are equipped to provide. This gap is not the result of laziness; but of anxiety, of inexperience, of a system that may have given them qualifications, but not the chance to learn how a workplace works before being expected to perform in one. One large employer told me it had found it necessary to employ a full-time social worker to support younger staff. For smaller firms, hiring an inexperienced young worker has become a bet many cannot afford to take.
11. I heard from the voluntary sector, from the Child Poverty Action Group, from the King’s Trust, from Youth Futures Foundation, from Barnardo’s, from Disability Rights UK, from local charities like Patchwork and the Newcastle United Foundation in the North East, often running on short-term grants and shoestring budgets, doing extraordinary work with the young people the statutory system has failed to reach. They described being commissioned in isolation, without joined-up referral routes, funded year-to-year, unable to plan, unable to deliver the medium-term outcomes they know their work can produce.
12. I heard from local authority leaders and from mayors. They described a system in which responsibility is dispersed and accountability is absent. They described health boundaries that do not align with council boundaries, skills funding that flows through different geographies again, Jobcentre districts that follow yet another map. They described wanting to act but lacking the levers, the data and the funding flexibility to do so. The best of them are building local coalitions despite the system, not because of it.
13. I heard from GPs, from Child and Adolescent Mental Health Services (CAMHS) clinicians, from mental health charities, from school Special Educational Needs Coordinators (SENCOs), from further education tutors, from Jobcentre work coaches. Dedicated people. All of them are working hard within a system that is not designed for the challenge it now faces. The failure is not theirs. The failure is in what they have been given to work with.
14. And running through every conversation, in every part of the country, was the same conclusion.
What this report does
15. This interim report examines why youth NEET rates remain too high across the UK. The report traces the journey from risk to detachment.
16. It begins with the young people themselves: who they are, what they face, and why the claim that they are a ’soft generation’ does not survive contact with the evidence. It examines the labour market they are trying to enter and finds that the bottom rungs of the career ladder have been kicked away. It follows the pathway through education, health and welfare and shows how in each case there is a failure to prioritise labour market participation. It examines the institutional architecture and finds not a system but a collection of institutions operating in parallel, measuring activity but not outcomes, losing sight of hundreds of thousands of young people entirely after the age of 18. And it sets out the consequences: personal, economic and fiscal.
What this report does not do
17. This report does not yet set out solutions. Nor does it draw on what we should learn from countries with far lower NEET rates than our own. That is deliberate. They will all be covered in my next report.
18. Our country has had no shortage of programmes, pilots and initiatives. Many have worked for the individuals they reached. None has altered the architecture that produces sustained disengagement. Another set of proposals layered on top of a broken system would repeat the pattern.
19. As the review has been commissioned by the UK Government, it recognises that the UK Government only has direct control over all relevant policy levers in England. Whilst this report highlights differences in systems across the UK, the devolved picture is complex. The report does not pretend to be a detailed analysis of each country’s specific setting.
20. It also does not try to make unknowable assertions about the future. There is a live debate about the extent to which advances in technology, particularly artificial intelligence, will completely upend the labour market. I have tried to present the evidence that exists today and my challenge in the next report will be to design a system which works not only for the problems of today but is resilient to those of the future.
Devolution overview
In Wales, local welfare assistance, the careers service, health and social care and education, are all devolved matters. The UK Government is responsible for social security benefits, the National Minimum Wage and Child Benefit in Wales. The UK Government and the Welsh Government both have different powers to provide employment support in Wales. Legislative competence for employment support in Wales is reserved, meaning the UK and Welsh Government both have executive powers to establish employment support however Welsh Ministers’ powers are limited to establishing support for sections of the population as opposed to for all Welsh citizens. Social security, child maintenance and the core labour market regime remain reserved to the UK Parliament and are administered by Jobcentre Plus / DWP.
The picture differs further in Scotland, as greater powers in relation to social security are devolved, leading to Scotland‑specific payments such as the Scottish Child Payment. The Scottish Government also has broad powers to provide support for training for employment, and additional powers to provide support to help specific groups of citizens to select, obtain and retain employment.
In Northern Ireland, employment support and skills policy are largely devolved and delivered by the Northern Ireland Executive, while social security operates on a parity basis with Great Britain under UK legislation.
What I ask of the reader
21. This report is long because the problem is complex. Stay with the evidence.
22. I ask the reader not to look for the chapter that confirms what they already believe, but to follow the argument as it builds. Each chapter rests on the last. The diagnosis is cumulative. The weight of it is the point.
23. By the end of this report, the reader will know who these young people are, what they face, why the system fails them, what it costs, and where the current trajectory leads if nothing changes.
24. This report makes the case for change.
Chapter 1: who are the UK’s NEET young people?
25. This is a story of one million lives. Behind every number is a young person. This chapter sets out who they are, the risks they have faced, and how the NEET problem today differs in important respects from the past.
26. NEET is not a homogenous category. It includes young people with severe health conditions, young parents, care leavers and those with criminal records. It also includes those on gap years or waiting to start courses. What links them is that they are not currently participating in education, employment or training.
1.1 The scale of the problem
27. The UK is approaching one million young people aged 16 to 24 who are not in education, employment or training. At the end of 2025, 957,000 young people were NEET.[footnote 1] If they formed a city, it would be the third largest in the United Kingdom, larger than Leeds, Glasgow or Cardiff.
28. In the last 25 years the NEET rate peaked in 2012 at 16.9%, largely due to high long-term youth unemployment in the aftershocks of the global financial crisis. This was a time-limited peak, which eased when the economy recovered and post-16 education participation expanded.
29. During the extraordinary years of the pandemic, the headline rate fell further, reaching 9.7% in early 2021. At the time it appeared to indicate resilience, but it largely reflected the temporary effects of furlough which suppressed unemployment through unprecedented state intervention. Since 2021 the trajectory has reversed sharply. At the end of 2024 the rate rose to its highest level for a decade, 13.2%. Although this rate is below the peak of a decade ago, the NEET issue today is more entrenched because it is less responsive to cyclical economic improvements. In the sections that follow, we explain how economic inactivity has displaced unemployment for the majority of young people NEET in recent years.
30. Tellingly, the NEET rate has only fallen below 10% once in 25 years, during the Covid-19 pandemic. Not in boom or bust, not before the pandemic or after it. Britain’s NEET challenge is not cyclical. It is structural and becoming increasingly so. It is a chronic problem, and it is worsening (Figure 1).
Figure 1: The UK NEET rate, seasonally adjusted, 2001-2025
Source: Labour Force Survey
Note: dashed line indicates break in series
How the UK compares with other countries
31. The UK now sits above the average youth NEET rate for high-income countries, the EU and the OECD. In 2025 the EU average for 15 to 24-year-olds was 9%, compared with 12.8% for 16- to 24-year-olds in the UK at the end of 2025 (Figure 2). The gap is no longer just with the strongest performers. In 2014, the UK was around the European average. By 2025, only Romania recorded a higher rate. France, for example, entered the pandemic with a similar youth NEET rate to the UK, at 10.6%, but has since stabilised. The UK has not. Denmark’s 2024 NEET rate for 15–25 year-olds was 8.4%. The Netherlands’ rate for 15–24-year-olds is now around 4.1%. These are not marginal differences. The UK has moved from being an average performer to an outlier.
Figure 2: UK NEET rate performance for 16–24-year-olds relative to the European Union, 15–24-year-olds, 2015 – 2025
Source: European Commission, Eurostat, Labour Force Survey - Young people neither in employment nor in education and training (NEET), UK Labour Force Survey.
Note: Approach to measuring the NEET rate can vary across countries EU chosen as comparative base due to data availability – 15-24 rate presented.
1.2 Complexity and risk
32. Tempting though it might be to treat NEET young people as a single group, the reality is a multitude of overlapping cohorts shaped by interacting risk factors. The evidence on how those factors combine challenges the view that this is primarily about individual choices.
33. Our most comprehensive understanding of the lives of NEET young people comes from longitudinal datasets, which track individuals over their lifetime. Well-established studies such as the Impetus Youth Jobs Gap[footnote 2] and the Youth Futures Foundation and NatCen Risk Factors study[footnote 3] have found strong links between low qualifications, disability, family circumstances and NEET risk (Figure 3). The Department for Education has recently conducted similar analysis for young people born in 1998 and 1999, finding that those with Education Health and Care plans (EHCPs) or who are persistently absent from school, carried the greatest risk across the variables, while achieving less than 5 GCSEs was the most prevalent risk. Around one in three (33.6%) young people in the study had two or fewer risk factors at age 20 to 24. Around one in 10 (9.4%) had ten or more risk factors.[footnote 4]
Figure 3: Relationship between risk factors and the likelihood of becoming NEET

Source: Reproduced from the National Centre for Social Research, Risk factors for being NEET among young people, December 2023
34. Common themes emerge across the research in this space: the importance of school experiences and outcomes; that family circumstances and early disadvantage shift the starting line; and that risk factors compound in terms of both prevalence and sensitivity.
Age
35. NEET risk is not evenly distributed across the 16 to 24 age range. It rises sharply at the point where formal education participation requirements end.
36. Among 16- to 17-year-olds, the overall NEET rate in England is more than 4%, even though legislation is supposed to require all young people to be in education or some form of training. There are nearly 57,000 16–17-year-olds in England who are NEET.[footnote 5] But the proportion who are either NEET or “not known” in England ranges from 1% in Barnet to 21.5% in Dudley.[footnote 6] That variation is not explained by local labour market conditions alone and reflects differences in how young people are tracked and supported.
37. At 18 the NEET rate nearly trebles to 13%.[footnote 7] This is the first major cliff edge: the point at which statutory participation duties end, tracking of young people by local authorities largely finishes, and institutions relinquish responsibility without anyone picking it up. Among 21-year-olds in England, the rate reaches 20% and among 24-year-olds 14%.[footnote 8] Nearly 44% of all NEET young people in England are concentrated in the 22 to 24 age group.
Gender
38. In 2012, the UK female NEET rate exceeded the male rate by 1.8 percentage points. By 2024 males were 2.9 points higher, at 14.3% compared with 11.4% (Figure 4).[footnote 9] The improvement for women reflects, in significant part, the decline in teenage pregnancy, with the under-18 conception rate in England and Wales falling 66% between 2007 and 2022.[footnote 10] The reasons for the rise in NEET rates specifically for men are complex, but more health issues, the erosion of traditional employment routes, and a growing gap in educational outcomes are likely to be contributing factors, although the evidence on relative impact remains limited.
Figure 4: NEET rate by gender, seasonally adjusted, UK, 2001 - 2025
Source: Labour Force Survey
Note: dashed line represents break in series
Ethnicity
39. The ethnic profile of who becomes NEET also shows stark variation.
40. In 2024 Black, African and Caribbean young people had the highest NEET rates of all ethnic groups included in large scale national surveys, at 15.2%. White young people sit just above the average at 13.2%, with Chinese young people the lowest at 8.7%.[footnote 11] Pakistani and Bangladeshi young people have a NEET rate of 12.6%, which sits just below the overall average. The evidence also shows that although NEET rates for the majority of broad ethnic groups are relatively similar, the gap in unemployment rates widens as individuals grow older. A stark example is the Pakistani/Bangladeshi group, with an unemployment rate for all adults aged 16 and over of 9% - three times higher than the White British group at 3%.[footnote 12] This highlights the importance of not only considering NEET rates but also longer-term trajectories for key groups. In part, differences are driven by likelihood of staying in education. As shown in Figure 5, Chinese young people are much more likely to be in education or training, 78% compared to around 70% of most other ethnicity groups. The exception is White young people, who are over 10 percentage points more likely to be in employment, nearly a third, but less than 60% remain in education.[footnote 13]
Figure 5: Participation and activity by ethnicity, UK, 2018-2025 pooled data
Source: Annual Population Survey
41. Particularly high NEET rates also exist among White Gypsy or Irish Traveller communities, young people with migrant backgrounds and unaccompanied asylum-seeking children. Around half (50.8%) of females and 41.3% of males in England with an ethnicity of “White: Gypsy or Irish Traveller” are NEET.[footnote 14] Unaccompanied asylum-seeking children remain largely invisible in national NEET statistics, but we know they are more likely to experience factors which increase the risk of being NEET, such as being care leavers[footnote 15] or being behind at GCSE level.[footnote 16]
Four cohorts face acute risk of becoming NEET. Each illustrates a different dimension of how the system fails at points of transition.
Care leavers
There are approximately 81,770 looked-after children in England, a rise of almost 18% since 2015.[footnote 17] Care experienced 17- to 19-year-olds were more likely to be NEET, at 26% compared to 11% for those without this risk factor.[footnote 18] At age 17, they are more than five times more likely to be NEET than the general population.[footnote 19] By 20, more than 40% are NEET.[footnote 20] In 2022, only 22% of 27-year-old care leavers were employed, compared with 57% of the wider population.[footnote 21] Only 2% enter an apprenticeship. The care cliff between ages 17 and 18 where NEET rates move from 22% to 31% for this group, is perhaps the clearest example of the age-based institutional fracture this review identifies. Support, stability and oversight are withdrawn at precisely the moment they are most needed, the moment every other young person still has a family to fall back on.
Carers
The number of informal carers aged 16- to 24-years-old has risen from an estimated 200,000 in 2014/2015 to 300,000 in 2024/2025.[footnote 22] A cohort the size of a mid-sized city has emerged in six years, largely invisible to the institutions that should be supporting it. Half (51%) do not achieve five or more GCSEs at grades A* to C, compared to a third (36%) of non-carers.[footnote 23] Their persistent absence rate from school is 35%, around double the national average.[footnote 24] Almost a third have special educational needs. Those from homes with non-working parents are four times more likely to be carers, and those in the most deprived areas twice as likely. For many, the caring role is invisible to every institution they encounter. Youth Employment’s 2023 Youth Voice Census found that 23.1% of registered carers and 9.8% of unregistered carer respondents were currently NEET, compared to 5.3% of those who were not carers. Within the carer group, 40% of registered carers and 31.3% of unregistered carers had been NEET for more than 18 months.[footnote 25]
Young mothers
Having a child before the age of 21 more than doubles the likelihood of being NEET[footnote 26] and early pregnancy is often associated with pre-existing disadvantage. Following a rapid decline between 2009 and 2020, the under-18 conception rate has been showing small increases in the most recent data.[footnote 27] Social isolation and the transition back into workplaces are challenges faced by mothers of any age, but are heightened for younger women given stigma, reduced bargaining power, and greater cost of living pressures. Mental health outcomes for young mothers are significantly worse than for older mothers.[footnote 28] Getting young mothers into work early changes outcomes for two generations, not one.
Youth offenders
Those supervised by Youth Offending Teams are more than twice as likely to spend 6 months or more NEET.[footnote 29] Young men who are NEET are five times more likely to hold a criminal record than those who are not.[footnote 30] Half of 15- to 17-year-olds entering Young Offender Institutions have the literacy and numeracy levels of a primary school child.[footnote 31] The pipeline from education failure, to offending, to sustained detachment is one of the most documented and most neglected in the country, but very little has changed or improved for this cohort.
Inequality
42. The NEET phenomenon is grounded in social disadvantage and inequality.
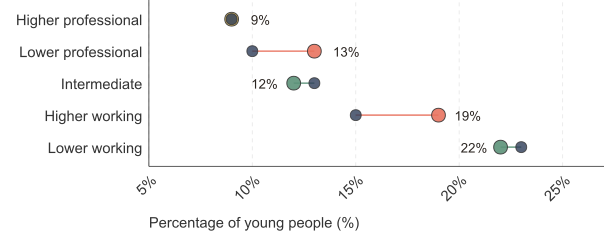
43. Figure 6 shows that young people from lower working-class backgrounds record a NEET rate of 22%, compared with 9% for those from higher professional backgrounds.[footnote 32] That ratio has not narrowed in a decade. Almost 30% of those who lived in a household at age 14 where nobody was earning are themselves NEET.[footnote 33] A decade of policy, programmes and spending has not shifted the fundamental relationship between social class and labour market disengagement.
Figure 6: Change in NEET rates by socioeconomic background 2014/2016 to 2022/2024 (3 year average)
Source: Social Mobility Commission, Destinations following the end of compulsory full-time education, December 2025.
44. Longitudinal evidence has found that over half of instances of being NEET at 17-years of age were attributable to persistent exposure to poverty and family adversity.[footnote 34] Almost 4 million children live in relative poverty after housing costs in the UK, with 1.9 million in deep material poverty.[footnote 35] The depth of poverty has increased: 6.8 million people are living below 40% of median income, the highest in 30 years.[footnote 36] The NEET problem is shaped by the conditions in which children grow up, and in many cases those conditions have become more challenging.
Place
45. The concentration of risk is not only social, but also spatial. The geography of where young people are most likely to be NEET maps onto the geography of labour market weakness with an almost perfect symmetry.
46. Eight of the 10 English local authorities with the highest likelihood of being NEET are in the North of England and the Midlands.[footnote 37] In Blackpool, almost a quarter of young people are NEET. In Bath, the rate is less than one in ten.[footnote 38] In Birmingham and Bradford, more than 8% of 16- to 24-year-olds are on Universal Credit and looking for work, more than double the national average of 4.1%. In Hartlepool, the UC health caseload for 16- to 24-year-olds exceeds 5% of the age group. In Guildford it is less than 1%.[footnote 39]
47. Place acts not as a backdrop but as a multiplier. A young person facing identical risk factors will have worse outcomes in Hartlepool than in Harrogate, not because of anything they have done differently, but because the local economy produces fewer opportunities and local public services face more demands. The NEET challenge is not evenly spread across the country.
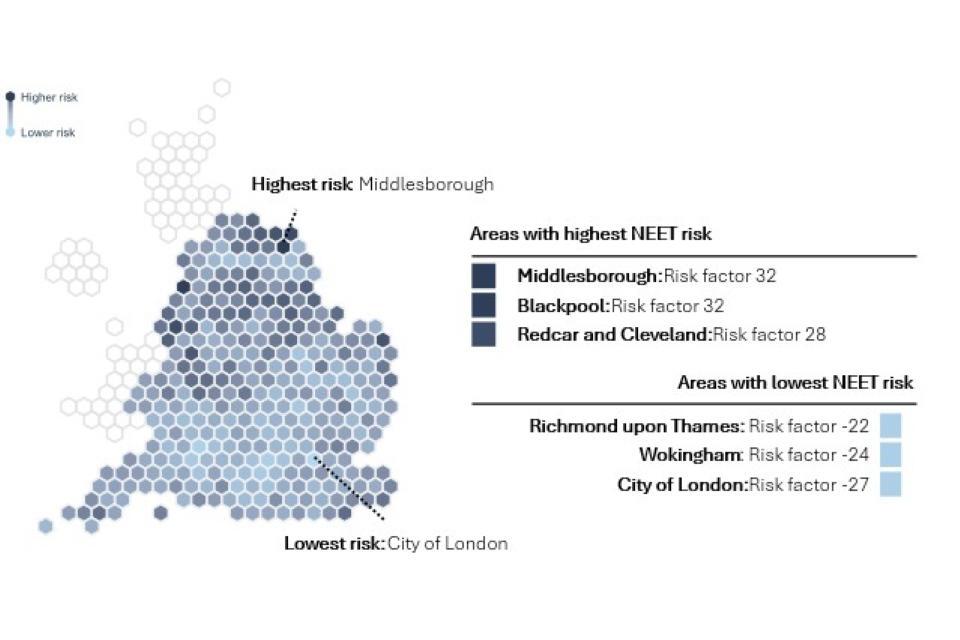
48. There is no data source that gives a timely, comprehensive picture of how NEET rates vary at a local level. Administrative data, such as that published in the January 2026 Get Britain Working Labour Market insight, can proxy with Universal Credit claimants but does not capture the hidden NEET population not claiming benefits. [footnote 40] As part of its work on NEET risk factors, the Youth Futures Foundation has developed a Local Authority-level index of NEET risk based on local indicators, including child poverty, health and school outcomes.[footnote 41] Risk level is generally higher in the North and in coastal communities (Figure 7).
Figure 7: Index score of NEET risk across English Local Authorities. Higher scores indicate a higher chance of a young person being or becoming NEET. Data Oct – Dec 2025.
Source: Youth Futures Foundation, NEET dashboard.
Note: Scores for each English local authority are indices generated from a wide range of data on key risk factors among young people in the area. Scores do not correspond to the actual or projected NEET rate for any region. Risk factors have been rounded.
Education
49. The proportion of young people in full-time education in England has been rising over time, and in the latest data 86.5% of 16- to 17-year-olds and 33.8% of 18- to 24-year-olds were in full time education, 7.3 and 12.3 percentage point increases respectively over the last 25 years (Figure 8).[footnote 42] More recently, however, education participation has fallen. This is important because education had acted as a “stabiliser” of NEET rates, offsetting falls in youth employment, but has weakened in recent years.
Figure 8: Indexed change in participation in education for 16-17- and 18–24-year-olds, England, 2001 – 2026. Peak and latest values presented as unindexed percentage.

Source: Labour Force Survey
Note: dashed line represents break in series
50. Low prior attainment in schools is a key predictor of NEET status. Around half of 18- to 25- year-olds without level 2 qualifications (GCSE grades 9 to 4, or A* to C) have spent time NEET.[footnote 43] Qualifications also predict how long a spell out of employment or full-time education can last; at least 57% of those NEET with a degree or higher education qualifications have been out of full-time education or employment for less than a year (rather than for more than one year, or of unknown duration), compared to at least 16% of those NEET with no qualifications.[footnote 44]
51. Qualifications, however, do not entirely protect against the risk of becoming NEET. In 2024/25, 40% of NEET young people had qualifications at A level or above up from 36% since 2014/15. [footnote 45] This is only partially explained by increasing qualification levels – there has only been a 0.5 percentage point increase in the overall proportion of young people attaining qualifications at this level over the same period, now at 54%.
52. School absence and exclusion are also among the strongest predictors of NEET status. Students who are persistently absent from school (absent 10% of the time or more) are 3.9 times more likely to end up NEET.[footnote 46] In England persistent absences have increased by more than 70% since the pandemic.[footnote 47] Severe absence, defined as pupils missing 50% or more of school sessions, has nearly trebled.[footnote 48] Chapter 4 looks at how school absence has become a driver of disengagement and what the education system has failed to do about it.
Disability
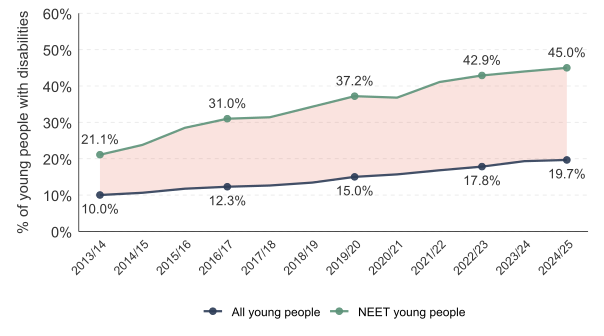
53. Disability is often lifelong. It requires adaptation and sustained support. In 2024/25, nearly half of young people who are NEET in the UK, 45%, report having a disability - more than doubling from 21.1% in 2013/14 (Figure 9).[footnote 49] Disability prevalence among all 16- to 24-year-olds has also doubled, from 10% to 19.7% over the last ten years.[footnote 50] Young people considered to have Special Educational Needs or Disabilities (SEND) are around 80% more likely to be NEET than average.[footnote 51]
Figure 9: The proportion of young people with a disability – NEET young people compared to all, UK, 2013/2014 to 2024/2025
Source: DWP, The employment of disabled people 2025, March 2026
54. The disability NEET gap is devastating. In 2024/2025, 29.6% of disabled young people were NEET in the UK compared with 8.7% of non-disabled peers, a gap of 20.9 percentage points.[footnote 52] That gap dwarfs the gender gap of 1 percentage point and the ethnicity gap of 6.5 percentage points. The NEET rate for disabled people was 30.7% in 2013/14, and 29.6% in 2024/25.[footnote 53] It has barely moved.
1.3 Health
55. Health has become central to who becomes NEET and who stays NEET. This is one of the defining shifts in the data. It has transformed the nature of the problem and rendered much of the existing system obsolete.
56. In 2025, 44% of NEET young people reported a work limiting health condition. This has risen from 26% in 2015.[footnote 54] The proportion who are inactive due to sickness or disability has more than doubled since 2005, with over one in four NEETs today inactive for this reason.[footnote 55] The proportion of disabled young people who are NEET citing mental health as their primary condition has risen from 24.3% in 2011 to 42.6% in 2025. At the same time, the share reporting physical or other health problems has more than halved, falling from 74.1% to just 32.1%.[footnote 56]
57. The rise in mental health conditions has occurred alongside a significant increase in the number of young people with neurodevelopmental conditions who are NEET. The Annual Population Survey shows that in 2025, 12.3% of all NEET young people in England recorded Learning Difficulties or Autism Spectrum Condition as their primary health condition, which has increased from 7.7% in 2021 (Figure 10).[footnote 57]
58. The long-term trajectory of those who are NEET due to ill health is deeply concerning. Of those who fell into health-related economic inactivity between 2017 and 2019, almost 8 in 10 were still NEET more than two years later.[footnote 58]
Figure 10: Proportion of 16 to 24 NEET young people by type of reported health condition, England, 2012 to 2025

Source: Annual Population Survey
The defining shift
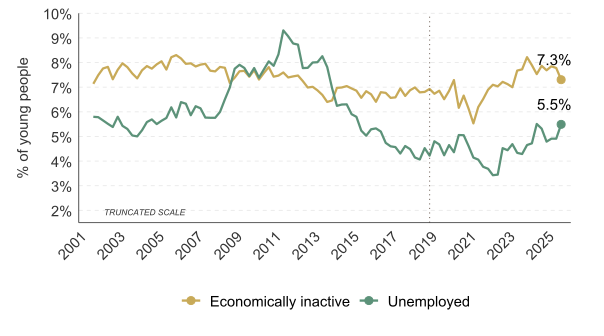
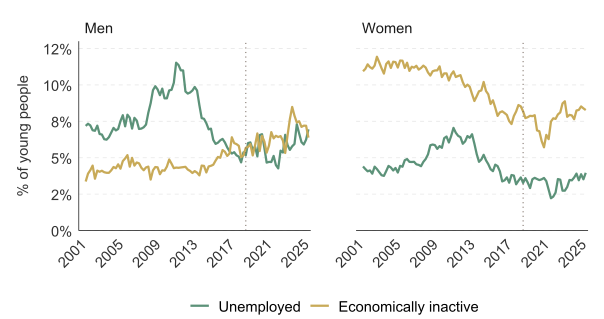
59. The growth in health-related inactivity among young people has changed the profile and nature of the NEET population. In the early 2010s, the majority of NEET young people were unemployed – in other words not working but actively seeking employment and available to start. Figure 11 shows that for the last decade the majority have been economically inactive – not working and not looking or able to do so.
Figure 11: Proportion of all young people unemployed or economically inactive, seasonally adjusted, UK, 2001-2025
Source: Labour Force Survey
Note: dashed line represents break in series.
60. Young NEET people are now more likely to be economically inactive than unemployed, at 57% versus 43%.[footnote 59] Recent changes have largely been driven by increasing inactivity among young men. Between 2000 and 2016, unemployment for young men who are NEET exceeded inactivity every year. This has changed fundamentally post-pandemic with inactivity for males NEET growing to its highest ever rate in 2024, although it has declined somewhat since then. For young women, inactivity has been the dominant driver throughout: female unemployment has been increasing in recent years to a high of 4%, but the inactivity rate was 8.3% at the end of 2025 (Figure 12).
Figure 12: NEET rate by gender, seasonally adjusted, UK, 2001 - 2025
Source: Labour Force Survey
Note: dashed line represents break in series
63. Whilst the proportion of young people NEET who are inactive due to sickness or disability has more than doubled since 2005 (from 11% to 28%), the proportion who are inactive due to looking after their family or home is now nearly a third of what it was in 2005.[footnote 60] This shift to health-driven inactivity has had a profound impact on how long young people remain NEET.
64. Over 6 in 10 (61.6%) of NEET young people have never had a job.[footnote 61] Twenty years ago, that proportion was 42%.[footnote 62] Young people who are NEET are becoming increasingly disengaged from the labour market. The evidence on duration is stark: of those NEET for less than a year, 65% return to participation the following year. Of those NEET for more than a year, only 25% do.[footnote 63]
65. Early disengagement is no longer a phase. It is sticky. And the longer it lasts, the harder and more expensive it becomes to reverse. Every month of inaction adds cost - to the young person and to the state.
1.4 The hidden NEET population
66. There remains a large cohort of young people who are NEET we understand far less well than we should. According to the Resolution Foundation, around 44% of NEET young people in the UK are not claiming out of work benefits.[footnote 64] Estimates based on combining administrative and survey data find that there are around 314,000 18- to 24-year-olds in England who are neither in work nor in education yet are not themselves in receipt of benefits.[footnote 65]
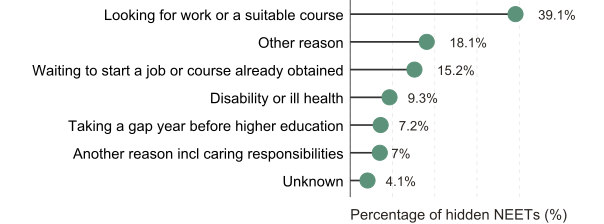
67. Issues with benefit status and small sample sizes in national surveys make understanding who these young people are disproportionately difficult. Using the Labour Force Survey with administrative data, the Registration and Population Interactive Database (RAPID), linked to the Longitudinal Education Outcomes dataset, gives us perhaps the best estimate of this population to date. The most common reason for being NEET among these “hidden” young people is that they are looking for work or a suitable course, at nearly 40% (Figure 13). Many are waiting to start a job or their course or are taking a gap year.[footnote 66] But even in this more detailed data, there is still a significant proportion of those who are unknown. This limits our ability to target and support those who may need it the most.
Figure 13: Hidden NEET people aged 18 to 24 by reason for being NEET, England, 2023-2025
Source: Annual Population Survey
68. A system built around those it can see will always miss those most at risk. When it misses nearly half of young people NEET, the system is not identifying the problem it was designed to solve.
1.5 Conclusion
69. Britain is producing NEET young people at scale, not through bad luck or individual failure, but through the steady accumulation of disadvantage that the system has failed to interrupt.
70. Almost one million young people are now NEET. The majority are economically inactive rather than unemployed. And for those who become NEET early, the likelihood of remaining so increases sharply over time.
71. These risks are not evenly distributed. A young person growing up with low attainment, poor health and limited family resources faces a materially higher likelihood of becoming NEET. Place reinforces that divide.
72. Where you grow up, the education you receive and the support you can access continue to shape outcomes in ways that the current system does not consistently offset. In practice, this means that opportunity is unevenly shared and that disadvantage, once established, is often reinforced rather than reduced.
73. Many of these pressures have intensified in recent years, particularly in relation to health and the weakening link between education and work. The result is a challenge that is both larger in scale and more complex than in the past.
74. The chapters that follow examine why the system is not keeping pace with these changes. But first we turn to the voices of young people themselves.
Chapter 2: in their own words
This generation has so many more challenges than previous generations have had. We’ve gone through Covid, which took two years off a practically essential development period. And not only that, you have warfare going on at the moment, you have AI, you have a changing world where everyone’s not sure what the future’s going to look like… The structure that’s built into the professional environment and even the personal environment of this country is built for a generation that’s gone past. It’s not adapting to what we need.
(A young man from London).[footnote 67]
75. The previous chapter described who Britain’s NEET young people are in numbers.
76. This chapter examines what it feels like to be a young person who is NEET, hidden NEET, or at risk of becoming NEET. It draws together new research with young people across those groups, alongside insights from a nationwide listening exercise involving more than 300 young people, published separately as Inside the Mind of a Young NEET. It also draws on evidence from the Youth Futures Foundation youth panel, frontline practitioners, charities, submissions to the call for evidence, and a survey commissioned for this review of 417 young people who are NEET.
77. Taken together, this evidence provides a fuller picture of young people’s experience and challenges a number of the assumptions that too often shape public debate. Above all, it shows that most young people want to participate: 84% of NEET young people in our survey said they want to find a job, education or training.[footnote 68] The challenge is not a lack of aspiration, but the barriers that stand in their way and the shortage of opportunities they experience, particularly as they navigate the system that is supposed to help their transition from the world of education into the world of work.
78. This conclusion is consistent with the government’s publication of its National Youth Strategy, which similarly drew on survey and focus group data from thousands of young people. It paints a picture of a generation who want to participate in education, training and work, but don’t always have the support they need to do so.
2.1 A generation under pressure, but bursting with potential
79. In almost every conversation with young people who are NEET we found an interest, a passion, a talent, despite the weight of family circumstance, rejection, or barriers that held them back.
A 19-year-old NEET in Newcastle:
I make fresh pasta most nights for my family.[footnote 69]
A 21-year-old man in Cardiff recovering from an upbringing scarred by violence:
I am looking after two horses. I have built them a house out of wood. I’m quite good at it.[footnote 70]
A young woman on a childcare course who came alive showing her portfolio of superb drawings:
I really want to be a tattoo artist.[footnote 71]
80. A lot of these talents were hidden - not known about at school, not built upon after school.
81. These examples may seem like small things, but they matter. Because they tell us something important about how this generation should be understood. Too often young people are described by what they lack: motivation, resilience, qualifications. We see them as a list of risks that need to be managed or problems that need to be fixed. But in workshops around the country commissioned by this review, the young people we spoke to did not fit that picture. They were under strain, yes. But they were also thoughtful, resourceful and often more capable than the systems around them seemed to be able to recognise.
82. A deficit model asks what is wrong with a young person. A strengths-based model asks what they are good at, what they care about, and what becomes possible when someone takes those things seriously.[footnote 72] Shifting this mindset is important - perhaps the most important first step, because in many of the lives we heard about, the issue was not an absence of ability or ambition, but that those qualities had gone unnoticed, unsupported or crowded out by more immediate problems.
83. Some young people were able to name their ambitions clearly. One young person, reflecting on his own experiences told us:
I feel like 20 years ago, people my age, they’d be like, yeah, in the next five years I’ll own a house. Because everything starts there, right? Like stability.[footnote 73]
84. Another young person was clear that work for him was not just about getting by, but about doing something useful:
I studied mechanical engineering because I want to work on systems and manufacturing lines that use less resources… I want to do something practical, but I also want it to matter.[footnote 74]
A young woman in Wrexham who taught herself how to build a Shopify site and now runs a nails business from her bedroom. 41% in our survey with NEET young people put interesting or fulfilling work as their main priority – the top choice.[footnote 75]
85. This theme came up again and again, young people spoke about wanting to work with children with learning difficulties, to care for older people, to build computers, write, design, make things, fix things and help people. Too often, those strengths sat unnoticed by school, unsupported by services or overshadowed by the labels attached to them: absent, anxious, difficult, behind, care-experienced, NEET.
86. The way adults, and in particular employers, see young people shapes what happens next. A system organised around deficits looks for non-attendance, low attainment, behaviour problems or barriers to work. A system organised around strengths would take those challenges seriously, but it would also ask different questions: what keeps this young person going? What are they interested in? When do they come alive? Who do they help? What could be built on here?
The weight young people carry
87. Young people entering adulthood in Britain today face a combination of pressures that no previous generation has experienced simultaneously: a pandemic that impaired their social development at the most critical window; a digital environment engineered to capture and monetise their attention; a housing market out of reach; a labour market that has raised entry thresholds while shrinking entry-level opportunities; a mental health system that cannot absorb the demand it was never designed to meet; and an epidemic of loneliness so severe that the World Health Organisation has declared it a global public health concern.[footnote 76] None of these pressures are unique in isolation. What is unique is their convergence and the way they compound each other.
88. The world is changing faster than the systems designed to support young people through it. Young people are navigating the most difficult transition to adulthood in modern history, and they are doing so under heightened public scrutiny. They are the most observed, most measured, most commented upon generation in history. Every aspect of their behaviour is tracked, polled, debated and judged, often by people who have never asked them what their lives are actually like. So this generation is different.
The cost of living, housing and the closing door to independence
89. Previous generations of young people could reasonably expect that the transition from education to work would lead, within a few years, to financial independence: a job, a rented flat, a sense of forward motion. That expectation has collapsed.
90. In Clacton, one of the areas we visited, healthy life expectancy at birth is 51.7 years.[footnote 77] As one stakeholder told us:
When you talk about economic inactivity, you instantly know that people here fall out of employment so much earlier than everyone else.[footnote 78]
Coastal areas face specific challenges: sectors such as tourism and leisure are highly seasonal with many roles only available part time. Stakeholders described seeing widespread business closures in town centres in recent years, further reducing the availability of employment. Young people in Tendring are also facing competition with high numbers of older, more experienced workers returning to the workforce after retirement due to increased living costs.
91. For much of the post war period, work led eventually to owning a home. That expectation has collapsed. One young woman told us:
I don’t actually ever think about owning a house.”[footnote 79]
92. Another young woman in the same group expanded on this:
I feel like 20 years ago, people my age, they’d be like, yeah, in the next five years I’ll own a house. Because everything starts there, right? Like stability.[footnote 80]
93. That link between housing and stability came up again and again. What has gone is not just the prospect of ownership but the sense that effort will lead somewhere solid. Renting felt insecure, expensive and sometimes unsafe. Young people described family homes with roofs that had fallen in, no windows and landlords who did not respond.[footnote 81]
Social media, smartphones and a mental health crisis
94. The pandemic did not create the mental health crisis among young people, but it accelerated a deterioration already under way. Between 2017 and 2023, the proportion of children and young people in England with a mental disorder rose from 12% to 20%,[footnote 82] while rates of common mental disorders among young people increased from 17.5% in 2007 to 25.8% in 2023/24.[footnote 83] This is a generational shift that predates Covid-19. Research points to several overlapping drivers, including poorer sleep, social media and smartphone use, cuts to children and youth services, and rising employment and affordability pressures.[footnote 84] These factors are interconnected, but debate about causation must not become an excuse for inaction. What is clear is what young people themselves say.
95. In polling of nearly 1,700 16 to 24-year-olds, 62% said social media does more harm than good.[footnote 85] In focus groups for this review, schoolgirls described the alienation of life lived through social media, where interactions could feel less like friendship than contact with “robots”.[footnote 86] They spoke of wanting to log off but fearing exclusion, and of cyberbullying that followed them home and often escaped adult notice.
96. Every one of a group of ten 12- and 13-year-olds told us they went to bed between midnight and 3 in the morning because they were scrolling on their phone. “Did their parents ever take their phones away from them?” The answer, a clear: “No”.[footnote 87]
The long effects of Covid: an interruption that became a rupture
97. If the pressures described in the previous section were already building before 2020, the pandemic accelerated them. Schools closed, friendships went remote, and social development often stalled at precisely the age when it matters most.
98. What young people told us, years on from the pandemic, was that the effects had not faded in the way the system seemed to expect. In London, a young man who had been in his A-level years during lockdown described something that many others recognised:
That’s obviously your years when you’re meant to be developing and meeting people and socialising. When you’re 14, 15, 16, 17, that’s when you should be outside. And definitely it massively affected social interaction. Even now, even in 2026, I’m happy on a weekend just to stay at home, be on my phone. It’s more comforting.[footnote 88]
99. Another in the same group was specific about the social skills that simply did not develop during that period:
We weren’t really seeing people in person, so we didn’t get used to the social aspect of connecting with people. Maintaining eye contact, hand gestures and all sorts. We were just sitting behind screens. There were skills that people were struggling to develop.[footnote 89]
100. What made the pandemic different from a conventional economic shock was its social totality. It removed the informal scaffolding through which young people learn to navigate the adult world: Saturday jobs, after-school clubs, unstructured time with peers, first tentative encounters with workplaces and workplace norms. Over the two decades before the pandemic, part-time employment among teenagers had already been declining. The traditional Saturday job in retail and hospitality, once a widespread feature of early labour market socialisation, had become less common. The pandemic accelerated this erosion to the point of elimination for an entire cohort.
101. Young people were also honest about what lockdown did to their capacity to concentrate and persist. A young man in London said his attention span had got noticeably worse:
It’s harder to focus. I was at home all day, wasn’t doing much. And it was really hard to get back into a rhythm after COVID.”[footnote 90]
102. In Bradford, stakeholders told us the consequences are still visible:
You’ve got some 20 year olds now that never had any touch points with the world of work because when they were in year 10 and they should have had their work experience, it was locked down and therefore if they were lucky they got something online, but actually there was no work experience that took place.[footnote 91]
Loneliness and belonging
103. Accelerated by the pandemic, loneliness in Britain has quadrupled since 2019.[footnote 92] 70% of young people between 18 and 24 now report experiencing loneliness.[footnote 93] Those aged 16 to 29 are more than twice as likely to say they feel lonely often or always as those over 70.[footnote 94] One in five Britons aged 18 to 24 have one or no close friends, a proportion that has tripled in the past decade.[footnote 95] Historically, social networks shrank with age. Today, young people have fewer friends than older Britons.
104. Austerity and the pandemic together created a double hit: first the services that supported young people were cut, then the social infrastructure that replaced them - often giving that connection and sense of belonging - was removed.
105. The closure of third spaces, youth clubs, libraries, pubs, swimming pools, community centres, has stripped away the places where spontaneous socialising once occurred. In Newcastle, stakeholders told us:
This part of the city has the most youth work provision and it’s still nowhere near enough. There’s the most here but it’s only scratching the surface.[footnote 96]
106. A sense of loneliness is also felt by many of the same young people within the school system, where they experience neither connection nor belonging. It is particularly acute among those growing up in poverty: children living in relative poverty are twice as likely to be lonely as their more affluent peers, and British children report higher levels of loneliness than those in countries such as Denmark and the Netherlands.[footnote 97] The economic and digital drivers of loneliness are not competing explanations but part of the same picture. Young people do not experience loneliness as separate from participation; they experience it as part of the same problem, a life that has narrowed, a future that feels out of reach, and a sense that the world has moved on without them.
2.2 The first part of their journey to becoming NEET
107. Despite all these challenges, the vast majority of NEETs think they will move into work. But a small proportion (11% from our survey of young people who are NEET) fear they won’t.[footnote 98]This section looks at why they think this happens.
Family, poverty and the foundations for a good life
108. For many young people, the challenges begin long before they encounter the health system, the welfare state or the world of work. They begin at home.
109. Families do not start from the same position. As Chapter 1 demonstrates, the relationship between social background and outcomes is unbroken. The data on poverty, intergenerational worklessness and family adversity is set out there. What matters for this Chapter is what young people themselves say about the foundations they were given.
110. In Tendring, stakeholders described families arriving with not one problem but a whole myriad of them: poverty, debt, domestic abuse, addiction, parental mental ill health.[footnote 99]
111. Where parents themselves had limited experience of work or education, their ability to guide their children was constrained. Stakeholders in Bradford described a glass ceiling effect:
The opportunities might be there, but if no one in your immediate family or social circle do that sort of thing, you haven’t seen it, so you don’t believe you can be it.”[footnote 100]
112. In Bradford, the defunding of careers services in schools in England has shifted responsibility for securing work experience placements to parents and families. As one stakeholder put it:
The onus to find that work experience placement is on parents and families and not on the schools. If actually that family hasn’t got those aspirations for their young people, they’re just going to leave it.”[footnote 101]
113. In Newcastle, a stakeholder told us how work experience, once embedded in school, now “relies on who your parents know.”[footnote 102] None of this is the fault of the young people concerned. They did not choose their starting point. But their starting point shapes everything that follows.
Experiences of School - the roots of disengagement
A traumatic experience for too many
114. For many young people, school works well: they achieve, feel supported and can see a route into good jobs. Research from the Children’s Commissioner shows that 64% enjoy school or college, 76% say they have been supported by great teachers, and 65% feel they understand the good jobs available to them later in life.[footnote 103] But for many of the NEET young people we spoke to, school was experienced very differently, as “traumatic”, “stressful”, “boring”, and something to be endured rather than embraced.[footnote 104] Across the country, young people described bullying, low expectations, isolation for minor rule-breaking, and classrooms in which they felt unseen, talked at, and written off. Low attainment, persistent absence, and exclusion are strong predictors of later labour market disengagement, but the deeper damage is often less visible: a loss of confidence, belonging, and trust in institutions. For many young people now counted as NEET, disengagement did not begin at 16 or 17, but much earlier, sometimes as early as Year 7.[footnote 105] Again and again, young people described a system that responded to struggle with isolation rather than support, including the repeated use of isolation rooms, where they were left alone with work and little help. One young man described it:
They put you in a room or like a hallway by yourself, and then you were given all the work for your classes that day with no help or assistance. You’d be leaving half an hour early to get your lunch and then bringing it back to the isolation room to eat it by yourself while you’re still doing your work. That is just depressing. That’s probably why most kids feel the way they do at school. They tried to correct what I was doing or the way I was learning. My predicted GCSEs were all As and Bs and then just the turn of events that happened… they were making it difficult for me to learn.[footnote 106]
115. By the time many of these young people left school, they were already, in every meaningful sense, pre-NEET. Detached, wary of institutions, carrying mental health needs that had never been addressed, with qualifications that bore little relation to their actual ability and no clear sense of what came next.
Exams, pressure and the narrow road
116. GCSEs themselves were described repeatedly as a source of dread rather than anything that felt fair or useful. One young man, reflecting on the exam pressure of his later school years, made a point that cuts through much of the conventional debate about why young people underperform:
117. “If you’ve got more going on, and people put the most pressure they can on you at one point in your life, and it’s meant to determine where your life goes from that point, you are not going to be able to focus on anything at all. It’s got nothing to do with intelligence. It’s got everything to do with the fact that if your head is never quiet, the information just won’t sit.”[footnote 107]
118. One 12-year-old girl in Clacton:
I do wish my Maths teacher would stop going on about GCSEs. It’s in four years’ time.”[footnote 108]
119. From our survey with young people who are NEET, 81% thought that the current curriculum is too focused on children and young people passing exams.[footnote 109]
120. In addition, more than half of the young people (55%) felt that the current education system did not suit people like them.[footnote 110]
Little preparation for what comes next
121. Almost universally, the young people we heard from felt that school had not prepared them for the transition into work or adulthood. This was expressed regardless of whether their overall school experience was positive or negative. The criticism of what school did not do was consistent: a perceived focus on academic qualifications, with university promoted as the default pathway and limited discussion of alternatives.
122. Our survey of young people who are NEET showed that the majority (67%) believed the current curriculum failed to prepare young people for work.[footnote 111] More than that. They were clear that the so-called ‘soft skills’ - like speaking skills - would have a very positive effect when applying for jobs (64% agreed), closely followed by technical skills or qualifications (60% agreed).[footnote 112]
123. Careers guidance was widely described as generic and lacking practical value. Young people highlighted a lack of preparation for everyday and employment-related skills, including budgeting, managing taxes, job searches and interviewing. They described feeling underprepared for their next steps and reported making decisions without a clear understanding of the options available.
Generic careers support
I thought that the education system would have held my hand a bit more and guided me to where I wanted to be. They would just be like, make sure you go to university. Apprenticeships are an option, but they wouldn’t tell you how to look for apprenticeships or anything like that.
(Woman, age 20)[footnote 113]
I think they should explore a lot more opportunities and make students aware that it’s not always this linear path of you have to do school and then college and university and then you get to a dream career.
(Woman, age 24)[footnote 114]
124. The careers advice on offer was frequently perceived to have made things worse rather than better. In one session, a young person told us that a careers advisor had once told her, given her background, that she was unlikely to get far in life.[footnote 115] She still remembered it years later.
125. In Islington, one FE provider told us that almost 30% of their enrolments are walk-ins on enrolment day, a group who experience high dropout rates later on:
It always surprises me still, the number of young people who come to us during that seven day period, who just don’t know what their next step is going to be. And then that leads to the high number of learners who then drop out and leave within that six-week period.[footnote 116]
126. A young person in Belfast said that after leaving school without the GCSEs she needed and ruling out her local tech college because too many people there knew her, she was simply “never told what to do next. So I kind of just stayed in the house, and I was like, right, well, this is just the end.”[footnote 117]
127. That last phrase, ‘this is just the end’, at 16. It is one of the most telling sentences in any of our transcripts. It describes a young person for whom the system had prepared one pathway, and had stopped when that pathway closed. What young people needed at 16 was not more speeches about the importance of qualifications. It was a conversation that started from what they were actually capable of and interested in, and walked them towards the nearest realistic version of it - an apprenticeship, a training programme, a supported work placement, a second-chance course. In most cases, that conversation never happened.
Those facing additional barriers
Care leavers
128. Of every group we met, care-experienced young people described the most consistent pattern of being systemically set up to fail. Not through any individual’s malice, but through the structural design of the services around them. The care system itself produces an unusual concentration of transitions - placement breakdowns, school changes, new social workers, new personal advisers, new therapists - at precisely the ages when continuity matters most. Then, at 18, the support drops off a cliff. A young woman in our online session with care leavers captured what this looks like from the inside:
I had a lot of placements breakdown. Some placements just weren’t able to cope with it, and that meant getting moved from either city to city, town to town, or county to county. And I would make an effort to get a job at each one, and it would be for a few months or six months or nine months, but looking at a CV as an employer, you just see a load of failed jobs, and they don’t think that you’re very reliable, where I think they should take a step back and look at it individually… it wasn’t in our control.[footnote 118]
129. In Belfast, one woman of 22, talked of having 11 foster parents in just 18 months. It’s almost unimaginable the ordeal of having to try to bond with so many adults, only for those bonds to be broken almost immediately.[footnote 119]
130. Care leavers are routinely asked to account for CVs that employers read as unreliability, when the underlying pattern is not unreliability but a series of moves nobody consulted them about. When the practical support that is supposed to follow them into adulthood is delivered, it is too often in the form of a bank transfer rather than a relationship.
131. The transition into adult services compounds the problem. Another care-experienced young woman in Cardiff described trying to access mental health support after years of childhood trauma:
They don’t really write down what’s gone on and what’s been discussed very well, like the bookkeeping’s not great. So by the time I got to adult services, I had to re-explain everything. Which I wasn’t willing to do, because why would you want to re-traumatise yourself every time you got a new therapist? It should be in my records.”[footnote 120]
132. She is now 22 and she told us, “they’re only just referring me to the correct therapies.”[footnote 121]
133. Her description of the UK system was damning:
a first aid approach to mental health conditions until it gets to a point where it is severe and life-limiting or a threat to life, and at which point they don’t give you solutions, they keep you alive long enough to wave it to a point where you can cope again and send you back into the world and give you some more first aid.[footnote 122]
Disabled and neurodivergent young people
134. Disabled young people are the group where the least progress has been made in the last ten years. The disabled NEET rate nearly doubled between 2011 and 2025.[footnote 123]
135. The voices behind those numbers describe, almost without exception, systems that were not built for them. For young people with learning disabilities, Mencap’s evidence is stark: only 5% of those known to their local authority are in paid employment, despite 86% wanting a paid job.[footnote 124] The testimony Mencap has gathered describes what this feels like from inside:
As soon as they hear the words disability, they don’t wanna know you. It’s like they stereotype before they get to know me.[footnote 125]
I’ve had a bad experience working in a clothes shop. I told them I’ve got a learning disability. They asked me to put numbers on tags and I asked for help. They went nuts on me. I just walked out.”[footnote 126]
136. We found similar experiences from the Youth Futures Foundation panel:
There is something deeply uncomfortable about having to ask for what you need, especially when you already know it might be seen as “too much”. Reference A
137. The most common response to discrimination was not to complain but to let go of that ambition. The way the benefits system works only makes matters worse. 45% of people with a learning disability who wanted a paid job said that fear about the impact on their benefits was the single biggest thing stopping them, which means the benefit trap, not the labour market, is the most often-named barrier.[footnote 127]
138. Racism shapes the experience too. One of the young people in our qualitative research described past experiences of racism in his area that made him reluctant to take on early or late shifts:
I wouldn’t take a job where I have to walk in the dark.” Reference B. His concerns about personal safety further restricted his already limited options.
139. In our regional research, stakeholders in Newcastle described the gap between what is promised and what is delivered for young people with SEND:
Support, from my point of view, is theoretical. There’s all this talk about we’ll support you, we’ll accept your role, we’ll understand everything. And then as soon as there’s a diagnosis there or as soon as the process has begun, it’s gone.[footnote 128]
Parents of children with SEND can be left struggling too:
If you’re a parent and you’re struggling with a child with autism and you’re not getting proper support at home, and that child isn’t getting proper support at school for their autism, then what do you do?”[footnote 129]
140. Young carers are one of the least visible groups in the NEET conversation and one of the most systematically miscounted.[footnote 130] A young woman in Newcastle, asked whether she would consider care work, explained why her answer was complicated:
I technically am a carer. I don’t get paid for it. My dad’s blind, and my mum’s deaf, so… I could get money from it, but I’d have to sign off. I’ve looked after my dad. I’ve looked after my grandad. And my sister. So technically, I had the experience. [footnote 131]
141. She had applied for a paid care role through a national charity and been turned down because, in her account, her caring experience wasn’t on her CV in the form employers recognise. The system assumes caring is something done at home and work is something done outside it and it will not count one toward the other. More than one in four (28%) NEET young women are economically inactive because they are looking after family or home, compared to around 6% of NEET young men.[footnote 132]
142. A young woman in the Cardiff care-leaver session who had two small children and was studying for professional exams put it plainly: her preference, when asked what would help, was “a lot more jobs where you can also work from home… especially if there’s a child and a mother and she’s on benefits.”[footnote 133]
143. Young carers are also among the groups most likely to be completely missed by school. A young woman in a Rhyl residential care home was, by the time we met her, 16 on a level three college course, planning to work with children with learning disabilities and in her own words “pretty much a young carer for a lot of my life.” Her school attendance was “amazing” now, the care staff told us. Nobody had known, for most of her childhood, why it had not been amazing before. She was looking after her younger siblings before local authorities took them away from her parents.[footnote 134]
Mental health and confidence
144. In our qualitative research, mental health conditions including anxiety, depression, neurodevelopmental conditions and PTSD, were widely reported and affected motivation, confidence and capacity to engage in training or job searching.[footnote 135]
145. Our conversations brought home how much mental ill health has become woven into ordinary life. Most young people did not describe themselves as being in crisis. They described operating every day against a backdrop of anxiety, exhaustion and dread.
146. A young woman in Wrexham said:
I struggled with anxiety and I didn’t get the support I needed. No one ever talked to me about it. I asked for help on countless occasions. They said yeah, okay, we’ll do this and they didn’t. It gave me false hope.[footnote 136]
147. Another, aged 22:
With my mental health right now that I just got put on medication, because my mind’s not situated, I can’t focus on other things, if that makes sense. I physically can’t.[footnote 137]
148. Young people with invisible or fluctuating conditions described a sense that employers and educators struggled to understand and accommodate their needs. One young person who secured an internship described the environment as hostile to her neurodivergence:
I got an internship and that was fine. But I really, really struggled with my neurodivergence there because it was not an environment that was made for people who are neurodivergent. It wasn’t a diverse company.[footnote 138]
149. In every area we visited, we heard the same message: early support is almost impossible to access and by the time young people reach crisis point, the system responds too late. As one stakeholder put it:
If we had better capacity in the system for early diagnosis, early intervention, so children who are having unmet needs aren’t becoming poor mental health, poor attendance and the like, the more we can do in terms of early intervention, the better.[footnote 139]
150. The relationship between mental health and NEET is self-reinforcing. Poor mental health drives disengagement. Disengagement worsens mental health. And it begins not in the labour market but in the bedroom, on the phone, at 2am, long before a young person ever applies for a job.
151. Another young woman described what school had become for her:
It was more about just getting through the day instead of actually doing the lessons and focusing on the work.”[footnote 140]
152. That phrase, getting through the day, came up across the country. Just surviving without the capacity to think about thriving.
153. The research backs up what the young people described. Poor mental health in childhood and adolescence is strongly associated with becoming NEET. What the transcripts add is a sense of timing. By the time someone is counted as NEET, the pressure has often been visible for years.
2.3 Their entry into the labour market
154. Over 6 in 10 (61.6%) of NEET young people have never had a job.[footnote 141] Here they tell us why the search can be so difficult.
The applications black hole
155. The young people we met wanted to work and said so clearly in every part of the country. What they described was not a lack of motivation, but a lack of response: applications disappearing into a void, interviews followed by silence, and recruitment processes that felt designed to deter rather than select. Above all, they wanted someone to tell them honestly whether they had a chance and how to improve. Many spoke first about the sheer volume of applications they had submitted and the silence that followed. A young man in Newcastle said he had applied for “over, like, 60 to 70 jobs now”.[footnote 142] A young woman in Camden had applied for around 50 roles over one summer, heard back from ten, and was rejected by all ten without explanation. A young man in Wrexham had applied to around 150 apprenticeships across the country, but could not take up the one offer he received because it would have required him to move to Europe.[footnote 143]
156. Another young woman in Cardiff described months of delays in a coaching course application, held up by a DBS check, passport issues and other administrative hurdles, until she gave up waiting. The most consistent complaint was not rejection but silence. As one young woman in Cardiff put it, “The main issue is you’re not getting responses. You don’t know what to improve on.”[footnote 144] Another in Belfast, after three interviews, said only one employer had replied, simply to say the role had been filled. Again and again, young people told us that silence was worse than rejection, because at least rejection gave them something to work with.
157. A young person from the Youth Futures Foundation Panel:
And it’s, like, the time and effort that goes into all of these applications, just to then get, like, a, sorry, this is no longer happening, not even any sort of feedback… on the cover letter as, you know, an apology or anything like that. And I get it, budget changes, no one knew what was going on, but still it’s the emotional investment. Reference C.
158. Summarised succinctly by another member of the panel “Yeah, it just sucks the soul and life out of you, really.” Reference D.
159. And young people know what is coming. Mental Health UK research shows that 61% of 15 to 18-year-olds are already starting to worry about looking for work.[footnote 145]
The Catch 22 - entry level jobs requiring past experience
160. The experience of searching for work was described consistently across all groups. Many young people reported spending hours each day on online platforms, some keeping spreadsheets to track roles, deadlines and responses. Despite this effort, the process was overwhelmingly described as unproductive and demoralising.
Searching for work, continuous rejection
It’s like, how do you want me to have experience if I’m only 18 and you’re not even letting me have the chance to get the experience?
(Woman, age 18)[footnote 146]
I just remember thinking, how can I not get that job? That is a very entry level role. Do you really need experience in that job? It’s not really difficult, is it?
(Man, age 20)[footnote 147]
For grad roles, a lot of them, even though they’re meant to be graduate roles, some of them ask for experience. But how am I meant to obtain it? Unless I choose to do a year in industry, I feel like it’s very unfair.
(Woman, age 21)[footnote 148]
Like a lot of these places don’t even give you a reply and it’s really disheartening. And then you would get a reply, an automated reply, five months down the line for a role that you’ve forgotten you applied for to say that you’ve been rejected. Or you just don’t hear at all.
(Woman, age 21)[footnote 149]
‘Getting a job is a job in itself’
161. Entry-level recruitment has, for this generation, become a multi-stage process: an online form, a series of automated screens, a recorded video interview, a situational judgement test, one or more assessment centres, and, finally, an interview with a human being.
162. A young man who had recently graduated in computer science described the stage that kept ending his applications:
I was basically just doing the assessment centres… I wasn’t making it past the Hire Vue stages. It’s essentially a recorded stage where you have to answer questions about yourself.[footnote 150]
Hire Vue is an AI-powered recorded interview platform. He had never met a human from any of the companies that rejected him.
163. Another recent graduate, 18 months out of school, described what going in completely cold felt like:
You have to apply to at least 30 until you get one, and that’s, like, a really mentally draining process, because some of the application processes have six rounds, and then you don’t even make it to the final round, and it’s just, like , what was the point? [footnote 151]
164. Meanwhile, the AI screening cuts the other way too. A young woman in Wrexham made the point young people everywhere would recognise:
I think they should get rid of the AI system that reads CVs. On Indeed, it just filters out CVs. If someone doesn’t have the right word and the system doesn’t like it, it’ll just throw it away.[footnote 152]
Her CV had been reduced to data points before a human saw it.
Stepping stones into work - not all or nothing
165. Health, particularly mental health, runs through this section. Among NEET young people, 24% cite depression or anxiety as their main limiting condition, 22% autism, and 18% another mental illness.[footnote 153] What young people described was not permanent incapacity, but fluctuating capacity: they could manage study or work on some days, but not others. Too often, however, systems operate in binary terms, fit or unfit, in or out, making it hard to re-enter employment or training after periods of ill health and turning temporary disruption into longer disengagement. Approximately one in ten respondents from our survey with young NEET people said they thought they would never move into work, education or training.[footnote 154] Many described withdrawing after brief episodes of ill health because re-entry was too rigid, or because attempting work risked their financial stability if their health worsened again. A young woman in Cardiff explained why part-time work had suited her better:
It helped me, I got that day’s break to calm down my anxiety.[footnote 155]
Another said the hardest part of starting work was not the job itself, but building the routine around it.
166. Yet employment remains a source of income, purpose and connection. NEET young people report significantly lower wellbeing than their peers in education, employment or training; over a quarter say their mental health has stopped them applying for jobs, one in five say it has stopped them attending an interview, and one in four who want to work say they are unable to do so because of their mental health.[footnote 156] These are not the responses of a generation that has opted out, but of one that wants to participate in a system that has not worked out how to support fluctuating need. Many of the young people we spoke to said they would find it easier to build up gradually to full-time work, and research suggests that the words of a teacher, adviser or Jobcentre worker can either strengthen or undermine a young person’s belief that participation is possible.[footnote 157]
167. The system they encountered: “Support is theoretical” [footnote 158]
168. Where young people had experience of Jobcentre support, it was often described as generic and tick box, focused on benefit compliance rather than progression.
A tick box exercise
They send you everything that you told them not to send.
(Woman, age 22)[footnote 159]
I didn’t really find them much help. They were showing me how to do a CV and all this stuff, but I already had my CV and everything. And I told them my interests and everything they were doing was the same that I could do, just Google it.
(Woman, age 23)[footnote 160]
I feel they’re not as supportive. They do have jobs, like if you want to be a security guard, that was the kind of stuff put towards me. But anything related to my career field? They never really had anything like that.
(Woman, age 24)[footnote 161]
Even just going there for one appointment, I felt, I don’t want to say embarrassing, but it feels like you know what the stigma is if you’re getting benefits, you’re just lazy and you don’t want to work or something like this.
(Woman, age 23)[footnote 162]
I had never thought about going to a Jobcentre because I didn’t think they’d be able to help me out in my situation. As in like, I’ve already gotten a degree and stuff. I thought it was more for like hospitality and stuff, maybe working in shops.
(Woman age 21)[footnote 163]
169. Some young people had been promised opportunities that did not materialise:
I actually only did that course because they said I would get a guaranteed interview for a job at the end, which didn’t happen.
(Female, age 20)[footnote 164]
170. A lack of awareness about available schemes and eligibility criteria further limited take up. One discovered on TikTok that because they’re on Universal Credit, they may be able to get help with driving lessons via the Flexible Support Fund - if this is found to be a barrier to employment:
There’s a lot of things that they don’t tell you within Universal Credit that you could be getting.
(Female, age 22)[footnote 165]
The system that is supposed to help them is not reaching them.
171. For disabled and neurodivergent young people, the encounter could be actively damaging. A young woman in Cardiff described her first Jobcentre appointment at 17:
I went into the Jobcentre and the lady literally reached across the table and went, when were you diagnosed? No one had diagnosed me with anything. But yeah, 17 at the time, I went to Jobcentre to sign on and she put me on limited work capacity. I just didn’t go back after that.[footnote 166]
172. A casual off-script moment from a Jobcentre adviser had, in her account, effectively ended her engagement with the labour market at 17. She is now in her early twenties, in part-time college, on PIP and Universal Credit, and has not worked since.[footnote 167]
173. The most generous reading young people offered of the Jobcentre was from those who had been directed from it to something better. The young people in Belfast on employability programmes repeatedly named the Jobcentre as the organisation that had, at least, referred them somewhere useful.
Practical barriers: transport, money and the costs of getting started
174. Transport emerged as a significant practical barrier across our research, particularly for those without a driving licence or access to a car.[footnote 168]
Transport as a barrier
I’d say the fact I can’t drive probably doesn’t help me with searching for jobs because I’ve found a lot of jobs even then that you don’t really need to be able to drive for, require you to have a driving licence. I can’t afford the driving lessons because I’m not in work.
(Female, age 22)[footnote 169]
Once I get a car, it’ll open up a lot more opportunities.
(Man, age 18)[footnote 170]
175. These constraints narrowed job searches to a small geographic area, reducing the likelihood of finding suitable work and reinforcing feelings of being stuck. In rural and coastal areas, the problem was particularly acute.
176. Financial constraints compounded the problem. For young people from lower income backgrounds, the need for immediate income limited their ability to pursue opportunities that might improve their employability. Unpaid internships and voluntary roles were frequently described as inaccessible.[footnote 171]
They did have opportunities and work experience at uni, but they were all unpaid and because I was working while at university, I felt it wasn’t really something I could do. There’s a lot of barriers for people who are from lower socio-economic backgrounds.
(Woman, age 22)[footnote 172]
If I had a bit more money, then I could have gone to a volunteer programme already and been able to sustain that.
(Woman age 23)[footnote 173]
177. The costs of working can be a real barrier. In Tendring, one stakeholder described a young person who had secured a construction job but needed to buy PPE before starting, creating a hurdle before he had earned his first wage. Stakeholders also highlighted wider barriers including transport, uniforms, childcare and equipment. A smaller group in our qualitative research, with strong family financial support, appeared to feel less urgency to enter work.[footnote 174] This is a less common but important part of the picture: the system must also reach young people for whom financial pressure is a weaker motivator.
The lost years ‘doing nothing’
178. For previous generations, being stuck at home often felt far worse than being out in the world. For many young people today, especially those whose formative years were shaped by Covid-19, spending long hours on a laptop, phone or games console can feel normal, comfortable and hard to break away from. In our conversations, many described the years from 16 to 24 as containing long periods of drift, sometimes months, sometimes years. One young person told us:
I dropped out of college for a couple of years. I did nothing for a year. It took a big jolt to get me back on track after 3 years.[footnote 175]
Young people said it is now much easier to spiral: to get stuck in a rut, become more depressed, stop looking after yourself and lose sight of the next small step forward. A young person in Cardiff, asked what she had done between leaving a course, a cleaning job and another course, replied simply:
Nothing. I was just doing nothing.[footnote 176]
179. Across the country, the length of these stagnant periods was striking: nine months, a year, a year and a half, two years, sometimes longer. Often they were triggered by a setback such as bullying, redundancy, family breakdown, trauma, a mental health episode or a court case. In one case, a young man in Bradford spent three years training to be an electrician, only to be told at 19 that funding had run out and he would need to find £3,000 himself. He could not afford it, dropped out, and spent the next year at home not knowing what to do. The longer a young person remains outside work, education or training, the harder it becomes to return. Sleep drifts, routines erode, confidence shrinks, skills rust and CV gaps grow.[footnote 177]
180. This loss of confidence is measurable: 50% of NEET young people say the longer they are unemployed, the harder it is to find work and the less in control of their future they feel; 44% say being out of work has damaged their confidence in their skills; over half say they feel embarrassed about being out of work; and almost a third say unemployment has directly harmed their mental health.[footnote 178] Several told us that the gap itself had become a barrier. As one care leaver in Grimsby put it, “it’s the gaps they look at.”[footnote 179]
Getting into bad habits
181. When employers are asked why young people struggle in work, the conversation often turns quickly to “work readiness”. Young people are seen as not ready, unable to settle, and unlikely to stay. But by the time a young person walks through the door on day one of a new job, the habits that shape whether they stay have often been formed, or not formed, years earlier. What employers read as unreadiness is often the downstream effect of routines that were never built: poor sleep, unstable days, inappropriate work attire, and a wider lack of structure. In almost every conversation we had with young people about routine, sleep came first. At one session in Belfast, we went round the room: midnight, 1am, 2am, 3am, 4am. Weekends were later. One young man said that at the weekend he did not go to bed at all. Another described her sleep pattern flipping within a single day, sometimes asleep at 9am, sometimes at 9pm, and not sure which.[footnote 180]
182. A young woman in Clacton, finishing school at 3pm, said her routine was to “come to school, go home and sleep”.[footnote 181] She was going to sleep at 4pm most days, waking at 1am, and gaming until school, a pattern that had lasted for three weeks. Another young person in the same group described spending whole weekends gaming through the night and then sleeping through the next day. What many of these accounts share is the absence of any external peg on which to hang the day. Without work, classes, or a reason to be somewhere at a particular hour, the sleep-wake cycle drifts, and once it has drifted, it becomes harder to reverse. You cannot sustain a 9am shift if you went to bed at 7am. This drift was not always about avoidance. One young man in Belfast, asked why he was staying up until 3am, said he was watching YouTube videos on study techniques because he was trying to learn and could not switch off enough to sleep. He was trying to do the right thing, but doing so through platforms designed to keep him awake.[footnote 182]
183. Young people were often strikingly clear-eyed about the effect their phones were having, including the regular, addictive dopamine hit they craved and the way it disrupted their sleep and attention.
Quitting
184. And that craving for instant results can translate into the workplace. One young woman from Cardiff said:
I quit everything. Quit the cafe job. Quit college. Went back to college to do another course. Quit again. It happens after three months every time. Just get bored. Want a change.[footnote 183]
185. The young people we met kept coming back to one thing, often unprompted. They needed routine more than anything else.
186. A young woman in Cardiff, asked what would make starting a job possible for her, skipped past pay and hours.
It’s the lead up to it… I’d want a routine. I’d know what time. I’d know what days. Every week, I’d know what’s coming.[footnote 184]
187. A young man about to start an IT job was asked what would matter most in his first six months: wake up on time, show up. He knew it. The question was whether anything in his support package was equipped to help him actually do it.
188. That is what quitting culture looks like when you sit with it. Not a values problem. A habit problem, carried into work from everywhere else. The young woman in Cardiff was not lacking grit. She was running the same loop her phone had trained her to run, in a workplace that had done nothing to interrupt it. Repetitive tasks. No rotation. No progression. No novelty built in. The job was a perfect environment for the habit to do its work.
189. Not every departure fitted this pattern. Some young people left because they were bullied, or because the workplace culture was visibly grinding down the people above them, or because a care placement collapsed and took the job with it. Those exits belong to a different conversation about how employers treat young people in the early stages. But the pattern the phrase “quitting culture” is reaching for, the one employers find hardest to explain, is real. It is what happens when habits built on fragmented attention meet a work environment that assumes the opposite.
2.4 Confronting the myths
Myth: they don’t want to work
190. In addition to the 30% who wanted to move into education or training, our survey showed that 54% of young people wanted to work (both part time and full time). Only 11% said they don’t think they will ever move into work, education or training.[footnote 185] The King’s Trust Youth Index 2025 found that 29% of NEET young people have applied for jobs they do not want because they are desperate to work. 19% report applying for jobs every day. 22% say having a stable job is one of their biggest goals in life. 68% report feeling determined to achieve their goals. 67% say being in work would give them stability in life. 63% say it would help them feel confident about their future. 53% say it would be good for their mental health.[footnote 186] 69% of NEET people in our NEET survey agree that it is worth getting a job.[footnote 187]
191. Our qualitative research confirms this. Young people keep spreadsheets of applications. They spend hours each day on job sites. They lower their expectations, broaden their search, remove degrees from CVs. Even those furthest from the labour market, those with severe mental health conditions or care experience, described wanting a career, not just a job.[footnote 188]
192. These are not the actions of a generation that has opted out. They are the responses of a generation that is trying, repeatedly, and failing to gain entry. The aspiration is there. The opportunity is not.
Myth: they are a “soft generation” and just need to try harder
193. Nearly 25% of employers described young people as “lazy and work shy.” More than 33% called them “overly sensitive”. More than 25% called them “entitled”. 10% admitted to rejecting a young person for a job solely on the basis of their age.[footnote 189]
194. These stereotypes create a negative feedback loop: prejudice narrows opportunity, narrowed opportunity produces disengagement, and disengagement is cited as proof that the prejudice was justified.
195. A three year study found that 93% of young people have experienced negative treatment in the workplace because of their age, with 26% experiencing this treatment as so severe that it made them not want to work again.[footnote 190]
196. The qualitative research reveals young people who are trying, persistently and creatively, in the face of repeated failure. They take unpaid work. They travel hours for short Jobcentre appointments that “don’t really help you as an individual”.[footnote 191]
197. One young graduate was rejected from Costa, Mountain Warehouse and Sainsbury’s despite having a degree and university work experience: “You’re telling me I’m not skilled enough?” Another described the desperation: “Now things have become so desperate for me that I’m applying to anything and everything.” A third reflected: “I feel like that’s what rich people want us to do. They want us to just settle for anything you can get.”[footnote 192]
198. They are not passive. They are exhausted.
Myth: mental health is an excuse
199. Young people in our research described cycles of anxiety and avoidance. They described medication adjustments that left them unable to concentrate. They described being discharged from mental health services for non-attendance because they were too unwell to attend. They described applying for jobs when well, withdrawing when unwell, and losing ground each time.[footnote 193]
200. Young people are not inventing their distress. They are living with it, often without adequate support, in systems designed around binary categories of fit or unfit that bear no relationship to the fluctuating reality of their conditions.
2.5 The honest question: are they different?
201. Yes. They are.
202. Young people are different from those who came before them. Not worse. Not lazier. Not less intelligent. But different in ways that have material consequences. They have grown up in a digital world that has rewired how they communicate, how they form relationships, how they manage stress, how they spend their time. They have less experience of workplaces. They present with higher levels of anxiety and depression. They are more likely to disclose health conditions. They expect flexibility. They value purpose. They are less willing to tolerate poor treatment. Much of it reflects the world they were given, not the world they chose. And some of it, their insistence on purpose, their refusal to accept poor treatment, their openness about mental health, reflects values that the workplace would do well to learn from rather than resist. The question is not whether young people are different: they are. The question is whether we are willing to embrace that difference, to redesign the pathways, adjust the expectations, reform the institutions and meet this generation where they are rather than where we wish they were. Every previous generation was different from the one before it. The systems previously adapted. This time, they have not. I believe that is not a failure of young people, but a failure of a system stuck in the past.
Summary
203. I want to end this chapter where it began: with the voices of the young people who gave their time to this review. ‘Katie’, who has a degree and a clear career goal, spends her days in rural Scotland applying for jobs she cannot get without experience she cannot afford to gain:
You need two years of experience to get an entry level job, but you have to be able to fund yourself to do that.[footnote 194]
‘Anna’, who completed a BTEC, volunteered and gained a vocational qualification, still cannot get hired:
If you don’t have any experience, qualifications aren’t very helpful. It’s like a roadblock.[footnote 195]
‘Rebecca’, who attended eight secondary schools and is adjusting to new medication wants a career, not just a job:
If my mind’s not situated, I can’t focus on other things.[footnote 196]
Different stories, different starting points, but one common thread: none of them has chosen to be NEET.
204. The young people who spoke to this review described compounding barriers, diminishing support and systems that too often treated them as a problem rather than a person. They spoke of applying for hundreds of jobs without feedback, of trying to manage fluctuating mental health, and of having to navigate services that too rarely joined up around their needs. Yet they also spoke consistently about wanting to work, build a career, find stability and contribute. The King’s Trust Youth Index 2025 shows that 67% say work would give them stability and 53% better mental health.[footnote 197] The issue is not a lack of aspiration. It is a lack of support from systems that should educate, guide and help young people into adult life, but too often fail to do so. The chapters that follow examine those failures in the labour market, education, health and welfare systems. But the central conclusion of this chapter is clear: if this is how young people experience the systems designed to support them, then those systems are not working as they should.
Chapter 3: the youth economy – how the labour market produces detachment
205. Even at its economically strongest, the UK has never brought the NEET rate down to the levels achieved by comparable countries. Around one in eight young people are neither in education nor work. In the best-performing countries, it is closer to one in twenty.[footnote 198] That gap represents hundreds of thousands of young people.
206. The answer is not that young people have become less motivated or educated. As we examine in Chapters 4 to 6 there are faultlines in the education, health and welfare systems that are contributing to the UK’s NEET problem. But a compounding change that is often ignored has been in the labour market itself. The routes in for young people have weakened. Entry-level opportunities have narrowed. Labour market structures have changed. Employers are less likely to take a chance on someone young, inexperienced and suffering from anxiety or depression. For a sizeable minority, the labour market no longer performs the function it once did.
207. For most young people, it still does. They leave education, find work and move on. But for a growing minority, that transition is breaking down. Time out of work is no longer simply a short phase before a first job. It is becoming more prolonged, more fragile and, for too many, a route out of the labour market altogether.
208. For more than two decades, successive governments have responded to youth disengagement through supply-side interventions. Policy has prioritised preparing young people for the labour market: improving their skills, activating their job search, reforming their benefits. Those things matter. But they have not brought the structural NEET rate anywhere close to the levels seen elsewhere. The assumption has been that if supply improves, demand will absorb it. That assumption no longer holds. The labour market itself has changed.
209. In headline terms, the youth share of the labour market has decreased even as employment overall has increased. In other words, the demand side matters as much as the supply side. Part of the reason this has not been a big enough arena of focus is that the deterioration in young people’s labour market participation has been concealed. It has been obscured by economic cycles and particularly by rising youth participation in education. The labour market doing less has been, in part, compensated for by the education system doing more. But compensation is not the same as a lasting solution to the NEET problem. As we explain later, the education ‘shock absorber’ has weakened, leaving more young people exposed to the risk of becoming NEET.
210. So while previous reviews have tended to see the NEET issue mainly through a supply-side lens, this chapter argues that the demand side now matters at least as much: how the labour market is structured, how employers recruit, and how easy or difficult it has become for young people to get a foothold. Unless both supply and demand sides are addressed together, the problem will persist. Better-prepared young people arriving at a labour market that no longer reliably absorbs them will not be enough. It is striking that of the NEET population, nearly 30% are now getting good GCSEs or equivalent, over 21% have a Level 3 qualification and 15% have a degree.[footnote 199] Yet the labour market is not absorbing them. That is particularly true since the pandemic. The system was not working well enough before then. It is working less well now.
3.1 Trends in youth participation
211. The headline NEET rate has spent most of the last three decades in a relatively narrow range. Even in better periods, it has rarely fallen much below 10%.[footnote 200] On the surface, that can make the problem look persistent but broadly unchanged. But that headline story is misleading. Underneath it, the nature of youth detachment from the labour market has been changing.
212. To see that, it is not enough to ask how many young people are out of work. We need to ask what kind of detachment we are looking at. At a headline level there is a distinction to be made between two groups: the unemployed and the economically inactive. The unemployed are out of work, looking for a job and available to start. The economically inactive are not looking for work, not available, or both.
213. Unemployment is especially prone to volatility of economic demand rising or falling. Young people entering the labour market are especially exposed to that volatility. In a period of downturn or slow growth, employers find it easy to turn off the recruitment tap and young people pay the price.
214. But youth employment tends to bounce back when growth resumes. The problem is over recent years, more NEET young people have become economically inactive. As we show below, more of them are becoming inactive on grounds of ill health, so prolonging their detachment from the labour market. Once these young people stop looking for work, the route back is much harder.
215. The headline NEET figure obscures what is really changing. Behind that apparently stable 10% to 16% lies a more serious shift. This is no longer simply a story of young people moving through unemployment while they wait for the economy to recover. For a growing proportion of NEET young people, it is a story of detachment.
216. That is why economic growth alone will not solve the problem. Recovery will bring some unemployed young people back into work. It will do much less for those who have already stopped looking. They need more than stronger demand. They require routes in to work that have been lost, support that has thinned out, and a labour market better able to bring them back.
A structural shift in participation
217. The 21st century has seen a substantial jobs boom in Britain. There are around seven million more people in work than at the turn of the millennium. But young people have not shared in that growth. The number of workers aged under 25 has fallen. Young people once made up around one in seven workers. Now it is closer to one in nine.[footnote 201] The youth share of the workforce has shrunk even as overall employment has grown.
218. The employment figures make the point clearly. At the turn of the century, around 63% of young people were in work. Now it is barely 50%. Over the same period, the employment rate for those aged 25 to 64 rose from 74% to 80%.[footnote 202] Older adults moved further into work, while young people moved in the opposite direction.
219. The obvious question is why this did not produce a much larger rise in the NEET rate. The answer is that something else changed at the same time. Young people did not simply leave the labour market. More of them moved into education instead. The long-term decline in youth employment has been partly offset by a long-term rise in participation in education. That shift accelerated after the financial crisis and again after the pandemic.
220. The shift is clearest among the youngest. Employment among in those aged 18 and under has fallen from 47% a generation ago to around 20% today. At the same time, the proportion of those in full-time education who are also in work has halved, from 40% at the turn of the century to 19% now.[footnote 203] Young people are not just less likely to be working, but are also less likely to have any foothold in the labour market while they study.
221. Among young people not in education aged 18 to 24, employment still rises and falls with the cycle. It reached 77% before the pandemic, returned briefly to that level in summer 2022, and has since fallen sharply to around 70% for the first time since 2013.[footnote 204] That is an important warning sign. Outside education, young people are now less likely to be in work than at any point in the past decade.
222. Figure 14 shows the broader change. It tracks the proportion of young people in employment, in education, or in both since 2000, with those aged 16 to 17 shown by dashed lines and those aged 18 to 24 shown by solid lines.
223. For those aged 16 to 17, the fall in employment has been dramatic. The proportion in work only has fallen sharply, and the proportion combining work and education has fallen as well. Taken together, that is a decline of 26 percentage points, from 46.5% to 20.2%. But almost all of that decline has been matched by a rise in full-time education.[footnote 205] Young people have not dropped out. They have shifted from work to study.
224. For those aged 18 to 24, the direction of travel has been away from work and towards education. Employment only is down by 10.4 percentage points. The proportion combining work and education is broadly unchanged. But the proportion in education only has risen by 6.5 points.[footnote 206]
225. What made this manageable in the past was that education acted as a shock absorber. After the financial crisis, weaker labour market demand was accompanied by a sustained rise in participation in education. More young people stayed in learning for longer. What is different now is that the labour market has weakened again without the same compensating increase in education. That is the real concern: we are now seeing a weaker transition into work without the same protection from rising participation in learning.
Figure 14: Indexed proportion of young people in employment and/or full-time education, UK, 2001 to 2025
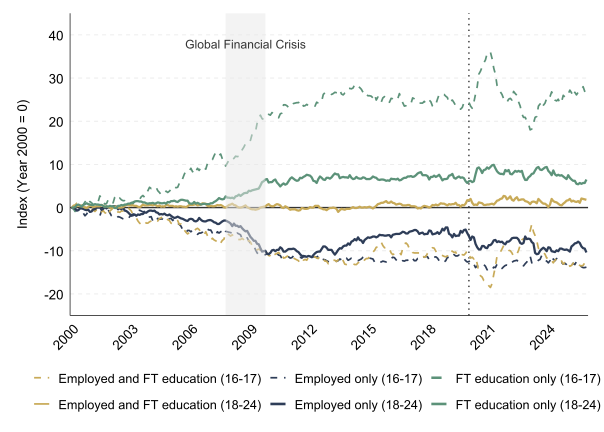
Source: Labour Force Survey
Note: dashed line represents break in series
Unemployment rises aren’t just about weaker demand
226. Unemployment among young people has risen from 9.2% in mid-2022 to 15.8% now.[footnote 207] There are signs that the recent rise in youth unemployment is not simply cyclical. Recent research by the Resolution Foundation comparing the unemployment rate in people aged 25 and over, with the NEET rate for those aged 18 to 24, suggests the latter is higher than pure labour market conditions would imply it should be. [footnote 208]
227. Similarly, youth unemployment has risen by more than the level of vacancies alone would lead us to expect. The practical consequence is straightforward: more young people are spending longer out of work. More than a quarter of a million have now been unemployed for over six months, the highest figure since early 2015.[footnote 209]
228. This matters because, on paper, the issue is not simply one of too few jobs. Nationally, there are roughly 1.5 vacancies for every unemployed young person who is not in education.[footnote 210] Yet those vacancies are not translating into jobs for young people at the rate they once did.
229. The problem is not only the volume of demand. It is that the mechanisms that used to bring young people into work are working less well. Over time, the labour market has become less effective at converting vacancies into entry for those at the start of their working lives.
230. The policy implication is clear. It is not enough to focus only on the quantity of jobs in the economy. We also need to focus on how young people reach them, how employers recruit, and why the transition into work has become less reliable than it once was.
3.2 The first rung has thinned
231. A number of factors are at work here, and young people tend to feel them first and most sharply. They are the group entering the labour market, moving through it and trying to gain a first foothold. They are also more concentrated in sectors with higher turnover and less represented in the parts of the economy that are more stable. Jobs in entry level sectors have declined in recent years.[footnote 211]
232. But the problem is not simply that there are fewer jobs young people can do. It is that the routes into work have narrowed. The first rung has thinned. The clearest examples are the decline of the Saturday job and the way the apprenticeship system has drifted away from young people.
233. For earlier generations, these were often the routes through which young people first entered working life. They provided income, but they also helped young people build confidence, learn the habits of work and show employers what they could do. For too many young people now, those opportunities are weaker or have disappeared altogether. Labour force survey data, for example, shows a fall in the number of students aged 16 to 17 doing any work from 35% in 2006 to 19% today.[footnote 212]
234. That matters because employers still ask for confidence, experience and work-readiness. But the labour market now offers fewer ways of acquiring them. The result is a more difficult and more fragile transition into work. Young people are caught in a trap: employers ask for experience, but the pathways through which it was once gained have narrowed or gone.
Youth-employment sectors have declined
235. The sectors that have traditionally absorbed many young people have contracted, restructured or changed the nature of the jobs they offer. This is not simply a story of fewer jobs overall. It is the erosion of the labour market’s base layer: the roles that once tolerated inexperience and provided a first foothold.
236. Half of all youth payroll employment is concentrated in just three sectors: wholesale and retail, accommodation and food services, and health and social care. Young people account for only around 13% of payrolled employment overall, but they are far more heavily represented in wholesale and retail and accommodation and food services.[footnote 213] When these sectors change, young workers feel the effects first and most sharply.
237. Retail was for decades the single largest employer of young people. Online shopping has risen from less than 5% of retail sales in 2008 to more than 26% in 2024.[footnote 214] There were 8,000 fewer retail outlets on high streets in 2025 than in 2019.[footnote 215] Employment in the sector remains below pre-pandemic levels, while vacancies have fallen sharply over the past decade.[footnote 216][footnote 217] Where retailers do recruit, many now prefer to extend the hours of existing staff rather than take on new part-time workers who may need support and supervision.
238. Accommodation and food services were badly hit during the Covid-19 pandemic. Hospitality vacancies have fallen by around half in four years.[footnote 218] Health and social care presents a different problem. Demand is high and vacancies are chronic, but these roles have not become a large-scale route in for young people. The work is demanding, emotionally taxing and often poorly paid, with very high turnover.[footnote 219] Entry commonly requires DBS checks, mandatory training and, in many cases, a driving licence.[footnote 220]
239. At the same time, the jobs within these sectors have become less accessible to those without experience. Work that once offered a relatively straightforward way in has become more demanding. Customer service roles now involve handling complex queries across multiple digital channels. Warehouse jobs require speed, precision and compliance with tightly managed performance systems. Retail work has been reorganised so that fewer staff are expected to do more. The result is not simply fewer entry-level jobs, but more conditional access to them. The quality of work available to young people has also worsened. Young workers aged 16 to 24 are far more likely than older adults to be in severely insecure work.[footnote 221] More than one in ten are on zero-hours contracts, compared with a very small share of older workers.[footnote 222] Research suggests that while insecure work can be a stepping stone for some, a substantial minority remain trapped in it or move from insecurity into unemployment.[footnote 223] Other routes have weakened too. Self-employment among those aged 25 and under has fallen since 2020.[footnote 224] Platform and gig work has not made up the difference. It can provide income, but it rarely offers training, progression or a durable connection to an employer.[footnote 225] When it becomes the only option, it does not provide a firm foundation for a working life.
240. The pressure is now extending further up the labour market. Graduate hiring has fallen 8% year-on-year, overqualification among adults is high by international standards, and graduate NEET rates have risen.[footnote 226][footnote 227][footnote 228] When the graduate labour market tightens, the effects cascade downwards. Graduates compete for roles that would previously have gone to non-graduates, compressing opportunity further down the ladder.
241. The cumulative effect is not simply fewer jobs. It is fewer jobs that young people can realistically enter and build from. Entry pathways have narrowed from several directions at once. The policy challenge is therefore not just how to create jobs, but how to rebuild routes into the jobs that exist.
Fewer entry level jobs
242. Long-term changes in the occupational structure of the economy have altered the kinds of jobs available to young people. Over the past 20 years, the number of mid- and lower-skilled jobs in the economy has fallen by around 1.6 million, while higher-skilled jobs have grown by around 6.3 million. Reference E. Young people are overrepresented in the jobs that have declined and underrepresented in those that have expanded.
243. At one level, that reflects a more productive and more highly skilled economy. But it also creates a harder labour market for those at the start of working life. There are fewer entry-level roles than there once were, while competition for them has intensified. The result is a growing imbalance: fewer lower-skilled jobs, more people chasing them, and continued growth in jobs that many young people are not yet qualified to do. Young people are squeezed at both ends. They are disadvantaged in the competition for lower-skilled roles because they lack experience, and excluded from higher-skilled roles because they have not yet acquired the qualifications, training or skills those jobs require. That is one of the reasons the transition into work has become more difficult.
The death of the Saturday job
244. What is often described as the decline of the Saturday job is really part of a broader change: the loss of flexible, part-time work that could be combined with study and that gave young people early, low-stakes exposure to working life.
245. Some of those jobs disappeared because the economy changed. There are far fewer young people delivering newspapers, for example. But that is only part of the story. The decline has also been driven by changes in employer behaviour. The economics of hiring, together with changes in the regulatory environment, have made casual roles less attractive to offer.
246. The upshot is that fewer teenagers now have any experience of paid work before leaving education. Figure 15 shows that the proportion of young people who have never had a paid job has increased by 17% in the last 20 years. More arrive at adulthood without employer references, without familiarity with workplace norms, and without the confidence that comes from having worked before. A labour market that expects prior experience then reinforces the problem. Young people are asked to demonstrate work-readiness through opportunities they have had fewer chances to acquire.
Figure 15: Proportion of NEET young people who have never had a paid job over time, UK, 2005 to 2025
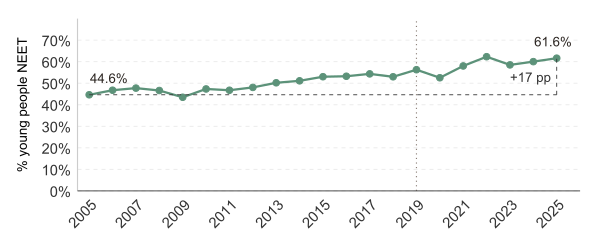
Source: Labour Force Survey Note: dashed line represents break in series.
The apprenticeship drift
247. The apprenticeship system ought to be one of the main routes through which employers bring young people into work. Too often it is not operating that way. The Apprenticeship Levy, introduced in 2017, has in practice driven a significant reallocation towards older workers and higher-level qualifications. It has been captured by the economic logic of upskilling existing employees. The entry-level provision that matters most for young people outside work has been hollowed out.
248. In England, starts for those aged 16 to 24 have fallen by 35% since the Levy was introduced.[footnote 229] Level 2 starts for young people have fallen by 68%.[footnote 230] Level 3 starts are down by around 20%.[footnote 231] Only 4% of those on apprenticeships were previously NEET.[footnote 232] Participation among young people from the most deprived areas has declined particularly sharply.[footnote 233] Chapter 4 examines the apprenticeship system in greater detail.
249. Employers remain broadly positive about apprenticeships in principle. But the review heard repeated concerns that the system has become too rigid, too compliance-heavy and too skewed towards those already inside the workforce. Many reported the levy is too inflexible and that they would value the ability to use funds for shorter courses, pastoral support, pre-apprenticeship activity or backfilling costs. On average, employers reported spending only around 42% of their levy funds.[footnote 234]
Changes in how jobs are recruited and filled
250. A generation ago, many entry-level jobs were filled through informal routes: a family contact, a speculative visit or short conversation with an employer. Those routes were imperfect and often unfair. They could reproduce advantage and shut outsiders out. But they gave young people a chance to be seen in person and allowed employers to judge potential as well as experience.
251. That has changed. Recruitment for even low-skilled and entry-level roles is now much more formalised and much more remote. Online application portals, automated screening, psychometric tests, recorded video interviews and multi-stage recruitment processes are increasingly being used for jobs that require little or no formal qualification. A young person applying for a warehouse or retail role may now face a process more like professional recruitment than first job hiring.
252. That shift matters. These systems tend to reward confidence, familiarity with recruitment conventions, digital access and the ability to navigate formal processes. They are less good at recognising potential in young people with little experience. A young person with anxiety, weak digital access, no quiet space and no one to help them through the process starts at a clear disadvantage. The result is a system that produces rejection at scale, often with no human contact and no feedback. As we heard described by young people in Chapter 2, for those already on the edge of the labour market, that can be actively discouraging. The issue is not simply that recruitment has become more efficient. It is that, for many entry-level roles, it has become less accessible to the people it ought to be bringing in.
The public sector as employer
Central government, local authorities, the NHS, schools and other public bodies collectively account for approximately one fifth of total employment.[footnote 235] In many high-NEET areas, the public sector is the dominant employer. The state accounts for a significant share of employment in precisely the places where youth detachment is highest. It could be doing more.
The age profile has shifted older. In many local authorities, budget cuts and recruitment freezes have reduced entry-level positions that were once a reliable route into work. Under 25s currently make up less than 5% of the local government workforce.[footnote 236]
The public sector can take a longer view on investing in a young worker. It has the institutional capacity for structured induction and supervision. It is accountable to the communities it serves. Anchor institutions such as NHS trusts, universities and local councils can shape demand through procurement, training commitments and workforce planning. Where local leaders actively coordinate these actors, entry pathways are more visible. Where coordination is weak, fragmentation persists.
Britain’s infrastructure challenge should be an opportunity
Britain is undergoing a huge and necessary overhaul of vital infrastructure, at the same time as having close to a million young people out of work. This should be a win-win. Take the East of England. Large projects like Sizewell C are planned in the region. Many currently bring a large proportion of their workforce in from overseas. Given the long-term nature of these projects, they should be a bigger part of the answer to the NEET crisis. There are a number of reasons for the disconnect – many of which we cover throughout this report. Poor transport links, a lack of join-up in the skills needed and those being provided. And historically, the absence of a coherent place-based approach with a clear direction and ask from government. The solutions aren’t straightforward, but the opportunity is there.
3.3 What employers now face: work-readiness, health and the pastoral burden
253. Employers increasingly describe a gap between what many young people bring with them into the labour market and what workplaces now expect from the first day. That came through clearly in the evidence to the review. Only 3% of employers recruiting 16-year-olds to their first job, and 1% recruiting FE leavers, identified poor literacy or numeracy as the main issue.[footnote 237] Employers pointed instead to lack of experience of the workplace, lower confidence and weaker work-readiness. The issue is less that young people lack basic skills, but that too many have had too little exposure to how workplaces operate before being expected to succeed in one.
254. As we explore in Chapter 4, the institutional bridges that should match supply and demand have weakened. Apprenticeships have drifted upward in level and age. Careers guidance is under-powered. FE colleges, the primary institutional bridge for the most at-risk young people, are funded to enrol and complete, not to place and sustain. Those problems are compounded by a decline in work experience and other forms of contact with the workplace. Too many young people now leave full-time education with little or no direct exposure to working environments. OECD analysis of PISA 2022 shows that disadvantaged students are significantly less likely than their better-off peers to have taken part in workplace visits, job shadowing and other career-development activities that connect them to people in work.[footnote 238] This matters because those early encounters with work do more than provide information. They build confidence, familiarity and a sense of what employment involves. Figure 16 suggests that the UK has among the lowest levels of work-experience participation internationally, with particularly low take-up among disadvantaged students.[footnote 239] When exposure to work is weak, uncertainty about future pathways is higher and the transition into employment becomes more difficult.
255. The result is that many young people now arrive at the labour market with less experience of working life than previous generations, at the same time as employers are expecting more from new entrants. That is not a problem of attitude. It is a problem of preparation and exposure.
256. Figure 16 shows how few students in the UK participate in work experiences compared to OECD countries, with only two countries having lower proportions. In response to the Employer Survey conducted for this report, employers cited previous work experience as both a main barrier to young people’s employment opportunities (Figure 17) and a challenge that they experience when hiring young people (Figure 18).
Figure 16: The percentage of students agreeing that they had participated in job shadowing or a work-site visit, OECD countries, PISA 2022
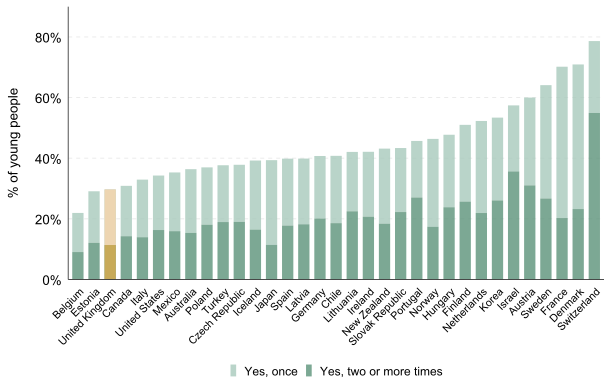
Source: OECD, The State of Global Teenage Career Preparation, May 2025
257. In their engagement with the review, employers also pointed to a wider support challenge, employers also pointed to a wider support challenge around anxiety, confidence, reliability and the ability to cope with workplace demands from the first day. Several pointed to weaker interpersonal confidence among some young applicants: speaking to customers, answering the phone, dealing with pressure and operating in unfamiliar environments (Figure 18). Some of this reflects the loss of early exposure to work. Some reflects disruption during the pandemic. As we set out in Chapter 2, the young people presenting at the door of the labour market in 2025 are different in important respects from those who did so fifteen or twenty years ago, in ways that have material consequences for hiring, induction and retention.
258. Employers marked a rise in young people disclosing anxiety, depression and other health conditions that affect attendance, stress tolerance and consistency at work. Rising rates of mental ill health and neurodevelopmental conditions are having a growing effect on whether young people enter work, sustain it and progress within it.
259. That has important implications for policy. It means the problem cannot be treated as one of skills alone. A labour market that has become more demanding, combined with a rising prevalence of health-related barriers, creates a much harder transition into work for a significant minority of young people. Unless health is addressed alongside employer behaviour, job design and wider labour-market structure, reforms to skills and employability will have limited effect. Many employers are sympathetic. But they are not clinical services, and many do not feel equipped to provide the level of support some young workers now need. One large employer told the review it had found it necessary to employ a full-time social worker to support younger staff. For smaller firms, that kind of need can make hiring an inexperienced young person feel much harder to manage. This is not an argument against young people. It is a recognition that employers are being asked to absorb more health, confidence and support needs at the same time as many have become less able or willing to do so. If employers are expected to carry more of that burden, they will need more support themselves: better access to occupational health, funded induction and retention support, and a system that recognises that the costs of helping a young person settle into work go beyond wages alone. In Britain today, most young people and most small employers have little or no access to that kind of support. Where it is absent, retention becomes harder and early exit more likely.
Figure 17: Employers’ perceived main barriers to young people’s employment opportunities
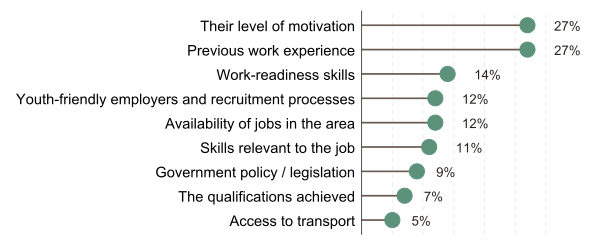
260. Source: Young People and Work Employer Survey[footnote 240]
Figure 18:Main challenges employers experience when hiring young people
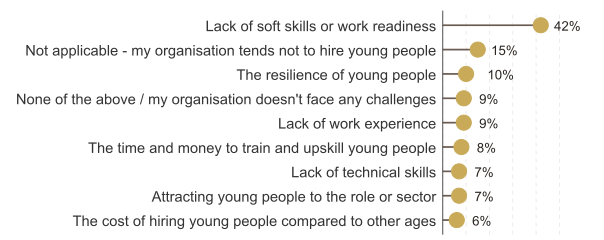
Source: Young People and Work Employer Survey[footnote 241]
3.4 The economics of hiring
261. Meanwhile, the cost and regulatory burden of employing young people has risen. Since 2019 to 2020, minimum wages for young workers have risen sharply. The rate for people aged 21 to 24 has increased by 65%. For those aged 18 to 20 the rate has increased by 76%. And for anyone under 18 the rate has increased by 84%.[footnote 242] Over the same period, the rate for those aged 25 and over increased by 55%. These are substantial changes in the cost of employing younger workers.
262. This issue was raised with us repeatedly by employers. Many employers, especially large ones, already choose to pay everyone the adult rate regardless of age. But those employers who do rely on the youth rate, especially SMEs in entry-level sectors like hospitality, identified the rise as a disincentive to employing young people.[footnote 243] This is heavily contested by others. The TUC, for example, told us that ‘[the] Low Pay Commission show that 85% of 18 to 20-year-olds are already paid above the youth minimum wage. 63% are paid at or above the national minimum wages or not covered by the youth rate at all (Figure 6.9, page 123, Low Pay Commission Report 2025). The Commission has also shown that the areas where youth employment has done best are the areas where minimum wage coverage is highest’.
263. The evidence on employment effects is mixed and still incomplete. An evaluation of the 2021 changes, when those aged 23 to 24 moved onto the full adult rate, found a statistically significant reduction in working hours in low-paid sectors, of around 5%.[footnote 244] New IFS analysis of more recent rises since 2024 suggests youth minimum wage rates are unlikely to have significantly reduced youth employment.[footnote 245]
264. Similarly, the Low Pay Commission’s preliminary analysis, published in April, does not point to a simple economy-wide effect. The picture varies across sectors and places. Areas with the largest falls in youth employment are not always those with the highest concentrations of young minimum-wage workers.[footnote 246] That suggests other factors are also shaping what has happened.
265. On the other hand, many employers, particularly small and medium-sized firms in entry-level sectors such as hospitality, describe recent wage increases as changing the economics of hiring younger workers,[footnote 247] and in particular point to the compression of the pay gap between younger and older workers. If the cost of hiring someone who is 19 moves closer to the cost of hiring an older worker with several years’ experience, some employers will choose the safer option. The point is not that young people should be paid less. It is that when the cost of entry-level labour rises, the case for taking on someone inexperienced becomes harder unless employers are given support to offset the risk.
266. The increase in employer National Insurance contributions and the threshold changes announced in the October 2024 Budget added to the cost of employment for workers of all ages. More than 30% of employers said they expected to operate with fewer staff as a result.[footnote 248] We saw analysis by the Centre for Policy Studies suggesting that the annual cost of hiring a young person had risen by around £4,000[footnote 249] and the increase in employer NICs was felt in hospitality and retail, sectors that have historically provided many of the easiest points of entry into work. But it is worth remembering that those under 21 remain exempt from employer NICs and, as the review has already highlighted, the increase in youth inactivity long precedes any recent changes to NICs.
267. For many employers, the changes to NICs were felt alongside other changes affecting the cost and risk of hiring. Employment Rights Act reforms, while intended to strengthen worker protection, were seen by some employers as increasing the burden of managing underperformance and reducing flexibility, particularly in relation to zero-hours contracts and statutory sick pay. The government’s shift to a six-month probation period may have helpfully reduced the biggest barrier to hiring although the legislation is too new for firm conclusions about its employment effects. But employers often respond to anticipated risk before the evidence is settled.
268. Wages, taxes and regulations all have an impact on the labour market, but the UK’s NEET crisis is much more long-term and deep-seated than any decisions taken in the last few years. The critical thing is this: if public policy aims to increase youth participation, it has to help minimise risks and maximise incentives. It needs to avoid creating a labour market in which costs of entry have risen but the incentives to provide it have not.
Transport and housing: the barriers nobody counts
In this review, transport recurred repeatedly as a hidden driver of youth detachment from the labour market. Transport is the infrastructure of participation. If a young person cannot physically get to the college, the interview, the apprenticeship or the job, nothing else the system offers matters. For too many young people, they cannot.
Journeys on bus services in England outside of London have fallen by 22% since 2010.[footnote 250] In rural areas the decline has been sharper still. Entire communities have lost their evening and weekend services. The cuts have fallen disproportionately on rural, coastal and former industrial areas, precisely the places where NEET rates are highest. A young person offered a hospitality shift finishing at 11pm in a town twelve miles from home with no evening bus has not been offered a job. They have been presented with a problem they cannot solve.
Young people are also less likely to drive than previous generations. The proportion of those aged 17 to 20 holding a full driving licence fell from 48% in the early 1990s to around 29% by 2024.[footnote 251] For a young person on Universal Credit or no income at all, car ownership is out of reach. After 18, there is no national concessionary travel entitlement for young people outside London. For a NEET young person with no income who is not claiming benefits, public transport is not a cost. It is an impossibility.
The relationship between transport and participation is direct and measurable. Research for the Social Exclusion Unit found that two in five young people had turned down a job, training or education opportunity because of transport problems.[footnote 252] Transport concerns were listed as one of the three main reasons why students considered leaving college.[footnote 253]
London is the exception that proves the rule. Free bus travel for those under 18 and discounted travel for anyone 18 to 21 removes transport as a barrier to participation. London also has the lowest NEET rate of any English region and the strongest post-16 destination outcomes.[footnote 254] Transport is obviously not the only reason; but it is no coincidence that the city with the best youth transport offer has the best youth participation outcomes.
Housing costs compound the picture further. The interaction between the housing crisis and youth labour market access is direct. Young people who cannot afford to live independently near employment centres are constrained to their parental home and the local labour market it sits within. Resolution Foundation analysis has shown that the share of people aged 18 to 34 living with their parents rose from around 25% in the late 1990s to nearly 40% by 2021 to 2022.[footnote 255] For many, this is not a lifestyle preference, but a binding financial constraint.
A young person in a high-NEET area with weak local demand cannot realistically relocate to where the jobs are. Housing costs, family ties, caring responsibilities and benefit rules all anchor them in place. Joseph Rowntree Foundation research has consistently identified housing insecurity as a driver of employment instability among young adults.[footnote 256]
3.5 Future risks and opportunities
269. Detachment from the labour market among the young is growing. The consequences for the young person of a weak transition into work are serious because they have a long-term scarring impact. What begins as delayed entry can harden into long-term detachment, with lasting effects on earnings, health and participation. Once that happens, the costs are borne not only by the individual, but by the wider economy and society.
270. Without deliberate intervention, these pressures are likely to intensify. Rising skills demands and worsening ill health among young people all point in the same direction: a labour market in which secure entry becomes harder, not easier. Technological change could make matters worse not better.
Technology
271. Artificial intelligence and automation are likely to add further pressure to the entry-level labour market. Many of the roles most exposed are those that have traditionally provided a foothold for younger workers: administrative support, data entry, routine customer service and clerical work. Early evidence suggests that vacancies in more AI-exposed occupations are falling faster than in less exposed parts of the labour market, and US evidence points to weaker employment outcomes for younger workers in more exposed industries.[footnote 257][footnote 258]
272. That evidence is still emerging and it would be premature to treat AI as a major cause of the current NEET problem. But it would be equally mistaken to ignore it. A technology that changes the content of work across large parts of the economy is likely to affect the jobs through which many young people have traditionally entered employment.
273. On the positive side of the equation the CIPD argue that AI-driven tools can improve job matching, personalise support, translate skills more effectively, and connect jobseekers to training, healthcare, and flexible opportunities.[footnote 259] Evidence shows that AI can help more people into work and help employers find talent they would otherwise miss. But most commentators tend to take a more pessimistic view about AI’s impact on the youth labour market.
274. Some of the most exposed roles are in knowledge and office-based work rather than in manual and service occupations. But that does not remove the risk to young people. If opportunities narrow at one level of the labour market, pressure is pushed downwards. Workers displaced from more skilled or administrative roles compete for other jobs, and the competition for entry-level work becomes more intense.
275. The risk, then, is not simply that some jobs disappear. It is that routes into work become narrower still. That is why the impact of AI on youth employment needs to be taken seriously now, even if the evidence is not yet sufficient to support firm conclusions about scale. It means that the education system has to do more to equip young people with the agility and adaptability needed to thrive in a complex and fast-changing labour market. As we suggest in Chapter 4, that is not happening at sufficient pace or scale.
Migration
276. If technological change is, overall, a potential future threat to young people’s labour market participation – at least in the short term – there may be better news as a result of another big tectonic shift – in levels of migration. Here the future opportunities outweigh the potential challenges.
277. The relationship between immigration and the youth labour market needs to be treated carefully. This review does not find evidence that migration is a primary driver of rising NEET levels. The main forces identified in this chapter lie elsewhere: weaker entry routes, a harder transition into work, and a labour market that has become less effective at bringing young people in.
278. That does not mean migration is irrelevant. Young people and migrant workers may compete for some of the same jobs, particularly in lower-paid sectors. Net migration has been historically high over recent years, concentrated in the sectors that serve as primary entry points for young workers: hospitality, social care, food processing, warehousing, agriculture. In hospitality for example, 31% of workers are immigrants and 36% young.[footnote 260] Migrant workers typically have arrived with prior experience and a willingness to work irregular hours. If an employer has a choice between someone who is 28 with five years of experience and some who is 18 with no work history, the hiring decision can be economically rational.
279. But the relationship between migration and youth employment is not straightforward. The effect depends on how employers recruit, how labour demand adjusts, and whether changes in migration alter the number, quality and conditions of jobs on offer. The current evidence does not support a simple displacement story.
280. The evidence base is also limited. It is difficult to isolate the effect of migration on young people’s employment outcomes, not least because many young people respond to weaker labour-market conditions by staying in education for longer. There are also important gaps in our understanding of how migration affects hours, flexibility, training opportunities and job quality in the sectors where young people are most likely to work. And there is also a debate about the broader impact of migration on growth, which in itself could lead to higher numbers of job opportunities for the very young people we want to help.
281. What can be said with greater confidence is that net migration has already fallen considerably.[footnote 261] We could even be heading for a temporary period of net emigration. How long that would last is uncertain. Current figures show that net migration fell from 649,000 in year ending June 2024 to 204,000 in the year ending June 2025 (Figure 19).[footnote 262]
282. Already employers in sectors that have been reliant on migration are expressing concern about the potential impact on their ability to recruit the labour they will need – for example, UK Hospitality warned changes to the migration system would worsen labour shortages.[footnote 263]
283. Conversely, it could be argued that too many employers have been on ‘easy street’ for too long, able to source labour from overseas whilst ignoring labour supply closer to home. Now they face the consequences, alongside a sharp dilemma. The question is whether they are prepared to change their recruitment, on-boarding and employment practices to attract more young workers from the UK into their workplaces. Lower migration will not, by itself, solve the problems described in this chapter. A reduction in labour supply from overseas does not automatically create better opportunities for young people from the UK. It is possible that we will see employers responding to hard-to-fill vacancies by upskilling existing staff or extending their hours of work rather than recruiting new workers. Much depends on whether employers are willing to change their recruitment behaviour and whether public policy will aid them in doing so. But falling levels of net migration could create a big potential opportunity for helping address the NEET crisis if both can be made to happen in tandem. If government wants more young people in work, it will need to influence employers’ behaviour, entry routes, and the systems that support transition into employment.
Figure 19: Net migration the UK (people), 2015 to 2025
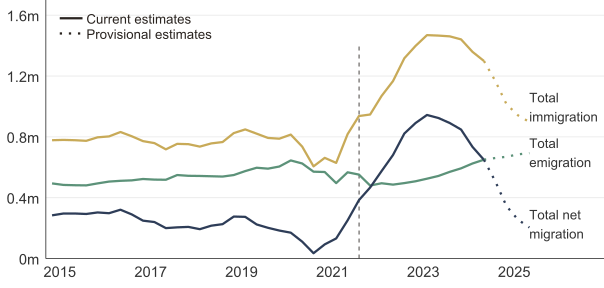
Source: ONS, Long-term international migration, provisional: year ending June 2025
Note: dashed line represents implementation of new counting methodology
3.6 What does all of this mean?
284. The youth labour market has changed in ways that have made the transition into work harder for those most at risk of becoming NEET. Youth employment has fallen. Entry-level sectors have weakened. Recruitment has become harder to navigate. Employers face higher costs and greater perceived risks in taking on inexperienced workers.
285. Too often these have been treated as separate problems. They are not. Together, they amount to a labour market that is no longer doing enough of the work of bringing young people in. This is not simply a cyclical downturn, nor a problem that can be solved by better supply-side policy alone. There is evidence of a structural weakening of the transition into work.
286. The consequences fall hardest on those with the least margin for error: young people with weak qualifications, poor health, little exposure to work, or limited support in navigating the labour market.
287. Better skills, stronger employability support and clearer expectations all matter. But they will not be enough unless they are matched by a serious labour-market strategy: one that reduces the risks of hiring, rebuilds routes into work, strengthens local brokerage, and expects more of major employers, including the public sector.
288. The question is not simply how to prepare young people better for work. It is how to build a labour market that is willing and able to bring them in. Until we do that, we will continue to produce a level of youth detachment that should not be accepted in a country with this wealth, and this level of unmet need.
289. But a stronger economy with less burdened employers would not by itself solve the NEET crisis. Much of it begins long before the labour market – in the home, the school, the health system and the welfare architecture examined in the next chapters.
290. If the NEET crisis is to be solved, demand and supply side policy has to work in sync in a way that it has not been doing. It is to the supply side that we now turn.
Chapter 4: education and skills – the faltering foundation
291. As the previous chapter highlights, the NEET problem is shaped by actors beyond the state, most notably employers. But the state has responsibility for ensuring that young people are equipped to make a successful transition from childhood into adulthood, including into employment. The systems designed to do exactly that – education, health and welfare – are not succeeding for one million young people. There is much focus on welfare reform in the debate about how to solve the NEET crisis. There is far too little on wider state reform. It is the latter that is needed.
292. The school and skills systems provide the conveyor belt that moves young people from the world of education into the world of work. In this chapter we explore what that system is doing well, and where it is failing to provide too many young people with the foundations they need to succeed in the labour market.
4.1 What happens outside the school gates
293. But first, an important piece of context. A study for the Department for Education found that 84% of the variation in GCSE attainment is explained by individual pupil factors or factors outside the school gates.[footnote 264] Schools matter enormously. But they operate on only a minority of the factors that shape outcomes.
294. What happens at home – parenting, family composition, cultural expectations and the wider community – does most of the heavy lifting, for good or for ill. Yet this is too often the missing piece in the debate. Much of the focus in this report is rightly on public services and employers. But their actions alone will not shift the life chances of 1 million young people. Families are not a peripheral influence but are central.
295. Youth disengagement does not begin at age 16. In too many cases, it begins long before a child ever reaches the school gate. By the time a young person appears in the NEET statistics, the pattern has often been years in the making, and should be predictable enough to be preventable. The warning signs appear early: in the home, in speech and language development, in behaviour. Then later in attendance, in attainment, in mental health, in confidence.
296. This is not about placing responsibility solely on parents. Families do not start from equal positions. Poverty, instability and disadvantage limit what many can provide. Public services cannot fully compensate for those gaps. Where families are struggling, services alone rarely succeed. But where support from services is weak, families are left to cope on their own. Improving outcomes for young people requires stronger families and more effective services and, crucially, a system that recognises how dependent each is on the other.
297. The home learning environment encompasses not only academic inputs but emotional security, family relationships and perceptions of safety. Lower parental education and reduced parental monitoring, support and routines, along with limited access to stable caregiver relationships and lower parental engagement in their child’s education, are all associated with lower attainment[footnote 265] and therefore higher NEET risk. The Social Mobility Commission’s State of the Nation Report 2015 outlines large differences in early achievement between children experiencing high- and low-quality parenting.[footnote 266]
298. Conversely, there is not clear evidence on the relationship between family structure and NEET status. DfE analysis shows that young people in a single parent family were slightly more likely to be NEET, compared to those not in single parent families.[footnote 267] 15% of those in single parent families were NEET at age 17 to 19 compared to 11% of their peers, and 33% were NEET at age 20 to 24 compared to 27% of their peers. However, the analysis also shows that being in a single parent family is not a statistically significant predictive factor for NEET status when controlling for other factors.
299. Parents of all descriptions overwhelmingly want their children to succeed. The White Working Class Inquiry brings this into sharp relief.[footnote 268] Almost three in four parents regularly encourage their children to achieve their best. But white working-class parents are significantly less likely than higher socio-economic groups to engage in the wider activities that support educational success. Only 19% regularly take their child to museums, galleries or theatres, compared with 29% of white middle-class parents. Just 30% regularly help plan for their child’s educational future, compared with 42% of white middle-class parents.
300. The aspiration is there. What is missing is the confidence, the resources and the support to translate it into action. Yet there is little evidence of a systematic public policy effort to help parents bridge that gap. There have, however, been some successes. The Family Nurse Partnership programme,[footnote 269] delivered as part of the 0 to 5 years public health offer for children, is associated with a range of positive outcomes, including a 5.8 percentage point difference in the proportion of participants achieving a good level of development.[footnote 270] At a more localised level, the Sheffield Raising Early Achievement in Literacy programme,[footnote 271] which supported families living in disadvantaged areas with a child aged 3, improved early literacy levels.[footnote 272] But most forays by public policy into this field have lacked scale and heft. This is a major deficiency.
301. The state and the market cannot do all the heavy lifting to give young people the best chance in life. Nor should they be expected to do so. Parents have responsibilities too. Young people have the same. Aspiration is not something that can be gifted to them. Enablement and encouragement can come from external bodies, but endeavour and effort can only come from within. There is a contract at the heart of all of this. The state can contribute more to help young people succeed. But young people and their parents have to contribute too.
4.2 Early years: where the trajectory begins
302. The system knows, from the moment a child arrives at school, who is most likely to fail. It has the data, and the unambiguous evidence. A study of over 8,000 young people in Bradford found that children who were not school-ready at ages 4 to 5 were nearly three times as likely to be NEET at ages 16 to 17 years old. 11% of those who did not reach a Good Level of Development at reception were later NEET, compared with just 4% of those who did.[footnote 273] Research tracking children from school entry through to their late teens shows that most of this effect operates through academic attainment.[footnote 274] A child who falls behind at 5 years old is on average still behind at 16 years old. Missing early building blocks propagates forward through every key stage. Around 65% of the relationship between school readiness and later NEET status runs through this academic pathway.[footnote 275]
303. But there is also a direct effect, independent of exam results, that matters just as much for this review. The Good Level of Development measures not only literacy and numeracy but personal, social and emotional development, communication and language. These are the capabilities that employers in Chapter 3 describe as missing: the ability to make eye contact, to handle a difficult interaction, to work confidently alongside others. Research conducted in the United States shows that social skills in kindergarten are associated with employment outcomes in adulthood.[footnote 276] The soft-skills deficit that employers describe has its roots not in the teenage years but in the first years of life.
304. The scale of inequality is stark. For the most advantaged child, the probability of becoming NEET is 1%, rising to 3% without a Good Level of Development. For the most disadvantaged, it is 25%, falling to 17% if they reached a Good Level of Development.[footnote 277] Deprivation multiplies the risk eight-fold. The gap between 3% and 25% is not a gap in ability. It is a gap in circumstance.
Figure 20: The proportion of children achieving a good level of development, and proportion in sustained EET destinations at ages 16 to 18
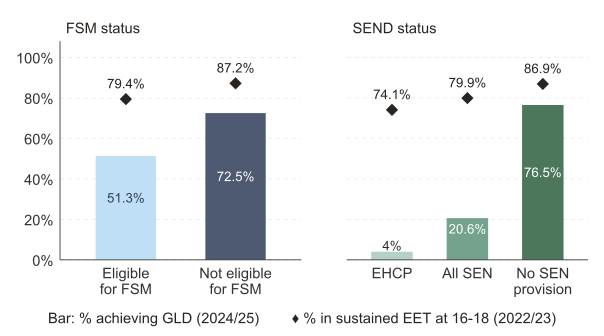
Source: Analysis of LSYPE2, DfE, Early years foundation stage profile results[footnote 278]
305. Pupils eligible for free school meals are over 21.3 percentage points less likely to reach the Good Level of Development: 51.3% compared with 72.5% (Figure 20).[footnote 279] Deprivation and special educational needs are both independently associated with worse attainment and higher NEET risk.[footnote 280] Where they intersect, the effect is not additive, but multiplicative. Vulnerabilities compound from the earliest age. The system sees this. It does not act on it early enough, consistently enough, or at sufficient scale.
Call for evidence – Child Poverty Action Group response
“From early years all the way through to post-16 education, there is a stubborn and pervasive poverty-related attainment gap which means that children from lower-income households achieve lower grades in comparison to their peers.”
306. Early years services over recent decades have effectively become a new arm of the welfare state. There have been some notable successes within this period. In England, Sure Start produced sustained improvements through the provision of integrated health, parenting, early learning and employment support. Children eligible for free school meals living near a Sure Start centre experienced GCSE improvements of 3 grades compared with similarly disadvantaged children without access.[footnote 281] The IFS found improvements across education, health and crime, and that later cuts to Sure Start centres (with over 1,300 centres closing between 2010 and 2022) were associated with increases in childhood obesity.
307. More broadly, upstream investment in preventative services was severely cut during that decade. The Health Visitor workforce declined by over 40% after 2015. Combined spending on early intervention services was 44% lower in 2023 to 2024 than in 2010 to 2011, while late-intervention spending on youth justice, safeguarding and children in care rose by more than 50%.[footnote 282] Reductions were greater in more deprived areas. The places where the need is greatest lost the most. Any serious attempt to reduce NEET levels cannot be predicated on this funding model.
308. The government has begun to correct these mistakes. It is welcome that early years are once again a policy priority. The ‘Giving Every Child the Best Start in Life’ strategy[footnote 283] sets out action being taken to support children and families during the early years. Measures focus on improving availability of early education and childcare, increasing government-funded childcare hours, increasing the availability of places (especially for those on low incomes and for children with SEND) and investing in improving quality in early years services. In addition, the government is committed to delivering a free breakfast club in every state-funded school with primary-aged pupils in England, to help to drive improvements in behaviour, attendance and attainment.[footnote 284] Investment to transform children’s social care, worth more than £2 billion since November 2024, aims to boost early intervention for children and families.[footnote 285] These are welcome steps, but the scale of the challenge is daunting.
4.3 Schooling
The attainment gradient
309. Taken on its own terms, much of the schools system looks relatively strong. In England, those aged 15 perform above the OECD average in reading, maths and science.[footnote 286] Level 2 attainment in English and maths by age 19 reached 76.1% in 2023 to 2024, the second highest on record,[footnote 287] although it has fallen back slightly to 73.2% in 2024 to 2025.[footnote 288] Those aged 16 to 19 score above the OECD average in literacy and adaptive problem solving, with significant improvements in literacy and numeracy since 2012.[footnote 289] Only around 5% of non-disadvantaged young people fail to enter a sustained destination after Key Stage 4.[footnote 290]
310. And yet the relationship between social background and educational attainment in England is unbroken. It has survived every reform of the past three decades. Disadvantaged children still perform substantially worse at every stage of education. The gap does not close as children move through the system. It widens.
311. At age 7, the most disadvantaged pupils are 16 percentiles behind their most advantaged peers. By age 18 or 19, the same young people are 29 percentiles behind.[footnote 291] 12 years of schooling, and the gap has nearly doubled.
312. The damage begins early and locks in at primary school. At Key Stage 2, just 47% of disadvantaged pupils reached the expected standard in reading, writing and maths, compared with 69% of their peers, a 22 percentage point gap.[footnote 292]
313. Primary schools do not receive the same level of attention in the public debate on education as secondary schools. Perhaps that is why the ambitions that have been set for primary school children are surprisingly low. On the face of it, it is astonishing for example that successive governments have set targets for primary schools to only have 75% of their pupils leaving with the age-appropriate level of numeracy and literacy skills. In other words, the State assumes that one in four will never achieve that standard.
314. This is building in failure at a critical juncture in too many young people’s lives. Only 8% of pupils who do not reach the expected level at the end of primary school go on to achieve grade 4 at GCSE in English and maths.[footnote 293] The system has, in effect, determined who will fail at 16 by the time they leave primary school. At GCSE, 38.7% of FSM children achieve 5 good GCSEs including English and maths, compared to 67.7% of their peers.[footnote 294]
315. The consequences cascade. By age 18, 29% without GCSE-equivalent qualifications are NEET, compared with 8% with A-level equivalent qualifications.[footnote 295] Young people, including disadvantaged young people, who achieve GCSE qualifications are more likely to reach sustained destinations after school than those without those qualifications, even though disadvantaged students are less likely to enter sustained education, employment or apprenticeship destinations than their peers (83% compared with 95%).[footnote 296]
316. Worryingly, however, there seems to be emerging evidence that educational qualifications on their own, are becoming less protective against the risk of young people becoming NEET. Reference F. The growth in the proportion of NEET young people with A Level qualifications or above has outpaced the rise in the proportion of young people attaining those qualifications overall.[footnote 297] This may be because other aspects of the school system are not sufficiently developing students’ capabilities or work readiness.
Teaching quality: the children who need the most get the least
317. Teacher quality is the single largest in-school determinant of pupil outcomes. A year with a good teacher can add months of progress.[footnote 298] A year without one can set a child back by the same margin. For disadvantaged children, the cumulative effect over a school career is the difference between catching up and falling irretrievably behind.[footnote 299]
318. The young people who most need high-quality, sustained teaching are the least likely to receive it. Disadvantaged pupils are on average more likely to have out-of-subject, inexperienced or unqualified teachers.[footnote 300] Schools in the most deprived areas, in coastal towns, in post-industrial communities, in the places where NEET rates are highest, struggle hardest to recruit and retain good teachers.[footnote 301] The geography of teacher shortage maps onto the geography of youth detachment. The system creates a perverse pattern, with the children who need the most from school getting the least. Secondary schools in the least deprived areas were three times more likely than schools in the most deprived areas to be rated as ’Outstanding’ by Ofsted, and more deprived areas tend to have a higher proportion of ’Inadequate’ or ’Requires improvement’ schools (Figure 21).[footnote 302]
Figure 21: Number of schools rated as Outstanding, Requires Improvement or Inadequate by deprivation quintile (1 is Least deprived, 5 is Most deprived), England, 2024 to 2025
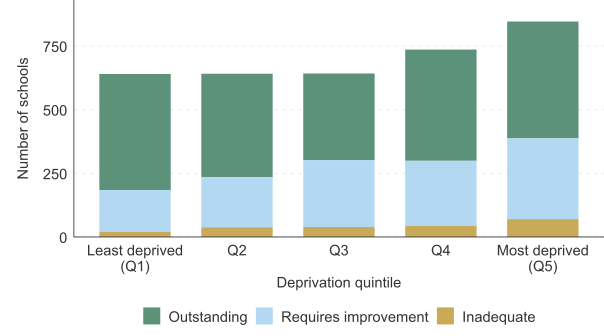
Source: Ofsted, Inspections carried out between 1 September 2024 to 31 August 2025 and published by 31 August 2025
Resources: not aligned to need
319. Per-pupil school spending in England fell by around 10% in real terms between 2010 to 2011 and 2019 to 2020.[footnote 303] All-school spending per pupil has nearly recovered to 2010 to 2011 levels in real-terms,[footnote 304] but the demands on schools have intensified dramatically. Rising SEND prevalence, worsening mental health, higher energy costs, increased staff absence and the need for pandemic catch-up have all eroded the real value of school budgets even where headline figures have risen.
320. The National Funding Formula for schools was intended to distribute resources more fairly. Whether it adequately weights deprivation relative to the scale of need in the most disadvantaged areas remains contested. Deep inequities in the local government funding formula over more than a decade have led to materially worse spending power in many of the most deprived areas of the country compared with many better-off areas.
321. Overall, 92.4% of funding through the National Funding Formula is allocated based on pupil numbers and characteristics. 74.1% is allocated through the basic entitlement that every pupil attracts. The rest of the ‘pupil-led’ funding is allocated towards additional needs. Only those living in the most deprived 37.5% of areas attract additional funding based on where they live, with more funding towards those in the very most deprived areas.[footnote 305] There are concerns with how deprivation funding is allocated. For example, the Education Policy Institute argue that the National Funding Formula should target additional funding towards ‘persistently disadvantaged’ pupils who face worse outcomes[footnote 306] whilst the IFS has described FSM eligibility as a ‘blunt measure’ of deprivation.[footnote 307] In the 2026 Schools White Paper, the government recognised these challenges, committing to develop and test a new model for targeting disadvantage funding to help narrow the attainment gap in England. It will consult on proposals in Summer 2026.[footnote 308]
322. The Pupil Premium was a serious attempt to direct real money to real need. The evidence shows it has been associated with measurable improvements in some outcomes. It has narrowed some gaps in some places.[footnote 309] But the gap between what the Pupil Premium provides and what a disadvantaged pupil with SEND, mental health needs and fragile attendance actually requires is substantial. The funding was designed for a pre-pandemic problem. It is being applied to a post-pandemic crisis. A school in a deprived area with a SEND population of 25%, a persistent absence rate above 20% and a teaching vacancy it cannot fill, faces costs that up to £1,515 per disadvantaged pupil[footnote 310] does not begin to cover.
323. Schools now face three new challenges – all of which drive NEET rates up – and which they are struggling to address.
4.4 SEND and mental health
324. Young people with SEND are 80% more likely to be NEET.[footnote 311] Having an Education, Health and Care Plan (EHCP) during school is the strongest single link to becoming NEET at 17 to 19.[footnote 312] SEND designation is also a compounding factor for other forms of disadvantage.[footnote 313] Overlaps are common – for example, children looked after for at least 12 months were over 6 times more likely to have an EHCP than the overall pupil population.[footnote 314]
325. SEND prevalence in England has risen from 14.4% in 2015 and 2016 to 19.5% in 2024 and 2025.[footnote 315] Today’s 12-year-olds require more support than current 22-year-olds did at the same age. The number of EHCPs has risen from just over 350,000 in 2018 and 2019 to nearly 640,000 in 2024 and 2025,[footnote 316] driven mainly by autism and speech and language needs.[footnote 317] The proportion receiving SEN support more broadly rose from 11.9% to 14.2% over the same period.[footnote 318] Spending on SEND has risen from £7.8 billion to £11.8 billion between 2015 to 2016 and 2023 to 2024.[footnote 319] Yet in many cases, pressure on local authorities and schools means young people do not receive the support they need, leading to breakdown in provision, non-attendance and itself driving mental ill health.
326. Meanwhile, schools have become the front line for a youth mental health crisis the health system has been unable to absorb. CAMHS waiting times leave schools holding young people in distress without clinical support. Teachers are acting as counsellors. SENCOs are managing caseloads that would overwhelm a qualified social worker. Schools were not designed for this and frequently have not been resourced for it.
327. The government has recognised the scale of the challenge. Its SEND reforms are a welcome step in the right direction. Improving mainstream provision, reducing reliance on EHCPs as the only gateway to support, and strengthening early identification are the right priorities. The question is whether the pace and scale of reform will match the pace and scale of the problem. The risk is that SEND need rises faster than the system is capable of reforming. For the young people already in the pipeline, many of whom may be in the NEET statistics within 5 years, the reforms need to deliver quickly. Good intentions announced in Whitehall take time to reach a classroom in Blackpool.
4.5 School absence
328. School absence has become a crisis in its own right. In 2024 and 2025, around 1.34 million pupils (18.1%), were persistently absent, missing at least 10% of school time. Before the pandemic, the proportion was just below 11%, around 772,000 pupils. The number has nearly doubled. Severe absence, missing 50% or more of school time, has risen even more steeply: 176,000 pupils in 2024 and 2025 in England, up from 60,000 in 2018 and 2019. Unlike persistent absence, which has begun to fall year on year, severe absence continues to rise.[footnote 320] Evidence shows that pupils from different ethnic groups may face different experiences of suspensions and exclusions. For example, Gypsy or Roma pupils had the highest rate of suspensions and permanent exclusions followed by ‘Traveller of Irish Heritage’ and ‘White and Black Caribbean’ pupils. [footnote 321] The 2026 Schools White Paper sets out how the Race Equality Unit will commit to completing research into exclusion by different ethnic groups to help inform future policy development.
329. The consequences for attainment are direct and measurable. Pupils who attended school at least 95% of the time in Year 11, were 1.9 times more likely to achieve Grade 5 in English and Maths GCSE compared to pupils who attended 90% to 95% of the time, and 3 times more likely than those attending 85 to 90%. Missing just ten days of Year 11 reduced the likelihood of achieving Grade 5 by around 50%.[footnote 322]
330. The characteristics of absent pupils are predictable. The persistent absence rate for FSM-eligible pupils was 32.4%, compared with 12.1% for those not eligible. The number of FSM-eligible persistently absent pupils has increased by more than 154% between 2018 to 2019 and 2024 to 2025.[footnote 323] The Education Policy Institute finds that the increase in the disadvantage gap in attainment since 2019 can largely be explained by higher levels of absence among disadvantaged pupils.[footnote 324]
331. Persistent absenteeism is associated with a 3.9 times greater risk of being NEET at age 16 to 18 and a 6.3 times greater risk of being persistently NEET.[footnote 325] Persistent absenteeism is more than 70% higher in 2024 and 2025 than in 2018 and 2019, including around 370,000 more secondary age-pupils who will be at a greater risk of becoming NEET as a consequence.[footnote 326]
332. The 2026 Schools White Paper sets a target to reduce the overall absence rate by 1.3 percentage points by 2028 to 2029, from 7.15% in 2023 to 2024 to 5.85%.[footnote 327] If achieved, this would be equivalent to 20 million more days of school and the fastest improvement in a decade. The target is welcome as are the measures the government has announced to deliver it. They signal priority. They create a benchmark. But even if met in full, the rate would still be above the pre-pandemic level.
Risk of NEET Indicator (RONI) Tools
The risks of becoming NEET are amplified by having an EHCP, being absent or excluded from school. All of this is well known. Schools even have tools available to them to track at-risk pupils so they can put in place mitigating strategies. There are good examples of risk of NEET indicator tools across some places in England, but best practice is not spread widely and their use is variable and often focused late in the education journey,[footnote 328] limiting early intervention. The fact that the use of these RONI tools is so variable, tells a story of how marginal preventing young people becoming NEET is to the schools system as a whole. If the system genuinely treated youth disengagement as a priority, every school in the country would be using these tools from Year 7. The government is committed in the Post-16 Education and Skills White Paper to develop new RONI tools for use by local authorities where needed but does not currently mandate the use of RONI tools.[footnote 329]
4.6 Suspensions, exclusions and home education
333. Exclusion amplifies the problem. School suspension rates have been rising since 2016 and 2017, driven by secondary schools.[footnote 330] The overall rate was around 4% in 2024 to 2025, up from 1.6%, with the number of pupils suspended at least once, doubling from 79,000 to 166,000. 47% of those suspended were receiving SEN support or had an EHCP, despite SEN pupils making up around 18.5% of the school population. Over 55% were eligible for free school meals, despite FSM-eligible pupils making up around 25% of the school population.
Call for evidence – Disability Rights UK
Disability Rights UK shared that “Despite comprising less than 20% of the school population, SEND students account for 45% of all suspensions and 52% of permanent exclusions.[footnote 331] This means a Disabled pupil is three times more likely to be suspended than their non-disabled peers.” Evidence from England also shows that autistic children are twice as likely to be excluded,[footnote 332] whilst evidence from Scotland, suggests children with ADHD are 6 times more likely to be excluded and over twice as likely to leave school before age 16.[footnote 333]
334. The number of children in elective home education in England has also risen from 116,300 in 2021 to 2022 to 175,900 in 2024 to 25.[footnote 334] Mental health is now cited as the main reason in 16% of cases, up from 9%, overtaking philosophical or preferential reasons.[footnote 335] Due to issues including limited available data, it is difficult for us to be sure about outcomes for those in elective home education. But qualitative research suggests they may face barriers to progression, including obtaining necessary qualifications and some practical barriers to higher education.[footnote 336]
335. To help local authorities to best support home-educated children, the government is committed to introducing compulsory Children Not in School registers in every local authority in England, alongside powers to intervene and require school attendance where necessary and a duty to support parents of home educated children.
4.7 School belonging
336. The risk factors in school of becoming NEET are growing. SEND, absence and exclusion are all increasing in prevalence. Despite the challenges they face on these and other fronts, schools and teachers are doing often heroic work to optimise the life chances of their students, especially those from disadvantaged backgrounds. And it is welcome that government is putting in place new approaches to help schools and teachers confront those challenges.
337. The deeper question is whether those efforts and measures, however well designed, are working against greater forces within the school system itself that drive disengagement. Only 64% of UK pupils say they belong at school.[footnote 337] Just 19% of secondary pupils in England describe themselves as very motivated to learn.[footnote 338] The UK has seen the largest fall in sense of belonging in the OECD.[footnote 339]
338. The White Working Class Inquiry provides the sharpest evidence of how this plays out for one of the groups most at risk of disengagement. White working-class children are less likely to enjoy or feel successful at school than any other group.[footnote 340] 27% of white working-class pupils say they rarely or never enjoy lessons, compared with 18% of white middle-class pupils and 12% of non-white middle-class pupils. 23% say they rarely or never feel confident about what they are learning, compared with 13% of white middle-class and 9% of non-white middle-class pupils. These are not small differences. They describe a group that has already mentally withdrawn from the experience of education by the time they are in secondary school. As described in Chapter 2, we heard sometimes shocking testimony from our conversations with NEET young people about an experience of school often characterised by bullying and boredom.
339. The Schools White Paper[footnote 341] recognises some of this, proposing a Regional Improvement in Standards and Excellence (RISE) Key Stage 3 Alliance, an Enrichment Framework, closer links to families and a focus on white working-class communities. These are the right instincts. Ensuring that they produce the right results – fewer young people leaving school at risk of becoming NEET – depends on getting the right balance in the school curriculum and the right exposure to work experience and careers guidance.
340. Schools, of course, have multiple roles. They need to equip students with knowledge, love of learning, understanding of the world and life skills. Not everything can or should be reduced to a utilitarian conceptualisation of schools purely preparing young people for the world of work. The trick is to get the balance right. That is not what schools are currently achieving. In essence schools are doing too little both to help the cohort most at risk of becoming NEET and to prepare young people for the world of work.
4.8 The school curriculum
341. Qualifications are one of the most powerful protective factors against the risk of becoming NEET.[footnote 342] Where the system fails to provide them, it leaves young people exposed. The nature of the curriculum, issues with the amount of school time taken by the national curriculum (as highlighted by the Curriculum and Assessment Review in England) and the limited range of assessment approaches in Key Stage 4 in England means that some students are effectively set up to fail. Overwhelmingly they come from less advantaged backgrounds. That is not because they lack ability. It is because the system defines ability in ways that exclude them. The question is not whether some young people fall short. It is whether the assessment system and the curriculum are designed in ways that make that outcome unavoidable. Most respondents to our NEET survey believe the current curriculum does not prepare people for work (67%), in addition to over half feeling that the current education system does not suit people like them (55%).[footnote 343]
342. This is contested terrain, which is why the government established its Curriculum and Assessment Review (CAR), immediately on taking office in 2024. The government’s response to the Review maintains the primacy of the knowledge-rich curriculum. To better prepare young people for life and work, it plans to better articulate skills development within programmes of study, introduce a new oracy framework, embed knowledge and skills in financial, media and digital literacy, and remove the EBacc accountability measure. It is also developing a new enrichment framework for schools, establishing an entitlement for every pupil to activities covering civic engagement, arts and culture, sport and physical activities, and developing wider life skills. These are welcome steps. Whether they prove sufficient depends on whether they change the experience of school for those most at risk of becoming NEET.
343. There is currently wide variation in access to enrichment opportunities in schools. Participation is lower for children and young people eligible for free school meals and children in need.[footnote 344] There is an overlap between young people less likely to participate in enrichment and those at risk of being NEET.[footnote 345]
344. The question is whether enriching the school experience with extra activities will be enough to reform the curriculum in ways that allow each child to feel their passions and their aspirations are being recognised. Without that the risk of disengagement for those most at risk of becoming NEET will remain high.
345. The transition from primary to secondary school is perilous for precisely that cohort. Evidence collected from the South East of England found pupils on free school meals and those with SEN were the most likely to develop mental health problems during the transition to secondary school,[footnote 346] with evidence from Scotland finding children from the lowest income group being the most likely to report a negative experience of moving to secondary school.[footnote 347] Moving from an often small and safe primary school with a single classroom teacher into a large secondary school with multiple teachers and a more rigorous focus on academic attainment, can often be the point where students conclude they are bound to fail rather than succeed. A flexible curriculum that allows every student to find something they can excel at can help mitigate disengagement, but the reasons for absence and disengagement are multi‑faceted and not all can be addressed through curriculum design alone.
346. There have been repeated attempts to broaden the curriculum and open up vocational pathways. Since 2010, effort has focused on offering better quality vocational options at Key Stage 4, including through the introduction of Technical Awards and much-discussed reforms to BTECs. We have also seen the introduction and growth of University Technical Colleges, aiming to embed more technical education alongside the core curriculum for young people from age 14. These attempts have consistently aimed to rebalance academic and vocational learning for those aged 14 to 16, before they move into post-16 provision.
347. But these routes remain marginal rather than mainstream within the school system. Technical Awards at Key Stage 4 make up only around 6% of grades awarded,[footnote 348] despite 69% of school leaders perceiving them as better preparing some students for post-16 pathways,[footnote 349] and evidence that they are associated with lower absence and exclusion.[footnote 350] The academic track continues to dominate, shaping both expectations and outcomes.
348. Teachers confirm the picture. Pearson’s School Report 2025[footnote 351] found 38% of secondary teachers selected adapting the curriculum as a priority to improve student learning. Only 1 in 5 say the system prepares students for further study or training. Just 8% say it prepares for future careers. 42% called for more vocational options. Students suggested more focus on creative skills at 37%, and digital skills at 30%.
349. Our survey of teachers found that three-quarters agreed that the curriculum put too much emphasis on passing exams (74%) and not enough focus on preparing young people for employment (73% in agreement) or teaching soft skills for employment (73% in agreement).[footnote 352] Nearly three quarters (73%) of teachers also believed it possible for the curriculum to be adapted to provide a broader set of skills for work and employment while still maintaining high academic standards.[footnote 353]
350. Employers see the same gap from the other side. Only 3% of those who recruited 16-year-olds cite a lack of literacy or numeracy skills.[footnote 354] They point instead to lack of work-world experience, maturity and confidence. The education system produces qualifications. It does not reliably secure student engagement or produce work readiness. My assessment is that the curriculum is currently too imbalanced. The government has made a start with its plans to enrich the curriculum, but, without throwing the baby out with the bathwater, better balance is needed. Despite improvements in the basics, for the majority, not just those who become NEET, the system is not yet preparing young people for the world of work or a rapidly changing economy.
4.9 Careers guidance, work experience and employer engagement
351. Only 47% of those aged 18 to 24, and just 36% of those who are NEET, agreed that they felt ready for work when they left education.[footnote 355] Less than half of young people agree that their place of study sufficiently supported them to develop the skills they need for the future. Students with additional needs report worse than average on this measure.[footnote 356]
352. Lack of adequate careers guidance at schools is an often-cited reason for young people not being prepared for the world of work. How young people have their eyes opened to employment options has changed markedly in recent decades. England’s Careers and Enterprise Company (CEC) was established in 2015 to improve employer-school connections and has supported progress on the Gatsby benchmarks, a framework of 8 guidelines defining world-class career guidance for schools and colleges. Over 90% of schools now benchmark against the framework, meeting 5.8 of 8 benchmarks on average, up from 1.9 in 2018.[footnote 357] Where schools achieve more benchmarks, NEET likelihood is reduced.[footnote 358] This has been built on a growing digital infrastructure, including the Future Skills Questionnaire completed by over 330,000 learners in 2024/25.[footnote 359] Progress is real.
353. According to the CEC, the highest quality careers provision reduces the likelihood of young people being NEET by 8% (post-16 and post-18),[footnote 360] with double the impact for high Free School Meal (FSM) cohorts.[footnote 361] This is currently generating £300m in annual fiscal savings through reduced NEET outcomes.[footnote 362] Evidence that primary school careers education works is also compelling.[footnote 363] Research shows children start to form ideas about their future as they start primary school[footnote 364] and yet most primaries have no formal careers strategy.
354. Critically, access to high quality careers advice remains deeply unequal. Only 32% of young people reported receiving face-to-face careers advice in 2025.[footnote 365] Apprenticeships were discussed with just 18%.[footnote 366] Only 49% feel they understand employers’ expectations.[footnote 367] Only 35% feel confident they have relevant work experience for employment.[footnote 368] Younger people and those with additional needs are less likely to report understanding what employers seek.[footnote 369] Guidance is most lacking for those considering vocational pathways, including those at risk of NEET.
355. Lack of work experience is the single most-cited barrier to work amongst young people.[footnote 370] At present, the provision of work experience is an afterthought for many schools. Students are often told to find their own placements. Unsurprisingly, those without strong networks and connections are more likely to miss out. School capacity and local employer willingness are weakest in the areas of highest need. The young people who most need early exposure to work are the least likely to receive it. The vast majority of the young NEET people we spoke to had done no work experience at all.
Call for evidence – Amazon Response
Amazon suggested that “workplace readiness gaps at scale” are one of the main barriers preventing young people from entering and starting in employment. They stated “It is widely recognised that this generation of young people entering the labour market have experienced a unique set of circumstances which has disrupted their learning and made their transition into work more challenging.”
356. The government is committed to reforming work experience so that every pupil can access two weeks of multiple, meaningful and varied workplace experiences across key stages 3 and 4, progressively increasing work readiness through secondary education. But the concept of work experience also needs broadening. It is meaningful employer encounters that can have the biggest impact: volunteering, projects, mock interviews, work taster sessions. Amazon argued in its call for evidence response that government should “require careers services to develop sustained employer partnerships” to help employers hire more young people who are NEET. Where schools and employers do collaborate effectively, outcomes are measurably better. Young people who receive sustained, high-quality work experience are more likely to understand what employers expect, more likely to develop confidence in workplace settings, and less likely to become NEET. The problem is not that no one knows what works, but that what works is not happening at scale, and is least available where it is most needed.
357. Students in England are less likely than OECD comparators to be enrolled in combined school and work-based programmes.[footnote 371] In Denmark, Hungary, Ireland, Latvia and Switzerland, all of which have below-average NEET rates,[footnote 372] 90% or more of students are enrolled in such programmes, compared with around 40% in the UK. The UK has seen the largest decline since 2013 in the proportion enrolled in these programmes.[footnote 373] Employer co-production in the design and delivery of education and skills is central to successful youth transition systems.[footnote 374]
358. Employers are not involved at scale in creating opportunities and building pathways towards work. The system cannot claim to prepare young people for the labour market while keeping employers at arm’s length from the classroom. The education system too often ends at the school gate, while the labour market begins beyond it. More effort is needed to bridge the gap if more young people are to be work ready by the time they leave school.
4.10 What the system measures, recognises and rewards
359. It is often said that what is measured in the public services is what they end up delivering. The school system primarily measures attainment. It too often counts qualifications rather than student destinations or labour market participation. That is a design choice with consequences.
360. How schools are currently measured, recognised and rewarded drives them towards more focus on students acquiring qualifications and less on work readiness or employment outcomes. Ofsted inspects quality of education, behaviour, personal development and leadership. It does not inspect or report on whether young people end up in sustained employment or learning after they leave.
361. Evidence from the Department for Education shows that those who attended ‘Outstanding’ or ‘Good’ Ofsted rated Institutions at the end of key stage 4 were less likely to be NEET for a year three years later.[footnote 375] A more recent study looking at the relationship between school characteristics and NEET status found that schools with lower suspension rates, higher student progress (‘Progress 8’) and onsite post-16 provision had lower rates of students becoming NEET.[footnote 376] Single-sex and faith schools also exhibited reduced NEET rates.[footnote 377]
362. But overall, the inspection framework is blind to the outcome that matters most for this review. School performance tables reinforce the same distortion. They rank schools by exam results. They drive parental choice, resource allocation and reputational reward.
363. Similarly, there are few, if any, financial incentives in the schools system to drive a bigger focus on outcomes and destinations. The only way in which you can really argue that the system financially rewards well performing schools is that because funding is based largely on pupil numbers, then those that are successful and maintain high intakes tend to maintain higher funding. This is a weak lever.
364. The Department for Education does publish destination measures. They exist. Schools and colleges can see where their leavers end up for 6 months of the year after leaving, and the government is taking steps to improve transparency and accessibility of performance information. But destination measures do not in general drive Ofsted judgements or funding. They do not trigger intervention when outcomes are poor. A metric that carries no consequence is not accountability, but at best information.
365. Government holds, through its Longitudinal Education Outcomes dataset, one of the most powerful tools in the world for understanding what happens to young people in England after they leave education. It links education records to tax, benefits and employment data. It can show, at a granular level, which courses, which institutions and which pathways lead to sustained employment, higher earnings and reduced benefit dependency, and which do not. Yet this data is not routinely available to schools, colleges, local authorities or the strategic authorities that are being asked to plan and commission provision locally. It is used primarily for national research and policy analysis within Whitehall. The people who most need to see where young people end up, the teachers guiding subject choices, the college principals designing course offers, the local leaders trying to understand why their NEET rate is rising, cannot currently access it in any usable or timely form.
366. This is symptomatic of a wider failure. Data on young people sits in departmental silos across DfE, DWP, DHSC, HMRC and the NHS. No single institution has a complete picture of a young person’s journey from school through to sustained employment. Local authorities lose sight of young people at 18. Jobcentres see only those who claim. Colleges know enrolment but not what happens after a student leaves. The NHS records treatment but not whether a young person returned to work. Each institution holds a fragment. Nobody holds the whole. Until the data that the state already collects is shared, linked and made available to those working with young people on the ground, the system will continue to operate blind to the outcomes it is supposed to improve.
Jobs Growth Wales+
A Welsh Government programme supporting those aged 16 to 19 to gain the skills, experience and qualifications needed to progress into employment, further education or apprenticeships. The programme offers tailored pathways, including work placements, training and employer engagement, with a focus on young people who may be at risk of disengagement.
4.11 Skills, training and the post-16 cliff edge
367. Moving out of compulsory schooling at age 16 is a critical transition point for young people. So too the point where they leave education provision at the age of 18 or 19. These should be the points where they progress towards work. Unfortunately, many of the pathways during and after secondary education fail to support young people as they should.
368. As the previous section of this chapter establishes, the school system is built on young people gaining qualifications which is not the same as ensuring they are ready for work. As the evidence of young people in Chapter 2 makes clear, schools often push the academic route to university as the most valued route. The focus on qualifications and competition for those most likely to achieve them is often crowding out preparation for jobs and working lives especially for the more disadvantaged. What makes the situation worse is that the skills ‘system’ from 16 upwards is highly fragmented, complex and confusing. It contains very different accountability and policy regimes which cover schools, further and higher education, adult learning and work-based training, including apprenticeships. Funding varies considerably across these different areas and there is little coordination between providers or coherence in the system overall. Few, if any, parts of this system have a focus on young NEET people as a primary role or responsibility. Funding is typically insufficient and other incentives are weak or piecemeal. There are many good examples of partners working together in different areas across England to try to overcome these issues to provide the right support for young people at risk of becoming NEET. These efforts are a response to system failures. But in truth it is a misnomer to call it a system.
369. The consequences are borne by young people at risk of becoming NEET. At its best, there is strong evidence that vocational training, apprenticeships and other kinds of work-based learning help young people get into work, especially those who face additional barriers.[footnote 378]
370. We are concerned that these kinds of pathways are narrowing for young people leaving school, especially those with lower levels of attainment and those already, or at risk of becoming, NEET. Overall, by age 18, a lower proportion of young people were in education or apprenticeships in 2024 than 10 years earlier.[footnote 379] Figure 22 shows that of those that were in education, more were in higher education, and fewer were in further education or apprenticeships even though the latter two routes are the ones that are most accessible to those most at risk of becoming NEET.[footnote 380]
Figure 22: Indexed change in participation type for those aged 16 to 18, England, 2014 to 2024
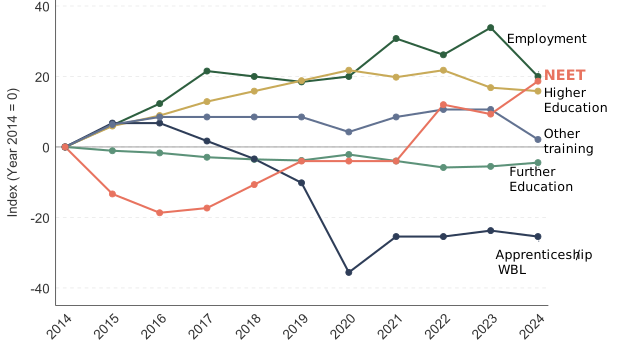
Source: DfE, Participation in education, training and employment age 16 to 18 statistics, June 2025
Further education: weaker and smaller
371. Further education should be the main sector delivering vocational education and preparation for the workplace. It is also the primary recovery layer for those who leave school without strong academic results. Young people with lower prior attainment and from less advantaged socio-economic backgrounds are more likely to enrol in FE colleges at age 16.[footnote 381] Less than 15% of those from the most disadvantaged backgrounds and with lower attainment go on to academic routes post 16.[footnote 382] England and Wales have a relatively high proportion of students aged 16 to 17 attending FE colleges, 42% and 53% respectively.[footnote 383] FE is not a marginal part of the post-16 landscape. For young people at risk of becoming NEET, it is the landscape.
372. Compared to some high performing countries such as Germany, the Netherlands and Denmark, the UK’s higher NEET rate may in part be attributable to lower participation in vocational education. Analysis from the Resolution Foundation suggests that while slightly more young British people aged 18 to 21 are in ‘general’ education than in these countries (36% compared to 32%), significantly fewer are in vocational education at just 22% compared to 35%.[footnote 384]
373. In recent years, further education in England has been significantly weakened, with reduced funding and capacity. FE colleges are in practice serving those with the most complex needs with some of the most constrained resources. Student numbers fell by around 14% in 2016 and 2017 to 2023 and 2024.[footnote 385] The number of classroom-based qualifications started has fallen dramatically.[footnote 386] Despite increased funding promised through the government’s Post-16 Education and Skills White Paper, real-terms spending for age 16 to 18 education in England will remain well below early-2010s levels at a time of growing demand.[footnote 387] There have been substantial declines from a peak in the early 2000s in adult education and skills. Funding for work-based learning, especially apprenticeships, has risen, but there have been large reductions in funding for classroom-based learning – for example, secondary school funding has fallen by 3% since 2010 and 2011, and further education by 8% (Figure 23).[footnote 388]
Figure 23: Spending per pupil or student per year at different stages of education, England, between 2010 to 2011 and 2025 to 2026
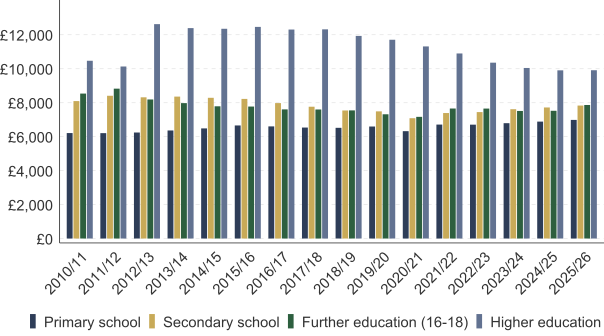
Source: Reproduced from the Institute for Fiscal Studies, Spending per pupil or student per year at different stages of education (2025 to 2026 prices)
374. Requirements for young people in England to achieve Level 2 English and Maths qualifications continue to stop some students aged 16 to 18 from accessing and progressing into FE and apprenticeship routes. Only 20.2% of those who had not achieved Level 2 English and maths at 16 had achieved both at 19 in 2023 to 2024.[footnote 389] The requirements also further constrain limited FE capacity. The system as currently designed risks locking out a significant minority of young people from taking meaningful steps towards work at a critical age.
375. FE is often also the poor relation to higher education. In England funding per student in HE is £9,906 while in FE (for students aged 16 to 18) it is £7,860.[footnote 390] The gap has more than halved in the last ten years, from £4,829 in 2015 and 2016 to £2,046 now.[footnote 391] But the FE sector still plays second fiddle to HE.
376. Whereas university places are uncapped, college numbers are tightly managed and based on historical recruitment data. There are active disincentives against growth, especially for students at risk of non-completion. Because colleges are funded for students aged 16 to 19 largely based on the previous year’s intake, and in-year growth funding is paid towards the end of the academic year as a contribution towards additional costs,[footnote 392] colleges fund growth at their own risk until it is reflected in future allocations. Given funding allocations are reduced for students who fail to complete their course, those at risk of non-completion are financially risky for colleges seeking to grow. These rules also limit college capacity to offer flexible, roll-on provision during the year for NEET young people.
377. Estimates suggest there are currently 32,000 unfunded students in England’s FE sector.[footnote 393] The institution that serves the young people most likely to become NEET is placed under pressure by a system that doesn’t fund what it currently delivers, never mind what it could deliver. Improving NEET outcomes also depends on the strength and stability of the FE workforce. The learners most at risk of disengagement are those who benefit most from consistent, skilled FE teachers. However, high vacancy rates (3.9 per 100), rapid turnover (circa 50% leaving within 5 years) and inconsistent professional development undermine this support. Drivers include uncompetitive pay, workload pressures and limited progression.[footnote 394]
378. But the winds of change are now blowing in favour of vocational education. The primacy of higher education is under challenge. Skills shortages in the economy, especially in sectors like construction, manufacturing and health and adult social care,[footnote 395] have led policy makers belatedly to call for a rebalancing in the post-18 landscape. In the context of a growing population aged 16 to 24 over the next few years, with an extra 241,000 young people in this age bracket projected by 2032 compared with 2022, policy-makers will need to urgently confront how to meet increased demand for education, training and employment, especially for pathways beyond the standard academic route where funding is not demand-led.
The changing challenges facing further education
379. Vocational education needs more than the right level of resources. It needs to respond to the particular challenges today’s cohort of young people bring with them through the college gates. Retention is one such issue. The Raising of the Participation Age policy is associated with significant and disproportionate increases in dropouts from FE.[footnote 396] Dropouts during Year 12 and Year 13 from FE increased by 1.7 to 2.4 percentage points, from baseline dropout rates of 9.1% to 9.3% prior to the policy. The effect was larger for low attainers. Qualitative fieldwork across 6 local authorities suggests that young people who drop out often do not reappear until they reach the benefit system aged 18. This is the at-risk cohort of becoming NEET.
380. Research suggests mental health and wellbeing play an important role in FE withdrawal: 53% of Welsh FE learners who withdrew cited personal factors, with 67% of those flagging mental health. 40% expressed a lack of satisfaction with perceived personal development, and 33% disclosed that demands of employment whilst studying contributed to their decision to withdraw. [footnote 397] But systemic issues also matter. Around 1 in 10 learners aged under-19 fail to complete their FE course each year, and close to 1 in 6 fail to achieve their qualification up to Level 3.[footnote 398] Retention rates are worse for those taking vocational and technical qualifications than for those taking A Levels. Only 71% of T Level students starting in 2022 finished their course after 2 years.[footnote 399] Disadvantaged students have retention rates at least 7 percentage points lower across all qualification types at Level 3.[footnote 400]
381. FE staff often perform informal brokerage and pastoral roles that are invisible in policy but critical for at-risk students. Lecturers act as mentors, employment coaches and referral agents to health and social services. These functions are not funded, not measured and not recognised in accountability frameworks. When college budgets are constrained, as they have been for over a decade, these informal support functions are the first to erode.
Apprenticeships have drifted away from young people
382. The apprenticeship system ought to be one of the other main routes through which young people transition into the world of work. Too often it is not operating that way. In England, apprenticeship starts for under 19s fell from around 130,000 in 2014 and 2015 to around 75,000 in 2024 and 2025 (Figure 24, Panel 1).[footnote 401] The share of starts going to those under 25 has fallen from over 57% to just under 49%.[footnote 402] The Levy, introduced in 2017, was intended to boost investment in training. In practice, it has been disproportionately used to fund higher-level apprenticeships for older, existing employees with the number of higher apprenticeship starts increasing from just over 2,000 in 2010 and 2011 to more than 140,000 in 2024 and 2025 (Figure 24, Panel 2).[footnote 403][footnote 404] The Levy coincides with a sharp decline in apprenticeship starts at SMEs.[footnote 405] The entry-level provision that matters most for young people outside work has been hollowed out.
383. Participation among young people from the most deprived areas has declined particularly sharply.[footnote 406] The system has strengthened progression for those already inside the labour market while narrowing access for those outside it. For the young people for whom apprenticeships matter most, the bridge has been pulled up.
384. OECD data shows that students in the UK are less likely than average to be enrolled in work-based learning programmes like apprenticeships.[footnote 407] The UK has also seen the largest decline in the proportion of young people enrolled in these programmes since 2013.[footnote 408] Looking at England specifically, a far smaller proportion of apprenticeship starts are made by younger people aged 16 to 18, around 20%,[footnote 409] compared with Scotland and Northern Ireland at around 40%[footnote 410] and 46%[footnote 411] respectively for 16- to 19-year- olds. The post-16 system needs to learn from parts of the UK and examples internationally where younger people are more effectively connected to work-based pathways from compulsory education.
385. Where apprenticeships do work, they work powerfully.[footnote 412] For each young person who starts an apprenticeship, the lifetime economic value amounts to £56,000 at Level 2 and £104,000 at Level 3, compared with £54,000 and £67,000 respectively for equivalent classroom-based qualifications. At Level 3, the apprenticeship route delivers more than 50% greater lifetime value than the classroom alternative. Work-based training is shown to be effective in supporting young people into work. The challenge is to help more young people access it.
386. Apprenticeships can be a route out of NEET status, but retention is significantly lower for those who were previously disengaged. Only 49% of previously NEET apprentices were still employed by the organisation afterwards, compared with 68% of those who were not previously NEET.[footnote 413] The route exists. But without additional support, it does not hold.
387. Quality remains a serious concern. England has comparatively high apprenticeship dropout rates, higher than France, Germany, Ireland and Austria which sit between 20 and 30%.[footnote 414] Slightly more than 1 in 3 apprentices fail to achieve their apprenticeship, although this has improved over recent years.[footnote 415] The most common reasons given by non-completers were the apprenticeship being badly run or poorly organised, at 49%, and the training not being as good as hoped, at 46%.[footnote 416] 40% of apprentices report not receiving the required off-the-job training.[footnote 417] Around a quarter of the apprenticeship budget, an estimated £620 million in 2021 and 2022, was wasted on training for apprenticeships that were not completed.[footnote 418]
388. Reforms since 2010 have sought to tackle the issue of low-quality vocational qualifications and training provision, including for apprenticeships. This focus on quality and genuine additionality must continue. But it must go hand-in-hand with a focus on creating and opening up high-quality opportunities at the scale needed to get more young people into pathways towards work and away from the risk of becoming NEET. Quality without quantity leaves too many young people with nowhere to go. Quantity without quality wastes their time and the public’s money. We need both.
389. We know many young people want to have the choice of an apprenticeship, but too often that option might not be clear or even exist where they live,[footnote 419] in the sector they want to work in[footnote 420] or at the level they need to get started. Application processes for apprenticeships are much more complex than for the higher education equivalent, UCAS. Young people often do not know where to find the opportunities that do exist. Apprenticeship start dates do not align with the academic year, making a seamless transition out of school more difficult. There is no equivalent centralised system to that in higher education.
390. Foundation apprenticeships, launched by Skills England in August 2025, are entry-level paid jobs with structured training at Level 2 for younger learners aged 16 to 21, or those aged 22 to 24 facing additional barriers to work. Up to 30,000 young people are expected to start a foundation apprenticeship over the current Parliament. This is a welcome step, as is the new hiring subsidy for employers taking on young apprentices. Recent reforms to the Growth and Skills Levy aim to shift participation away from older employees taking higher-level apprenticeships, towards lower qualifications and young people. At the same time, new flexibilities in the Levy may further broaden the choices employers and providers make. The long-term effects on opportunities for young people are yet to be seen. These new initiatives represent progress and should be acknowledged. Whether they prove sufficient to reverse the structural drift away from young people depends on their scale and sustainability.
Figure 24: Apprenticeship starts by age group and level, England, from between 2010 and 2011 to 2024 and 2025
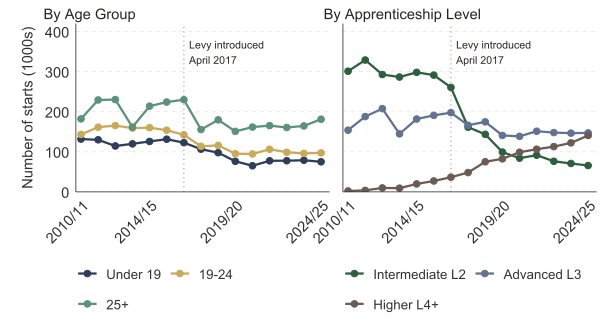
Source: Department for Education, Apprenticeships statistics, Level and age, published March 2026
Qualifications and progression
391. The options selected by younger learners are changing, opening doors for some whilst creating barriers for others. In England more of those aged 16 to 17 were taking GCSEs in 2024 compared with 2014, but the proportion taking other Level 2 qualifications and Level 1 qualifications had dropped.[footnote 421] At Level 3, T Levels were taken by 2.3% of those aged 16 to 17, but fewer were taking A/AS Levels and other Level 3 qualifications than in 2014.[footnote 422]
392. Completing Level 3 qualifications provides a range of benefits. Those who study Level 3 qualifications are more likely to progress into sustained education or employment than those studying at Level 2, and see a significant wage premium.[footnote 423]
393. But not all vocational routes deliver equal returns. At Level 3, qualifications in construction, engineering and ICT attract the greatest wage premiums.[footnote 424] Subject choice matters. But so does progression: moving from one qualification level to the next in any subject is consistently associated with higher earnings, greater employment and reduced benefit dependency.[footnote 425]
394. There is significant variation in the quality of different Level 3 vocational pathways. Students who enter university with only vocational qualifications such as BTECs are almost twice as likely to drop out before their second year compared to similar students with A Levels, increasing their risk of becoming NEET.[footnote 426] The government is introducing V Levels as the flagship vocational qualification at level 3 from 2027, as an attempt to offer a clearer choice for learners with vocational interests on par with A Levels and T Levels.
395. Pathways into Level 3 for Level 2 learners also need strengthening. 37% of those studying at Level 2 at age 16 progress to Level 3 qualifications or apprenticeships by age 18.[footnote 427] Only 8% of those on the T Level Foundation Year in 2021/22 progressed into T Levels.[footnote 428] The government has recognised this in its response to the Curriculum and Assessment Review and will develop separate pathways at Level 2 that specifically support progression into level 3 study and employment respectively.[footnote 429]
396. It is too soon to make a clear judgement on the overall quality of T Levels. The Curriculum and Assessment Review was generally positive, but noted challenges including the volume of assessment and securing the necessary quality of industry placements.[footnote 430]
397. We should also note that there are substantial numbers of the current NEET population that are achieving key qualifications at both Level 2 and Level 3 and progressing through the system, including into higher education. They are obtaining qualifications but not securing jobs. This requires further examination and suggests the need for wider policy changes to bridge the gap between educational achievement and employment outcomes through which, currently, too many qualified young people end up becoming NEET.
Declining employer investment in training
398. Alongside the contraction of publicly funded provision, there has been a long-term decline in employer investment in training. This reduces the opportunities for young people to learn on the job and progress.
399. According to the Learning and Work Institute, employer investment has fallen by 36% per employee since 2005.[footnote 431] The biggest falls have been in sectors traditionally offering significant numbers of entry-level opportunities: public administration, hotels and restaurants, and health and social care. What is spent on skills tends to be skewed towards already highly skilled people, and is often on shorter, more light-touch provision than in other countries.[footnote 432]
400. The combined effect is clear. Public funding for FE and adult skills has been cut. Employer investment in training has fallen. The two institutions that should be building the skills of young people outside the academic track are both retreating. The young people left behind are those the system most needs to reach.
Policy churn and the fragmented skills system
401. The pace of policy churn, the constant creation and abolition of qualification types, institutional forms and funding streams, creates uncertainty for colleges, employers, careers guidance and for young people, all of whom struggle to keep up with the changing landscape. Most starkly, this churn is focused largely on non-academic parts of the post-16 system. The academic route remains largely untouched for the past 75 years, making it recognisable and easier to navigate.
402. The system’s fragmentation is hardwired through arbitrary age thresholds that divide responsibilities at the precise moment continuity is most needed. For those aged 18 and over, the landscape becomes even more incoherent. A patchwork of competing responsibilities sits across local authorities, Mayoral Strategic Authorities and DWP. Adult skills funding is spread across a wide range of needs. Adult careers guidance provision is insufficient. Qualification reforms focused on age 16 to 19 pathways, such as V and T Levels, are not necessarily tailored to the needs of those aged 19 and above, including for part-time adult learning. Skills England has been established to improve the national skills offer, working across government and with employers and local and regional stakeholders to create solutions that can deliver skills needs. Its success is vital to help to bridge this fragmentation and bring order to the system. The question is whether, on its own, it can bring order out of chaos.
403. Right now, there is no single view of the young person: the challenges they face, the support they need, the provision that would help. The system cannot tailor support because no actor holds a sufficiently complete picture without placing the burden on the individual to repeat the same story to multiple services. It struggles to learn what works because outcomes are not consistently defined or reliably linked to interventions. And it lacks the foundations for effective data sharing and interoperability.
404. The post-16 landscape is not merely underfunded. It is confused, fragmented and designed around institutional convenience rather than the needs of the young people navigating it. For those with the fewest resources and the most complex needs, it is close to impassable. The system loses young people not because they vanish but because no one is looking.
Participation is mandated but not enforced
405. Even when there is a legal requirement to ensure that young people are in education or training the system fails some youngsters. The Raising of the Participation Age (RPA) policy requires all young people in England to continue in education or training until 18. The main intention behind RPA was to better address the rising numbers and risks for young people becoming NEET. However, although participation is mandated, it is weakly enforced with fragmented responsibility. Progress in reducing the NEET rate among those aged 16 to 17 has largely stalled since its introduction, remaining around 4% to 5% between 2013 and 2025. In 2025, almost 57,000 of students aged 16 to 17 in England were NEET.[footnote 433]
406. Responsibility for local authorities remains unclear on this issue and it is not clear that all local authorities believe they have clear powers and funding to meet their duties. This can lead to young people who drop out becoming hidden, cut off from support. This entrenches disengagement before they even reach the benefit system. A statutory requirement without aligned architecture does not in itself improve outcomes.
Government reforms
407. The Post-16 Education and Skills White Paper 2025 signals recognition of many of the failures in the current system. It aims to better join up the system and smooth transitions, proposing automatic college places for those without a post-16 study plan, an enhanced role for Strategic Authorities, and reforms to post-16 English and maths. A range of measures are intended to strengthen the FE system and make sure there are high-quality opportunities and pathways for some of the most at-risk learners, including those at lower qualification levels and those with SEND. And the government has sought to rebalance the apprenticeship system back towards young people, including through new foundation apprenticeships and wider reform. The Skills White Paper outlined work with employers to create a joined-up skills system to help drive growth. When Skills England was established in June 2025, it was charged with a mission to support ‘better skills for better jobs’.
408. Specialist technical institutions, such as Institutes of Technology (IoTs), University Technical Colleges (UTCs) and Technical Excellence Colleges (TECs) have shown promise. UTCs boost vocational achievement without harming academic achievement for students who enter at 16 and improve enrolment in apprenticeships and employment prospects by age 19.[footnote 434] However, the same analysis shows a sizeable negative effect on academic achievement for those who enter at age 14. More time and evidence are needed to understand how best to utilise specialist institutions like UTCs as part of the broader education offer.
409. Supported internships, one of the few structured pathways specifically designed for learners with EHCPs, and which are being piloted by the DfE for those without EHCPs, face significant barriers to scaling. Employer willingness, provider capacity and funding availability, including through Access to Work, all constrain supply.[footnote 435] A young person with an EHCP who wants to work, whose family wants them to work, and whose school believes they could work, can still find that no supported internship is available within a reasonable distance. The system has created a model that works,[footnote 436] but not to date the infrastructure to deliver it at scale.
410. In principle these measures could address many of the issues identified here, if transitions ended at age 18. For most young people, they are only just beginning by then. Whether these measures prove sufficient depends on whether they are backed by funding, data infrastructure and accountability mechanisms that previous reforms lacked. They will also need clear and focused coordination across the system, with buy-in from young people and those who support them: educators, employers and policymakers.
Higher education: not always the answer
411. As the numbers accessing further and adult education have declined, more young people are participating in higher education. The higher education entry rate for those aged 18 in the UK has increased from 24.7% in 2006 to 36.3% in 2025.[footnote 437] For many, this is the right path. Graduates in general continue to be more likely to be employed,[footnote 438] earn more and access higher-skilled work.[footnote 439] However, there is some provision where this is becoming less likely with higher rates of non-completion and poorer destination and wage return data.[footnote 440] There are significant differences between local economies with many regions struggling to generate sufficient graduate level opportunities or wages. Research shows that graduate premia in regions outside of London and the South East are falling for the majority of subjects.[footnote 441] A concerning proportion of the NEET population hold a degree or other higher education qualifications, around 13%.[footnote 442]
412. The expansion of higher education has been a significant achievement. The question is not whether higher education is valuable. It is whether it is too often being positioned as the default at the expense of high-quality alternatives that might serve some young people better. In this regard there is a particular fault line in the broader system where the numbers in higher education and access to student loans are currently uncapped whereas the number of places in further education colleges are more rigorously controlled and typically funded at much lower rates.
4.12 Conclusion
413. Britain has much to be proud of in our school, college and university system. Attainment standards have improved. Careers guidance has advanced. There are many schools, colleges and programmes doing exceptional work in the most difficult circumstances. Education remains a critical protective factor against young people becoming NEET. The higher the qualification the lower the likelihood of a young person becoming detached from the labour market. But there is evidence that education attainment is not as protective as it once was. And the way young people are taught and made familiar with the world of work is not keeping pace with a fast-changing labour market. Schools are struggling with new challenges and more young people are feeling the system isn’t working for them.
414. The education system knows who will struggle. It knows at age 5. It knows again at age 11 and then at age 16 too. It has the data, the evidence and the research. It has had them for decades. What it does not have is the architecture, the funding or the accountability to act on what it knows. Schools are measured by exam results, not by whether young people end up in work. Colleges are funded for enrolment, not for sustained destinations. Careers guidance is a statutory duty without enforcement, and work experience is haphazard.
415. The skills system beyond school tells the same story. Critically the number of young people participating in post-18 education is falling. This is particularly true for those on the vocational path where opportunities have been shrinking. Further education has been hollowed out by a decade of real-terms cuts. Apprenticeships have drifted away from the young people who need them most. The Levy has been captured by employers upskilling existing workers rather than bringing in new ones. Quality is uneven and dropout rates are too high. Foundation apprenticeships, supported internships and specialist technical institutions show what is possible, but none yet operates at the scale the problem demands. These faultlines are compromising the role that education participation has played over recent years in compensating for the decline in labour market participation by young people. This is a serious concern.
416. The education and skills system does not fail by accident, but by design. It is designed to produce qualifications rather than working adults. Until that changes, until schools are held accountable for what happens to their pupils after they leave, until colleges are funded for outcomes not headcounts, until the post-16 cliff edge is bridged and the young people the system loses are the young people it works hardest to hold, the tail of failure will persist. And the nearly 1 million young people outside education and work will continue to pay the price for a system that saw them coming, watched them fall, and never caught them.
Chapter 5: health – configured for treatment, not participation
417. Health is no longer a background factor in youth disengagement - it is central. Ill-health is now a primary driver of who becomes NEET and who stays NEET[footnote 443]. For the first time in perhaps 2 centuries, changes in health, especially mental health, are impeding economic growth and causing a contraction in the supply of labour.
418. This chapter describes a fragmented health system that is not configured for the new demands it faces, and one that does not view labour market participation of young people as a core health outcome. That is the central fault line. All too often the way the NHS works inhibits rather than enables participation. That has to change.
5.1 The social foundations of poor health
419. The health of young people does not exist in isolation from the social and economic conditions in which they grow up. Poverty and housing instability have deteriorated for a significant proportion of the population[footnote 444], putting pressure on families and communities. Worsening social and environmental conditions pose direct health risks and drive poor health behaviours (poor diet, low activity, smoking/vaping, alcohol problems, low uptake of vaccinations) which then lead to poor health outcomes and create the underlying vulnerability on which the health system then fails to act. Everything described in this chapter operates on top of that foundation. The NHS cannot solve what poverty produces. But it can do far more than it currently does to prevent health problems from becoming participation problems.
5.2 The scale of the change
420. Chapter 1 sets out the evidence on health and young people who are NEET. The headline figures bear repeating here because they frame everything that follows.
421. Disability rates among NEET young people have more than doubled over the past 15 years. In 2024 to 2025, nearly half of young people who are NEET in the UK, 45%, report having a disability - more than doubling from 21.1% in 2013 to 2014[footnote 445]. Disability prevalence among all 16 to 24 year olds has also doubled, from 10% to 19.7% over the last 10 years.[footnote 446]
422. Mental health problems are the principal driver. Over the past 15 years, the proportion of disabled NEET young people citing mental health as their main health problem has nearly doubled – rising from 24.3% in 2011 to 42.6% in 2025. Meanwhile, those reporting physical or other health problems have more than halved, falling from 74.1% to just 32.1%.[footnote 447]
423. The duration of staying NEET as a consequence of illness is devastating. Of those who fell into this category between 2017 and 2019, almost 8 in 10 were still NEET more than 2 years later.[footnote 448] This is not a transient problem. It is long-term detachment driven by ill-health and by the inability of systems to accommodate health-based needs.
Mental health
424. It is mental health conditions that are now the most commonly reported health condition among NEET young people. One in five (20.0%) of all NEET young people report a mental health condition, more than double the share in 2012, when it stood at 7.7%.[footnote 449]
425. This explosion has primarily been in mental health issues such as anxiety and depression, rather than in serious mental illnesses (SMI), which had an estimated prevalence of 1.16% for people aged 14 and over in England in 2023.[footnote 450]
426. Girls report significantly higher levels of anxiety and depression than boys. The UK ranks 27th out of 36 countries for children’s mental health in the UNICEF Innocenti ranking of child wellbeing, well below peer nations like the Netherlands and France.[footnote 451]
Call for evidence – Mental Health UK response
“Almost 48% of all lifetime mental health conditions emerge before the age of 18, a finding reinforced by global epidemiological evidence showing that nearly half (48.4%) of all mental disorders begin before 18, and over 62% before 25.”
427. NHS England’s survey of the mental health of children and young people found stark inequalities. Children aged 8 to 16 with a probable mental disorder were more than 4 times more likely to live in a household unable to afford enough food, and almost 3 times more likely to live in a household unable to afford heating than those without a probable mental disorder.[footnote 452] Most of today’s 16 to 24 year olds were aged between 11 and 18 during the Covid-19 pandemic. They experienced significant deterioration in their mental health and major disruption to their education. Pre-existing inequalities widened, with the most disadvantaged young people hit hardest - those already at higher risk of becoming NEET.[footnote 453] Levels of psychological distress among 18 to 24 year olds had almost doubled in April 2023 compared with 2017 to 2018 (Figure 25).[footnote 454]
Figure 25: proportion of 8 to 16 year olds with a probable mental disorder by gender, England, 2017 to 2023
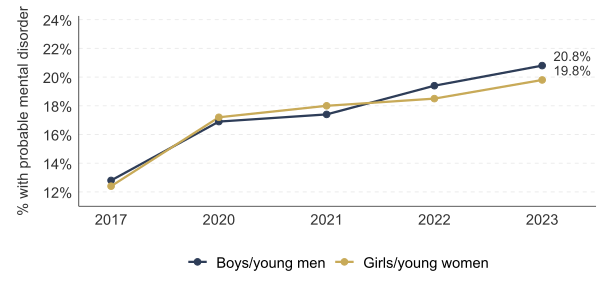
Source: Mental Health of Children and Young People in England 2023 - wave 4 follow up to the 2017 survey: Data tables, NHS England Digital (www.digital.nhs.uk), published 21st November 2023. Available at: Mental Health of Children and Young People in England 2023 - wave 4 follow up to the 2017 survey: Data tables - NHS England Digital
428. But the pandemic did not create these problems, although it may have accelerated them. The trends in mental health prevalence were already rising well before the pandemic.[footnote 455]
429. The interim report of the Independent Prevalence Review, led by Professor Peter Fonagy, confirms the scale and complexity of what is happening.[footnote 456] Psychological distress has increased most sharply among younger people, marking a significant reversal of previous age-based patterns. The largest increases are in emotional symptoms, loneliness, sleep problems, loss of confidence and difficulty concentrating. Among those reporting high levels of distress, functional impairment has also increased.
430. That matters enormously for this review. It confirms that what we are seeing is not simply a change in how young people talk about their mental health. It is a change in their capacity to participate. There is a difference between a generation that is more willing to name its struggles and a generation that is functionally less able to engage with education and work.
431. The relationship between diagnosis, disability, distress and participation is not straightforward, but they are often conflated. As thousands of disabled people prove every day, it is entirely possible to have a diagnosis and a disability and still be able to participate with the right support. Equally, individuals without a formal diagnosis may be significantly impaired. It is functional impairment, rather than diagnosis per se, that predicts participation outcomes. The health system needs to respond to that distinction, but has not to date done so.
Neurodevelopmental conditions
432. The Fonagy interim report confirms that the neurodevelopmental picture is particularly striking. Referrals, waiting lists and recorded diagnoses for ADHD have increased substantially. The number of children and young people waiting for an ADHD assessment rose from around 21,000 in April 2019 to around 270,000 by December 2025. Autism diagnoses have followed a similar trajectory, with especially rapid growth among females and young people without a learning disability.[footnote 457]
433. But the underlying prevalence of ADHD symptoms has been far more stable. Population-based estimates of autism in children have also remained broadly stable. Multiple things are happening at the same time. Stable underlying prevalence can coexist with rapidly rising diagnosis, referral and service demand. The health system is under enormous pressure. But the relationship between that pressure and underlying need is not straightforward. Fonagy points to the way in which health, education, and welfare systems can make diagnosis the practical route through which families seek recognition, earlier intervention, or additional support.[footnote 458]
434. That complexity matters. If the rise in diagnoses were simply the correction of historic under-recognition, the response would be straightforward: more assessment capacity and more clinical treatment. If, as the evidence increasingly suggests, the current patterns are shaped as much by the design of systems as by underlying need, including the incentives those systems create and the tendency to medicalise forms of distress that may have broader social or developmental roots, then the response must be broader. It must include earlier, more accessible forms of support that do not depend on long waits for specialist diagnosis. And it must address the social determinants producing the distress in the first place: poverty, family instability, social media. Critically, as there seems to have been a widening of what is recognised as disability within the system – and with it an expansion of the range of diagnoses and conditions that legitimise non-participation - the key issue is not the label itself but the functional impact. Until the health – and wider – system gets to grips with that key distinction, too many young people will be categorised as unfit to work when, with help, support and earlier intervention, they would be able to do so.
5.3 The evidence debate
435. The public discussion of these trends has become heavily polarised. Some emphasise under-recognition and demand more diagnosis. Others raise concerns about over-diagnosis and medicalisation. This review does not align with either camp. The evidence does not support the claim that nothing real has changed or that young people have somehow become “softer” than previous generations. Functional impairment has increased. Participation has deteriorated. The scarring is measurable. Young people are not inventing their distress. But nor does the evidence support the assumption that every rise in diagnosis reflects a corresponding rise in underlying condition. A system that makes diagnosis the only reliable gateway to support will inevitably produce more demand for diagnosis, regardless of whether underlying prevalence has changed. And a system that has a single diagnosis for such a broad range of symptoms and need is woefully simplistic, inappropriate and risks diminishing the support and resources for those with the greatest needs. These are design problems, not clinical ones.
436. What the evidence does support is this: a growing number of young people are in genuine distress, while the system is struggling to respond. And the current model, one that depends on diagnostic thresholds as the gateway to support and organises care in clinical silos, is failing to convert either diagnosis or treatment into sustained participation. The question is not how many young people have a diagnosable condition. The question is how many are able to participate, and what the system is doing about it. The answer, for too many, is not enough. All too often a diagnosis becomes a gateway into the health and welfare system and to a life outside the labour market. Instead of assuming that people with a diagnosis cannot participate, the first question the system should be asking is what can they do and how can it enable that to happen.
437. Poor health reduces participation. Reduced participation worsens health. Worsening health further reduces the likelihood of return. That is the vicious cycle that the system does not break. In too many cases currently, it reinforces it.
438. This is therefore no longer a labour market problem with a health dimension. It is a health crisis with labour market consequences. The system that responds to it was built for a different era and a different cohort. The sections that follow examine how and why it is failing.
5.4 The spectrum the system doesn’t see
439. The system treats mental health as if it were binary. A young person either meets the threshold or they do not. They are either referred or they wait. Of course, a young person may get SEND support at school, or help from their family at home; but in other aspects, without a clear diagnosis, young people too often go without support. But most common mental health conditions do not easily fit binary distinctions. Anxiety, depression, ADHD, eating disorders: these exist on a spectrum. They range in severity. They fluctuate. And their impact on a young person’s ability to participate depends not only on the clinical picture but on the social circumstances around it. A young person with moderate anxiety and a stable home, a supportive school and an engaged parent is in a fundamentally different position from a young person with the same clinical presentation who is living in temporary accommodation, out of school and without an adult advocate. The system does not make that distinction. It applies the same threshold, the same waiting list and the same pathway regardless.
440. We do not currently have a framework that brings clinical severity and social circumstance together in the way that, for example, maternity services have long combined clinical and social risk to shape care pathways. We do not know with any confidence how many young people sit at different points on the spectrum of severity, or how that picture changes when social disadvantage is overlaid. There are no agreed criteria that would allow less complex presentations to be identified through screening rather than full clinical assessment, and it is the reliance on full assessment that drives much of the waiting time described in this chapter. There is no shared understanding of what appropriate care looks like at different levels of need, or which of those levels could be served by different models entirely, whether that is digital provision, social prescribing, peer support or trained non-clinical staff rather than clinicians. And there are no metrics that tell us whether the response at any given level is actually working, beyond whether an appointment happened.
441. All of this matters because the system cannot cope with the volume it faces if every young person who presents with distress is routed towards the same clinical pathway. Even more critically, response to distress does not sit solely within health services, especially when identified early. Effective support often comes from education, family and community settings. When early intervention does not happen elsewhere in the system, the NHS ends up having to step in. Unless the response becomes more of a cross-system responsibility, rather than one that sits primarily with the NHS, the latter will find itself overwhelmed.
442. The point is that the shape of the need is not uniform and the response should not be either. Until we understand that shape, its distribution across severity and social risk, and what a proportionate response looks like at each level, we will go on applying a blunt instrument to a problem that demands something more precise.
443. Similarly, mental and physical health issues frequently co-occur, and many children and young people have complex needs that demand a joined-up response. But the system tends to treat each condition separately, through different services and different pathways, when what the young person experiences is a single, interacting burden. Until services are organised around the person rather than the diagnosis, co-occurring conditions will continue to drive longer and deeper spells of disengagement.
5.5 Unequal access
444. Health problems do not fall equally across society. They are patterned by disadvantage. Young people from the most deprived backgrounds are more likely to experience mental ill health and less likely to receive timely, effective support. The system fails hardest where the need is greatest.
445. Children from the least deprived areas in England are 1.6 times more likely to have their referrals to CAMHS accepted than children from the most deprived areas.[footnote 459] Almost 4 in 10 17 to 19 year olds in the most deprived areas who sought specialist support were still waiting or never received it, compared with 3 in 10 in the least deprived.[footnote 460] Black and mixed-ethnicity young people are more likely to enter mental health services via crisis or compulsory routes, and less likely to access early, voluntary support.[footnote 461] Cultural barriers, mistrust of institutions and a lack of culturally competent provision mean that some communities are systematically underserved.[footnote 462] Young people from ethnic minority backgrounds are more likely to reach services late, when their needs are more acute and the path back to participation is longer. Any serious strategy for reducing health-driven NEET must address these inequalities head on.
5.6 Slow access
446. There is evidence that timely healthcare supports better labour market outcomes.[footnote 463] The system is not delivering timely healthcare. Most tellingly of all, waiting time targets which exist for physical health conditions are entirely absent for mental health services.
447. The front door of the NHS is itself part of the problem. General practice, where most young people first present with health difficulties, is weakest where need is greatest. GP surgeries serving deprived parts of England receive on average 9.8% less funding per needs-adjusted patient. Practices in poorer areas employ fewer GPs and perform less well on all major markers of quality, CQC inspections and patient satisfaction included.[footnote 464] Young people report lower satisfaction with GP services than older age groups.[footnote 465] For many young people, the GP is where health, education and work intersect, but the system does not equip primary care to perform that role effectively. There are no clear, well-understood routes between GPs, Mental Health Support Teams, school counsellors and specialist care. For a young person in distress, the first contact with the health system is often the point at which the system fails them.
448. Waiting times for specialist services vary enormously. Median waits for CAMHS range from over 100 days in some integrated care boards (ICBs) to six days in others. The share of referrals receiving 2 contacts, used as a proxy for entering treatment, varies from 16% to 63%.[footnote 466]
449. The median waiting time for an autism assessment for 0 to 17 year olds is almost 600 days, a fivefold increase since 2019. [footnote 467] Community paediatrics waiting lists have tripled in recent years, with community paediatrics and speech and language therapy making up almost 75% of children’s community waiting lists. Almost 25% of children wait a year or longer for community health services.[footnote 468]
450. In 2023 to 2024, 910,567 were referred to CAMHS in England. Almost 1 in 5, 171,134, had their referral closed before they accessed any support. Thresholds have risen. It often seems the only way to become eligible for more help is to become more unwell.[footnote 469]
451. There are long waits for CAMHS and very little in between primary care advice and CAMHS treatment. Parents are sent self-help information, but there is no formal bridging care, and families are left to wait. This is a crucial missed opportunity.
452. Without early intervention, the risk of future school absence or other NEET risk factors is likely to grow. Reviews consistently find a major gap in support for children who do not meet CAMHS thresholds and have no alternative provision, particularly in areas where early intervention, school-based and voluntary sector services have been cut back. The result is predictable: problems escalate until crisis care is needed, with little communication or interim support for those on waiting lists.[footnote 470]
453. The most cost-effective point of intervention is before crisis, not after it. Yet the system consistently invests in acute response rather than prevention. School-based counselling, community youth mental health hubs and peer support programmes have all shown promise in reducing escalation, but none operates at the scale required.
454. A prevention-first approach would mean funding early intervention services as core provision, not as discretionary add-ons vulnerable to annual budget cycles. It would also mean recognising that prevention is not solely a health system responsibility. Schools, employers, youth services and local government all have a role. Until prevention is funded and governed as seriously as treatment, the system will continue to be overwhelmed by demand it could have reduced.
5.7 A thin evidence base
455. In our discussions with mental health charities and professionals, it was acknowledged openly that the evidence for effective interventions to help young people with health conditions is notably lacking. There have been fewer than 10 high-quality randomised or quasi-experimental studies on UK youth employment interventions in the past two decades, compared with hundreds in education. This is an under-researched area. We lack robust evidence on causes and on what actually works to support individuals into sustained work and education.
456. One promising model does stand out. Individual Placement and Support (IPS) is one of the few approaches with a strong international evidence base demonstrating that integrated employment and health support can produce sustained labour market outcomes for certain cohorts. IPS places employment specialists directly within clinical teams, so that job search, employer engagement and clinical care happen in parallel rather than in sequence. Job search is tailored to individual preferences and personalised, one-to-one, support is provided and continues for as long as is necessary after the person gains employment. This has been shown to be effective for people with severe mental illness[footnote 471] and people with alcohol and drug dependency.[footnote 472] While IPS has been attempted for people with common mental health problems, the evidence and effectiveness isn’t as clear cut in this cohort.[footnote 473]
457. In England, IPS is being rolled out for those with severe mental health conditions, such as schizophrenia and bipolar disorder, and within drug and alcohol services. The recently launched Connect to Work programme in England and Wales complements existing IPS provision, providing IPS and supported employment programmes to adults who are economically inactive due to disability, health conditions, or other complex barriers. Crucially, Connect to Work will see IPS reach people with a wide range of disabilities and health needs.
458. There is better evidence on the clinical effectiveness of specific treatments such as CBT, but even then it is not unequivocal when it comes to young people. NHS Talking Therapies have good access and have been shown to produce positive labour market outcomes for those over 25, but recovery rates are lower for the 16 to 24-year-old cohort.[footnote 474][footnote 475] For the older age range, the labour market outcomes are so positive that they are scored favourably by the Office for Budget Responsibility.[footnote 476] Sadly, it is likely that Talking Therapies are less effective at engaging and retaining younger people.[footnote 477]
459. The current system was not set up to deal with the prevalence of distress Fonagy reports. High levels of anxiety and depression among young people do not lend themselves to traditional hospital-based mental health treatment, or to many existing community-based models of care. Nor is it feasible to expect the NHS to cope alone with that volume of demand. Effective responses to distress often sit outside traditional healthcare: in education, communities and employment settings. Similarly, alternative provision through digital channels has shown some evidence of success, but it has not been implemented at scale and there is huge variability in the quality of what is available.
460. The most recent NICE guidance on digital interventions for children and young people experiencing low-moderate symptoms of anxiety or low mood identified 4 different tools that can be used as an initial treatment option. However, NICE are clear that the evidence base is very limited: studies are small, often lack comparators, and provide only weak evidence of improvements in anxiety symptoms. Other key gaps include effectiveness for neurodivergent young people and rates and reasons for stopping treatment. An evidence base is largely lacking. This feels like a major weakness in the health ecosystem.
5.8 Funding: gaps and variations
461. It is an oft-repeated assertion that mental health is the Cinderella of the NHS. We have heard it strongly argued during the review that services are over-stretched and under-funded. We heard evidence that mental health receives less than 10% of NHS spending despite accounting for 20% of the morbidity burden (Figure 26).[footnote 478] Children and young person’s mental health services receive around 11% of all mental health spending, despite those aged 18 and younger accounting for 33% of all contacts with mental health services.[footnote 479]
462. For 2026 to 2027, mental health spending is forecast to reach £16.1 billion, a real-terms increase of around £140 million compared with 2025/26.[footnote 480] The number of NHS staff involved in providing mental health services to children and young people has more than doubled between 2016 and 2025, growing from 7,965 FTE to 18,156 FTE. This growth hasn’t been equal in all staff groups, with the overall share of staff in some professional groups falling. Share of staff is down 7.5 percentage points for mental health nursing and down 5 percentage points for child and adolescent psychiatry.[footnote 481]
463. On the other hand, the workforce has seen a welcome increase in the share of roles supporting Mental Health Support Teams, rising from 4% in 2016 to almost 18% in 2025.[footnote 482] Mental Health Support Teams are now operational and accessible to over 50% of pupils and learners in schools and colleges, with full coverage planned by 2029 to 2030, and that is welcome.[footnote 483] There is growing evidence that school-based mental health intervention helps reduce anxiety and depression. But Mental Health Support Teams often do not share information with GPs. The gap between school-based early support and specialist CAMHS treatment remains wide.
464. Alongside pleas for more investment in mental health services, we also received compelling evidence that the way existing resources are currently utilised is sub-optimal. Variability in spending and performance is enormous.
465. Investment per child referred ranges from £548 to over £2,500 between ICBs.[footnote 484] Unmet need ranges from 5% to 40% of children with mental health needs accessing specialist care.[footnote 485] The NHS pays very disparate amounts for care and there are deep inefficiencies in its delivery. All of which adds real weight to the argument that commissioning of these services can be significantly improved. Critically, funding is not currently tied to outcomes.
Figure 26: Share of NHS budget by setting, hospital, community, mental health, primary care, 2015 to 2016 to 2023 to 202420
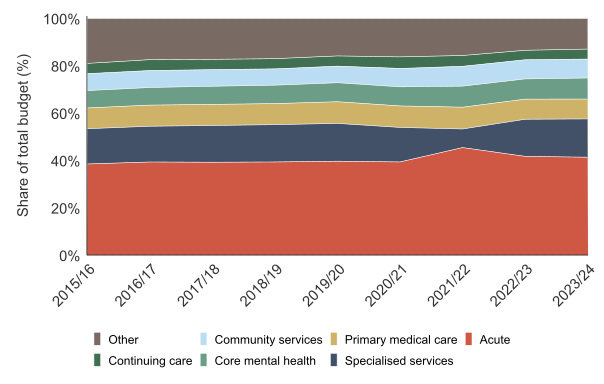
Source: Department for Health and Social Care, Total CCG/ICB and Direct Commissioning net expenditure, November 2023
5.9 Activity, not outcomes
466. The Review’s engagement with local health leaders elicited a deep concern that the health system places too much emphasis on clinical activity and access targets and too little accountability for education or employment outcomes. The health system is configured for episodic treatment, not sustained functional recovery. Funding models reward activity and throughput, not whether a young person returns to school, sustains further education or progresses towards work. Commissioners do not have incentives to target outcomes like entering work or education and are not always enabled to do so with flexibility and autonomy. Participation is not an outcome the NHS is held accountable for. Nor does the system focus sufficiently on improving function, rehabilitation or occupational therapy provision. Too often it stops at diagnosis and treatment without asking whether the young person can participate in education or work as a result.
467. Worse than the gaps in treatment, the interaction between the health system and the benefit system can inadvertently restrict rather than promote participation. The health system certifies incapacity. The benefit system administers it. Neither is incentivised to support the young person back towards participation. The result is that health-related inactivity, once entered, becomes self-reinforcing.
468. The poster child for this structural failure is the Fit Note. Once young people are struggling, the fit note system does not encourage participation. The default “not fit for work” note is quick for pressured GPs and often expected by patients, but it rarely generates a plan for staying in or returning to study or work. GPs have cited a lack of training on completing the fit note, a lack of knowledge resulting in default judgements of “not fit,” and no financial incentive to keep people in work. With approximately 11 million notes a year in England and the vast majority, 93%, marked “not fit,” many people drift from short absence into long inactivity without adjustments or review. This has been getting worse since the pandemic.[footnote 486]
469. National fit note data by age are not routinely available, but, for Universal Credit, over 100,000 young people declared a fit note and joined the Health Journey in 2025, going on to provide 300,000 fit note declarations in total that year. That is a staggering number of young people being set by the NHS on a path towards long-term inactivity.[footnote 487] When surveyed, very few healthcare professionals thought that more fit notes should be issued (9% agree, 48% disagree), or that the fit note system provides young people with the support they need (9% agree, 49% disagree).[footnote 488]
470. The underlying problem is that the system operates in binary terms: fit or unfit, in or out, present or absent. The “may be fit” option appears to be underused, which may suggest that many GPs are not confident in using it proactively. Yet what many young people describe is not permanent incapacity, but variability. Many are capable of studying or working on some days but struggle on others. They do not describe choosing inactivity over work. They describe managing fragile participation in systems that are not designed for fluctuation. The fit note is the instrument through which that binary logic is applied. A “not fit” note for an 18-year-old who has never worked does not pause a career. It prevents one from starting. This needs fundamental reform.
5.10 Silos, not integration
471. A consistent theme from our call for evidence and our engagement with young people is the siloed nature of how the NHS operates. There are multiple efforts at a local level to bring the NHS alongside other public agencies, but integration has been hard to achieve in practice. Local health leaders expressed concerns about short term, fragmented funding that undermines early intervention and the consistent use of expertise in the voluntary and community sector.
472. Even within the NHS, siloed working is commonplace. Poor communication between GPs, schools, CAMHS and other referrers contributes to inappropriate referrals, poor signposting and delay.[footnote 489] Where mental health services and schools fail to share information, there is often no joined-up approach to care, no culture of sharing care plans or child protection plans, putting children at risk.[footnote 490] This is not limited to CAMHS: Mental Health Support Teams in education settings often do not share information with GPs.
473. The transition from paediatric to adult healthcare often coincides with critical points of transition across the education pathway or into employment. A consistent theme from the call for evidence was the challenge of transition points and cliff edges. The move from paediatric to adult care is one such point of jeopardy for vulnerable young people at risk of becoming NEET. Gaps between CAMHS and adult mental health services mean people are left without care at critical periods.[footnote 491] Transitions are handled rigidly and administratively rather than based on patient need. Young people are frequently moved to adult services at age 18 despite guidance that transitions should reflect individual maturity and circumstances.[footnote 492] Poor planning means some fall through the gaps, including cases where CAMHS discharged young people without effective onward referral. Some go on to experience severe or even life-threatening deteriorations in their condition.[footnote 493]
474. The silos extend well beyond the NHS. Integration across health, education, employment and wider local systems remains partial and inconsistent. Lines of accountability for achieving better participation outcomes are unclear and weak. Data is not shared across silos. Geographic boundaries between health, education and local government do not align. No single institution holds a complete picture of a young person’s journey. Considering mental health, healthcare professionals that we surveyed were asked to select the top 3 ways the health system could play a more effective role in reducing the number of young people who are NEET. Reducing waiting times was the most popular answer, followed by better signposting to non-clinical support and a more tailored/holistic approach to care. Over half of the survey respondents thought that there was inadequate availability of non-NHS services in their area to signpost patients to for non-clinical support to improve patients’ mental or physical health or wellbeing.[footnote 494]
475. The NHS also has limited engagement with employers. If participation in work is to become a health outcome, the health system needs to understand the labour market it is trying to return young people to. There is little evidence of systematic NHS engagement with employers on workplace adjustments, phased returns or supported employment for young people with health conditions. The Keep Britain Working review, led by Sir Charlie Mayfield, confirms this.[footnote 495] Employers are largely absent from the health and work conversation. The NHS treats patients. Employers manage absence. Nobody manages the return. GPs issue fit notes without contact with the employer. The employer receives a certificate but often no guidance on adjustments. There is no systematic link between the two. Occupational health coverage is deeply unequal: only around 45% of employees have access to occupational health services, with coverage lowest among smaller employers and in lower-paid sectors, precisely the entry-level jobs young people are most likely to occupy.[footnote 496]
476. Mayfield argues, and I agree, that the workplace should be treated as a setting for health improvement, not merely a destination after recovery. Work can be therapeutic. But only if the health system and employers are connected. For young people with health conditions trying to enter work for the first time, that connection barely exists. They are expected to navigate alone the gap between a health system that does not consider their employment and an employer who does not understand their condition. That is a design failure. Both the health system and employers need to own it.
5.11 What is being done
477. The Ten Year Health Plan for England for the NHS seeks to overcome this lack of integration by creating a new generation of integrated health organisations to hold the whole health budget for a defined local population by streamlining how local government and the NHS work together, and by making ICBs coterminous with strategic authorities.[footnote 497] That should incentivise local health systems to integrate more effectively with other local services and to intervene earlier to help prevent young people at risk of becoming NEET.
478. The Ten Year Health Plan sets expectations for ICBs to establish measurable outcomes targets on economic inactivity and unemployment, based on the Health and Growth Accelerator model. Three pioneer ICBs, West Yorkshire, South Yorkshire, and North East and North Cumbria, began from April 2025 working with local partners to test an approach where they are held accountable for impact on people’s work status, through a bio-psychosocial approach to early intervention and prevention, with two of the three focusing on NEET cohorts.[footnote 498] The Health and Growth Accelerators also seek to strengthen a system approach to work and health, and to embed good work as a health outcome in health and care services. WorkWell, a service providing holistic assessment of work and health needs for those over 16,[footnote 499] and Youth Guarantee Trailblazers testing innovative approaches to identifying and supporting 18 to 21 year olds at risk, represent further positive steps.[footnote 500]
479. In addition, the new mental health strategy for England being developed through the government’s 10 Year Health Plan will set a new direction for the mental health system. It will focus on responding earlier and more proportionately, intervening before distress escalates to diagnosis or crisis, so that people can stay active and participate in education, work, family life and their communities.
480. It is welcome that the Ten Year Health Plan also aims to reduce the share of expenditure on hospital care, with proportionally greater investment in out-of-hospital care, and moving to longer-term budget setting and outcomes-based funding for local health systems. These changes aim to incentivise a move towards more value-based care. These are all welcome strategic changes. The question is not whether the direction of travel is right, but, as with education system reforms, whether the pace and scale of change will match the pace and scale of the crisis.
481. There is no consensus yet on the extent to which labour market participation should be an explicit outcome for the NHS. That debate needs to be resolved. Until the health system accepts that helping young people into education and work is part of its core mission, not an optional extra, it will continue to treat the symptoms of a crisis it is helping to perpetuate.
5.12 Conclusion
482. The health chapter of this review tells a story that should disturb anyone who cares about the future of young people in this country.
483. A generation is in genuine distress. The distress is not imagined, but often severely functionally impairing. It is measurable in participation rates, in attendance data, in benefit claims, in the testimony of young people themselves. For a growing share of the NEET population, health is the primary barrier to their future. But the system – health included – is not coping with the new scale of the challenge it faces.
484. It is failing them because the NHS was not designed for this. Historically it has never been asked, funded or measured to deliver participation. The NHS was built for episodic illness and acute treatment, not for a generation presenting with anxiety, depression, neurodevelopmental conditions and overlapping needs that require sustained, coordinated support across health, education and employment. What young people now present with has changed fundamentally, in volume, in complexity and above all in the dominance of mental health. The system has not changed with it. Services configured for a world in which mental health was a secondary concern are now overwhelmed by a reality in which it is the primary driver of disengagement.
485.Nor has the system ever regarded helping young people into education or work as part of what it does. A young person can be diagnosed, treated and discharged and still be no closer to re-engaging with education or employment. The health system treats symptoms. It does that with dedication and often with clinical excellence. But treating symptoms while the pathway to participation collapses around the patient is not good enough. The question the system should be asking has to move from “how many young people have a condition” to “what enables young people to remain engaged in education, work and ordinary life”. The task is not to turn the NHS into an employment service, but to ensure that treatment, support and recovery are judged by whether they help young people participate in the lives they are trying to build.
486. Being in good work is good for wellbeing. Having more people in work grows the economy and creates more tax receipts to fund public services, including the NHS itself. There is a virtuous circle waiting to be unlocked. But it will not unlock itself. It requires the health system to do something it has never been asked to do: take responsibility not just for whether a young person is treated, but for whether they are able to participate in the life that treatment is supposed to make possible. The way the health system works today is failing to achieve that.
487. For a generation of young people whose health is the primary barrier to their future, that is not a technical failure, but one of design - and one this country can no longer afford.
Chapter 6: a welfare state not designed for participation
488. Too many young people are being denied the chance to earn or learn. As previous chapters demonstrate, the causes of this are in large part upstream of the welfare system: in education, health, and the labour market. But the welfare system matters because it is the state institution most likely to encounter young people once other systems have failed. How it works can either compound those failures or help to arrest them.
489. The welfare system has several critical functions when it comes to young people. It must provide income support for those who have yet to find work or who have fallen out of it. It must provide genuine financial security and support for independent living for young people with severe or enduring disabilities who will not be able to work. For young people in particular, the welfare system has one other core purpose - not just to be a critical safety net, but to act as a springboard to participation. But the welfare system is not currently supporting young people to earn or learn.
490. There are nearly 1 million young people in the UK not in education, employment or training. Analysis for this Review has revealed that of the young people who are NEET in England, only around one in five are getting meaningful employment support from the benefit system. Around half are “hidden” from the benefit system altogether - they are not claiming benefits so receive no employment support via DWP.[footnote 501]
491. Of those who do claim benefits, only around a third – typically those who face the least barriers to work - get meaningful support to find a job.[footnote 502] It follows that participation outcomes are correspondingly weak: among those first claiming a health or disability benefit aged 16 to 24, nearly half remain out of work or education 15 years later. [footnote 503]
492. These failures in the welfare system help to explain why in the UK growing levels of anxiety among young people are translating into higher levels of economic inactivity than in comparable countries. For example, young people in the Netherlands have similar high levels of anxiety conditions as those in the UK, but the NEET rate there is less than a third of ours.[footnote 504] While welfare is not the main cause of poor youth participation - that lies upstream from the benefits and employment support systems - it often amplifies it. This is not sustainable, either for the young people themselves or for the taxpayer footing the price for this system failure, especially as labour market participation outcomes are deteriorating over time.
493. In this chapter we show how the way the welfare system is organised produces a poor combination of outcomes: health and disability benefits are using an ever-bigger share of public spending and yet somehow the system still fails to invest enough in support to enable young people to participate. In good part that is also because it includes too many badly designed incentives that can deter participation and instead encourage benefit passivity.
494. This is at odds with what young people themselves say they want. Of young people who are claiming disability or health benefits, survey evidence shows that 19% are already in work, 49% believe they could work either now if the right job or support was available, or in the future if their health improves, and only 32% feel they will never be able to work or work again. [footnote 505] Evidence from our surveys of young people who are NEET found that 64% of those surveyed wanted to work or do an apprenticeship and a further 19% wanted to enter education or training.[footnote 506] That is not what the welfare system is enabling. A young person first claiming health and disability benefits in 2019 is 34% more likely to be NEET after 5 years than those first claiming in 2010.
495. The UK does not have a welfare system that treats participation as a core objective for young people. Instead, it too often responds to disengagement late rather than preventing it early, and ends up too often compensating for exclusion more effectively than it helps young people move back towards participation. It is designed in such a way that many young people can feel they are risking a secure income of £2,000 or more in benefits each month if they do try work.[footnote 507]
496. In the rest of this chapter, we show how that failure plays out in six principal ways.
6.1 Investment in benefits is prioritised over employment support
497. In the annex to this chapter, we outline the principal benefits and means of employment support available to young people. Resources across the welfare system are not allocated in line with the scale of participation challenges. The spending profile reveals a system designed to provide income through benefits, not to support transitions into work.
498. Overall the UK Government spends around £8.1 billion a year on benefits directly for young people through the welfare system.[footnote 508] Of this £4.6 billion is spent on means-tested income support through Universal Credit, £0.8 billion of which is on Universal Credit Health Expenditure which is a top up for those assessed as having limited capacity for work or work related activity. Around £3.2 billion was spent on disability benefits through Personal Independence Payment, which is available to people both in and out of work and aims to increase independence by providing financial support towards the extra costs that disabled people can face. In Scotland this has been replaced by the Adult Disability Payment.
499. We might look at this and conclude that the system is working to provide income and independence for young people who need it. Through the call for evidence and our engagement with Disabled People’s organisations, charities and young people themselves, it is clear that some disabled young people will never be able to work and face exceptionally high barriers to other forms of participation. The benefits system must always protect these groups. It is also overwhelmingly clear from our engagement that disabled young people want to participate and that many could with the right support access a job, a course or training. The benefit system must meet the needs of both those who may never work and those who desperately want to do so.
500. But for the group of young people who are able and want to participate in the labour market the system is not working. In 2024/25 DWP spent less than £0.2 billion funding employment support programmes for young people, plus a share of the £1.4 billion spent on jobcentre activity for all ages. Reference G. Overall, we estimate that in 2024/25 for every £1 that DWP spent on employment support for young people, around £25 was spent on benefits for young people.[footnote 509]
501. The UK’s approach for decades has been to pay the bill for a high structural level of youth inactivity, rather than invest in preventing it in the first place.
502. It is welcome that the government has recognised the need for increased support for young people and increased opportunities for them. Its £2.5 billion additional investment in a new Youth Guarantee and the Growth and Skills Levy over the next three years, introduces significant support primarily for unemployed young people and will unlock up to half a million opportunities to earn and learn over the next three years. It has also taken steps to address gaps in provision for disabled people and those with health conditions of working age, through an investment of £3.5 billion into Pathways to Work over this Parliament to guarantee an offer of personalised work, health and skills support.
503. These measures are necessary. However, this funding is spread over the parliament, the youth offer is focused overwhelmingly on unemployed rather than inactive young people, and Pathways to Work is not currently tailored specifically to young people. Benefit spend on young people for PIP alone is expected to rise to £6.5 billion by 2031/32. If spend on DWP employment support remains at the levels currently being funded through the Youth Guarantee, we estimate that by 2030/31, for every £1 that DWP spend on employment support for young people, around £10 will be spent on welfare support for young people.[footnote 510] This is not a spread of investment that prioritises participation. It is an investment choice that prioritises income transfers.
6.2 A failure to prioritise early intervention to prevent young people falling NEET
504. The welfare system has continuous contact with many of the children at highest risk of becoming NEET often from an early age. The majority of those who get Child DLA, for example, are awarded it by the age of 8.[footnote 511] Child benefit is paid from birth and, dependent on their income, households continue to receive it and the Universal Credit Child Element for young people aged 16 to 20 enrolled in approved full-time education. Aside from prompts for a parent to report a young person leaving approved full-time education there is no monitoring of attendance or contact with the young person. This is despite the fact that between 7% and 15% of young people across qualifications approved for reporting in age 16-19 performance measures do not complete the main learning aim of their study programmes.[footnote 512]
Prior to the age of 18, the welfare system’s only objective is to support with living costs and help the child’s household with additional costs, for example of disability. Contact is about determining eligibility for benefit support and unless a young person claims an out-of-work benefit, participation is not a topic of conversation despite the fact that:
505. Those who receive child DLA and have an EHCP in place will have a NEET rate of 50% when they reach 22 (versus 14% for children without Child DLA or SEN provision);[footnote 513] 68% of the 16 to 24 PIP caseload previously received Disability Living Allowance as children;[footnote 514] Over two thirds of the Child DLA claimants that move on to PIP will claim UC within six years of making a claim. Half of all Child DLA to PIP claimants will claim UC health.[footnote 515]
506. We might look at this and determine that the system is working to provide income and independence for young people who need it. Through the call for evidence and our engagement with Disabled People’s Organisations, charities and young people themselves it is clear that some disabled young people will never be able to work and face exceptionally high barriers to other forms of participation. The benefits system must always protect these groups. It is also overwhelmingly clear from this engagement and evidence that disabled young people want to participate and that many could with the right support, job, course or training. The benefit system must meet the needs of both those who may never work and those who desperately want to do so but currently are lacking a system designed to support participation.
507. By contrast, in Wales, Scotland and Northern Ireland, Education Maintenance Allowance of between £30-£40 per week provides further financial assistance to young people from low-income families who remain in education with payment based on regular attendance in school or college. The Education Maintenance Allowance provides one means of preventing young people from disengaging from education early but evidence of its impact is mixed. An IFS evaluation of the EMA in England, showed that whilst it did increase participation in full time education amongst lower income 16- to 19-year-olds, this mainly came from students who would have been studying or training part-time. The evaluation also showed that there was no impact on attainment and the policy may have slightly reduced earnings and employment in the longer term. [footnote 516]
508. Nonetheless, in general, the welfare system treats many of its interactions with young people as administrative, rather than as early opportunities to intervene to prevent young people falling out of participation or falling further into disengagement. Nor does the welfare system work in sync with other key public services to maximise the labour market chances of young people. The education system, for example, requires people with an EHCP in place to undergo a Year 9 review to start planning for the young person’s transition to adult life, covering employment, independent living and participation in society. This is positive, yet that review is not coordinated with the welfare system, which will in practice be the receiving institution for most NEET people in the transition to adulthood.
509. A welfare system that was designed to promote participation would prioritise early investment in order to prevent young people falling NEET, falling into long-term inactivity, and falling into expensive long-term benefit receipt. But this is not the welfare system we have today.
6.3 Insufficient practical help to enable young sick or disabled people into work
510. Chapter 1 shows that at the centre of the current NEET challenge is more young people falling into economic inactivity due to ill health. Yet it is precisely this group who have least access to support to participate from the welfare system and who have absolutely no requirement to engage in any conversation or work-related activity. Those who are assessed to have the greatest barriers to work are placed in the Limited Capability for Work Related Activity (LCWRA) group in Universal Credit and have no conditionality or work expectations. It is little surprise that only 1 in 100 young people in the LCWRA group move into a job each month. [footnote 517]
511. A key opportunity to engage young people before they become long-term inactive is when they have identified themselves as having a health condition and are waiting for a Work Capability Assessment. 48,000 young people are in this position currently, many waiting three months for an assessment.[footnote 518] Yet they receive the equivalent of only 1 to 2 minutes of work coach time a week. Reference H. In the vast majority of cases, all work-related requirements are also waived.
512. The Fit Notes received by young people awaiting a Work Capability Assessment, also fail to encourage participation at this stage in a young person’s health journey. They are currently the only required interaction between the welfare system and the NHS, typically used as the evidence for placing people in the health journey and reducing their conditionality requirements. 93% of fit notes reported individuals were not fit for work; very few identify the barriers that need removing to enable people to participate in the labour market or other opportunities to learn or train.[footnote 519]
513. The lack of support available is compounded by the increasing number of young people who are categorised as having Limited Capability for Work or Work-Related Activity. The Resolution Foundation found that the number of out-of-work young people who receive means-tested benefits and have no requirement to engage with employment support services has almost doubled from 160,000 in 2019 to 300,000 at the end of 2025 (Figure 27).[footnote 520]
Figure 27: Number of 18- to 24-year-old benefit recipients in different conditionality groups, GB, 2009/10 – 2025/26

Source: Resolution Foundation analysis of DWP StatXplore. Reproduced from Resolution Foundation, Lost in transition, published April 2026
Notes: Shows people on Universal Credit and recipients of Jobseekers Allowance, Employment and Support Allowance, Income Support, Incapacity Benefit and Severe Disablement Allowance. All Jobseeker’s Allowance recipients are shown in the ‘intensive work search’ group; in reality a small number may not have this requirement due to their specific circumstances.
514. Once Personal Independence Payment (PIP) is taken into account, less than half of spending for young people across disability, incapacity and unemployment support has any participation support or requirements attached to it. Over time that situation has become worse not better.
515. Of course, PIP was designed to focus on the extra living costs that stem from disability or long-term health conditions, rather than actively improve participation. It is assessed through a functional assessment which measures the impact of a long-term health condition or disability on an individual’s daily life. The functional assessment requires claimants to demonstrate they cannot undertake certain specified activities reliably, repeatedly and safely. If they receive sufficient points in the assessment, they will receive a cash payment intended to help with additional costs associated with not being able to complete these activities. It is not an assessment of their ability to work or the support they need to do so and payment of the benefit is unrelated to employment status.
516. The way PIP works means that the considerable and growing resources devoted to it are not targeted on helping improve the functional capacity of disabled young people, and thereby enhancing their labour market or wider participation prospects. There is no consistent provision of practical support with daily living, occupational therapy, vocational rehabilitation, mental health social work, specialised coaching, workplace assistance or links to the networks that would enable participation. And this despite the fact that many disabled claimants have needs and aspirations that the benefits system does not currently meet (for example, 69% were open to receiving contact from DWP about offers of support for employment, benefits or disability services).[footnote 521]
517. It is of course essential that the benefit system plays a role in supporting young disabled people to live independently – that is not in question in this review. Equally it is clear that independent living and labour market participation are not exclusive. The latter for many is a fundamental component of the former: creating networks, confidence, and income. For many others the ability to live independently – to travel for example – is crucial to their ability to participate in work.
518. PIP is the welfare system’s first point of contact with disabled young people from the age of 16 and for many it is the only point of contact before an out-of-work claim. But as PIP is not designed to consider participation outcomes, the participation status of claimants is not routinely captured, monitored or published. Analysis we have undertaken however, does not suggest that it is achieving good participation outcomes. Administrative data shows that PIP claims are getting longer in duration, with 87% of 16- to 24-year-olds in the 2019 cohort still on the benefit five years later, compared to 74% of the 2013 cohort.[footnote 522] Only 25% of young people in receipt of PIP at age 24 are in work.[footnote 523] The employment prospects of a young person claiming PIP get 21% worse over six years, whereas for everyone else they get 31% better.[footnote 524]
519. Between the ages of 16 and 18, most PIP claimants engage in some form of education (86%), while the proportion not in work or education/training is only 12%. From age 19, the NEET rate increases rapidly, reaching around two thirds by age 24. The data makes it clear that PIP does nothing to support this key point of transition from education to work.[footnote 525] At no point in a young person’s application or journey on PIP are they asked about, or supported to, work. This is not an accident of delivery. It is how PIP is designed.
520. It is a symbol of a wider failure on the part of the benefits system to provide practical help for sick and disabled youngsters into work. The consequence is that a disabled person who seeks support is offered a benefit assessment, not a conversation about their goals, their struggles, the support around them and the help they need. The system measures functioning. It does not plan for improving it. It asks what a young person cannot do. It does not ask what they could do, with the right support, or what they want to do. It measures what someone cannot do and writes a cheque. It does not ask what they could do and build a plan. The benefits system is founded on a deficit model of disability, one that pays for what a young person cannot do rather than investing in what they could become.
521. The government is taking action to address that deficit. Its Youth Guarantee and Pathways to Work are both welcome investments and actions. But they must go further. The Youth Guarantee amounts to an impressive support package for most unemployed young people, but it is yet to be tailored to those who are economically inactive due to a health condition. The Youth Jobs Grant is at the same level whether an individual has been unemployed for six months or inactive due to a health condition for two years. The Jobs Guarantee which provides subsidised work for those unemployed for 18 months, is only there for young people in the Intensive Work Search Group, not anyone on UC-health. And while the investment in Pathways to Work, personalised support for those who are sick and disabled, is an important step, young people require a programme specifically designed and tailored for their needs. Without further investment, it will likely under the current system reach only a small fraction – in the low tens of thousands – of the 290,000 young people who are out of work and on health and disability benefits.[footnote 526] There is a long way before young sick or disabled people are properly enabled into work.
6.4 How support is provided does not fit the needs of sick or disabled young people who are jobseeking
522. For the 380,000 young people in the Intensive Work Search conditionality group, more support is given.[footnote 527] Jobcentre Plus is delivering for many young people. 69% of under-25-year-olds on UC who were not working and had recently been supported by a work coach felt supported by their work coach to prepare for work or move into employment (compared to 54% for 25- to 49-year-olds).[footnote 528] The problem is that Jobcentre Plus work coaches carry high caseloads and work within a regime and setting that make genuine personalisation - especially required for disabled young people, those with health conditions, and those with additional needs – extremely difficult.
523. Jobcentre work coaches typically manage 100 unemployed claimants[footnote 529] and have an expectation that they see each person for ten minutes every week or fortnight. In that session they need to review activity, check compliance and set new activities for the following weeks. This does not give enough time to understand the specific barriers facing (say) a 20-year-old with autism and anxiety who has never worked, lives in a rural area with no transport and left college without completing a course.
524. The mainstream UC system is built around rapid movement into any available job. For an older worker between roles, that may be appropriate. It might not be for a young person with a health condition, low qualifications, no work history and limited confidence. Support to get onto an effective education track or a training pathway is secondary and not actively incentivised. As a result, many young people cycle between short-lived, low-quality jobs and repeat benefit claims without ever establishing a sustained footing in the labour market.
525. The Jobcentre Plus experience can itself be a barrier. Young people enter a security-guarded environment and encounter conditions and rules designed for a different population. The call for evidence found this consistently: the first interaction with the welfare system is experienced as confusing and procedural rather than supportive. Young people told this review that the experience felt like being in trouble rather than being helped. One described it as “walking into a place where they already think you’re not trying.”
526. The Youth Hubs model provides a different kind of environment: informal, co-located, staffed by people trained to work with young people, designed around encouragement rather than enforcement. The evidence shows it works better. The government is rightly rolling out this approach, but whilst expansion is taking place, coverage is currently patchy and the mainstream Jobcentre remains the default entry point.[footnote 530]
6.5 Incentives and processes make participation less attractive for many young people
527. All social security systems differentiate support and expectations according to people’s health and disabilities. Some young people will never be able to work, while others will only be able to work with substantial support. A welfare system in a civilised country must recognise those realities and provide support.
528. The main problem is how that additional support is structured in Universal Credit. It is designed in ways that can drive young people into passive inactivity rather than into them actively seeking work. For a young person with a health condition who is unemployed and potentially seeking work, taking a pathway to inactivity can offer higher income, less hassle and lower risk. This is a perverse incentive that is the polar opposite of what a participation-first welfare system should be providing.
529. Universal Credit operates a binary financial structure for young people with health conditions. A single young person with no dependents or housing costs assessed in a Work Capability Assessment as Fit to Work or since 2017, having Limited Capability to Work, received £316.98 per month in 2025/26. If that person received the Limited Capability for Work Related Activity element they would get £740.25: significantly more than double.[footnote 531] The financial incentives for the young person are clearly stacked in favour of choosing a path to inactivity, not participation.
530. The government has already begun to rebalance financial incentives. Starting in April 2026 it legislated to increase the Standard Allowance by above inflation to 2029/30, providing an estimated extra £662 per year in cash terms (around £255 above inflation) for individuals under 25 by 2029/30.
531. The LCWRA element has been reduced from £430 to £217 per month for most new claimants and will be frozen until 2029/30. This means that this year, a new, single, under-25 claimant with no housing costs or dependents will be £217 better off with the LCWRA element, a 64% increase above the standard allowance alone, compared to an increase of 134% for similar claimants in 2025/26.
532. This rebalancing makes the health journey significantly less financially attractive.
533. But incentives at entry are not just about differential rates. The sharp contrast in conditionality between the two regimes also plays a significant role. Young people found fit for work can be required to search for work full time, meet the terms of their claimant commitment and attend a face-to-face appointment once a week or fortnightly. If they miss this appointment, they can be sanctioned up to 100% of their benefit payment. By contrast, many young people on the health journey have no regular, personalised engagement.
534. The incentives claimants face at entry have an effect on young people’s participation rates. The OBR has concluded that the difference in conditionality between LCWRA and Intensive Work Search is likely to have been a driver of the increases in health benefit claims.[footnote 532] In principle, claimants can be placed in the Limited Capability for Work regime, which allows people with health conditions to be supported to prepare for work. This regime has some conditionality and allows claimants to keep some of their earnings before their benefits reduce. Initially this was alongside a smaller increase in financial support than those deemed LCWRA. In 2017, this financial support was removed making the system more binary and increasing the incentive for people to be counted as LCWRA. Now nearly 85% of young people on the Health Journey post-WCA are in the LCWRA group, where income is higher and all work-related requirements are suspended.[footnote 533] The system has turned into a binary choice between looking for work on very little money with heavy conditionality and not looking for work on more money with no requirements and no support.
535. Once in the UC health journey, the risks of taking on work often feel overwhelming to claimants. On paper, those on the UC health journey could be much better off in work as they retain the UC Health element and have a Work Allowance which means their benefits don’t reduce for the first £427/£710 they earn per month (dependent on housing costs). However, this is only the case if a claimant continues to count as having Limited Capability for Work (or Work-Related Activity). For many, believing that moving into work won’t mean they lose a benefit paid on the basis of their inability to work, is a stretch too far. Claimants often fear serious financial consequences if they get a job and it does not work out. Nearly half of health and disability claimants who were not in work and did not rule out work permanently were worried that they would not get their benefits back if they tried paid employment and it failed.[footnote 534] As one mental health organisation put it:
Many people with mental health problems tell us that one of the biggest barriers to even considering work is the fear that trying a job, even for a short period, could put their entire financial security at risk.
536. Figure 28 shows the different scenarios an individual currently receiving PIP and LCWRA needs to consider when looking for a work – including the fear that they will lose all state support. The probability of this is low, but the fear is not.
Figure 28: Scenario-based analysis of comparative earnings under different job search and employment outcomes for an individual on PIP and LCWRA benefits
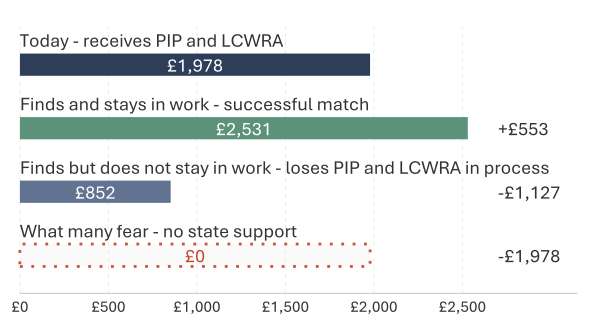
Source: Net income case study of young person with average rent. Young People and Work Interim Report: Analytical annex.
Note: In-work earnings calculations calculated based on 35 hours at national minimum wage. Includes average LHA rental costs and CTR relief based on Leicester City council’s scheme. Scenarios: ‘Today’ – Universal Credit Standard Rate, New Rate LCWRA, housing, maximum PIP and council tax reduction. ‘If the job works out’ – Earnings, maximum PIP, LCWRA is lost at next reassessment and Universal Credit tapered away. ‘If the job fails’ – standard Universal Credit and housing only, No PIP, no LCWRA. ‘What many fear’ – No state support.
537. Disability-related benefits like Personal Independence Payment and passported support can together represent a substantial and stable income package, particularly once housing support is included. Claimants’ total effective income can be in excess of £2,000 per month. These are significant sums to put at risk.
538. Once lost, it can be a difficult or impossible journey back to the original financial position. There is no guarantee a claimant will be awarded PIP or UC Health following new assessments if a full-time job does not stick. Once claimants weigh up the risks of being substantially worse off compared to not trying at all, it is understandable that so many feel they have no choice but to take the latter non-participation route. Over one-third - 37% - of all people claiming PIP but not UC Health, worry about losing their benefit if employment doesn’t work out.[footnote 535]
539. The features of this system also combine to make part-time work unattractive for claimants, because the financial signal for trying small amounts of work is weak at the point a claimant is deciding whether to engage. Figure 29 shows that a single 18–20-year-old claimant on the under-25 UC standard allowance who works 10 hours a week at the minimum wage would have total monthly income of £551 under ordinary UC rules. By contrast, a new claimant receiving the lower UC health element would receive almost the same amount (about £556 a month) without working or having any requirements to actively take steps towards work. That does not mean work never pays: if a claimant keeps the health element while working, they will be materially better off. But claimant uncertainty about what their financial position will be if they try work makes part-time work less attractive.
Figure 29: Comparison of income from 10 hours of part time work for a 20-year-old compared to health and disability related benefits - 2026/27
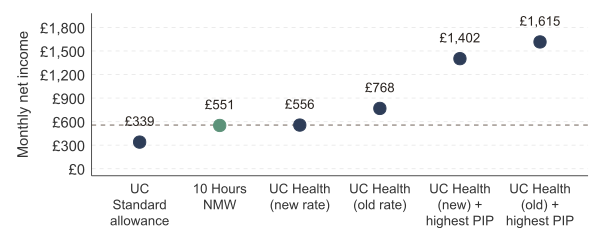
Source: Net income case studies by earning and benefit receipt. Young People and Work Interim Report: Analytical Annex.
Note: Earnings for 10 hours at National Minimum Wage (“NMW”) exclusive of any health entitlement
540. This matters, because part-time work is often the first, confidence-building step that young people need to transition into full time work. While the system permits part time work, it does not provide effective encouragement of it. For a young person who has never worked, who has spent months at home, who is managing anxiety that makes leaving the house difficult, the idea of moving straight from inactivity to a full-time job is terrifying. What they need is an intermediate step. A few hours volunteering. A supported work taster. A part-time role with gradual escalation. A placement where failure does not mean financial catastrophe. The system does not promote this. For young people with fluctuating conditions, the absence of strong support for intermediate measures is particularly destructive. They need a system that accommodates variation, that allows them to build up gradually, that treats a setback as a normal part of recovery.
541. The government has made a positive step through the Right to Try regulations, which provide that paid or voluntary work will not, in and of itself, trigger a reassessment. But this is not a full guarantee that a claimant’s wider position cannot be revisited if other evidence suggests a relevant change in circumstances.
542. Nor does it address the system’s fundamental design flaws. The current system requires young people to demonstrate they cannot function or work, in order to access the highest levels of financial support, rather than starting from trying to help them participate. And for a young person unemployed and with a health condition, once on the benefits, the path to employment comes with higher risk and, in some circumstances, lower income. In the long run, for the average claimant, it is true that they will be better off in full-time work. But the risks posed by getting there are often sufficient to deter all but the most determined.
6.6 Assessment processes are locking in permanence on benefits
543. The welfare system for young people today is dominated by those with mental health and neurodevelopmental conditions. The vast majority - 8 in 10 - young people on UC health now report having a neurodevelopmental or mental health condition when they undertake a Work Capability Assessment.[footnote 536]
544. Today, nearly half of PIP claims among young people are for Autism and ADHD, compared to less than one in ten for all PIP claimants (Figure 30).. The numbers have been rising steeply over recent years. The combined share of anxiety or depression, autism and ADHD reported as the primary condition for 16 to 24-year-olds claiming PIP has risen from 49% in January 2020 to 64% by January 2026 (Figure 31).[footnote 537]
Figure 30: Primary health condition for PIP claimants in January 2026
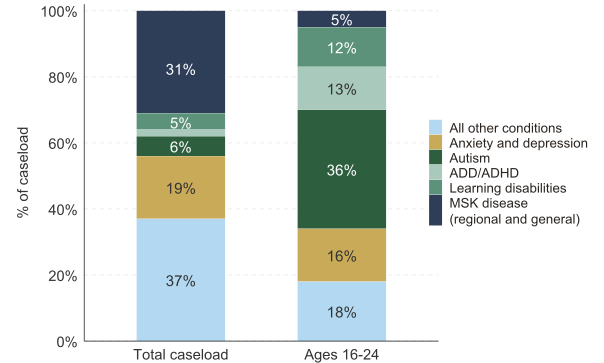
Source: DWP, PIP cases with entitlement, Stat-Xplore
Note: Data labels for values less than 2% have been suppressed
Figure 31: Primary health condition for PIP claimants aged 16-24, January 2016 – January 2026

Source: DWP, PIP cases with entitlement, Stat-Xplore
Note: Data labels for values less than 2% have been suppressed
545. These conditions often fluctuate. Research has consistently shown that even severe mental illness is not always a lifelong or even chronic condition. Many people with severe mental illness have a reduction of both symptoms and associated secondary impairments over time, with a range of interventions, including supported employment, being effective in supporting recovery.[footnote 538] A young person with anxiety or depression may be unable to attend an interview on Tuesday and be capable of working on Thursday. ADHD does not present the same way every day. Autistic young people can thrive in the right environment and collapse in the wrong one. We heard compelling evidence from Amazon, for example, about the success of its programmes employing young people with autism. And as the Fonagy interim report indicates, a diagnosis of a neurodevelopmental condition or anxiety and depression should not automatically trigger a verdict that a young person is unable to work.[footnote 539] These are not conditions that lend themselves to a binary judgement of able to, or not able to, undertake certain activities. But this is the only decision that the benefit system’s current rules takes.
546. The Work Capability Assessment effectively treats current incapacity as static in a way that does not match the reality of many young people’s fluctuating or changing conditions. The system considers the severity of a health condition or disability as it presents today, rather than the potential to improve and expand functioning. That locks in young people to greater permanence on benefits even when the majority of them have conditions that can and do change.
547. Worse still, processes to reassess claimants’ conditions have been progressively weakened since the pandemic. Reassessment was meant to be the mechanism for keeping pace with people whose functioning had changed and ensure prognoses were taken into account. Historically, reassessment was one of the main routes off the Health Journey. Pre-pandemic, it accounted for around a third of all off-flows.[footnote 540] Reassessments were paused during Covid-19 and have not been restored to anywhere near their previous level. Today, outstanding WCA reassessments stand at nearly 2 million.[footnote 541] The implication of a 2 million backlog is that a large number of people whose conditions may have improved are not being asked about it, and those who are worsening are not getting additional support.
548. Face-to-face assessment, which produces different and generally tighter outcomes than remote assessment,[footnote 542] fell sharply over the same period and has only recently begun to recover. This is not merely an administrative change. It is a weakening of the system’s ability to understand the young people it is supposed to serve and to enable them into work. It is welcome that the government has announced plans to increase face-to-face assessments and to eat into the reassessment backlog. But in truth the damage is done. The weakening of the assessment framework has contributed to more young people being stuck inside the benefits system for longer, with lower levels of support and fewer expectations about getting into work.
549. The numbers tell the story. Since the Work Capability Assessment was first introduced in ESA (the legacy incapacity benefit that preceded the UC health journey) the rate of initial WCAs resulting in an award has risen from 39% in May 2010 to 73% in May 2019, and has remained high ever since.[footnote 543] The composition has shifted too: the share of incapacity benefit claims placed in the Support Group/LCWRA group for initial assessments, where there are no work-related requirements at all, has gone from 22% in May 2010 to 66% today.[footnote 544] The original policy intent was to use the LCW group as an intermediate category, with limited conditionality and active support to prepare for work. In practice, the system bypasses LCW. The vast majority of health claims now move into the no-expectations, no-requirements and no-engagement group.
550. For young people the consequences are now visible in the duration data. Off-flow rates have fallen cohort by cohort and have plateaued across all cohorts at the point reassessments were paused and Covid-era rules relaxed. Figure 32 shows how 7 in 10 young people claiming a health and disability benefit are still claiming a decade later. Over only 10 years (2010 to 2020) the proportion of young people leaving disability benefits within five years dropped by 40%.[footnote 545] Similar patterns are observed for those claiming PIP (Figure 33).
551. The system has become stickier, and stickiness compounds: every additional year a young person spends on the caseload reduces the probability they ever leave it.
Figure 32: Percentage of claimants remaining on incapacity benefits over time, by cohort year first claimed

Source: Duration on health and disability benefits. Young People and Work Interim Report: Analytical Annex
Figure 33: Percentage of claimants remaining on PIP over time, by cohort year first claimed

Source: Duration on health and disability benefits. Young People and Work Interim Report: Analytical Annex
6.7 Participation outcomes for young people are deteriorating
552. These six fault lines in the welfare system compound to deliver poor participation outcomes for young people. Significantly, participation outcomes are actually worsening.
553. Movement into work collapses for those on the UC Health Journey. For young people who are in the LCWRA group, only 1 in 100 move into work each month, compared to around 1 in 10 for those in the intensive work search group.[footnote 546]
554. While young people overall see a steady increase in the employment rate as they age, move out of education and gain experience, young people on health and disability benefits do not. At 24, only a quarter of people in receipt of PIP are in work. For young people continuously receiving PIP the employment rate falls as they age, leading to the gap between them and their peers to double (Figure 34).
Figure 34: Employment rate over time of everyone aged 18-24 and those awarded PIP for the full period 2018 – 2024
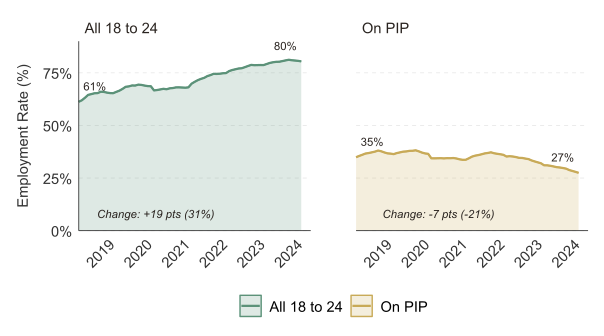
Source: Evidence on Long-Term Outcomes for Health and Disability Benefit Claimants. Young People and Work Interim Report: Analytical Annex
555. This disengagement from participation continues long term. Of those first claiming a health and disability benefit aged 16 to 24, whether PIP or UC health, 48% are not in work or education 15 years later. Five years after first claim the figure is 53%. Ten years after, 51% (Figure 35). The participation curve plateaus.[footnote 547]
Figure 35: Percentage of young people on health and disability benefits who are not in education and training 15 years after their first claim
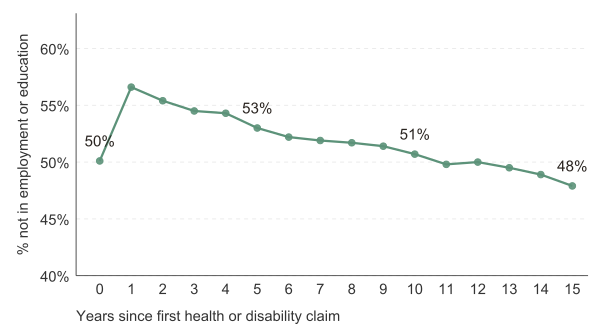
Source: Evidence on Long-Term Outcomes for Health and Disability Benefit Claimants. Young People and Work Interim Report: Analytical Annex
556. Successive cohorts of young people are doing worse than their predecessors. Among 16 to 24-year-olds first claiming a health or disability benefit in 2010, 46% were out of work or education five years later. For those who first claimed in 2019, the figure is 62% (Figure 36). Figure 33 shows that PIP persistence is lengthening on the same timetable: 74% of the 2013 cohort were still on the caseload after five years; 87% of the 2019 cohort were. Incapacity persistence has done the same: 68% of the 2014 cohort were still claiming after five years; 84% of the 2020 cohort were. A young person first claiming health and disability benefits in 2019 is 34% more likely to be NEET after five years than those first claiming in 2010. [footnote 548]
Figure 36: Percentage of young people NEET 5 years after their first health or disability benefit claim
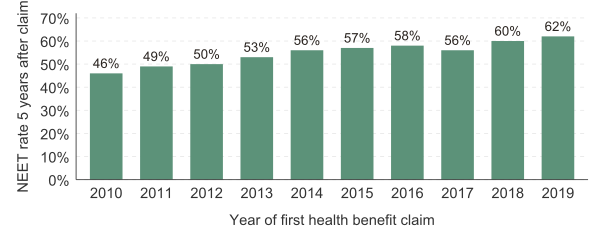
Source: Evidence on Long-Term Outcomes for Health and Disability Benefit Claimants. Young People and Work Interim Report: Analytical Annex
557. Three different measures are all moving in the same direction within five years. Each successive cohort stays longer on benefits, each is less likely to move into work and receives less support. This is a catastrophic systems failure that scars the life chances of thousands of young people.
6.8 The financial costs
558. The personal cost is paid by the individual young person. As we outline in Chapter 8, the long-term scarring effect of being NEET and stuck economically inactive in the benefits system is corrosive of life chances.
559. There are also growing consequences for the public finances. The scale of health and disability benefit receipt among young people has increased significantly over recent years. From August 2012 to August 2025, the number receiving incapacity benefits, ESA or UC health, has increased from around 120,000 to approximately 250,000. The overall spend on UC for young people on the health journey has almost doubled from £1.3 billion to £2.1 billion between 2019/20 and 2024/25. [footnote 549]
560. The number of 16 to 24-year-olds receiving DLA or PIP has risen from around 200,000 in 2012 to over 400,000 today. By 2031/32 we expect 700,000 young people to be receiving it. In ten years’ time 820,000: 11% of all young people in the UK. [footnote 550] This means that without intervention, a further 310,000 young people are expected to be on PIP in 10 years. Staggeringly the number of young people claiming PIP is expected to quadruple over just a quarter of a century from 2012 to 2037.[footnote 551]
561. The increase in disability prevalence in society is slower than the growth in disability benefit receipt amongst children. Disability prevalence for children has risen from 8% in 2018/19 to 12% in 2024/25.[footnote 552] But since the start of 2019, Child DLA claims have nearly doubled, from 450,000 in February 2019 to 860,000 in August 2025. [footnote 553] The impact of this increase in child disability benefits is also seen well beyond a young person turning 16, as the proportion moving through the benefits system from Child DLA as a child to PIP as an adult is rising. Around 8 in 10 Child DLA claimants who apply for PIP are successful[footnote 554]. The pipeline of people moving into the non-participation part of the benefits system is growing.
562. The overall caseload of PIP claimants is expected to rise to 5.4 million by 2030/31.[footnote 555] The IFS report that the growth in overall health-related benefit spend is likely to lead the UK moving from being one of the lowest spenders on health benefits in the OECD in 2019 as a proportion of GDP, to one of the highest spenders by 2028.[footnote 556]
563. Annual PIP expenditure for 16 to 24-year-olds rose from approximately £1.3 billion in 2019/20 to around £3.2 billion in 2024/25. In five years’ time we estimate that Personal Independence Payments, on the current trajectory, will have further doubled in cost to £6.5 billion and cover 700,000 young people.[footnote 557] For an investment of this scale in the lives of nearly three quarters of a million young people, the government might reasonably expect that those resources could help to deliver improved participation as well as independence outcomes. But they are not.
6.9 Conclusion
564. This chapter review tells a story of system failure. The state spends approximately £8 billion a year on PIP and Universal Credit for young people. For that investment, claimants are getting worse outcomes with every passing year.
565. Young people are not the same as older workers. The system has treated them as though they are. It is not just that the health conditions that young people face are markedly different from the health conditions that older people face. Their needs are different too. An older worker who develops a disability in mid-career has decades of experience behind them. Established habits, routines, professional identity, financial reserves and networks. Their relationship with the labour market is disrupted but not absent. Income replacement during a period of ill health is appropriate and proportionate. The system was designed for this person. A young person at 19 has none of that. No work history. No professional identity. No savings, no networks, no experience of managing in a workplace. They are not returning to something. They are trying to reach something for the first time. The critical need is support to make the first transition into work. Yet the system makes no such distinction.
566. The state must continue to provide a financial safety net and help people, particularly those with disabilities, who may have extra costs or never be able to work. But for young people, that cannot be where the role of the welfare system ends. It must also give those who can participate a real chance to do so. Whilst this government is taking positive steps with the new Youth Guarantee and Pathways to Work, the system remains too focused on what a young person cannot do, and too weak at helping them move towards what they may yet be able to do. It measures, and in some cases encourages, incapacity but does too little to support capability.
567. If the welfare system continues in this form, the result will be much the same as it is now: too many young people spending too long out of work or learning, poorer prospects over time, and a rising benefit bill because the state is paying for failure late rather than preventing it earlier. If current trends persist, we expect one in twenty of today’s five-year-olds will be on incapacity benefit at 22 – more than one child in every class.[footnote 558] For a generation of young people whose adult lives are being shaped by this system, that is not good enough. It must change.
568. Welfare reform on its own will not solve the crisis in youth participation. But nor will reforms in schools, skills, health and work succeed if the welfare system continues to pull in the opposite direction. These reforms need to reinforce each other. A welfare system that supports participation must be part of that wider shift if the Welfare State is to become a Working State.
Chapter 7: the architecture – a system in name, not in design
569. There is no system in Britain that takes young people from education into work as adults. There are institutions, programmes and many good intentions. But there is no actual system.
570. Britain does not lack organisations with a role in supporting young people. It lacks a coherent participation system designed to ensure they make a supported and sustained transition into adulthood. Understandably, responsibility is dispersed across many organisations. But shared accountability is missing. Incentives are misaligned. Support ends at arbitrary boundaries rather than following a young person’s needs. As a result, hundreds of thousands of young people receive inconsistent or no support.
571. This chapter sets out how that architecture fails. The argument follows a specific sequence, and each failure reinforces the next. Too many institutions have partial responsibility, but there are no shared outcomes. National and local delivery are confused and are becoming more complex. There is next to no focus on destinations. Funding has been cut and what remains rewards numbers, not progression. Services do not integrate and data does not flow. Local performance varies wildly and there is a stark post-18 cliff edge in tracking and support.
572. Together these failures help explain why, despite sustained effort over more than two decades, Britain has been unable to drive NEET rates down durably. No amount of reform to individual policy areas or institutions alone will fix this. The architecture itself is the problem.
7.1 Too many cooks
573. The architecture in England that supports young people who are NEET or at risk of becoming NEET involves a bewildering number of institutions. There is no common mechanism to guarantee a smooth and successful transition for young people from education to employment.
574. In this crowded space, there are schools, colleges, local authorities, strategic authorities, Jobcentre Plus, DWP, integrated care boards, Child and Adolescent Mental Health Services (CAMHS), GPs, Skills England, the Careers and Enterprise Company, youth services, voluntary organisations, Youth Hubs, housing providers, Special Educational Needs and Disabilities (SEND) teams and more. The Local Government Association has identified over 50 different national programmes led by 17 different public bodies holding some responsibility for tackling economic inactivity.[footnote 559] In one town, Barnsley, that spaghetti soup comprised over 70 local organisations doing the same.[footnote 560]
575. Different institutions have different remits. It is inevitable that no single one can hold the ring on everything from early years to benefit payments. The problem is that each part of the system operates within its own funding stream and accountability framework. When a young person begins to struggle, they do not encounter a coordinated response. They encounter separate systems operating in sequence, each with partial visibility and limited responsibility for what happens next. A school may identify the risk but not carry responsibility beyond exit. A college may record withdrawal but not own re-engagement. A GP may recognise deterioration but not trigger the education and employment response. A Jobcentre may only become involved if a benefit claim is made. Each institution performs part of a function. Fragmentation does not produce a cohesive response.
576. East Midlands County Combined Authority told this review that ‘many young people experience the system not as a coherent journey, but as disconnected interventions that stop and start at arbitrary thresholds.’ Careers England said that ‘one of the national challenges in NEET prevention and reduction is the lack of coordination, there is no national framework, and multiple stakeholders have responsibility for different parts of the provision.’ Ealing Council told us that ‘the current system is fragmented and failing.’
577. What passes for coordination is mostly parallel play. Institutions work alongside each other. They do not work together. There is no unifying goal. There are many objectives that might overlap but are not collectively pursued. And critically, there is no accountability for the outcome as a whole. No authority to direct resources and efforts differently. Education is accountable for attainment. Welfare for benefit flows. Health for treatment. Nobody for the pathway from childhood to working life.
578. The pattern is clearest in crisis. When youth unemployment spikes, the state responds with emergency programmes at scale. The New Deal for Young People was set up in 1998 to tackle the legacy of the 1990s recession; the Young Person’s Guarantee in 2009 after the financial crisis; Kickstart in 2020 following the Covid-19 pandemic. All have since been abolished. The Netherlands’ youth guarantee architecture has been permanent since 2014. When the crisis passes in Britain, the programmes are withdrawn. The institutional architecture that would sustain the response is never built. The country treats youth disengagement as a series of emergencies requiring temporary responses, when the evidence shows it is a permanent structural condition requiring permanent infrastructure.
7.2 National framework and local delivery: confused and becoming more complex
579. The relationship between national policy and local delivery is unclear and becoming less clear.
580. In truth there is no discernible national policy framework for dealing with the crisis in youth participation. Different Whitehall departments pursue their own strategies and develop their own plans. It is welcome of course that the DfE is focusing more on tackling educational inequality, that the Department for Work and Pensions is rolling out an enhanced Youth Guarantee, that the Department for Culture, Media and Sport has developed a youth strategy and that the Department for Health and Social Care is testing new approaches for how the NHS can tackle economic inactivity. But there is little, if anything, that joins the dots. It does not feel like this has been a top priority for government and nor is there a mission-based approach to dealing with the problem. This review provides an opportunity to put that right.
581. As I have described in Chapter 5, the NHS is a case in point. It does not see itself as part of the participation system and yet it has a core role in dealing with the NEET crisis. It commissions its own services, sets its own priorities, measures its own activity and reports to its own regulators. It does not routinely ask whether a young person is in education or work. It does not share data with schools, colleges or Jobcentres as a matter of course. It does not treat participation as a clinical outcome. Three pioneer integrated care boards (Health and Growth Accelerators) are beginning to test accountability for work status. For the vast majority of the country, however, the health system remains a parallel universe: aware of the participation challenge in theory, structurally disconnected from it in practice.
582. Geographic misalignment compounds the problem. A young person in a single town may fall under one of 36 NHS integrated care boards, a different one of 19 combined or strategic authorities, one of 317 local authorities for housing and social care, and one of 37 Jobcentre districts for welfare and employment support. Despite four overlapping maps, there is no single institution seeing the whole picture for that young person.
583. Mayors may have powers over adult skills, transport and economic development. They do not have powers over schools, welfare design, the benefits system or NHS commissioning boundaries. Adult skills funding sits separately from age 16 to 19 funding. Local authorities retain duties but frequently lack both the fiscal headroom and the authority over key institutions to drive a whole-system response.
584. Local devolution has added actors without resolving the core problem of ownership. There is a strong case for local leadership to address the NEET crisis. Labour markets are local. Transport is local. Employer relationships are local. The barriers young people face are strongly shaped by place. But devolution has created partial responsibility without full control. Strategic authorities are bodies that have huge potential to enact change – and many have demonstrated this already. But – as new bodies - many also face severe capacity constraints and have limited delivery experience. They do not cover the whole country. Programmes delivered at the hyper-local level can also have huge impact, such as those delivered through Sure Start centres and family hubs. For areas outside strategic authority boundaries, the question of who owns the local response remains unanswered.
585. Local government reorganisation is adding further uncertainty at the worst possible time. Boundary changes, the merger of district and county councils into new unitary authorities, and the redistribution of functions are happening simultaneously. For a system that already struggles with continuity, reorganisation is a further source of instability.
586. There is an unresolved constitutional question about who is responsible for what and where decision-making best rests between the local and the national. In the absence of clarity, confusion reigns.
7.3 No focus on outcomes and destinations
587. The system has never organised itself around the outcome that matters: sustained participation in education, training or work. It is organised by age, not by sustained outcome. That is the design flaw from which much else follows.
588. Since 2015 there has been a legal requirement for young people in England to continue in education or training until 18. Local authorities have duties to track participation for those aged 16 to 17 and to maintain systems to identify those not participating. Whatever its limitations, that framework creates clarity about who should act if a young person disengages. Nearly nine in ten of those aged 16 to 17 were in education and training at the end of 2024.[footnote 561] The 16 to 18 NEET rate has remained below 5% since 2012.[footnote 562]
589. But that coherence is abruptly time-limited. Beyond 18, there is no universal statutory duty on any institution to track, support and re-engage young adults simply because they are no longer participating. The system holds young people in while it owns the duty. It cannot carry them through once that duty falls away. In the Netherlands, by contrast, when it comes to students aged 18 to 23 who do not have a basic qualification, schools are legally required to report unauthorised absences of four consecutive weeks of teaching or practical time to the municipality within five days.[footnote 563]
590. Furthermore, the statutory requirements to track young people are applied inconsistently across England. Variation in funding, staffing, commissioning models, and local prioritisation has resulted in uneven data quality (often reflected in high numbers of young people reported with a status of ‘not known’), follow‑up, and outcomes between local authorities.
591. The incentive structure reinforces the problem. A school focuses on GCSE results, not on where the student ends up. It is recognised, regulated and rewarded for doing so. The same is true of a college. It focuses on recruitment, retention and completion within the funding window. The money it attracts is dependent on student numbers, retention and completion within that window, rather than sustained outcomes beyond it. Jobcentre Plus administers claims and seeks to move those in the main work search regime into work. Health services manage appointments, thresholds and clinical risk. The NHS performance management system and the way finance flows through the system accentuates activity but not outcomes.
592. The welfare system compounds this. It was designed to replace lost income for adults who had been in work or for those who were unable to work. It is now the primary point of contact for young people who have never worked or who are moving into the labour market for the first time. It has not been redesigned for that purpose. It provides income. It does not build pathways. It measures incapacity. It does not plan for capability.
593. There is no pooled cross-system funding stream dedicated to preventing disengagement from age 18 to 24. There is no performance framework that holds any institution accountable for sustained participation outcomes across the whole age range. The current architecture is funded, measured and managed by programme and age band, not by end-to-end outcome.
594. This produces rational behaviour within institutions that is collectively irrational. Many councils, schools and colleges do a great deal to support post-age 18 destinations, despite significant funding pressures and system incoherence. But their overriding incentive is to ensure that young people are doing something, anything, until their 18th birthday, rather than in the longer term beyond it. Not a single part of the architecture - in health, education or welfare - is incentivised to prioritise good labour market participation outcomes for young people.
7.4 Funding has been cut and prevention has been deprioritised
595. For much of the last 15 years, funding that could have helped prevent many young people becoming NEET has been cut. What remains rewards activity, not progression.
596. There is no specific funding stream for local authorities to discharge their participation duties. They must fund provision from their own central budgets or bid for pots from central government. Participation is therefore one of many competing calls on often-stretched local authority budgets and one of the reasons why the quality of local NEET services varies enormously across England.
597. The Local Government Association told this review as part of their evidence submission that reductions to council budgets led to wider youth services expenditure falling by 73% in England between 2010 to 2011 and 2023 to 2024. Many youth clubs providing free after-school activities and access to youth workers have been closed. There were 34% fewer full-time equivalent youth workers in England in 2023 to 2024 than in 2012 to 2013.[footnote 564] Analysis by the Institute for Fiscal Studies found a third of London’s youth centres closed between 2010 and 2019, and children from lower socio-economic backgrounds who lost access to a nearby centre performed nearly 12% worse in exams at age 16.[footnote 565] These services are not peripheral extras. They provide the relational infrastructure that helps prevent disengagement from becoming entrenched.
598. The impact is visible at local level. Kent County Council told this review that in 2018 to 2019, their last major round of ESF funding, they had 42 training providers offering 1,451 places across the county. They now have 16 providers offering 720 places. That is not just a statistic. It is a lived reality in which an entire county’s provision has halved. Warwickshire County Council told the review that ‘there is a critical issue, the need for dedicated funding streams for 16- to 18-year-olds who do not qualify for 19-plus provision. Without this, local authorities will struggle to meet their statutory duty to ensure participation.’
599. The funding that does exist is overwhelmingly short-term and programme-based. European Social Fund investment in employment, skills and social inclusion amounted to around £3 billion over the 2014 to 2020 period.[footnote 566] Its successor, the UK Shared Prosperity Fund (UKSPF), which had a wider scope and ran for a shorter period, resulted in an average annual spend into people and skills of around £200 million across all age groups between 2022 and 2025 (total spend for 2022 to 2025 is £602m, with the final year of UKSPF spend yet to be finalised).[footnote 567] That funding ended in April 2026. Local partners across the country described short-term funding to the review as kryptonite for local systems. It prevents long-term planning. It destroys trusted relationships. Prevention has been cut at every level: early years, public health, youth services, further education. What has grown is crisis spending: late intervention, hospital care, income replacement. The system spends more to achieve less, often paying for the consequences of problems it chose not to prevent.
7.5 No integrated services and no shared data
600. I repeatedly heard and saw in the evidence I drew upon that, currently, services for young people do not integrate. Helpful data does not readily flow. That is the direct consequence of a system with no shared outcomes and funding that rewards activity over progression.
601. Current arrangements cannot therefore do the three things that matter most: see risk early, coordinate support coherently, and learn what works reliably.
602. Large volumes of information about young people are already held across education providers, local authorities, DWP, health services and other parts of the state. The problem is that these fragments do not add up to a coherent picture. Narrow data-sharing gateways exist for 16 to 18 participation duties but are tightly restricted to basic identifiers. Wider welfare-related gateways exist but are constrained, purpose-limited and shaped by the possibility of criminal sanction for unauthorised disclosure. Even where sharing may be possible in principle, organisations default to caution because the boundaries feel narrow, risky and difficult to navigate.
603. There are examples of good practice we can build on, including Skills Development Scotland’s 16+ Participation Portal,[footnote 568] and the government’s work with local partners in the Sheffield Community Mission Challenge.[footnote 569] But these are currently exceptions in the wider UK context.
604. The consequences are cumulative. The framework does not allow risk to be seen early because visibility is fragmented and collapses after 18. It cannot tailor support because no single agency holds a sufficiently complete picture. The burden falls on the individual to repeat the same story to multiple services. For a young person with anxiety, low confidence and limited experience of institutions, that burden is itself a barrier. What works is not consistently learned or applied because outcomes are not clearly defined or linked to interventions.
605. There is a further gap in the architecture that is rarely discussed. 84% of the variation in GCSE attainment in 2018 was explained by individual factors or factors outside the school gates: including demographic factors (for example eligibility for free school meals) parental background, parent-child relationships and the home learning environment.[footnote 570] Yet the system is designed entirely around institutions. It does not systematically connect with families. Where families are struggling, services alone rarely succeed. Where services are weak, families are left to cope alone. A system that treats the young person as an isolated unit moving between institutions, without engaging with the family context or wider individual factors that shape 84% of the outcome, has a structural blind spot at its centre.
7.6 Wild variations in local performance
606. Without integrated services, shared data or outcome-based accountability, local performance varies wildly. The quality of support a young person receives depends not on what they need but on where they live. We want systems capable of responding to local community need. What we have is a system where local variation reflects capacity, not intention or design.
607. Even where duties exist, they are weakly monitored and enforced. The proportion of those aged 16 to 17 who are NEET or ‘not known’ ranges from 1% in Barnet to 21.5% in Dudley.[footnote 571] Local labour market conditions vary. The ability of local authorities to enforce the mandatory participation age should not.
608. The same variation is visible across every dimension. CAMHS median waiting times range from over 100 days in some integrated care boards to six days in others.[footnote 572] In 2021 to 2022, the Children’s Commissioner found that spending on children and young people’s mental health per head varied from £34 to £141 between areas.[footnote 573] Post-16 destination rates vary sharply by local authority. Youth service funding per head differs by an order of magnitude. This is not localised underperformance. It is systemic. The variation maps onto the geography of deprivation, local authority capacity and the strength of local leadership.
609. Local flexibility matters. But to be most effective it must operate within a national framework that guarantees a minimum standard. Without that framework, devolution becomes delegation of failure. The post-18 cliff edge: over 300,000 young people aged 18 to 24 lost in England alone.
610. The cumulative effect of these failures is felt most acutely at the post-18 cliff edge.
611. Perhaps the clearest sign that Britain does not have a functioning participation system is the scale of the hidden cohort. In 2023 to 2024, around 314,000 of those aged 18 to 24 NEET in England were not claiming benefits. As shown in Figure 37, this accounts for nearly half of NEET people in this age group.[footnote 574] This is the group who are hardest to reach and for whom we have little data. They are also the group growing fastest.[footnote 575] They are not on any caseload. No institution is responsible for them. No service is reaching them. A system serious about preventing disengagement would know who its disengaged young people are, where they are, how long they have been outside learning and work, and which institution is responsible for supporting them. The current architecture cannot do any of that.
Figure 37: NEET young people by benefit claimant status, England, aged 18 to 24, from 2023 to 2024
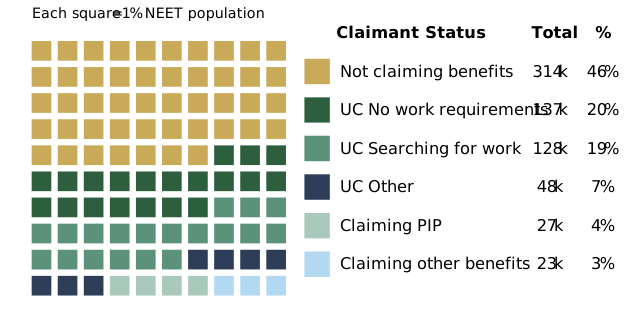
Source: RAPID, Longitudinal Education Outcomes, Labour Force Survey. Hidden NEET in England: Young People and Work Interim Report: Analytical Annex
612. It would be wrong to suggest that the government is unaware of these problems. The Youth Guarantee, Pathways to Work, Youth Trailblazers, and accelerated expansion of Youth Hubs all represent serious attempts to address the structural gaps this chapter describes. Young Futures Hubs are another intervention aiming to bring together services to better coordinate support for young people.
613. The Youth Guarantee Trailblazers are testing locally-led approaches. West of England is targeting NEET young people with SEND and those in rural areas, including practical solutions like electric bike loans for transport-poor communities. Central London Forward is joining up services for care leavers, embedding referral pathways across leaving care teams, Jobcentre Plus and new employment support teams so that young people can find their key systems of support in a single location.
614. As previously noted, the Ten Year Health Plan sets expectations for ICBs to establish measurable outcomes on economic inactivity and unemployment.
615. These are the right instincts. They demonstrate that when the system is given permission to join up, it can. But they are partial responses, not system redesign. The Youth Guarantee Trailblazers cover a small number of areas. Pathways to Work is not permanent architecture. The pioneer ICBs are three out of 36. For the vast majority of the country, the health system has not set expectations about participation as a desirable outcome of clinical care. The question is whether these approaches will be sustained, scaled and embedded, or whether they will follow the pattern this review has documented across two decades: build, evaluate, defund, forget.
Northern Ireland – Labour Market Partnerships
The Department for Communities’ Labour Market Partnerships provide local solutions to meet local labour market needs. The aim of the Labour Market Partnerships is to help improve employability outcomes and labour market conditions locally by working through coordinated, collaborative, multi-agency partnerships. This includes working with employers, such as Hendersons which has been delivering HGV training academies alongside the Labour Market Partnerships. This approach helps to achieve regional objectives whilst being flexible to meet the needs presented by localised conditions and helping to connect employers with employees.
Since inception in 2021, delivery has taken place across over 400 projects, with approximately 10,000 participants completing programmes. Of those, over 50% have progressed into employment, self-employment or increased earnings, and approximately 60% have achieved a qualification - demonstrating both employment and skills outcomes
7.8 Why the architecture matters
616. In every part of the country I visited, I heard the same thing from different people. From employers, voluntary organisations, local government leaders, health bodies.
617. Britain has too many institutions with partial responsibility, and too few with end-to-end accountability. The system is strongest where participation is compulsory, weakest where transition becomes voluntary, and least effective when young people’s needs cut across institutional boundaries.
618. A system that loses clear responsibility at 18, tracks only part of the cohort, supports only a minority of those outside learning and work, and funds local capacity through fragmented and time-limited streams is not simply underperforming. It is helping temporary risk to calcify into long-term exclusion.
619. For young people with strong qualifications, stable health, family support and access to opportunity, the fragmentation can often be absorbed. For those with poor mental health, SEND, low attainment, caring responsibilities, or for those who live in areas with weak local labour markets, it cannot. For them, the architecture is not a neutral backdrop, but represents a risk factor in its own right.
620. The absence of employer voice from the accountability framework is itself a structural gap. 93% of employers do not engage with DWP recruitment activities.[footnote 576] No mechanism requires employers to co-invest in the transition from education to work. The countries with the lowest NEET rates actively enlist employers to be co-responsible for that transition. Britain treats them as passive recipients of whatever the education system produces.
621. In practice risk is identified early. It widens the gap by 11. It loses track at 18. It certifies incapacity at 20. It administers detachment at 22. And at 24, it counts the result and calls it a statistic. When everyone has a role but no-one is responsible, accountability for the pathway from childhood to working life is an orphan.
622. The conclusion is unavoidable. Britain has institutions for young people, but it does not yet have a coherent participation system. There is no coherent system, limited accountability, and no clear governance philosophy. What is required is not another short-term scheme layered on top of fragmentation but structural reform around sustained participation through the whole transition from school to working life.
Chapter 8: the consequences - lost lives, lost output and rising fiscal risk
623. The preceding chapters have set out the drivers of youth disengagement. This chapter sets out its consequences.
624. Those consequences are not confined to the young people immediately affected, serious though those are. They extend to families, employers, communities, public services and the taxpayer. They are personal, economic and fiscal; immediate, long-term and cumulative. What begins as a failure to support a young person at a critical stage of life can become a lasting loss of earnings, weaker growth, higher public spending and greater pressure on the next generation. This is not a temporary or self-correcting problem. As the number of young people who are NEET rises and the drivers of disengagement become more entrenched, so too do the costs. The question is no longer simply how many young people are being left behind, but what that failure is costing the country.
8.1 Where we are heading
625. There is a view, presented as worldly pragmatism, that current NEET rates are unremarkable and will inevitably recede. The UK has long had relatively high rates of youth unemployment and persistent economic inactivity. But that logic is flawed.
626. In earlier decades, a much larger share of youth inactivity was accounted for by young women looking after their children. That number has fallen significantly in England, from over 240,000 people in the early 2000s to less than 100,000 in recent years.[footnote 577] This should strike a note of optimism that participation patterns can change when policy and wider social conditions expand women’s choices and make returning to work or education more feasible after motherhood. Today, the picture is different. Ill health and disability have become much more central to youth detachment, affecting young people of both sexes. We have no comparably clear path to change.
627. We cannot be precise in forecasting how the number of 16- to 24-year-olds out of work will evolve in the face of demographic, macroeconomic, and societal trends and the way in which these interact. What we do know is that the prevalence of most of the key NEET risk factors has increased since around 2017/18, when today’s 24-year-olds were 16.
628. The number of young people with a disability, mental health issues, and school suspensions and exclusions have all grown by more than 75% without clarity on where they will stabilise. Because the youth population has grown in recent years, the number of 16-year-olds not achieving Level 2 qualifications at Key Stage 4 – the single largest contributor to NEET risk – has risen despite percentage improvements in GCSE attainment.[footnote 578] Persistent and severe absence in state-funded secondary schools in England has more than doubled since 2018 from 445,000 pupil enrolments to more than 912,000 in 2025.[footnote 579]
629. Concerningly, where improvements have been made in areas such as early parenthood, these are generally in factors impacting a comparatively small proportion of the population.
630. This is compounded for future years by ongoing growth in the population, or “demographic bulge” of young people. There were an estimated 846,000 16-year-olds in the UK in 2024, an increase of 135,000 since 2018, and more than 600,000 additional teenagers aged 11 to 16 (5.1 million total in 2024).[footnote 580] Critically, the young people who should now be entering the labour market are the Covid-19 generation.
631. Of course, as set out in Chapter 1, there are many individual and contextual determinants whether someone becomes NEET, and for how long. But taking the cumulative impact of the growth in risk factors indicates that up to 500,000 more young people are at risk of becoming NEET in the next five years if prevalence stabilises at its observed level, rising to 800,000 more if it continues to grow at its current rate. Not all of these young people will become NEET at once, but this will manifest in a persistently higher annual NEET rate.
632. This does not take account of the deteriorating macroeconomic and labour market context that young people are facing, described in Chapter 3.
633. So what does all of this add up to? Even if the NEET rate fell to the historical lows of 10% by 2031 this would mean 780,000 young people NEET. In actual fact the proportion of NEET young people has been steadily rising since the pandemic. Forecasting conducted for this report suggests the NEET rate will remain unacceptably high and will exceed one million within the next two to three years. That is a conservative estimate as it is based on the current trend line, which does not take account of likely deteriorations in young people’s health, rises in other NEET risk factors and further labour market changes. Accounting for the risk factor increase described above, the NEET rate could increase to over 16% or more than 1.25 million young people not fully participating in society within five years.
Table 1: Scenarios for NEET rates, 2031
| Scenario | Description | Rate in 2031 | Number in 2031 |
|---|---|---|---|
| Macroeconomic trends | The baseline rate based on historical trends and macroeconomic forecasts, adjusted for the demographic bulge of young people entering the labour market. | 12.9% | 1,010,000 |
| Stabilising risk trends | The prevalence of risk factors stabilises at its current observed level, and translates into more young people becoming economically inactive or long-term unemployed. | 14.9% | 1,160,000 |
| Increasing risk trends | Risk prevalence continues to grow, and this translates into more young people becoming economically inactive or long-term unemployed. | 16.3% | 1,270,000 |
Source: Young People and Work Interim Report: Analytical Annex
Note: The “increasing risk trends” estimate corresponds to the 500,000 – 800,000 estimate provided. This represents the total number of young people who could ever become NEET, which is larger than the number who are NEET at any given point of time due to in-flows and off-flows.
634. In every scenario, the number of young people NEET is unacceptable. On virtually every indicator the trend lines are deteriorating. They are not short-term pressures that will fade on their own but the consequences of a deeper and worsening problem. Rising NEET levels matter not only because they reflect growing disengagement, but because each young person shut out of work or education represents a loss to themselves, a strain on their family, and a growing cost to the wider economy and state.
8.2 Lives on hold: the cost of early detachment
635. Behind every number in this chapter is a young person whose life is being diminished. The first and most important consequences are borne by young people themselves. When early adulthood is dominated by inactivity, repeated rejection or poorly managed health conditions, the damage is wide-reaching.
636. The most direct consequence is on an individual’s income: in the absence of steady work, young people rely on family networks, benefits and informal work. At a time when young people are spending more on essentials than ever before, this has real consequences. Recent research by Trussell has found a 59% increase in the number of food parcels provided to 17- to 24-year-olds between 2019/2020 and 2024/2025, and a 62% increase for 12- to 16-year-olds.[footnote 581] The debt charity StepChange found that the most common reason for debt among its customers aged 18 to 24 was unemployment and work-related instability, cited by one in five compared to one in seven across its entire customer base.[footnote 582] In some cases, costs themselves become a barrier to employment, particularly transport.
637. This also has an impact on families and parents. The proportion of young people living at home today is much higher than in the past. Analysis of the most recent Millennium Cohort Study found seven in ten of the 23 year-old respondents lived at home with their parents, with the most common reason provided being that they could not afford to move out.[footnote 583] As well as potential financial strain, research has found that this can be emotionally difficult for parents, with worse impacts when unemployed and low-income children return home.[footnote 584] This compounds inequality, given both the socioeconomic factors associated with NEET status and that being NEET increases the likelihood of not being able to afford to live independently. The consequences of both being out of work and the lower associated income can further impact wellbeing, physical health and mental health. These are good examples of the two-way relationship between disadvantage and disengagement. Some young people become NEET because they are already struggling with their health or wellbeing. But prolonged time out of work or education can also make those problems worse, through isolation, insecurity, repeated setbacks and lack of routine or support. Using subjective wellbeing responses to the Annual Population Survey and the HMT Wellbeing Guidance for Appraisal allows for monetisation of this impact, at approximately £2,900 per young person per year.[footnote 585]
Scarring: the damage that does not heal
638. Research has shown that the experience of being NEET is associated with poor physical and mental health outcomes, and prescriptions for anxiety and depression are 50% higher in the 10 to 20 years following their period out of education or training.[footnote 586] This work also found cumulative effects over time, with even greater disadvantage for those who remained NEET for longer.
639. Studies have shown that labour market scarring, spells of unemployment or inactivity early in life, reduces lifetime earnings and increases the likelihood of future worklessness. De Fraja, Lemos and Rockey (2021) calculate that each month of unemployment at age 18 to 20 leads to a permanent income loss of 1.2% per month unemployed, with a reduced impact of 0.35% if the unemployment occurs at age 21 to 23.[footnote 587] No significant impact is found for unemployment at older ages. Gregg and Tominey (2005) find that unemployment at age 23 leads to earning scars of 8 to 10% at age 42, with higher rates of 12 to 15% for those who had repeat incidences.[footnote 588]
640. These studies allow us to estimate the working lifetime earnings impact of a period spent NEET, up to age 68, when the young people of today will be eligible for their state pension. This is the difference between what an individual could have earned if they had never experienced a period out of work or education in their youth, against the expected scarring impact on their employment outcomes.
641. Table 2 presents estimates of the impact over a working lifetime of time spent NEET as an 18- to 24-year-old. The ceiling estimate refers to those young people who are out of work for the entire six year period, but subsequently enter employment. Close to half of all NEET young people have been out of work or education for more than a year.[footnote 589] While the number of young people who are NEET for five or more years are a minority, it is not an insignificant one: 28% of 24 year-old NEET people have been out of full-time education since they were 18, have not had a paid job in at least five years, or have never had a paid job.[footnote 590] 45% have never had a paid job.[footnote 591] For these young people, inactivity is not a brief interruption between education and work. It is the beginning of prolonged detachment that often extends beyond their 25th birthday with postponed independence, and without the experience of work that is essential for building prospects, long-term financial security, and resilience.
Table 2: Individual working lifetime earnings lost due to a period NEET between 18 and 24
| Estimate | Average lifetime earnings loss (net) |
|---|---|
| Per year NEET | £52,000 |
| Ceiling estimate (NEET aged 18-24) | £293,000 |
Source: Young People and Work Interim Report: Analytical Annex
Note: Ceiling estimates should not be interpreted as annual figures. Earnings are presented as net of income taxes, national insurance and benefits. Full detail of calculations set out in the technical annex.
642. It is not possible to fully capture the complexities of a life, but these figures give an indication of the vast personal cost of inaction.
8.3 The direct economic cost: output foregone
643. When large numbers of young people are unable to build skills, earn, and enter stable work, those lost opportunities add up to lost output at a national level. What begins as individual detachment becomes, at scale, a drag on growth, productivity and living standards.
The immediate economic consequence of failing to support young people into employment can be expressed in straightforward terms: if every currently NEET 18- to 24-year-old had been in full-time work in the last year, this would have contributed an additional £38 billion to UK Gross Domestic Product.
644. When the annual scarring impact is aggregated across those young NEET people most likely to experience scarring impacts – who have been NEET 6 months or more, the total loss rises to over £100 billion. That is very close to the entire size of the UK arts and hospitality sectors combined.[footnote 592] The scarring estimates represent a permanently lower level of GDP, potential lost not only for the individual but also the wider economy.
Table 3: Total output potential lost due to 18- 24-year-olds NEET.
| Estimate | Total economic impact. Reference I. |
|---|---|
| Estimated direct impact on output | £38 billion |
| Estimated scarring impact on output | £63 billion |
Source: Young People and Work Interim Report: Analytical Annex
Note: Scarring estimate aggregated across proportion of population most likely to experience scarring penalty (NEET for 6+ months). Scarring impact presented as Net Present Value.
645. Reduced economic growth limits our country’s ability to improve living standards over time through wages and employment opportunities. It undermines business confidence, which reduces investment and the potential for innovation. At a more local level, there is a negative feedback loop: fewer young people in work means that they have less income to spend on local businesses, whether that be retailers, hospitality, or the gym. Communities need their young people to thrive. Every year the system fails to act, the bill grows.
8.4 Fiscal exposure: a cost dispersed across the state
646. The true fiscal cost of youth disengagement is easy to miss because it does not sit with just one part of government. It is spread across benefits, lower tax receipts, health spending, housing support, local services and, in some cases, the justice system. That matters because no single department sees the full picture, and no single department is forced to carry the full consequences of failure. But the costs are real nonetheless, and they accumulate across the state.
647. In practice, this fiscal exposure works through three main channels: tax revenue foregone, direct benefit spending and wider public service costs linked to poorer health, insecurity and prolonged worklessness. In what follows we seek to estimate the true cost to the public purse of the NEET phenomenon.
Lost tax revenues
648. The most direct and universal fiscal consequence is foregone tax revenue. While the 314,000 “hidden” young people NEET do not pose a direct cost to the state because they do not claim benefits, their disengagement nevertheless has a fiscal consequence. Across all NEET young people, the annual lost output implies a substantial level of tax revenue foregone: £3.2 billion in income tax receipts and national insurance contributions in the current year, without considering employer contributions or wider consumption-linked taxes. When young people face lower employment and earnings due to the scarring impact, this has knock-on implications for the state.
Table 4: Foregone tax revenue (income tax and national insurance contributions) from 18- to 24-year-olds NEET.
| Estimate | Per person | Total revenue foregone |
|---|---|---|
| Estimated direct foregone revenue | £3,800 | £3.2 billion |
| Estimated scarring foregone revenue | £15,000 | £10.8 billion |
Source: Young People and Work Interim Report: Analytical Annex
Note: Scarring estimate aggregated across proportion of population most likely to experience scarring penalty (NEET for 6+ months). Scarring impact presented as Net Present Value.
649. As the UK faces challenges in the long-term due to factors such as an ageing population and the fiscal consequences, permanently lower employment and earnings rates put even greater pressure on the old-age dependency ratio needed to maintain growing state pension, healthcare and welfare costs.
Benefit spend
650. When benefit spending is included, the numbers become higher still. Low participation is a double-edged sword: not only does it lower tax receipts, it also increases benefit spending. Of the estimated £8.1 billion spent on young people across key benefits, approximately £4.4 billion goes to NEET young people. Some of these benefits, such as PIP, are independent of employment or education status, but we estimate that a total of £3.2 billion could have been avoided if NEET young people had been in work and earning above earnings thresholds. These numbers are concerning in their own right, but as discussed in Chapter 6, the story of the limited support that underpins them is even more alarming.
651. Despite the substantial number of young people not claiming benefits, long-term scarring impacts will increase the long-term cost to the Exchequer for each additional month a young person is out of work.
Health and broader public spending costs
652. Reduced tax revenues and higher benefit payments only tell part of the story. Health and social impacts are more difficult to track and quantify, but no less real.
653. The Centre for Mental Health has estimated that the government cost of all ill-health in England is £25 billion across NHS community and hospital health services, tax revenue, GP expenditure, social services, and medication. [footnote 593] To indicate scale, that is equivalent to more than £850 million a year for the 60% of young NEET people with a likely mental health condition. [footnote 594] The bi-directional relationship between unemployment or economic inactivity and mental health means that the public cost is not simply the cost of poor mental health among young people who happen to be NEET – unemployment has been shown to negatively impact mental health outcomes.[footnote 595] For some people, being NEET itself is likely to intensify need and increase the demand placed on services.
654. In 2023 the Office for Budget Responsibility estimated that there was £910 additional per-person cost to the NHS when people with a health condition are economically inactive compared to if they had been active.[footnote 596] In 2025 prices that is a cost of approximately £200 million across the 200,000 young people inactive due to sickness, and an increase of approximately £67 million from before the pandemic when there were 70,000 fewer out of work for this reason.
655. For individuals already at the greatest disadvantage, the intersection of financial challenges with family, personal and health circumstances can deteriorate outcomes even further. Centrepoint estimates over 120,000 young people were homeless or at risk of homelessness in the UK in 2025, a 6% increase on the previous year.[footnote 597] Although some young people experiencing homelessness will be employed or in education, the instability of worklessness is a significant risk. In 2023 Centrepoint estimated that the government cost of youth homelessness was £2.5 billion across criminal justice, homelessness services, social security, and various health services, as part of a wider cost of £8.5 billion in economic and social terms.[footnote 598] These are not peripheral costs. They show how youth disengagement increases demand across multiple services at once, raising pressures on homelessness support, the justice system, social security and health.
656. The link between young people NEET and crime is complex. Research has found that young people living in high-crime areas are more likely to be NEET,[footnote 599] and that NEET young people are more than twice as likely to engage in criminal behaviour compared to those who are not NEET.[footnote 600] A recent report by Policy Exchange estimates that crime costs the UK £170 billion a year.[footnote 601] Whether cause or consequence, it is clear that the sum of getting young people engaged in society, whether through employment or education, is greater than the sum of its parts.
657. The figures in Table 5 present the average lifetime public finance impacts of each young person NEET. These figures include foregone income tax and national insurance contributions due to lower earnings, and additional benefit spend when individuals are out of work. The challenge of untangling the relationships between early disadvantage, NEET status, and the wider social challenges this can bring about means that it is difficult to establish a robust estimate that fairly represents the majority of young people. These costs have been conservatively excluded from the costs set out below.
Table 5: Lifetime public finance impact of a period NEET 18-24
| Estimate | Average lifetime cost to the state. Reference J |
|---|---|
| Per year NEET | £29,000 |
| Ceiling estimate (NEET aged 18-24) | £240,000 |
Source: Young People and Work Interim Report: Analytical Annex
Note: Ceiling estimates should not be interpreted as annual impacts. Figures include income tax and national insurance contributions foregone, and additional benefit spend.
658. The ceiling estimate assumes that the state will support individuals through Universal Credit, and with housing costs, when they are out of work. For many, the costs may be higher still.
Where government chooses to spend money
The Keep Britain Working Review found that a young person who never works will forego over a £1 million in earnings over their lifetime. Supporting someone on the current Universal Credit Standard Allowance and housing levels alone would cost the government close to £500,000 over the same time period, and potentially much more if factors such as incapacity factored in. Reference K.
Late intervention
There is evidence that as a country we have chosen to spend more money on paying for the costs of young people becoming NEET than of preventing that from happening in the first place. Figure 38 shows which priorities have been chosen – in this case by Local Authorities, where net expenditure on late intervention services has increased by nearly £4 billion in real terms since 2014/2015, while early intervention has fallen.
In the last 15 years, support has become thinner, less coherent and less well-funded. Many of the institutions that act as protective factors for young people have faced cuts. Work by the YMCA has found that local authority spending on youth services has real-terms fallen by 76% since 2010/11.[footnote 602] This pattern begins to play out at the earliest stage and across the different settings in a young person’s life.
Figure 38: Early versus late intervention service spending by local government, 2015/16 – 2024/25.
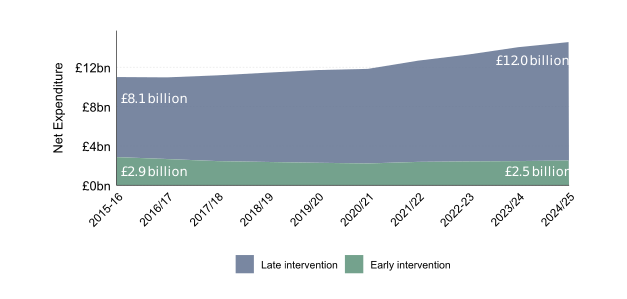
Source: Department for Education LA and School Expenditure, Young People and Work Analysis. Methodology adopted from Pro Bono Economics and NSPCC Children’s services spending report series.[footnote 603] Early intervention spending is defined as ‘Sure Start children’s centres and other spending on children under five’, ‘Total Family support services’ and ‘Total Services for young people’. Late intervention funding is defined as ‘Youth justice’, ‘Total Children looked after’ and ‘Total Safeguarding Children and Young People’s Services.
Spending on children and young people has shifted over time, with protective factors such as family support services and youth services declining. Youth justice and spend on children looked after has only increased. The limited focus on prevention flows down into education and employment outcomes. Crisis spending – on late intervention, health costs, and income replacement – increases.
The funding cliff
The pattern of public spending shows a sharp drop-off in support at the point many young people need it most. While young people remain in school, college or university, the state is willing to invest substantial amounts in them, even if that amount has decreased over time.[footnote 604] But once they fall out of education without a secure route into work, support becomes far thinner and less coherent.
Table 6: Estimated spend per individual across different life stages, England, 2024/2025
| Stage | Spend | Unit | Age |
|---|---|---|---|
| Early years | £5,500 | Per child | 0 – 5 |
| Primary school | £7,000 | Per pupil | 4 – 11 |
| Secondary school | £7,800 | Per pupil | 11 – 16 |
| Further education | £7,900 | Per student | 16 – 18 |
| Higher education | £9,900 | Per student | 18 - 24 |
| Employment programmes and JCP | £2,000 | Per participant | 18 -24 |
| Out-of-work benefits | £5,000 | Per claimant | 18 - 24 |
Source: Annual report on education spending in England 2025-26, Institute for Fiscal Studies. Young People and Work Interim Report: Analytical Annex
At precisely the point where tailored employment support could make the biggest difference, the system too often defaults to minimal intervention and, later, income replacement through the benefits system.
Early intervention does pay off for young people
Why is support so limited? The decision to prioritise income replacement over active labour market support can seem rational for older groups and in a constrained fiscal environment. The key concerns for the Exchequer about active labour market programmes are the concepts of deadweight loss and displacement. It will rightly want to avoid in as far as possible spending money on those who would have found a job without state support, or of someone backed with State support taking a job opportunity that could have gone to someone else. These criteria are how the Exchequer goes about making value for money assessments of employment programmes. When those criteria are applied, the conclusion it often reaches is that the fiscal benefit of the spend is only just expected to cover the State’s costs.
But the equation has to be different for young people. Although the likelihood that they will return to the workplace without intervention may be higher, young people also carry significant consequences for time out of the workplace not seen in older age groups. Conventional value for money assessments consider the “average” person, and do not look over a long enough timeframe to fully capture lifetime cost. When the scarring impact of time out of employment among young people is taken into account the fiscal argument – and arithmetic - fundamentally shifts. When it comes to young people, early intervention pays for itself many times over.
The consequences
659. The scale of youth inactivity is not simply a social concern. It is an economic one, a fiscal one and a generational one.
660. Each year that a large share of young adults remain outside learning or work, the economy forgoes tens of billions of pounds in output. Each year of delayed participation compounds the long-term earnings penalty and increases the likelihood of future dependency. Benefit caseloads grow, and expenditure rises. Health costs accumulate. The tax base narrows. This is not a neutral steady state. It is a ratchet.
Table 7: Summary costs of young people NEET
| Category | Element | Total annual cost |
|---|---|---|
| Economic | Direct economic potential lost | £38 billion |
| Economic | Scarring economic potential lost | £63 billion |
| Public finance | Direct tax revenue lost | £3.2 billion |
| Public finance | Increased health spending | £0.2 billion |
| Public finance | Direct benefit spend on out-of-work benefits | £3.2 billion |
| Public finance | Scarring tax revenue and benefit spend | £15 billion |
| Social | Direct wellbeing impacts | £2.7 billion |
| Total | - | £125 billion |
Source: Young People and Work Interim Report: Analytical Annex
Note: Yearly scarring estimate used, with impact only included for proportion of young people who have been NEET 6 months or more. Note: elements such as tax revenue and benefit spend are considered transfers and will net out at the societal level.
661. Table 7 above estimates the cumulative cost to our country of almost 1 million NEET young people at £125 billion a year. This is more than we spend on education every year in England. [footnote 605] The question is no longer whether the current position is affordable. It is whether it is sustainable.
662. Ultimately, of course, the case for change is neither a purely economic or financial argument. There is an ethical duty to enable every young person to have the opportunity to fulfil their potential, regardless of their socioeconomic background or health status. But we also cannot ignore the implications on the economy or our public finances in the context of an ever-stretched state. It is rare to find a policy area where change could improve people’s lives, strengthen public finances, and foster economic growth. Getting young people back into work or education has the potential to achieve all three.
Chapter 9: the fork in the road
663. Across this review, the evidence has been examined from every angle: the scale of youth inactivity, who is affected, how the NEET population has changed, how young people feel about their lives, where risk accumulates, what the labour market no longer provides, what faultiness exists in the system that is supposed to ease young people from the world of education into the world of work, what all of this costs and where current trends lead if nothing changes.
664. There is a lot of data. Much analysis. Many words. But it all boils down to this core conclusion. We have a deeply entrenched problem that is getting worse and a system that has been trying but failing to deal with it. Fundamental and far-reaching reform is needed. The country has reached a point where inaction or iterative tinkering is itself a decision, and a costly one.
665. Britain is no longer facing a marginal youth employment problem. It is confronting a systemic failure at the point where a generation is supposed to transition into adulthood. This is not a temporary shock. It is not a post-pandemic hangover. It is not a question of motivation or culture. It is a structural breakdown with profound consequences for economic performance, fiscal sustainability and social cohesion.
9.1 This is not a record of passivity. It is a record of failure
666. Britain has not ignored youth unemployment. For more than two decades, governments have intervened repeatedly and at scale. New Deal for Young People. The Future Jobs Fund. The Work Programme. The Youth Contract. Traineeships. Kickstart. The Youth Offer. This is not a record of passivity. It is a record of sustained policy effort. Sadly it is also a record of failure.
667. Despite these interventions, the structural 16-24 NEET rate has not been durably reduced. It has barely fallen below 10% in 25 years.[footnote 606] The composition of the cohort has shifted towards economic inactivity.[footnote 607] Our NEET rate has deteriorated in comparison with other nations and is now above average for high-income countries.[footnote 608] That should trouble anyone who believes the current approach is working.
668. The question is therefore not whether programmes have had some impact. Many have made a difference. The question is whether they have altered the fundamental fault lines that produce sustained disengagement. The evidence suggests they have not.
669. Here, we must be honest: there are significant gaps in the evidence base about interventions that might work, particularly for the cohort that now dominates - young people with mental health conditions and neurodevelopmental needs.
670. One thing is for certain. New approaches are needed. This cannot be tagging on to the existing system a few new initiatives.
671. Public policy in the UK traditionally operates in cycles. A new intervention responds to rising unemployment or political urgency. It is funded for a defined period. It generates credible impact. Funding ends. Institutional memory dissipates. Responsibility returns to fragmented departments. The capacity is lost. Young people pay the price. It is, as one expert adviser to this review put it, completely mad that once a decade the state goes about building from scratch a new programme, with all the associated fixed costs of set up, capacity building, employer engagement, and data and accountability, only to let it expire and start again.
672. The structural nature of the NEET challenge today calls for something more profound. It is a system reset that is needed.
673. Our final report, which will be published later this year, will set out what this needs to look like.
674. The cost of failing to act is not abstract. As set out in Chapter 8, failure to address high NEET rates is costing us £125 billion a year. PIP expenditure for 16-to 24-year-olds has risen from £1.3 billion to £3.3 billion in 5 years. The gateway, once entered, becomes a one-way valve. The system is growing. Its purpose is not changing. It pays for the problem. It does not solve it.
675. The pipeline of risk is not shrinking. It is growing. Almost a quarter of children aged 11 to 16 had a probable mental health disorder in 2023, up from almost one in seven in 2017.[footnote 609] In 2024/25, nearly one in five pupils were persistently absent.[footnote 610] Almost one in seven receive special educational needs support.[footnote 611] Almost one in six children aged 10 to 14 are classified as disabled, up from one in ten in 2019/20.[footnote 612] Learning difficulties and autism are growing significantly faster than mental health conditions as the primary health conditions among NEET young people.[footnote 613]
676. This review does not argue that the answers are easy, or that reform will be painless. It argues something more basic. Continuing as we are is no longer a neutral option.
677. Every year, the bill grows. Every year, the gap between what this country needs and what it does gets wider.
678. What is no longer credible is to do nothing and hope that economic growth alone will solve the problem. Growth will not absorb young people who have never worked, whose health prevents participation, whose anxiety levels are higher and whose career ladders have become harder to ascend.
679. Nearly one million young people are outside education and work. They are not a statistic. They are the sons and daughters of this country. Some were identified as at risk before they could read. The system knew. It watched. It documented. It published reports. It commissioned evaluations. It launched pilots. It let the funding expire. And it moved on.
680. Those young people did not move on. They are still here. Still waiting. Still paying the price for a country that has chosen, repeatedly and with full knowledge of the consequences, to administer the problem rather than solve it. This review says: enough. Not another programme. Not another pilot. A system. Built around participation. Accountable for outcomes. Permanent in its architecture. With new ladders of opportunity. Funded at a level that treats young people as an investment, not a cost. Resilient to the problems of tomorrow, in a labour market which is likely at the beginning of yet another transformation. And worthy of the generation it is supposed to serve. A new mindset is needed. Our country can choose differently. One that prioritises the next generation. This review demands that it does.
Annex – the benefits landscape
681. There are a number of benefits that are available to young people.
682. Universal Credit (UC) is a means-tested benefit payment which provides help for people with their living costs based on an assessment of their needs. For most, eligibility begins at age 18 and the under-25 Standard Allowance is £338.58 per month for a single person and £528.34 for a couple. Additional allowances are available for children, housing, caring and incapacity.
683. Universal Credit is designed to be an in and out-of-work benefit. It applies a single taper rate on earnings, reducing payments by 55 pence for every pound earned. Households with a work-limiting health condition or a dependent child qualify for a work allowance, where the taper rate does not apply. This allowance is £427 per month when claiming housing costs or £710 per month otherwise. Currently, there are 784,000 claimants aged 16-24 of whom 606,000 are not in employment.[footnote 614]
684. Universal Credit Health is a journey within Universal Credit for people with a work-limiting health condition. Following a Work Capability Assessment (WCA), people are found either fit for work, to have Limited Capability for Work (LCW) or Limited Capability for Work and Work Related Activity (LCWRA). The LCW group are not required to be available for work or actively seek work but can be asked to undertake work preparation activity, though they receive no additional payment. The LCWRA group receives an additional payment and have no work-related requirements. Both groups receive a Work Allowance which means they can earn up to a certain amount before benefit payments start being reduced. The UC Health payment is £217.26 per month, or £50 per week, for new claims from April 2026 on top of the Standard Allowance, or £429.80 per month, or £98.80 per week, for claims before that date. There are currently 257,000 claimants aged 16 to 24 on the UC health journey: 48,000 waiting for a WCA, 34,000 in the LCW group and 175,000 in the LCWRA group.[footnote 615]
685. Personal Independence Payment is a tax-free, non-means-tested benefit designed to help with extra living costs for people aged 16 to State Pension age in England and Wales who have a long-term physical or mental health condition or disability. It is assessed through a functional assessment which measures the impact of a long-term health condition or disability on an individual’s daily life. It is not an assessment of their ability to work and payment of the benefit is unrelated to employment status. There are two separate elements, mobility and daily living, both of which have a higher and lower rate. Daily living is paid at a standard rate of £76.70 per week or an enhanced rate of £114.60 per week. Mobility is paid at a standard rate of £30.30 per week or an enhanced rate of £80 per week. There is no associated conditionality. There are currently 430,000 claimants aged 16 to 24 in England and Wales.[footnote 616] Just over a third of PIP recipients are NEET.[footnote 617] Disabled people in Scotland can claim the devolved Adult Disability Payment.
686. Before the age of 16, disabled children are supported through payments to their parents. This includes child benefit, paid at a rate of £27.05 per week for the first child and £17.90 for each subsequent child. Child Benefit is a universally available payment but is recovered through a tax charge from people with a taxable annual income of more than £60,000, with people earning £80,000 having the payment fully recovered. Alongside Child Benefit, means-tested support for low-income families is available for children through Universal Credit, paid at a rate of £303.94 per month per child, with additional payments for disabled children. Disabled children in England and Wales can also receive Child Disability Living Allowance (Child DLA). This is a non-means-tested payment, consisting of a mobility and daily living amount like PIP, and its total value can range between £30.30 and £194.60 a week. Assessment is based on whether the child needs substantially more care, supervision or mobility support than their peers. Children living in Scotland can claim the devolved Child Disability Payment. For young people aged 16 to 19 in non-advanced full-time education, financial support continues to be paid to the parent through Universal Credit and Child Benefit. 16- and 17-year-olds cannot, in most circumstances, claim Universal Credit in their own right even if in work. In contrast, disability support moves to PIP and is paid direct to the young person at 16, with the claimant undergoing a reassessment.
The employment support landscape
687. The other arm of the welfare system, sitting alongside benefit payments, is employment support. Young people are supported through various DWP programmes to find employment. 210,000 workless young people are in the Intensive Work Search group of Universal Credit and not waiting for a Work Capability Assessment. Reference L. Claimants are required to be available for work, to actively seek work, to undertake activities that will help them get into work, and to attend regular face to face meetings with a work coach. This is often also matched with high levels of support: from Jobcentre Plus youth work coaches, from the Restart scheme (which supports around 50,000 young people in the IWS group), and through access to training and work experience programmes including Sector Based Work Academies.
688. The government has announced enhanced support for young people looking for work. Through its new Youth Guarantee it is funding 360 youth hubs that will join up Jobcentre Plus support with wider local services, put in place a new ‘gateway’ with guaranteed support options after 13 weeks of unemployment, introduce a £3,000 ‘job grant’ for employers hiring someone who has been unemployed for six months, and fund new guaranteed jobs for those unemployed for at least 18 months.
689. For young people on the Health Journey, which means that they are either waiting for a Work Capability Assessment, or have been assessed as having limited capabilities for work and/ or work-related activity, the system has little or no requirements and historically has matched this with little or no support. Specifically, in the most recent data (December 2025):
690. 48,000 young people were waiting for a Work Capability Assessment. On average they are allocated the equivalent of 1-2 minutes of work coach time a week, compared with weekly and fortnightly meetings for others in the IWS group. In the vast majority of cases, all work-related requirements are also waived.
691. 34,000 young people had been assessed as having Limited Capability for Work. They receive the same one to two minutes of work coach time a week on average as the assessment group, and can be required to undertake work-related activities but not to actively seek work or be available for work. Around one in 40 move into work each month.
692. 175,000 young people had been assessed as having Limited Capability for Work and Work Related Activity. For this group there are no regular meetings with work coaches at all and no expectations or requirements for activity or engagement. For this group, around one in 100 move into work each month.[footnote 618]
693. Access to Work provides funding for practical workplace adjustments, specialist equipment and support for disabled people in employment. It is demand-led, depends on the individual knowing it exists, and requires a job or job offer before support is triggered. In 2024/25 only 7,400 people aged 16 to 24 received a payment through the scheme.[footnote 619]
694. The government has also taken steps to enhance specialist support for disabled people and those with health conditions of all ages, in particular through its Pathways to Work offer. This has included the rollout of:
695. Connect to Work – a local employment programme which in time will provide support to 100,000 people a year;
696. 1,000 new Pathways to Work advisers in Jobcentres, primarily supporting those in the LCWRA group (and already engaging over 65,000 people); and
697. WorkWell, bringing together health and employment services locally to provide health-led early help to support people to enter or return to work.
References
Reference A: young people with a wide range of lived experiences are informing the Review through a dedicated sub-group of the Youth Guarantee Advisory Panel. Members were recruited by our partners, Youth Futures Foundation (YFF), who helped to run the sessions alongside colleagues in DfE. This feedback draws on two online sessions with the panel, held on 25 February and 25 March 2026. Return to place.
Reference B: qualitative research with NEET 16 to 24 year olds not currently claiming health or disability benefits. See accompanying analytical annex. Full research report to follow publication. Return to place.
Reference C: young people with a wide range of lived experiences are informing the Review through a dedicated sub-group of the Youth Guarantee Advisory Panel. Members were recruited by our partners, Youth Futures Foundation (YFF), who helped to run the sessions alongside colleagues in DfE. This feedback draws on two online sessions with the panel, held on 25 February and 25 March 2026. Return to place.
Reference D: young people with a wide range of lived experiences are informing the Review through a dedicated sub-group of the Youth Guarantee Advisory Panel. Members were recruited by our partners, Youth Futures Foundation (YFF), who helped to run the sessions alongside colleagues in DfE. This feedback draws on two online sessions with the panel, held on 25 February and 25 March 2026. Return to place.
Reference E: Annual Population Survey data via NOMIS – Office for National Statistics, published 21st April 2026. Mid- and lower-skilled jobs refers to standard occupational groups 4 to 9, while higher-skilled jobs refers to standard occupational groups 1 to 3. Return to place.
Reference F: For example, Department for Education analysis finds that missing out on five good GCSEs has a weaker link to being NEET than having an EHCP or persistent absence. Department for Education ‘Risk Factors for Becoming NEET’ – to be published May 2026. Link to published report on www.GOV.UK not available at the time of publication. Return to place.
Reference G: £1.4 billion was spent in Jobcentres to deliver employment support in 2024/25 (nominal direct cost, excluding spending on estates and corporate costs). Jobcentre funding disaggregated by age is not available. Young People and Work Interim Report: Analytical Annex. Return to place.
Reference H: Work Coaches have a flexible time bank of 22 minutes per quarter to provide additional support and advice for people in the pre-WCA and LCW parts of the UC health journey. Return to place.
Reference I: Net Present Value. Return to place.
Reference J: Net Present Value. Return to place.
Reference K: Assumes no significant change to benefit regime. Undiscounted value. Note: Individuals may receive Universal Credit while in-work, dependent on earnings. Return to place.
Reference L: Benefit combinations, August 2025, DWP. There are also around 50,000 young people in the Intensive Work Search group who are in low paid/ part time work (as Universal Credit entitlements are income based and gradually reduce as earnings increase) and around 50,000 who are out of work and waiting for a Work Capability Assessment). Return to place.
-
Young people not in education, employment or training (NEET), Office for National Statistics (www.ons.gov.uk), February 2026. ↩
-
Youth Jobs Gap: Exploring compound disadvantage, Impetus, published May 2025. ↩
-
Risk factors for being NEET among young people, National Centre for Social Research for Youth Futures Foundation, published December 2023. ↩
-
Risk Factors for Becoming NEET- A Statistical analysis using linked data’ – to be published May 2026. Department for Education ‘Link to published report on www.GOV.UK not available at the time of publication. ↩
-
NEET age 16 to 24, Department for Education and Department for Work and Pensions, March 2026. ↩
-
Participation in education, training and neet age 16 to 17 by local authority, Department for Education,www.gov.uk, accessed April 2026 ↩
-
NEET age 16 to 24 statistics, Department for Education (www.gov.uk). ↩
-
Young people not in education, employment or training (NEET), Office for National Statistics (www.ons.gov.uk), February 2026. ↩
-
Trends in young people not in education, employment or training, Youth Futures Foundation (youthfuturesfoundation.org), published January-March 2025. ↩
-
Participation of young people by ethnicity. Young People and Work Interim Report: Analytical Annex. ↩
-
Characteristics of young people not in education, employment or training (NEET), England: March 2021, published March 2026. ↩
-
Children looked after in England including adoptions (www.gov.uk), published 26th November 2025. ↩
-
The education outcomes of refugee and asylum-seeking children in England (epi.org.uk), December 2021. ↩
-
Children looked after in England including adoptions, Department for Education (www.gov.uk),26th November 2025. ↩
-
Department for Education ‘Risk Factors for Becoming NEET- A Statistical analysis using linked data’ – to be published May 2026. Link to published report on www.GOV.UK not available at the time of publication. ↩
-
Department for Education (www.gov.uk), ‘Care leavers (now 17-21 years)’ from ‘Children looked after in England including adoptions’, created 8th May 2026, ↩
-
Department for Education (www.gov.uk), Children looked after in England including adoptions, 26th November 2025 ↩
-
House of Commons, Education Committee (committees.parliament.uk), Oral evidence: Children’s Homes,1st March 2022. ↩
-
Family Resources Survey, Department for Work and Pensions. Available at StatXplore Family Resources Adult Dataset ↩
-
Young carers and education: An analysis of how caring influences educational attainment, Nuffield Foundation, 2023. ↩
-
Pupil absence in schools in England, Department for Education (www.gov.uk), 26th March 2026. ↩
-
Youth Employment (youthemployment.org.uk), Youth Voice Census 2023. ↩
-
Risk factors for being NEET among young people, National Centre for Social Research for Youth Futures Foundation, December 2023. ↩
-
Office for National Statistics, Conceptions in England and Wales 2022, published July 2025 ↩
-
The maternal mental health experiences of young mums - Maternal Mental Health Alliance (maternalmentalhealthalliance.org), published October 2023. ↩
-
Reducing the number of young people not in employment, education or training (NEET) - UCL Institute of Health Equity and Public Health England, published September 2014. ↩
-
Reducing the number of young people not in employment, education or training (NEET) - UCL Institute of Health Equity and Public Health England, published September 2014. ↩
-
Review of the Youth Justice System in England and Wales – Ministry of Justice, published December 2016. ↩
-
Social Mobility Commission, State of the Nation 2025: The evolving story of social mobility in the UK (www.gov.uk), published 18th December 2025. Chapter 4: How have intermediate outcomes changed over time? ↩
-
Main earner in household at age 14 by NEET status. Young People and Work Interim Report: Analytical Annex. ↩
-
Udu Kalu, et al, BMJ Public Health, 30th March 2026, Poverty and family adversity trajectories and not in education, employment or training (NEET) status in late adolescence: evidence from the UK Millennium Cohort Study. ↩
-
Households Below Average Income Statistics, Department for Work and Pensions, 26th March 2026 (www.gov.uk). ↩
-
UK Poverty 2026, Joseph Rowntree Foundation (www.jrf.org.uk), published January 2026. ↩
-
Youth Jobs Gap: Exploring compound disadvantage, Impetus, published May 2025. ↩
-
Characteristics of young people not in education, employment, or training (NEET), England: March 2021, published March 2026 ↩
-
Get Britain Working: Labour Market Insights January 2026, updated April 2026. ↩
-
DWP, Get Britain Working Labour Market Insights (www.gov.uk), January 2026, updated 30th April 2026. ↩
-
Data tables: the employment of disabled people 2025 – GOV.UK (www.gov.uk), published 4th November 2025. ↩
-
Risk factors for being NEET among young people – National Centre for Social Research (natcen.ac.uk), published December 2023. ↩
-
Duration since last job or full-time education for those not in education, employment or training . Young People and Work Interim Report: Analytical Annex. ↩
-
Data tables: the employment of disabled people 2025 – GOV.UK (www.gov.uk), published 4th November 2025. ↩
-
School absence and Not in Education, Employment or Training – Vulnerability & Policing Futures Research Centre (vulnerabilitypolicing.org.uk), published 5th September 2024. ↩
-
Pupil absence in schools in England – GOV.UK (www.gov.uk), published 26th March 2026. ↩
-
Pupil absence in schools in England – GOV.UK (www.gov.uk), published 26th March 2026. ↩
-
The employment of disabled people 2025 – GOV.UK (www.gov.uk), published November 2025, updated 24th March 2026. ↩
-
The employment of disabled people 2025 – GOV.UK (www.gov.uk), published November 2025, updated 24th March 2026. ↩
-
Youth Jobs Gap: Exploring compound disadvantage – Impetus (impetus.org.uk), published May 2025. ↩
-
The employment of disabled people 2025 – GOV.UK (www.gov.uk), published November 2025, updated 24th March 2026. ↩
-
Data tables: the employment of disabled people 2025 – GOV.UK (www.gov.uk), published 4th November 2025. ↩
-
Why are a growing number of young people who are NEET reporting work-limiting health conditions? The Health Foundation (www.health.org.uk), 15th March 2026. ↩
-
False starts – Resolution Foundation (www.resolutionfoundation.org), published October 2025. ↩
-
Trends in young people not in education, employment or training, January – March 2025 – Youth Futures Foundation published June 2025. ↩
-
NEET Primary Health Conditions Estimates from the APS – GOV.UK (www.gov.uk), published March 2026. ↩
-
Not working: Exploring changing trends in youth worklessness in the UK, from the 1990s to the Covid-19 pandemic - Resolution Foundation (www.resolutionfoundation.org), published June 2022. ↩
-
Young people not in education, employment or training (NEET), Office for National Statistics, February 2026. ↩
-
False starts – Resolution Foundation (www.resolutionfoundation.org), published October 2025. ↩
-
Young people not in employment, education or training who have never worked. Young People and Work Interim Report: Analytical Annex. ↩
-
Resolution Foundation, False Starts – What the UK’s growing NEETs problem really looks like and how to fix (www.resolutionfoundation.org), published 21st October 2025. ↩
-
Flows from one year to the next for NEETs by duration. Young People and Work Interim Report: Analytical Annex. ↩
-
False starts – Resolution Foundation (www.resolutionfoundation.org), published October 2025. ↩
-
Hidden NEETs in England. Young People and Work Interim Report: Analytical Annex. ↩
-
Hidden NEETs in England. Young People and Work Interim Report: Analytical Annex. ↩
-
Gamote, Shuab and Hyman, Peter, Inside the Mind of a Young NEET, May 2026. ↩
-
Survey of young people NEET. See accompanying Analytical Annex. ↩
-
Gamote, Shuab and Hyman, Peter, Inside the Mind of a Young NEET, May 2026. ↩
-
Gamote, Shuab and Hyman, Peter, Inside the Mind of a Young NEET, May 2026. ↩
-
Gamote, Shuab and Hyman, Peter, Inside the Mind of a Young NEET, May 2026. ↩
-
Bika, Z., Locke, C., Orlandi, C. M., & Valcke, B. (2026). Theorising ‘best practice’ for supporting those furthest from the market into work or self-employment in France and England. Journal of European Social Policy, 36(2), 217-232 ↩
-
Gamote, Shuab and Hyman, Peter, Inside the Mind of a Young NEET, May 2026. ↩
-
Gamote, Shuab and Hyman, Peter, Inside the Mind of a Young NEET, May 2026. ↩
-
Survey of young people NEET. See accompanying Analytical Annex. ↩
-
From loneliness to social health concern: charting a path to healthier societies - WHO (www.who.int),), published June 2025. ↩
-
Healthy Life Expectancy: Small area estimates and inequalities – Essex County Council, published 2024. ↩
-
Findings from regional workshops with local stakeholders held in Tendring between February and March 2026. See accompanying Analytical Annex. ↩
-
Gamote, Shuab and Hyman, Peter, Inside the Mind of a Young NEET, May 2026. ↩
-
Gamote, Shuab and Hyman, Peter, Inside the Mind of a Young NEET, May 2026. ↩
-
Gamote, Shuab and Hyman, Peter, Inside the Mind of a Young NEET, May 2026. ↩
-
Mental Health of Children and Young People in England, 2023 – wave 4 follow up to the 2017 survey - NHS England (digital.nhs.uk), published November 2023. ↩
-
Adult Psychiatric Morbidity Survey: Survey of mental health and wellbeing, England, 2023/4 - NHS England (digital.nhs.uk), published November 2025. ↩
-
Briefing: Understanding drivers of recent trends in young people’s mental health - Youth Futures Foundation (youthfuturesfoundation.org), published July 2025. ↩
-
Public attitudes to smartphones, social media, and online safety - More in Common, published March 2025. ↩
-
Gamote, Shuab and Hyman, Peter, Inside the Mind of a Young NEET, May 2026. ↩
-
Gamote, Shuab and Hyman, Peter, Inside the Mind of a Young NEET, May 2026. ↩
-
Gamote, Shuab and Hyman, Peter, Inside the Mind of a Young NEET, May 2026. ↩
-
Gamote, Shuab and Hyman, Peter, Inside the Mind of a Young NEET, May 2026. ↩
-
Gamote, Shuab and Hyman, Peter, Inside the Mind of a Young NEET, May 2026. ↩
-
Findings from regional workshops with local stakeholders held in Bradford between February and March 2026. See accompanying Analytical Annex. ↩
-
How lonely are we really? What the data says - The Times (www.thetimes.com), published December 2025. ↩
-
Addressing the youth loneliness epidemic this World Mental Health Day - CSJ (www.centreforsocialjustice.org.uk), published October 2024. ↩
-
Public opinions and social trends, Great Britain: January 2025 - ONS (www.ons.gov.uk), published February 2025. ↩
-
Age of Alienation: Young people are facing a loneliness epidemic - Onward (ukonward.com), published July 2021. ↩
-
Findings from regional workshops with local stakeholders held in Newcastle between February and March 2026. See accompanying Analytical Annex. ↩
-
A focus on adolescent mental health and wellbeing in Europe, central Asia and Canada. Health behaviour in school-aged children international report from the 2021/2022 survey, volume 1 - WHO (www.who.int), published October 2023. ↩
-
Survey of young people NEET. See accompanying Analytical Annex. ↩
-
Findings from regional workshops with local stakeholders held in Tendring between February and March 2026. See accompanying Analytical Annex. ↩
-
Findings from regional workshops with local stakeholders held in Bradford between February and March 2026. See accompanying Analytical Annex. ↩
-
Findings from regional workshops with local stakeholders held in Bradford between February and March 2026. See accompanying Analytical Annex. ↩
-
Findings from regional workshops with local stakeholders held in Newcastle between February and March 2026. See accompanying Analytical Annex. ↩
-
The Big Ambition - Children’s Commissioner (www.childrenscommissioner.gov.uk), published March 2024. ↩
-
Gamote, Shuab and Hyman, Peter, Inside the Mind of a Young NEET, May 2026. ↩
-
Indicators to identify the disengaged - National Foundation for Educational Research, published in May 2013. ↩
-
Gamote, Shuab and Hyman, Peter, Inside the Mind of a Young NEET, May 2026. ↩
-
Gamote, Shuab and Hyman, Peter, Inside the Mind of a Young NEET, May 2026. ↩
-
Gamote, Shuab and Hyman, Peter, Inside the Mind of a Young NEET, May 2026. ↩
-
Survey of young people NEET. See accompanying Analytical Annex. ↩
-
Survey of young people NEET. See accompanying Analytical Annex. ↩
-
Survey of young people NEET. See accompanying Analytical Annex. ↩
-
Survey of young people NEET. See accompanying Analytical Annex. ↩
-
Qualitative research with NEET 16 to 24 year olds not currently claiming health or disability benefits, see accompanying Analytical Annex. ↩
-
Qualitative research with NEET 16 to 24 year olds not currently claiming health or disability benefits, see accompanying Analytical Annex. ↩
-
Gamote, Shuab and Hyman, Peter, Inside the Mind of a Young NEET, May 2026. ↩
-
Findings from regional workshops with local stakeholders held in Islington between February and March 2026. See accompanying Analytical Annex. ↩
-
Gamote, Shuab and Hyman, Peter, Inside the Mind of a Young NEET, May 2026. ↩
-
Gamote, Shuab and Hyman, Peter, Inside the Mind of a Young NEET, May 2026. ↩
-
Gamote, Shuab and Hyman, Peter, Inside the Mind of a Young NEET, May 2026. ↩
-
Gamote, Shuab and Hyman, Peter, Inside the Mind of a Young NEET, May 2026. ↩
-
Gamote, Shuab and Hyman, Peter, Inside the Mind of a Young NEET, May 2026. ↩
-
Gamote, Shuab and Hyman, Peter, Inside the Mind of a Young NEET, May 2026. ↩
-
Trends in young people not in education, employment or training - Youth Futures Foundation (youthfuturesfoundation.org), published November 2025. ↩
-
NS Figures reveal disability employment gap remains huge for disabled people - MENCAP, published August 2025. ↩
-
Work and learning disability research - Mencap (www.mencap.org.uk), published October 2022. ↩
-
Work and learning disability research - Mencap (www.mencap.org.uk), published October 2022. ↩
-
What stops people with a learning disability getting and keeping paid work? Mencap, published July 2023 ↩
-
Gamote, Shuab and Hyman, Peter, Inside the Mind of a Young NEET, May 2026. ↩
-
Gamote, Shuab and Hyman, Peter, Inside the Mind of a Young NEET, May 2026. ↩
-
Unpaid care, England and Wales: Census 2021 - ONS (https://www.ons.gov.uk), published January 2023. ↩
-
Gamote, Shuab and Hyman, Peter, Inside the Mind of a Young NEET, May 2026. ↩
-
Characteristics of young people not in education, employment, or training (NEET), England: March 2021 - ONS (www.ons.gov.uk), published March 2026. ↩
-
Gamote, Shuab and Hyman, Peter, Inside the Mind of a Young NEET, May 2026. ↩
-
Gamote, Shuab and Hyman, Peter, Inside the Mind of a Young NEET, May 2026. ↩
-
Qualitative research with NEET 16 to 24 year olds not currently claiming health or disability benefits, see accompanying Analytical Annex. ↩
-
Gamote, Shuab and Hyman, Peter, Inside the Mind of a Young NEET, May 2026. ↩
-
Qualitative research with NEET 16 to 24 year olds not currently claiming health or disability benefits, see accompanying Analytical Annex.. Full research report to follow publication ↩
-
Gamote, Shuab and Hyman, Peter, Inside the Mind of a Young NEET, May 2026. ↩
-
Qualitative research with NEET 16- to 24-year-olds not currently claiming health or disability benefits. See accompanying Analytical Annex. ↩
-
Gamote, Shuab and Hyman, Peter, Inside the Mind of a Young NEET, May 2026. ↩
-
Young people not in employment, education or training who have never worked: . See accompanying Analytical Annex. ↩
-
Gamote, Shuab and Hyman, Peter, Inside the Mind of a Young NEET, May 2026. ↩
-
Gamote, Shuab and Hyman, Peter, Inside the Mind of a Young NEET, May 2026. ↩
-
Gamote, Shuab and Hyman, Peter, Inside the Mind of a Young NEET, May 2026. ↩
-
Mental Health UK, Supporting young people: Mental health, meaningful activity, and life transitions, May 2026. Full research report to follow publication. ↩
-
Qualitative research with NEET 16- to 24-year-olds not currently claiming health or disability benefits. See accompanying Analytical Annex. ↩
-
Qualitative research with NEET 16- to 24-year-olds not currently claiming health or disability benefits. See accompanying Analytical Annex. ↩
-
Qualitative research with NEET 16- to 24-year-olds not currently claiming health or disability benefits. See accompanying Analytical Annex. ↩
-
Qualitative research with NEET 16- to 24-year-olds not currently claiming health or disability benefits. See accompanying Analytical Annex. ↩
-
Gamote, Shuab and Hyman, Peter, Inside the Mind of a Young NEET, May 2026. ↩
-
Gamote, Shuab and Hyman, Peter, Inside the Mind of a Young NEET, May 2026. ↩
-
Gamote, Shuab and Hyman, Peter, Inside the Mind of a Young NEET, May 2026. ↩
-
The employment of disabled people 2025 - GOV.UK (www.gov.uk), published March 2026. ↩
-
Survey of young people NEET. See accompanying Analytical Annex. ↩
-
Gamote, Shuab and Hyman, Peter, Inside the Mind of a Young NEET, May 2026. ↩
-
Gamote, Shuab and Hyman, Peter, Inside the Mind of a Young NEET, May 2026. ↩
-
Gamote, Shuab and Hyman, Peter, Inside the Mind of a Young NEET, May 2026. ↩
-
Gamote, Shuab and Hyman, Peter, Inside the Mind of a Young NEET, May 2026. ↩
-
Qualitative research with NEET 16- to 24-year-olds not currently claiming health or disability benefits. See accompanying Analytical Annex. ↩
-
Qualitative research with NEET 16- to 24-year-olds not currently claiming health or disability benefits. See accompanying Analytical Annex. ↩
-
Qualitative research with NEET 16- to 24-year-olds not currently claiming health or disability benefits. See accompanying Analytical Annex. ↩
-
Qualitative research with NEET 16- to 24-year-olds not currently claiming health or disability benefits. See accompanying Analytical Annex. ↩
-
Qualitative research with NEET 16- to 24-year-olds not currently claiming health or disability benefits. See accompanying Analytical Annex. ↩
-
Qualitative research with NEET 16- to 24-year-olds not currently claiming health or disability benefits. See accompanying Analytical Annex. ↩
-
Qualitative research with NEET 16- to 24-year-olds not currently claiming health or disability benefits. See accompanying Analytical Annex. ↩
-
Gamote, Shuab and Hyman, Peter, Inside the Mind of a Young NEET, May 2026. ↩
-
Gamote, Shuab and Hyman, Peter, Inside the Mind of a Young NEET, May 2026. ↩
-
Qualitative research with NEET 16- to 24-year-olds not currently claiming health or disability benefits. See accompanying Analytical Annex. ↩
-
Qualitative research with NEET 16- to 24-year-olds not currently claiming health or disability benefits. See accompanying Analytical Annex. ↩
-
Qualitative research with NEET 16- to 24-year-olds not currently claiming health or disability benefits. See accompanying Analytical Annex. ↩
-
Unpaid and underpaid internships. Access to internships for graduates - The Sutton Trust, published January 2025. ↩
-
Qualitative research with NEET 16- to 24-year-olds not currently claiming health or disability benefits. See accompanying Analytical Annex. ↩
-
Qualitative research with NEET 16- to 24-year-olds not currently claiming health or disability benefits. See accompanying Analytical Annex. ↩
-
Qualitative research with NEET 16- to 24-year-olds not currently claiming health or disability benefits. See accompanying Analytical Annex. ↩
-
Gamote, Shuab and Hyman, Peter, Inside the Mind of a Young NEET, May 2026. ↩
-
Gamote, Shuab and Hyman, Peter, Inside the Mind of a Young NEET, May 2026. ↩
-
Gamote, Shuab and Hyman, Peter, Inside the Mind of a Young NEET, May 2026. ↩
-
The King’s Trust TK Maxx Youth Index 2025 - The King’s Trust (www.kingstrust.org.uk), published February 2025. ↩
-
Gamote, Shuab and Hyman, Peter, Inside the Mind of a Young NEET, May 2026. ↩
-
Gamote, Shuab and Hyman, Peter, Inside the Mind of a Young NEET, May 2026. ↩
-
Gamote, Shuab and Hyman, Peter, Inside the Mind of a Young NEET, May 2026. ↩
-
Gamote, Shuab and Hyman, Peter, Inside the Mind of a Young NEET, May 2026. ↩
-
Gamote, Shuab and Hyman, Peter, Inside the Mind of a Young NEET, May 2026. ↩
-
Gamote, Shuab and Hyman, Peter, Inside the Mind of a Young NEET, May 2026. ↩
-
Survey of young people NEET. See accompanying Analytical Annex. ↩
-
The King’s Trust TK Maxx Youth Index 2025 - The King’s Trust (www.kingstrust.org.uk), published February 2025. ↩
-
Survey of young people NEET. See accompanying Analytical Annex. ↩
-
Qualitative research with NEET 16 to 24 year olds not currently claiming health or disability benefits, see accompanying Analytical Annex. ↩
-
Harmful stereotypes of young people fuelling record numbers to fall out of work - UK Youth (www.ukyouth.org), published November 2024. ↩
-
Harmful stereotypes of young people fuelling record numbers to fall out of work - UK Youth (www.ukyouth.org), published November 2024. ↩
-
Qualitative research with NEET 16 to 24 year olds not currently claiming health or disability benefits. See accompanying Analytical Annex. ↩
-
Qualitative research with NEET 16 to 24 year olds not currently claiming health or disability benefits, see accompanying Analytical Annex ↩
-
Gamote, Shuab and Hyman, Peter, Inside the Mind of a Young NEET, May 2026. ↩
-
Qualitative research with NEET 16- to 24-year-olds not currently claiming health or disability benefits. Names have been changed to protect the anonymity of respondents. See accompanying Analytical Annex. ↩
-
Qualitative research with NEET 16- to 24-year-olds not currently claiming health or disability benefits. Names have been changed to protect the anonymity of respondents. See accompanying Analytical Annex. ↩
-
Qualitative research with NEET 16- to 24-year-olds not currently claiming health or disability benefits. Names have been changed to protect the anonymity of respondents. See accompanying Analytical Annex. ↩
-
The King’s Trust TK Maxx Youth Index 2025 - The King’s Trust (www.kingstrust.org.uk), published February 2025. ↩
-
Youth not in employment, education or training indicator – OECD (www.oecd.org), published 2025. ↩
-
Young people not in employment, education or training by highest qualification obtained . Young People and Work Interim Report: Analytical Annex. ↩
-
Young people not in education, employment or training, Office for National Statistics, published 26th February 2026. ↩
-
Labour market overview, UK – Office for National Statistics (www.ons.gov.uk), published 21st April 2026. ↩
-
Labour market overview, UK – Office for National Statistics (www.ons.gov.uk) , published 21st April 2026. ↩
-
Labour market overview, UK – Office for National Statistics (www.ons.gov.uk), published 21st April 2026. ↩
-
Labour market overview, UK – Office for National Statistics (www.ons.gov.uk), published 21st April 2026. ↩
-
Labour market overview, UK – Office for National Statistics (www.ons.gov.uk), published 21st April 2026. ↩
-
Labour market overview, UK – Office for National Statistics (www.ons.gov.uk), published 21st April 2026. ↩
-
Labour market overview, UK – Office for National Statistics (www.ons.gov.uk) published 21st April 2026. ↩
-
Lost in Transition, Resolution Foundation - (www.resolutionfoundation.org), published 28th April 2026, ↩
-
Labour market overview, UK – Office for National Statistics (www.ons.gov.uk), published 21st April 2026. ↩
-
Labour market overview, UK – Office for National Statistics (www.ons.gov.uk), published 21st April 2026. ↩
-
Youth Employment 2025 Outlook – Youth Futures Foundation (www.youthfoundation.org), published November 2025. ↩
-
Labour market overview, UK – Office for National Statistics (www.ons.gov.uk), published 21st April 2026. ↩
-
UK payrolled employments by nationality, region, industry, age and sex, from July 2014 to December 2025 – GOV.UK (www.gov.uk), published 14th April 2026. ↩
-
Hospitality and retail sectors: Impact of government policy – House of Lords library (www.lordslibrary.parliament.uk), published 19th January 2026. ↩
-
Labour risks election wipeout unless it improves Britain’s high streets, study finds – The Guardian (www.theguardian.com), published 28th January 2026. ↩
-
Labour market overview, UK – Office for National Statistics (www.ons.gov.uk), published 21st April 2026. ↩
-
Labour market overview, UK – Office for National Statistics (www.ons.gov.uk), published 17th February 2026. ↩
-
Labour market overview, UK – Office for National Statistics (www.ons.gov.uk), published 21st April 2026. ↩
-
The state of the adult social care sector and workforce in England, Skills for Care – Skills for Care Workforce Intelligence (Workforce intelligence) (www.skillsforcare.org.uk), published 15th October 2025. ↩
-
Career profiles: care worker – National Careers Service (nationalcareers.service.gov.uk). ↩
-
The UK Insecure Work Index 2024 – The Work Foundation (Work Foundation - Lancaster University) (www.lancaster.ac.uk/work-foundation), published 25th February 2024. ↩
-
Labour market overview, UK – Office for National Statistics (www.ons.gov.uk), published 17th February 2026. ↩
-
No progress? Tackling long-term insecure work – The Work Foundation (Work Foundation - Lancaster University) (www.lancaster.ac.uk/work-foundation), published 17th September 2024. ↩
-
Choosing your freedom – Youth Futures Foundation (YouthFuturesFoundation.org), published February 2023. ↩
-
The experiences of individuals in the gig economy – GOV.UK (www.gov.uk), published February 2018. ↩
-
Apprenticeships rise as graduate vacancies drop 8% – Institute of Student Employers (ISE.org.uk), published 15th October 2025. ↩
-
Do Adults Have the Skills They Need to Thrive in a Changing World? – OECD (www.oecd.org/en.html), published 10 December 2024. ↩
-
Young people not in employment, education or training by highest qualification obtained: Young People and Work Interim Report: Analytical Annex. ↩
-
Explore Education Statistic - Starts, Participation by Age, Level, SSA from Apprenticeships Explore education statistics - GOV.UK (www.gov.uk), published 29th April 2026. ↩
-
Explore Education Statistics - Starts, Participation by Age, Level, SSA from Apprenticeships Explore education statistics - GOV.UK (www.gov.uk), published 29th April 2026. ↩
-
Explore Education Statistics - Starts, Participation by Age, Level, SSA from Apprenticeships Explore education statistics - GOV.UK (www.gov.uk), published 29th April 2026. ↩
-
A world of difference - Sutton Trust (www.suttontrust.com), published June 2025. Available at: https://www.suttontrust.com/wp-content/uploads/2025/06/A-World-of-Difference-3.pdf ↩
-
Apprenticeship evaluation 2023: learner, non-completer and employer surveys ↩
-
How are employers using apprenticeships in 2025 - Institute of Student Employers (www.ISE.org.uk), published 15th May 2025. ↩
-
Public sector employment as per cent of total employment - Office for National Statistics (www.ons.gov.uk), published 19th March 2026. ↩
-
Workforce of the future: future of local government - PWC/City Councils Network, published February 2024. ↩
-
Teenage career development in England: A Review of PISA 2022 Data - OECD, published 16th May 2024. ↩
-
Teenage career development in England: A Review of PISA 2022 Data - OECD, published 16th May 2024. ↩
-
National minimum wage and National Living Wage rates - GOV.UK (www.gov.uk). ↩
-
Appendix Two, Low Pay Commission report 2022 - GOV.UK (www.gov.uk), published January 2023. ↩
-
Why has the NEET rate risen? Understanding trends and drivers using administrative data, Institute for Fiscal Studies, to be published May 2026. Link to published report not available at time of publication. ↩
-
The National Minimum Wage in 2026 - GOV.UK (www.gov.uk), published April 2026. ↩
-
Labour Market Outlook, Winter 2024-25 - CIPD, published February 2025. ↩
-
The Cost of Labour - Centre for Policy Studies (www.cps.org.uk), published November 2025. ↩
-
Annual bus statistics, year ending March 2024 (revised) - GOV.UK (www.gov.uk), published March 2025. ↩
-
Driving license holding and vehicle availability - GOV.UK (www.gov.uk), published August 2025. ↩
-
Making the Connections: Final report on transport and social exclusion, Office of the Deputy Prime Minister, published February 2003 ↩
-
Pre-census (42-day) retention strategies for 16-19 full time learners - GOV.UK (www.gov.uk), published January 2023. ↩
-
16-18 destination measures - GOV.UK (www.gov.uk), published April 2026. ↩
-
An intergenerational audit for the UK: 2024 - Resolution Foundation (www.resolutionfoundation.org), published November 2024. ↩
-
Unlocking the potential of young people furthest from the labour market - Joseph Rowntree Foundation (www.JRF.org.uk), published May 2025. ↩
-
Labor market impacts of AI: A new measure and early evidence - Anthropic (www.anthropic.com), published March 2026. ↩
-
Brynjolfsson, Erik, Chandar, Bharat and Chen, Ruyu, Canaries in the Coal Mine? Six Facts about the Recent Employment Effects of Artificial Intelligence - Stanford Digital Economy Lab, published November 2025. ↩
-
Smith, Chloe, Hidden talent, historic opportunity: AI’s power to close the UK’s labour market gap - Digital leaders, published 21st April 2026. ↩
-
UK payrolled employments by nationality, region, industry, age and sex, from July 2014 to December 2025 - GOV.UK (www.gov.uk), published 14th April 2026. ↩
-
Long-term international migration, provisional: year ending June 2025 - Office for National Statistics (www.ons.gov.uk), published 27th November 2025. ↩
-
Long-term international migration, provisional: year ending June 2025 - Office for National Statistics (www.ons.gov.uk), published 27th November 2025. ↩
-
UK Hospitality, Labour shortages to worsen under new immigration plans – UK Hospitality (www.ukhospitality.org.uk), published December 2023. ↩
-
Understanding KS4 attainment and progress: evidence from LSYPE2 – GOV.UK (www.gov.uk), published October 2018. ↩
-
Understanding KS4 attainment and progress: evidence from LSYPE2 – GOV.UK (www.gov.uk), published October 2018. ↩
-
State of the Nation 2015: Social Mobility and Child Poverty in Great Britain – Social Mobility and Child Poverty Commission, December 2015. ↩
-
Department for Education ‘Risk Factors for Becoming NEET- A Statistical analysis using linked data’ ↩
-
Parent and Young People Polling Findings – Inquiry Into White Working-Class Educational Outcomes (https://educationaloutcomes.org.uk/), published January 2026. ↩
-
Family Nurse Partnership Programme Guidance - GOV.UK (www.gov.uk) published 18th July 2024. ↩
-
Family Nurse Partnership Guidebook Intervention Information Sheet, Foundations published January 2021 ↩
-
Raising Early Achievement in Literacy – The Sheffield REAL Project (sheffield-real-project.sites.sheffield.ac.uk). ↩
-
Raising Early Achievement in Literacy Guidebook Intervention Information Sheet – Foundations (foundations.org.uk), published July 2016. ↩
-
Warburton, M., et al, Risk of not being in employment, education or training (NEET) in late adolescence is signalled by school readiness measures at 4-5 years – BMC Public Health (https://link.springer.com/journal/12889), published 22nd May 2024. ↩
-
Warburton, M., et al, Risk of not being in employment, education or training (NEET) in late adolescence is signalled by school readiness measures at 4-5 years – BMC Public Health (https://link.springer.com/journal/12889), published 22nd May 2024. ↩
-
Warburton, M., et al, Risk of not being in employment, education or training (NEET) in late adolescence is signalled by school readiness measures at 4-5 years – BMC Public Health (https://link.springer.com/journal/12889), published 22nd May 2024. ↩
-
Jones, D.E., Greenberg, M. and Crowley, M., Early Social-Emotional Functioning and Public Health – American Journal of Public Health (https://ajph.aphapublications.org/), published 10th February 2015. ↩
-
Warburton, M., et all, Risk of not being in employment, education or training (NEET) in late adolescence is signalled by school readiness measures at 4-5 years – BMC Public Health (), published 22nd May 2024. ↩
-
Analysis of LSYPE2, DfE, Early years foundation stage profile results, ‘1 Headline measures by child characteristics’ - GOV.UK (www.gov.uk). published 2nd April 2026. ↩
-
Early years foundation stage profile results – GOV.UK (www.gov.uk), published 5th February 2026. ↩
-
Warburton, M., et al, Risk of not being in employment, education or training (NEET) in late adolescence is signalled by school readiness measures at 4-5 years – BMC Public Health (https://link.springer.com/journal/12889) published 22nd May 2024. ↩
-
The short- and medium-term impacts of Sure Start on educational outcomes – Institute for Fiscal Studies (ifs.org.uk), published 9th April 2024. ↩
-
Struggling against the tide: Children’s services spending, 2011-2023 – Children at the Table (childrenatthetable.org.uk), published September 2024. ↩
-
Giving every child the best start in life - GOV.UK (www.gov.uk), published July 2025. ↩
-
Magic Breakfast Evaluation report and executive summary – Education Endowment Foundation (educationendownmentfoundation.org.uk), published December 2019. ↩
-
House of Commons Education Committee (committees.parliament.uk), Children’s Social Care: Government Response, published October 2025. ↩
-
Curriculum and Assessment Review Final Report – GOV.UK (www.gov.uk), published 5th November 2025. ↩
-
Level 2 and 3 attainment age 16 to 25, Academic year 2023/24 – GOV.UK (www.gov.uk), published 4th July 2025. ↩
-
Level 2 and 3 attainment age 16 to 25, Academic year 2024/25 – GOV.UK (www.gov.uk), published 23rd April 2026. ↩
-
Curriculum and Assessment Review Final Report – GOV.UK (www.gov.uk), published 5th November 2025. ↩
-
Key stage 4 destination measures – GOV.UK (www.gov.uk), published 23rd April 2026. ↩
-
Crawford, C., Macmillan, L. and Vignoles, A., When and Why do Initially High Attaining Poor Children Fall Behind – Centre for Analysis of Social Exclusion (https://sticerd.lse.ac.uk/case/), published July 2015. ↩
-
Key stage 2 attainment – GOV.UK (www.gov.uk), published 23rd April 2026. ↩
-
Farquharson, C., McNally, S. and Tahir, I., Education inequalities – Oxford Open Economics (https://academic.oup.com/ooec), published 17th July 2024. ↩
-
Key stage 4 performance - GOV.UK (www.gov.uk), published 23rd April 2026. ↩
-
Youth Jobs Gap: Exploring compound disadvantage – Impetus (impetus.org.uk), published May 2025. ↩
-
Key stage 4 destination measures – GOV.UK (www.gov.uk), published 23rd April 2026. ↩
-
The employment of disabled people 2025 – GOV.UK (www.gov.uk), published November 2025, updated 24th March 2026. ↩
-
Improving the impact of teachers on pupil achievement in the UK – interim findings – The Sutton Trust (www.suttontrust.com), published September 2011. ↩
-
Improving the impact of teachers on pupil achievement in the UK – interim findings – The Sutton Trust (www.suttontrust.com), published September 2011. ↩
-
Teacher recruitment and retention in schools in socio-economically disadvantaged areas in England – review of practice – Education Endowment Foundation (educationendowmentfoundation.org.uk), published February 2024. ↩
-
The Teacher Labour Market in England – Education Policy Institute (epi.org.uk), published August 2018. ↩
-
The Health Foundation, Inequalities in quality of education by income deprivation, April 2025. ↩
-
Annual report on education spending in England: 2025-26 – Institute for Fiscal Studies (ifs.org.uk), published 21st January 2026. ↩
-
Annual report on education spending in England: 2025-26 – Institute for Fiscal Studies (ifs.org.uk), published 21st January 2026. ↩
-
National funding formula for schools and high needs: 2026 to 2027 – GOV.UK (www.gov.uk), published 17th December 2025. ↩
-
Tackling the persistent disadvantage gap – Education Policy Institute (epi.org.uk), published November 2024. ↩
-
Annual report on education spending in England: 2025-26 – Institute for Fiscal Studies (ifs.org.uk), published 21st January 2026. ↩
-
Every child achieving and thriving – GOV.UK (www.gov.uk), published 23rd February 2026. ↩
-
Stephen Gorard, Nadia Siddiqui & Beng Huat See – Taylor & Francis (tandfonline.com), published March 2021. ↩
-
Pupil premium: overview guidance – GOV.UK (www.gov.uk), published March 2026. ↩
-
Youth Jobs Gap: Exploring compound disadvantage – Impetus (impetus.org.uk), published May 2025. ↩
-
Department for Education ‘Risk Factors for Becoming NEET’ – to be published May 2026. Link to published report on www.GOV.UK not available at the time of publication. ↩
-
Youth Jobs Gap: Exploring compound disadvantage, Impetus, published May 2025. ↩
-
Outcomes for children in need, including children looked after by local authorities in England, reporting year 2025 – GOV.UK (www.gov.uk), published 2nd April 2026. ↩
-
Special educational needs in England – GOV.UK (www.gov.uk), published 12th June 2025. ↩
-
Education, health and care plans – GOV.UK (www.gov.uk), published 26th June 2025. ↩
-
England’s SEND crisis: cost, challenges and the case for reform – Institute for Fiscal Studies (ifs.org.uk), published 12th September 2025. ↩
-
Special educational needs in England – GOV.UK (www.gov.uk), published 12th June 2025. ↩
-
Annual report on education spending in England: 2025-26 – Institute for Fiscal Studies (ifs.org.uk), published 21st January 2026. ↩
-
Pupil absence in schools in England – GOV.UK (www.gov.uk), published 26th March 2026. ↩
-
Suspensions and Permanent Exclusions in England, Academic Year 2023/4 - GOV.UK (www.gov.uk), published 18th November 2025. ↩
-
The link between attendance and attainment in an assessment year – GOV.UK (www.gov.uk), published 14th March 2025. ↩
-
Pupil absence in schools in England – GOV.UK (www.gov.uk), published 26th March 2026. ↩
-
Breaking down the gap – Education Policy Institute (epi.org.uk), published 17th March 2025. ↩
-
School absence and Not in Education, Employment or Training – Vulnerability & Policing Futures Research Centre (vulnerabilitypolicing.org.uk), published 5th September 2024. ↩
-
Department for Education, Absence rates by geographic level for Special, State-funded primary and State-funded secondary in England between 2017/18 and 2024/25. Published 14 May 2026. ↩
-
Every child achieving and thriving – GOV.UK (www.gov.uk), published 23rd February 2026. ↩
-
Research into the use and effectiveness of Risk of NEET Indicators (RONIs) – Youth Futures Foundation (youthfuturesfoundation.org), published April 2026. ↩
-
Post-16 education and skills white paper – GOV.UK (www.gov.uk), published 20th October 2025. ↩
-
Suspensions and permanent exclusions in England – GOV.UK (www.gov.uk), published 20th November 2025. ↩
-
Suspensions and permanent exclusions in England – Gov.uk (www.gov.uk) published 15th December 2025. ↩
-
Guldberg, K., et al, Investigation of the causes and implications of exclusion for autistic children and young people – University of Birmingham (Birmingham.ac.uk), published December 2021. ↩
-
Fleming, M., Fitton, C.A. and Steiner, M.F.C., Educational and Health Outcomes of Children Treated for Attention-Deficit/Hyperactivity Disorder, JAMA Paediatrics – JAMA Network (jamanetwork.com), published 3rd July 2017. ↩
-
Elective home education – GOV.UK (www.gov.uk), published 15th January 2026. ↩
-
Elective home education – GOV.UK (www.gov.uk), published 15th January 2026. ↩
-
Graham, L. and Mountford-Zimdars, A., Home advantage: the experience of home-educated students in English higher education and recommendations for new “WISE” practices, Quality Education for All – Emerald (www.emerald.com), published 30th April 2025. ↩
-
PISA 2022 Results (Volume I and II) – Country Notes: United Kingdom – OECD (oecd.org), published 5th December 2023. ↩
-
Pupil experiences in school: academic year 2024 to 2025 – GOV.UK (www.gov.uk), published 27th November 2025. ↩
-
We used to have it all: is there a trade-off between wellbeing and attainment in schools – Social Market Foundation (smf.co.uk), published April 2025. ↩
-
Parent and Young People Polling Findings – Inquiry Into White Working Class Educational Outcomes (https://educationaloutcomes.org.uk/), published January 2026. ↩
-
Every child achieving and thriving – GOV.UK (www.gov.uk), published 23rd February 2026. ↩
-
Youth Jobs Gap: Exploring compound disadvantage – Impetus (impetus.org.uk), published May 2025. ↩
-
Survey of NEET young people. See accompanying Analytical Annex. ↩
-
Parent, pupil and learner voice: omnibus surveys for 2024 to 2024 (June 2025 and December 2024) – GOV.UK (www.gov.uk), published 28th April. ↩
-
Characteristics of young people not in education, employment or training (NEET), England: March 2021 – Office for National Statistics (www.ons.gov.uk), published 27th March 2026. ↩
-
Donaldson, C., Hawkins, J., Rice, F. and Moore, G., Trajectories of mental health across the primary to secondary school transition, JCPP Advances – Association for Child and Adolescent Mental Health (https://acamh.onlinelibrary.wiley.com/), published 16th May 2024. ↩
-
Jindal-Snape, D., Bradshaw, P., Gilbert, A., Smith, N. and Knudsen, L., Primary-secondary school transition experiences and factors associated with differences in these experiences: Analysis of the longitudinal Growing Up in Scotland dataset, Review of Education – BERA Journals (https://bera-journals.onlinelibrary.wiley.com/), published 8th December 2023. ↩
-
Curriculum and Assessment Review Final Report – GOV.UK (www.gov.uk), published 5th November 2025. ↩
-
School and college voice: November 2024 – GOV.UK (www.gov.uk), published 27 November 2025. ↩
-
Non-GCSE qualifications in England: key stage 4 entries and absence and exclusions outcomes – GOV.UK (www.gov.uk), published 19th March 2019. ↩
-
Survey of education professionals. See accompanying Analytical Annex. ↩
-
Survey of education professionals. See accompanying Analytical Annex. ↩
-
Employer skills survey 2024: England results – GOV.UK (www.gov.uk), published 27th November 2025. ↩
-
Towards universal opportunity for young people – IPPR (ippr.org), published 8th July 2025. ↩
-
Youth Voice Census 2025 Report – Youth Employment UK (youthemployment.org.uk). ↩
-
Good Career Guidance: The Next 10 Years – Gatsby (Gatsby.org.uk), published November 2024. ↩
-
Looking deeper at destinations – The Careers & Enterprise Company (careersandenterprise.co.uk), published 4th March 2024. ↩
-
Insight briefing: Learner career readiness in 2024/25 – The Careers & Enterprise Company (careersandenterprise.co.uk). ↩
-
Looking deeper at destinations – The Careers & Enterprise Company (careersandenterprise.co.uk), published 4th March 2024. ↩
-
The benefits of Gatsby Benchmark achievement for post-16 destinations – The Careers & Enterprise Company (careersandenterprise.co.uk), published 9th June 2021. ↩
-
Technical note: Fiscal benefit of inferred NEET reductions due to careers education – updated analysis for 2020/21-2024/25, The Careers and Enterprise Company ↩
-
Insight briefing 3: The promise of primary – The Careers & Enterprise Company (careersandenterprise.co.uk), published 6th October 2025. ↩
-
What works? Career-related learning in primary schools – The Careers & Enterprise Company (careersandenterprise.co.uk), published December 2018. ↩
-
Youth Voice Census 2025 Report – Youth Employment UK (youthemployment.org.uk). ↩
-
Youth Voice Census 2025 Report – Youth Employment UK (youthemployment.org.uk). ↩
-
Youth Voice Census 2025 Report – Youth Employment UK (youthemployment.org.uk). ↩
-
Youth Voice Census 2025 Report – Youth Employment UK (youthemployment.org.uk). ↩
-
Youth Voice Census 2025 Report – Youth Employment UK (youthemployment.org.uk). ↩
-
Youth Voice Census 2025 Report – Youth Employment UK (youthemployment.org.uk). ↩
-
Education at a Glance 2025 – OECD (oecd.org), published 9th September 2025. ↩
-
Youth not in employment, education or training (NEET) – OECD (oecd.org). ↩
-
Education at a Glance 2025 – OECD (oecd.org), published 9th September 2025. ↩
-
What works in reducing NEET rates: a comparative study – Youth Futures Foundation (youthfuturesfoundation.org), published November 2025. ↩
-
Characteristics of young people who are long-term NEET – GOV.UK (www.gov.uk), published 8th February 2018. ↩
-
Evans, R., et al, The relationship between school characteristics and students becoming ‘not in education, employment or training’, Royal Society Open Science – The Royal Society Publishing (royalsocietypublishing.org), published 1st April 2026. ↩
-
Evans, R., et al, The relationship between school characteristics and students becoming ‘not in education, employment or training’, Royal Society Open Science – The Royal Society Publishing (royalsocietypublishing.org), published 1st April 2026. ↩
-
Youth Employment Toolkit – Youth Futures Foundation (youthfuturesfoundation.org). ↩
-
Participation in education, training and employment age 16 to 18 – GOV.UK (www.gov.uk), published 26th June 2025. ↩
-
Participation in education, training and employment age 16 to 18 – GOV.UK (www.gov.uk), published 26th June 2025. ↩
-
Crawford, C., Meschi, E. and Vignoles, A., Post-16 Educational Choices and Institutional Value Added At Key Stage 5 – Centre for the Economics of Education, published January 2011. ↩
-
The road not taken – review of literature and survey evidence – GOV.UK (www.gov.uk), published 30th March 2021. ↩
-
Comparing inequality and outcomes across post-16 education in the UK – Education Policy Institute (epi.org.uk), published July 2025. ↩
-
Lost in transition - Resolution Foundation (resolutionfoundation.org), published April 2026. ↩
-
Education and training statistics for the UK – GOV.UK (www.gov.uk), published 13th November 2025. ↩
-
Participation in classroom-based further education qualifications by adults (19+) in England – Institute for Fiscal Studies (ifs.org.uk), published 16th January 2025. ↩
-
Annual report on education spending in England: 2025-26 – Institute for Fiscal Studies (ifs.org.uk), published 21st January 2026. ↩
-
Annual report on education spending in England: 2025-26 – Institute for Fiscal Studies (ifs.org.uk), published 21st January 2026. ↩
-
Level 2 and 3 attainment age 16 to 25, Academic year 2024/25 – GOV.UK (www.gov.uk), published 23rd April 2026. ↩
-
Spending per pupil or student per year at different stages of education (2025-26 prices) – Institute for Fiscal Studies (ifs.org.uk), published January 2026. ↩
-
Spending per pupil or student per year at different stages of education (2025-26 prices) – Institute for Fiscal Studies (ifs.org.uk), published January 2026. ↩
-
16 to 19 funding: 2026 to 2027 rates and formula – GOV.UK (www.gov.uk), published March 2026. ↩
-
To reduce NEET numbers, invest in colleges, says AoC – Association of Colleges (aoc.co.uk), published 16th March 2026. ↩
-
The Further Education Teacher Workforce in England: Annual Report 2026 – National Foundation for Educational Research (nfer.ac.uk), published 12th March 2026. ↩
-
Skills England: Sector evidence on the growth and skills offer – GOV.UK (www.gov.uk), published July 2025. ↩
-
Dickson, M., Maguire, S., Alfaro, M.J.V., Laczik, A., Dabbous, D., Newton, O. and Thomson, D., Keeping young people in learning until the age of 18 – does it work? – University of Bath (bath.ac.uk), published July 2025. ↩
-
Wixcey, H., et al, Does well-being matter? Exploring the reasons for learner withdrawal from further education in Wales, Journal of Further and Higher Education – University and College Union (ucu.org.uk), published 31st October 2022. ↩
-
Further education and skills – GOV.UK (www.gov.uk), published 31st March 2026. ↩
-
Provisional T Level Results, academic year 2024/25 – GOV.UK (www.gov.uk), published August 2025. ↩
-
A level and other 16 to 18 results, academic year 2024/25 – GOV.UK (www.gov.uk), published November 2025. ↩
-
Apprenticeships, academic year 2025/26 – GOV.UK (www.gov.uk), published 26th March 2026. ↩
-
Apprenticeships, academic year 2025/26 – GOV.UK (www.gov.uk), published 26th March 2026. ↩
-
Historical series - Starts, Participation by Age, Level, SSA’ for Advanced Apprenticeship, Higher Apprenticeship and Intermediate Apprenticeship in England between 2010/11 and 2024/25, Department for Education. ↩
-
Balancing act: Youth apprenticeships and the case for a flexible skills levy – CIPD (cipd.org), published 20th May 2024. ↩
-
Balancing act: Youth apprenticeships and the case for a flexible skills levy – CIPD (cipd.org), published 20th May 2024. ↩
-
Balancing act: Youth apprenticeships and the case for a flexible skills levy – CIPD (cipd.org), published 20th May 2024. ↩
-
Education at a Glance 2025 – OECD (oecd.org), published 9th September 2025. ↩
-
Education at a Glance 2025 – OECD (oecd.org), published 9th September 2025. ↩
-
Apprenticeships, academic year 2025/26 – GOV.UK (www.gov.uk), published 26th March 2026. ↩
-
Modern Apprenticeship Statistics – Skills Development Scotland (skillsdevelopmentscotland.co.uk), published 10th February 2026. ↩
-
Apprenticeships NI Statistical Bulletin – Northern Ireland Statistical Research Agency (nisra.gov.uk), published 30th January 2026. ↩
-
The Net Present Value of further education in England – GOV.UK (www.gov.uk), published 13th February 2025. ↩
-
Apprenticeship Evaluation 2023: Learner and Non-completer Surveys – GOV.UK (www.gov.uk), published 27th September 2024. ↩
-
Field, S., A World of Difference – The Sutton Trust (suttontrust.com), published June 2025. ↩
-
Apprenticeships, academic year 2025/26 – GOV.UK (www.gov.uk), published 26th March 2026. ↩
-
Apprenticeship Evaluation 2023: Learner and Non-completer Surveys – GOV.UK (www.gov.uk), published 27th September 2024. ↩
-
Apprenticeship Evaluation 2023: Learner and Non-completer Surveys – GOV.UK (www.gov.uk), published 27th September 2024. ↩
-
Balancing act: Youth apprenticeships and the case for a flexible skills levy – CIPD (cipd.org), published 20th May 2024. ↩
-
Equalising access to apprenticeships – National Foundation for Educational Research (nfer.ac.uk), published 16 June 2022. ↩
-
Youth Employment 2024 Outlook – Youth Futures Foundation (youthfuturesfoundation.org), published August 2024. ↩
-
Participation in education, training and employment age 16 to 18, calendar year 2024 – GOV.UK (www.gov.uk), published 26th June 2025. ↩
-
Participation in education, training and employment age 16 to 18, calendar year 2024 – GOV.UK (www.gov.uk), published 26th June 2025. ↩
-
Curriculum and Assessment Review Final Report – GOV.UK (www.gov.uk), published 5th November 2025. ↩
-
Aucejo, E., Hupkau, C. and Ruiz-Valenzuela, J., Where versus What: College Value-Added and Returns to Field of Study in Further Education – Centre for Vocational Education Research (cver.lse.ac.uk), published June 2020. ↩
-
Battiston, A., et al, The value of progression in further education – Centre for Vocational Education Research (cver.lse.ac.uk), published August 2019. ↩
-
Dilnot, C., Macmillan, L. and Wyness, G., Educational Choices at 16-19 and University Outcomes – Nuffield Foundation (nuffieldfoundation.org), published January 2022. ↩
-
Curriculum and Assessment Review Final Report – GOV.UK (www.gov.uk), published 5th November 2025. ↩
-
Introducing T Levels – House of Commons Committee of Public Accounts published 27th June 2025. ↩
-
Government response to the Curriculum and Assessment Review – GOV.UK (www.gov.uk), published November 2025. ↩
-
Curriculum and Assessment Review Final Report – GOV.UK (www.gov.uk), published 5th November 2025. ↩
-
Falling short: Understanding further falls in employer training – Learning and Work Institute (learningandwork.org.uk), published December 2025. ↩
-
Training and skills needs: Trends and challenges in UK growth sectors – Learning and Work Institute (learningandwork.org.uk), published 13th March 2026. ↩
-
NEET age 16 to 24, Department for Education and Department for Work and Pensions, March 2026. ↩
-
Machin, S., et al, Closing the Gap Between Vocational and General Education? - The Journal of Human Resources (jhr.uwpress.org), published 8th July 2025. ↩
-
Evaluation of the strengthening supported internship programme – GOV.UK (www.gov.uk), published 6th November 2024. ↩
-
Schall, C. et al, Competitive Employment for Transition-Aged Youth with Significant Impact from Autism: A Multi-site Randomized Clinical Trial, Journal of Autism and Developmental Disorders – Springer (springer.com), published 1st March 2019. ↩
-
Higher education student numbers – House of Commons Library (commonslibrary.parliament.uk), published 20th February 2026. ↩
-
Graduate labour market statistics, calendar year 2024 – GOV.UK (www.gov.uk), published 5th June 2025. ↩
-
Graduate outcomes: What the latest data reveals about employment, pay and job quality – Universities UK (universitiesuk.ac.uk), published 29th October 2025. ↩
-
Student loans issued to those studying at franchised higher education providers – House of Commons Committee of Public Accounts (https://committees.parliament.uk/committee/127/Public-Accounts-Committee/), published April 2024. ↩
-
Stansbury, A., Turner, D. and Balls, E., Tackling the UK’s regional economic inequality: binding constraints and avenues for policy intervention, Contemporary Social Science – Academy of Social Sciences (acss.org.uk), published 24th August 2023. ↩
-
Trends in young people not in education, employment or training (January – March 2025) – Youth Futures Foundation (youthfuturesfoundation.org), published May 2025. ↩
-
Not Working – Resolution Foundation (www.resolutionfoundation.org), Published June 2022. ↩
-
Our Children, Our Future – GOV.UK (www.gov.uk) published December 2025. ↩
-
The employment of disabled people 2025 – GOV.UK (www.gov.uk), published November 2025, updated 24th March 2026. ↩
-
The employment of disabled people 2025 – GOV.UK (www.gov.uk), published November 2025, updated 24th March 2026. ↩
-
Trends in young people not in education, employment or training - Youth Futures Foundation (youthfuturesfoundation.org), published May 2025. ↩
-
Not Working – Resolution Foundation (www.resolutionfoundation.org), published June 2022. ↩
-
NEET Primary Health Condition Estimates from the APS - GOV.UK (www.gov.uk), published 16th March 2026. ↩
-
Office for Health Improvement & Disparities, Estimated prevalence of severe mental illness in England: report, April 2026. ↩
-
Innocenti Report Card 19 – UNICEF (www.unicef.org), published 14th May 2025. ↩
-
Mental Health of Children and Young People in England 2023 - wave 4 follow up to the 2017 survey: Data tables – NHS England (www.england.nhs.uk), published November 2023. ↩
-
Understanding the impact of Covid-19 on young people across the UK: An evidence synthesis – Learning and Work Institute (www.learningandwork.org.uk/), published March 2023. ↩
-
Suleman Mehrunisha et al, Unequal pandemic, fairer recovery: The COVID-19 impact inquiry report - The Health Foundation (www.health.org.uk), published July 2021. ↩
-
Understanding drivers of recent trends in young people’s mental health – Youth Futures Foundation (www.youthfuturesfoundation.org), published July 2025. ↩
-
Independent review into mental health conditions, ADHD and autism: interim report - GOV.UK (www.gov.uk), published 31st March 2026. ↩
-
Independent review into mental health conditions, ADHD and autism: interim report - GOV.UK (www.gov.uk), published 31st March 2026. ↩
-
Independent review into mental health conditions, ADHD and autism: interim report - GOV.UK (www.gov.uk), published 31st March 2026. ↩
-
Sayal, Kapil, et al, Investigating inequalities in children and young people’s mental healthcare and outcomes: prospective longitudinal analysis from the STADIA trial – The British Journal of Psychiatry, published 27th April 2026. ↩
-
COVID Social Mobility and Opportunities Study - COSMO (www.cosmostudy.uk), published November 2023. ↩
-
Edbrooke-Childs, Julian and Pataly Praveetha, Ethnic Differences in Referral Routes to Youth Mental Health Services - Journal of the American Academy of Child and Adolescent Psychiatry, Volume 58, Issue 3 – PubMed (www.pubmed.ncbi.nlm.nih.gov), published March 2019. ↩
-
Racial disparities in mental health: Literature and evidence review – Race Equality Foundation (www.raceequalityfoundation.org.uk), published November 2022. ↩
-
For example, The impact of bariatric surgery on monthly employee pay and employee status, England: April 2014 to December 2022, Office for National Statistics, published October 2024. ↩
-
Fairer funding for General Practice in England – Nuffield Trust (www.nuffieldtrust.org.uk), published 12th December 2024. ↩
-
NHS GP Patient Survey 2025 National Report – NHS England (www.gp-patient.co.uk), published 10th July 2025. ↩
-
Children’s mental health services 2023-2024 – Children’s Commissioner (www.childrenscommissioner.gov.uk), published May 2025. ↩
-
Autism statistics – NHS England Digital (digital.nhs.uk) published 12th February 2026. ↩
-
Community health services waiting lists – NHS England (www.england.nhs.uk), published 2026. ↩
-
Waiting times for children and young people’s mental health services 2023-24 – NHS England (www.digital.nhs.uk), published 25th February 2025. ↩
-
Are we listening? A review of children and young people’s mental health services – Care Quality Commission (www.cqc.org.uk), published March 2018. ↩
-
Supported employment for adults with severe mental illness – Cochrane (www.cochrane.org), published 13th September 2013. ↩
-
Marsden, John, et al, Superiority and cost-effectiveness of Individual Placement and Support versus standard employment support for people with alcohol and drug dependence: a pragmatic, parallel-group, open-label, multicentre, randomised, controlled, phase 3 trial, eClinicalMedicine, published February 2024. ↩
-
Health-led Trials: Evaluation Synthesis Report – GOV.UK (www.gov.uk), published August 2023. ↩
-
The impact of NHS Talking Therapies on monthly employee pay and employment status, England: April 2014 to December 2022 – ONS (www.ons.gov.uk), published December 2024. ↩
-
NHS Talking Therapies Annual Interactive Dashboard – NHS England (www.digital.nhs.uk), published 25th September 2025. ↩
-
Economic and fiscal outlook, November 2023 – OBR (www.obr.uk), published November 2023. ↩
-
Saunders, Rob, Suh, Jae Won, Buckman Joshua et al, Effectiveness of psychological interventions for young adults versus working age adults: a retrospective cohort study in a national psychological treatment programme in England, The Lancet Psychiatry, Volume 12, Issue 9 – The Lancet (www.thelancet.com), published September 2025. ↩
-
Independent Investigation of the National Health Service in England, September 2024 – GOV.UK (www.gov.uk), published September 2024. ↩
-
Share of all NHS spending on mental health services for children and young people, compared with the share of people in contact with mental health services who are aged 0-18: Young People and Work Interim Report: Analytical Annex. ↩
-
Statement on NHS Mental Health Spending 2026-27, House of Commons Written Statements, HCWS1397. UK Parliament House of Commons, 2026. ↩
-
Analysis of mental health workforce supporting children and young people (CYP). Young People and Work Interim Report: Analytical Annex. ↩
-
Analysis of mental health workforce supporting children and young people (CYP). Young People and Work Interim Report: Analytical Annex. ↩
-
Transforming Children and Young People’s Mental Health Implementation Programme – GOV.UK (www.gov.uk), published May 2025. ↩
-
Children’s mental health services 2023-2024 – Children’s Commissioner (www.childrenscommissioner.gov.uk), published May 2025. ↩
-
Inequities in Access to Children and Young Peoples Mental Health Services in the Midlands – The Strategy Unit (www.strategyunitwm.nhs.uk), published July 2021. ↩
-
Fit Notes Issued by GP Practices, England, December 2025 , official statistics – NHS England (www.digital.nhs.uk), published April 2026. ↩
-
[Young People and Work Interim Report: Analytical Annex) ↩
-
Survey of healthcare professionals. Full research report to follow publication. See accompanying Analytical Annex. ↩
-
Enhancing referrals to Child and Adolescent Mental Health Services: the EN-CAMHS mixed-methods study – NIHR (www.journalslibrary.nihr.ac.uk), published June 2025. ↩
-
Are we listening? Review of children and young people’s mental health services, qualitative analysis – Care Quality Commission (www.cqc.org.uk), published March 2018. ↩
-
Healthcare Transition Report 2024 – 2025 – Barnardos (www.barnardos.org.uk), published 4th April 2025. ↩
-
State of Care 2024/25 - CQC (www.cqc.org.uk), published 24th October 2025. ↩
-
Investigation report: Transition from child and adolescent mental health services to adult mental health services – Health Services Safety Investigations Body (www.hssib.org.uk), published 15/11/2021. ↩
-
Survey of healthcare professionals. See accompanying Analytical Annex. ↩
-
Keep Britain Working: Final Report- GOV.UK (www.gov.uk), published 5 November 2025. ↩
-
Keep Britain Working: Final Report- GOV.UK (www.gov.uk), published 5 November 2025. ↩
-
Fit for the future: 10 Year Health Plan for England – GOV.UK (https://www.gov.uk/, published 3rd July 2025. ↩
-
Funding boost to support patients to stay in and return to work – GOV.UK (www.gov.uk), published 25th February 2026. ↩
-
Expansion of support scheme to help thousands of people back into work – GOV.UK (www.gov.uk), published 20th January 2026. ↩
-
Thousand more young people to get training and work support as Government extends £45 million scheme – GOV.UK (www.gov.uk), published 21 August 2025. ↩
-
Hidden NEETs in England. Young People and Work Interim Report: Analytical Annex. ↩
-
Hidden NEETs in England. Young People and Work Interim Report: Analytical Annex. ↩
-
Participation outcomes for health and disability benefit claimants aged 16 to 24 years old. Young People and Work Interim Report: Analytical Annex. ↩
-
Lost in transition An examination of why the UK NEET rate is high and rising - Resolution Foundation (www.resolutionfoundation.org/), published 28 April 2026. ↩
-
Work aspirations and support needs of health and disability customers: A focus on young people – DWP. ↩
-
Survey of young people NEET. See accompanying Analytical Annex. ↩
-
Case study of UC health and PIP claimant with average rent. Young People and Work Interim Report: Analytical Annex. ↩
-
Estimated spend on 16- to 24-year-olds across PIP, DLA, ESA, JSA and Universal Credit, 2024/25. Young People and Work Interim Report: Analytical Annex. ↩
-
Employment support and welfare spend: Young People and Work Interim Report: Analytical Annex. ↩
-
Employment support and welfare spend: Young People and Work Interim Report: Analytical Annex. ↩
-
Child DLA caseloads by age: Young People and Work Interim Report: Analytical Annex. ↩
-
A level and other 16 to 18 results – Department for Education (www.gov.uk ), accessed 7 May 2026. ↩
-
Support for children with disabilities and special educational needs – IFS (ifs.org.uk), Published 2025. ↩
-
Composition of PIP caseload: PIP new claims v former Child DLA claims, February 2025. Young People and Work Interim Report: Analytical Annex. ↩
-
Analysis of benefit claims for young people aged 16–24 who started their original claim to a health and disability benefit in 2019. Young People and Work Interim Report: Analytical Annex. ↩
-
The short- and long-run effects of the Education Maintenance Allowance – IFS (ifs.org.uk), Published February 2025. ↩
-
Into work rates based on average into work rate for Sept - Nov 2024 inclusive. Young People and Work Interim Report: Analytical Annex. ↩
-
UC Health Caseload, December 2025 - DWP (Stat-Xplore.dwp.gov.uk), accessed 28 April 2026. ↩
-
Fit Notes issued by GP Practices, England, December 2025 – GOV.UK (www.gov.uk), published 23 April 2026. ↩
-
Lost in transition: An examination of why the UK NEET rate is high and rising - Resolution Foundation (https://www.resolutionfoundation.org/), published 28 April 2026. ↩
-
Work aspirations and support needs of health and disability customers: Final findings report – DWP (GOV.UK), published 17 July 2025. ↩
-
Duration of health and disability benefit claims. Young People and Work Interim Report: Analytical Annex. ↩
-
PIP caseloads 16 to 24 by education or employment status, March 2024. Young People and Work Interim Report: Analytical Annex. ↩
-
Employment outcomes for PIP claimants, Young People and Work Interim Report: Analytical Annex. ↩
-
PIP caseloads 16 to 24 by education or employment status, March 2024. Young People and Work Interim Report: Analytical Annex. ↩
-
Not working on UC health from: UC Health Caseload, December 2025 - DWP, accessed 28 April 2026. Not working on PIP only from: PIP caseloads 16 to 24 by education or employment status, March 2024. Young People and Work Interim Report: Analytical Annex. ↩
-
People on Universal Credit Statistics March 2026 - DWP (Stat-Xplore.dwp.gov.uk), accessed 5 May 2026. ↩
-
Universal Credit Survey, data on Young People. Young People and Work Interim Report: Analytical Annex. ↩
-
Supporting people to work through jobcentres – NAO (NAO.org.uk). Published 31 March 2025. ↩
-
Youth Offer process evaluation – DWP (GOV.UK), published 7 October 2024. ↩
-
Benefit and pension rates 2026 to 2027 – DWP (GOV.UK), published 16 February 2026. ↩
-
Welfare Trends Report, October 2024 – OBR (OBR.uk), published March 2024. ↩
-
Caseload numbers from: UC Health Caseload, December 2025 - DWP (Stat-Xplore.dwp.gov.uk), accessed 28 April 2026. ↩
-
Work aspirations and support needs of health and disability customers: A focus on young people. See accompanying analytical annex. ↩
-
Work aspirations and support needs of health and disability customers: Final findings report – DWP (GOV.UK), published 17 July 2025. ↩
-
Conditions reported at WCA. Young People and Work Interim Report: Analytical Annex. ↩
-
Caseload data from PIP: Cases with entitlement - DWP (Stat-Xplore - Home), accessed 23 April 2026. ↩
-
Whitley, Rob, Palmer, Victoria and Gunn Jane, Recovery from severe mental illness, CMAJ, 2015 Sep 22;187(13), published September 2015. ↩
-
Independent review into mental health conditions, ADHD and autism: interim report – GOV.UK (www.gov.uk), published 31 March 2026. ↩
-
Welfare Trends Report, October 2024 – OBR (OBR.uk), published March 2024. ↩
-
Outstanding WCA reassessments. Young People and Work Interim Report: Analytical Annex. ↩
-
Health and Disability Benefits: Improve operations by increasing face-to-face assessments, increasing WCA reassessment capability, and PIP award review changes, starting from April 2026 costing. Budget 2025 Policy Costings – HMT (gov.uk), published November 2025. ↩
-
Welfare Trends Report, October 2024 – OBR (OBR.uk), published March 2024. ↩
-
2025 data: UC WCA Decision Outcomes – DWP (stat-xplore.dwp.gov.uk), accessed 05/05/2026. Data for initial assessments only. 2010 data: ESAWCA by date of decision- DWP (stat-xplore.gov.uk), accessed 05/05/2026 Data for initial assessments only. ↩
-
Duration on health and disability benefits. Young People and Work Interim Report: Analytical Annex. ↩
-
Into work flow rates by conditionality group. Young People and Work Interim Report: Analytical Annex. ↩
-
Evidence on Long-Term Outcomes for Health & Disability Benefit Claimants. Young People and Work Interim Report: Analytical Annex. ↩
-
Evidence on Long-Term Outcomes for Health & Disability Benefit Claimants. Young People and Work Interim Report: Analytical Annex. ↩
-
Estimated spend on 16- to 24-year-olds for PIP and UC, 2024/25. Young People and Work Interim Report: Analytical Annex. ↩
-
PIP caseload and expenditure forecasts for young people: Young People and Work Interim Report: Analytical Annex. and National population projections: 2024-based, ONS, published 28 April 2026 ↩
-
PIP caseload and expenditure forecasts for young people: Young People and Work Interim Report: Analytical Annex. ↩
-
Family Resources Survey: financial year 2024 to 2025 – DWP (GOV.UK), published 26 March 2026. ↩
-
Support for children with disabilities and special educational needs, IFS, published October 2025. and Growing pressures: Exploring trends in children’s disability – Resolution Foundation, published 17 August 2024. ↩
-
PIP reassessment outcomes for Child DLA Claimants: Young People and Work Interim Report: Analytical Annex. ↩
-
Outturn and forecast tables: Autumn Budget 2025 – DWP (gov.uk), published 29 January 2026. ↩
-
Health-related benefit claims post-pandemic: UK trends and global context – IFS (ifs.org.uk), published September 2024. ↩
-
PIP caseload and expenditure forecasts for young people: Young People and Work Interim Report: Analytical Annex. ↩
-
LCWRA caseload and expenditure forecasts for young people: Young People and Work Interim Report: Analytical Annex. and National population projections,2024-based, ONS, published 28 April 2026. ↩
-
Pathways to Work Commission Report - Barnsley Council (www.barnsley.gov.uk), published July 2024. ↩
-
Pathways to Work Commission Report - Barnsley Council (www.barnsley.gov.uk), Published July 2024. ↩
-
Calendar year 2024, Participation in education, training and employment age 16 to 18, GOV.UK, published 26 June 2025 ↩
-
Calendar year 2025, NEET age 16 to 24 – GOV.UK (www.gov.uk), published 12 March 2026 and updated 26 March 2026 ↩
-
Registering and reporting an unauthorised absence, Inspectorate of Education, Government of the Netherlands ↩
-
Beyond the Brink? The state of funding for youth services, YMCA, published January 2025 ↩
-
Villa, Carmen, The effects of youth clubs on education and crime - Institute for Fiscal Studies, published 11 November 2024 ↩
-
Summary: Impact evaluation of the European Social Fund 2014-2020 programme in England, published 14 February 2025 ↩
-
UK Shared Prosperity Fund monitoring returns. Young People and Work Interim Report, Analytical Annex. ↩
-
Skills Development Scotland, 16+ Participation Portal. Further information ↩
-
Frontline workers and local communities to play crucial role in delivery of Government missions – GOV.UK (www.gov.uk). ↩
-
The Home learning environment and attainment: A research report - GOV.UK (www.gov.uk), published August 2025. ↩
-
Academic year 24/25, Participation in education, training and NEET age 16 to 17 by local authority – GOV.UK (www.gov.uk), published 17 July 2025 ↩
-
Children’s Mental Health Services 2023-2024 – Children’s Commissioner for England (www.childrenscommissioner.gov.uk), published May 2025 ↩
-
Children’s Mental Health Services 2021-22 – Children’s Commissioner for England (www.childrenscommissioner.gov.uk), Published March 2023 ↩
-
Hidden NEETs in England. Young People and Work Interim Report: Analytical Annex. ↩
-
False Starts: What the UK’s growing NEET problem really looks like, and how to fix it – Resolution Foundation (www.resolutionfoundation.org), published October 2025 ↩
-
Summary: DWP employer survey 2024 – GOV.UK (www.gov.uk), published 16 May 2025 ↩
-
Annual estimates from the Labour Force Survey of young people aged 16 to 24 not in education, employment or training (NEET) in England, 12 March 2026, “Looking after family and home” as proxy. ↩
-
GCSE outcomes in England - Ofqual (analytics.ofqual.gov.uk), published 2025. ↩
-
Department for Education, Absence rates by geographic level for Special, State-funded primary and State-funded secondary in England between 2017/18 and 2024/25. Published 14 May 2026.(‘Absence rates by geographic level’ from ‘Pupil absence in schools in England’, Permanent data table - Explore education statistics - GOV.UK) ↩
-
Population estimates for England and Wales: mid-2024, ONS (www.ons.gov.uk), published 30 July 2025. ↩
-
Hunger in the UK, Trussell Trust (trussell.org.uk), published September 2025. ↩
-
Debt’s early grip: The challenges facing young adults , StepChange Debt Charity (stepchange.org), published November 2024. ↩
-
Centre for Longitudinal Studies, Early family transitions – Initial findings from the Millenium Cohort Study at Age 23, February 2026. ↩
-
Tosi, Marco, Boomerang kids and parents’ well-being: adaptation, stressors, and social norms - ISER (www.iser.essex.ac.uk), published 15 June 2020 ↩
-
Wellbeing guidance for appraisal - supplementary Green Book guidance - GOV.UK (www.gov.uk), published July 2021 ↩
-
Feng, Z., Ralston, K., Everington, D., Dibben, C. (2017). Long term health effects of NEET experiences: evidence from a longitudinal analysis of young people in Scotland. International Journal of Population Data Science (ijdps.org. Published April 2017. ↩
-
Gianni De Fraja, Sara Lemos, James Rockey: The Wounds That Do Not Heal: The Lifetime Scar of Youth Unemployment, Economica, published August 2021. ↩
-
Paul Gregg & Emma Tominey, “The Wage Scar from Youth Unemployment.”. The Centre for Market and Public Organisation, University of Bristol (bristol.ac.uk). ↩
-
Learning and Work Institute, Young people who are not in education, employment, or training – what does the data tell us? Published April 2025. ↩
-
Duration since last job or full-time education for those not in education, employment or training. Young People and Work Interim Report: Analytical Annex. ↩
-
Young people who are not in education, employment, or training – what does the data tell us? Learning and Work Institute (learningandwork.org.uk), published April 2025. ↩
-
Nominal and Real Regional Gross Value Added (Balanced by Industry) - Office for National Statistics 2023, published 17 April 2025. ↩
-
The Economic and Social Costs of Mental Ill Health, Centre for Mental Health (www.centreformentalhealth.org.uk), published March 2024. ↩
-
Health Equals. A vicious cycle: young people out of education, employment or training, March 2026. ↩
-
Thomson, Rachel M, et al, To what extent does income explain the effect of unemployment on mental health? Mediation analysis in the UK Household Longitudinal Study, published 2022. ↩
-
Fiscal risks and sustainability – July 2023, Office for Budget Responsibility (obr.uk), published July 2023. ↩
-
University of Manchester, Young people in UK’s poorest households three times more likely to be NEET, ↩
-
Human costs and lost potential: The real cost of youth homelessness, Centrepoint (www.centrepoint.org.uk), published 2023. ↩
-
Karyda, Magdalini, The influence of neighbourhood crime on young people becoming not in education, employment or training, published 13 January 2020. ↩
-
Rahmani, Hamed, Groot, Wim and Rahmani, Amir Mohammad, Unravelling the NEET phenomenon: a systematic literature review and meta-analysis of risk factors for youth not in education, employment, or training, published 24 March 2024. ↩
-
The Costs of Crime – And How to Reduce Them, published 2025. ↩
-
Local Authority Funding for Youth Services Sees Biggest Annual Cut in Almost a Decade, New YMCA Analysis Reveals, YMCA (ymca.or.uk), published February 2026. ↩
-
Annual report on education spending in England 2025-26, IFS (www.ifs.org.uk), published 21st January 2026. ↩
-
Annual report on education spending in England 2025-26, IFS (www.ifs.org.uk), published 21st January 2026. ↩
-
Young people not in education, employment or training (NEET) - Office for National Statistics (www.ons.gov.uk), published 26 February 2026 ↩
-
Trends in young people not in education, employment or training January -March 2025 – Youth Futures Foundation (youthfuturesfoundation.org), published May 2025. ↩
-
Youth not in employment, education or training (NEET) indicator – OECD (www.oecd.org/en.html), published 2026. ↩
-
Mental Health of Children and Young People in England 2023 - wave 4 follow up to the 2017 survey: Data tables – NHS England (www.england.nhs.uk), published 21 November 2023. ↩
-
Pupil absence in schools in England – GOV.UK (www.gov.uk), published 26 March 2026. ↩
-
Special educational needs in England - GOV.UK (www.gov.uk), published 12 June 2025. ↩
-
Family Resources Survey: financial year 2024 to 2025, disability data tables – GOV.UK (www.gov.uk), published 26 March 2026. ↩
-
NEET Primary Health Conditions Estimates from the APS – GOV.UK (www.gov.uk), published March 2026. ↩
-
People on Universal Credit Statistics February 2026 - DWP (Stat-Xplore.dwp.gov.uk), accessed 28 April 2026. ↩
-
UC Health Caseload, December 2025 - DWP (Stat-Xplore.dwp.gov.uk), accessed 28 April 2026. ↩
-
PIP Cases With Entitlement since 2019, January 2026 - DWP (Stat-Xplore.dwp.gov.uk ) . Accessed 28th April 2026. ↩
-
Education and employment status of PIP claimants: Young People and Work Interim Report: Analytical Annex. ↩
-
Flows into work from, Into work flow rates by conditionality group. Young People and Work Interim Report: Analytical Annex.; Caseload numbers from: UC Health Caseload, December 2025, DWP, accessed 28 April 2026. ↩
-
Access to Work statistics: April 2007 to March 2025 (www.gov.uk/), published 14 October 2025. Available at: https://www.gov.uk/government/statistics/access-to-work-statistics-april-2007-to-march-2025 ↩