Weekly statistics for NHS Test and Trace (England): 28 January to 3 February 2021
Published 11 February 2021
Applies to England

© Crown copyright 2021
This publication is licensed under the terms of the Open Government Licence v3.0 except where otherwise stated. To view this licence, visit nationalarchives.gov.uk/doc/open-government-licence/version/3 or write to the Information Policy Team, The National Archives, Kew, London TW9 4DU, or email: psi@nationalarchives.gov.uk.
Where we have identified any third party copyright information you will need to obtain permission from the copyright holders concerned.
This publication is available at https://www.gov.uk/government/publications/nhs-test-and-trace-england-statistics-28-january-to-3-february-2021/weekly-statistics-for-nhs-test-and-trace-england-28-january-to-3-february-2021
Main points
People tested, England
148,809 people tested positive for coronavirus (COVID-19) at least once[footnote 1] in England between 28 January and 3 February 2021, a 24% decrease compared to the previous week. This continues the decrease in positive cases observed in the previous 3 weeks.
3,064,494 people were tested at least once between 28 January and 3 February 2021 for COVID-19,[footnote 1] a 7% increase compared to the previous week.
Pillar 2 testing turnaround times, England
Turnaround times for pillar 2 (virus testing for the wider population) for all in-person testing routes have become shorter overall since the beginning of December 2020. In the most recent week, 86.2% of in-person tests were received within 24 hours compared to 82.7% in the previous week.
Turnaround times for satellite and home tests have decreased over the last 4 weeks.
Distance to in-person testing sites for booked tests, pillar 2, England
The median distance to in-person testing sites (pillar 2) for booked tests decreased to 2.0 miles. There was an increase in mid-December 2020, however this has decreased over the last 6 weeks.
Positive cases transferred to NHS Test and Trace
149,317 cases were transferred to the contact tracing system between 28 January and 3 February 2021, a decrease of 25% compared to the previous week. The number of cases transferred to the contact tracing system has been decreasing for the last 4 weeks.
Of the cases transferred to the contact tracing system between 28 January and 3 February 2021, 87.0% were reached and asked to provide information about their recent close contacts. This has remained broadly consistent over the past 3 months.
Close contacts identified by NHS Test and Trace
Between 28 January and 3 February 2021, 264,577 people[footnote 2] were identified as coming into close contact with someone who had tested positive between 14 January and 20 January 2021. The number of close contacts identified has decreased in the last 4 weeks.
For those where communication details were available, 96.5% of close contacts were reached and told to self-isolate in the most recent week. Taking into account all contacts identified, 93.5% were reached in the most recent week.
Publication updates
Last week we launched a user survey to collect views on the NHS Test and Trace statistics and influence further development. We welcome all our users to take part.
This week we are publishing statistics on the percentage of contacts reached within 3 days of the case that reported them taking their test, as well as the median time for cases that were reached from when the case first observed coronavirus symptoms.
We have also published a new statistical commentary for rapid testing in England, which can be found on the weekly collection page.
The number of times the NHS COVID-19 app has been downloaded and the number of QR posters that have been generated through the GOV.UK coronavirus QR poster service are now available on the NHS COVID-19 app support website. These statistics will no longer be published in this bulletin.
Introduction
The Department for Health and Social Care (DHSC) publishes weekly statistics on NHS Test and Trace (England) across all 4 testing pillars. The purpose of this publication is to provide a weekly update on the implementation and performance of NHS Test and Trace in England.
For NHS Test and Trace (England), this includes:
Testing
- people tested for coronavirus (COVID-19)
- people testing positive for coronavirus (COVID-19)
- time taken for test results to become available
- distance travelled to take a test in-person
Contact tracing
- people transferred to the contact tracing system, and the time taken for them to be reached
- close contacts identified, and the time taken for them to be reached
Data collected for NHS Test and Trace is primarily for operational purposes and was not designed to track the spread of the virus. Studies into the spread of the virus in the UK are carried out by the Office for National Statistics (ONS). Further guidance can be found in comparing methods used in the COVID-19 Infection Survey and NHS Test and Trace, England.
A list of data sources relating to the coronavirus pandemic in the UK can be found at coronavirus (COVID-19) statistics and analysis. A breakdown of all available testing and contact tracing data in the UK can be found at testing and contact tracing in the UK: summary of data.
All data used in the report can be found in the NHS Test and Trace data tables on the weekly collection page. A full explanation of the data sources and methods used to produce these statistics can be found in the NHS Test and Trace statistics methodology.
Revisions to figures previously published
Figures given in previous releases are routinely revised for:
- people tested for coronavirus
- people testing positive for coronavirus
- pillar 2 testing turnaround times
- distance to in-person test sites
- contact tracing
Figures for pillar 1 testing turnaround times are not routinely revised as only minor changes occur to past weeks post publication. Figures are only revised when substantial changes occur. More detail on routine revisions is given in the quality section.
Note that these routine revisions to data includes the local authority level contact tracing data that is made available on the weekly collection page. As past data is revised, subtracting figures given in the previous week from figures given in the current week will not give the total number of cases for that week.
NHS Test and Trace
NHS Test and Trace was launched in England on 28 May 2020 and ensures that anyone who develops symptoms of coronavirus (COVID-19) can quickly be tested to find out if they have the virus. It then helps trace recent close contacts of anyone who tests positives for coronavirus and, if necessary, notifies them that they must self -isolate at home to help stop the spread of the virus. The flow of how people move through the NHS Test and Trace service is shown in Figure 1 below. More information about NHS Test and Trace can be found at NHS Test and Trace: how it works.
Testing in England
NHS Test and Trace starts with an individual taking a swab test for the virus, either in pillar 1 (testing in hospitals and outbreak locations), pillar 2 (national swab testing) or pillar 4 (prevalence studies). Those who go on to test positive will have their case transferred to NHS Test and Trace for contact tracing.
From 27 January, individuals who test positive from LFD and PCR tests will be transferred to contact tracing[footnote 3]. Prior to this only individuals with positive PCR tests were sent to contact tracing as those with positive LFD tests were previously instructed to take a confirmatory PCR test. More information is given in the NHS Test and Trace statistics methodology.
NHS Test and Trace is for England only, therefore the figures in this section are given for England. Weekly figures for UK testing are available to download from the weekly collection page and are also available daily on the coronavirus in the UK dashboard. Information on contact tracing in Scotland, Wales and Northern Ireland can be found directly from Public Health Scotland, the Welsh government and the Northern Ireland Public Health Agency.
Figure 1: flowchart showing how people move through NHS Test and Trace
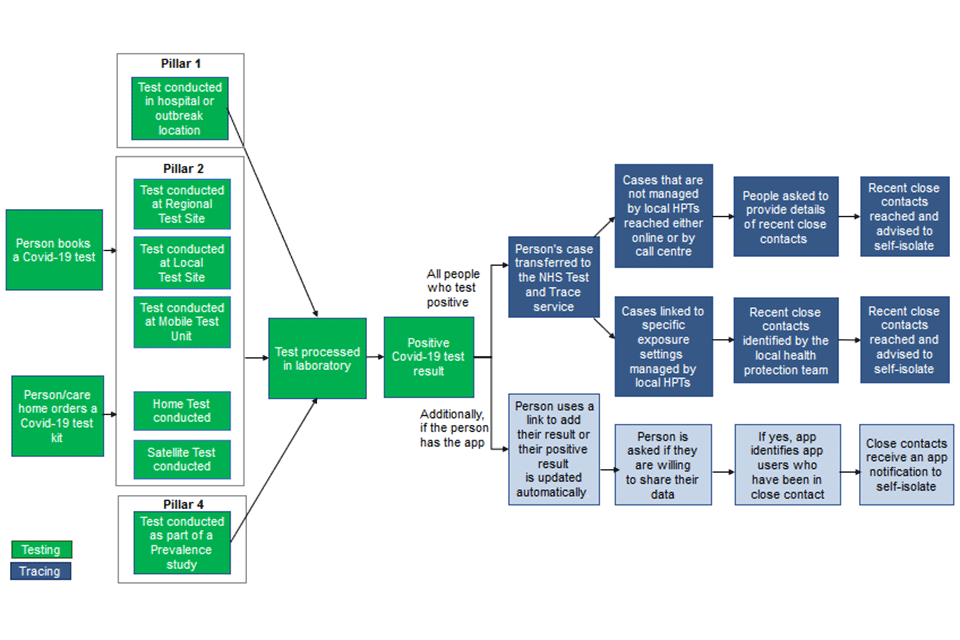
The diagram shows the journey a person can take through NHS Test and Trace. For pillar 1, this starts with a person having a coronavirus test in hospital. For pillar 2, this starts with a person booking or ordering a coronavirus test. Pillar 2 tests can be either be conducted at a regional test site or mobile test unit; or a satellite or home test can be conducted. For pillar 4, this starts with a person having a coronavirus test as part of a prevalence study. After tests have been taken, they are sent to a laboratory for processing. Once processed, a person will be emailed or texted their result.
If a person has a positive COVID-19 test result, then their case is transferred to NHS Test and Trace and can be managed in one of 2 ways. First, cases that are not managed by local health protection teams (HPTs) are reached either online or by a call centre. They are then asked to provide details of recent close contacts. These recent close contacts are then reached by NHS Test and Trace and advised to self-isolate. Second, cases that are linked to certain exposure settings are escalated to local HPTs who work to identify and reach recent close contacts and advise them to self-isolate.
Additionally, if the person has the app and used the app to book their test, their positive result is updated automatically. If they have the app but booked their test via a different route then they can use a link to add their positive result to the app. Once their positive result is entered into the app, the person is asked if they are willing to share their data and if they say yes, the app identifies other app users who have been in close contact with the person who has tested positive. Close contacts then receive an app notification to self-isolate.
People tested and people testing positive, England
The headline figures reported in this publication for people tested and people testing positive include both lateral flow device (LFD) tests and polymerase chain reaction (PCR) tests, deduplicated for each reporting week. Information on the differences between these types of tests can be found in the NHS Test and Trace statistics methodology.
From 7 January 2021, positivity rate is not calculated as part of this publication but can instead be found on the coronavirus in the UK dashboard for PCR only positive cases in England. This is because the figures in this publication include both PCR and LFD tests and it is likely that LFD tests have a different positivity rate to PCR tests due to the use of LFDs in rapid testing. As the number of LFD tests conducted is increasing over time, a consistent positivity rate cannot be calculated using these figures.
The number of tests conducted, broken down for LFD and PCR tests, remains available on the weekly collection page. In addition, this week a new statistical commentary on rapid testing in England has been published. This is also available on the weekly collection page.
The number of people tested and number of people testing positive via PCR tests in each reporting week, by age, gender and local authority is also available on the weekly collection page.
Between 28 January and 3 February 2021, 3,064,494 people were tested for coronavirus (COVID-19) at least once in the reporting week,[footnote 4] a 7% increase compared to the previous week.
The number of people tested each week has generally been increasing since reporting began. This week, 85% more people were tested compared to the week ending 2 December 2020.
Since Test and Trace launched at the end of May 2020, 21,797,140 people have been tested for coronavirus (COVID-19) at least once.[footnote 5]
Figure 2: number of people tested for COVID-19 in each reporting week by pillar, England
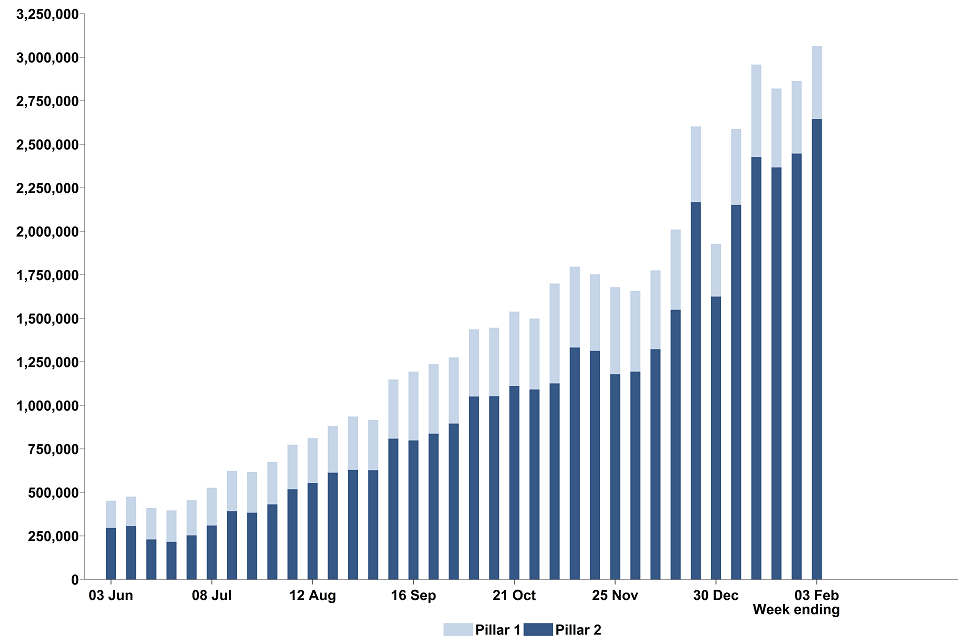
This data can be found in the ‘table 1’ tab of the ‘NHS Test and Trace statistics, 28 May 2020 to 3 February 2021: data tables’ document on the weekly collection page.
Between 28 January and 3 February 2021, 148,809 people tested positive.[footnote 6] The number of positive cases has decreased in the last 4 weeks since 6 January.
The number of people testing positive between 28 January and 3 February 2021 decreased by 24% compared to the previous week. This continues the decrease in positive cases reported in the previous 3 weeks. However, the most recent week saw 52% more people testing positive than there were in the week ending 2 December 2020.
Figure 3: number of people testing positive for COVID-19 in each reporting week by pillar, England
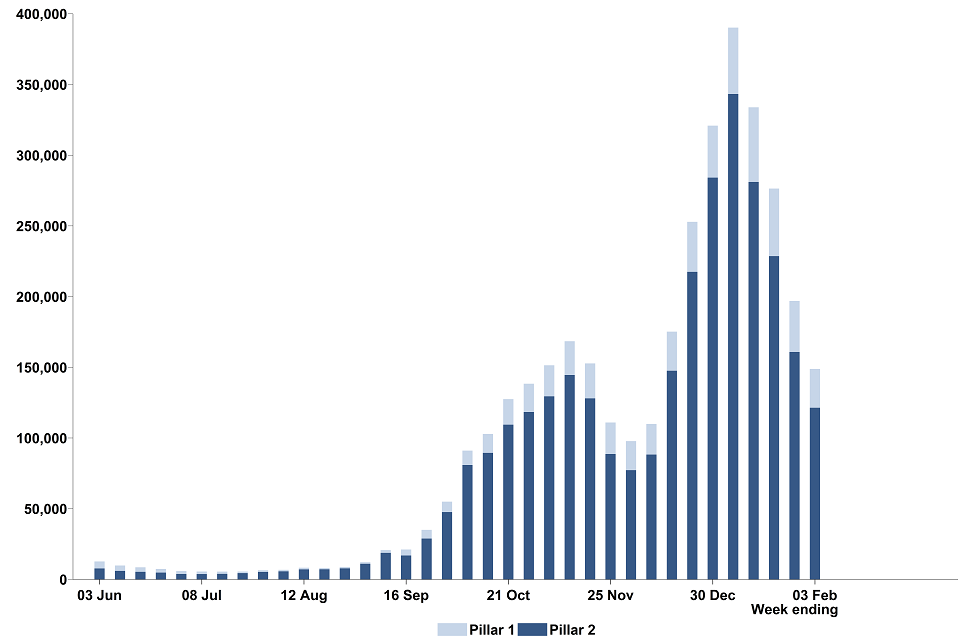
This data can be found in the ‘table 1’ tab of the ‘NHS Test and Trace statistics, 28 May 2020 to 3 February 2021: data tables’ document on the weekly collection page.
Pillar 1 testing turnaround times, England
Some pillar 1 tests are conducted in a hospital setting, and it is therefore not practical for those administering the tests to record the exact time that a test was taken. Therefore, the time taken to receive a coronavirus (COVID-19) test result is measured from the time that a test is received by a laboratory for processing to the time when the results are published to the Laboratory Information Management System (LIMS).
The total tests given in figures for pillar 1 turnaround times is not the same as the number of tests processed in pillar 1 as study samples and tests from private laboratories do not report data on turnaround times. This data is only available from 9 July 2020. More details can be found in the NHS Test and Trace statistics methodology.
Over 19 out of 20 pillar 1 test results were made available within 24 hours of the laboratory receiving the test.
Between 28 January and 3 February 2021, 96.6% of pillar 1 test results were made available within 24 hours. This has remained broadly consistent since Test and Trace began.
Pillar 2 testing turnaround times, England
There are various routes for getting tested within pillar 2 (national swab testing). Data on the time taken to receive a COVID-19 test result for pillar 2 is split up to reflect this, as this impacts on the turnaround times.[footnote 7] These routes include:
- regional test sites, which includes drive-through testing centres
- local test sites,[footnote 8] which are similar to regional test sites but specifically for walk ups
- mobile testing units, which travel around the UK to increase access to COVID-19 testing. They respond to need, travelling to test people at specific sites including care homes, police stations and prisons
- satellite test centres, which includes test kits provided directly to ‘satellite’ centres at places like care homes or hospitals that have a particularly urgent or significant need
- home test kits, which are delivered to someone’s door so they can test themselves and their family without leaving the house
LFD tests have been made available to some individuals from 21 October 2020. These tests are not included in this section on turnaround times.
Turnaround times are measured and reported in 2 ways, time taken from booking a test and from taking a test to receiving a test result. More information on these definitions is in the terminology section. Both measures are now reported as the median turnaround time, in addition to the usual turnaround time windows, such as within 24 hours. All these measures are available in full in the accompanying data tables, however only time from taking a test is discussed below.
The total tests reported for pillar 2 turnaround times is not the same as the number of tests processed in pillar 2 as test processed is available for the UK (rather than for England only). In addition, they are reporting on the number of tests at different stages in the process. Further detail is given in the NHS Test and Trace statistics methodology.
After someone takes a test, it is transported to a laboratory for processing. There are normal fluctuations in this operational process which can sometimes cause the time taken to receive a test result to go over 24 hours, but still be turned around the next day. Where appropriate therefore we also provide the number of tests turned around the day after a test was taken.
Satellite tests are predominantly used by care homes who need greater control and flexibility over when test kits are collected. For example, tests may be conducted over multiple days with a collection scheduled a few days later. Home test kits take time to be posted to a person and be couriered back to the lab. Consequently, a low proportion of home and satellite test results will be available within 24 hours of the test being taken.
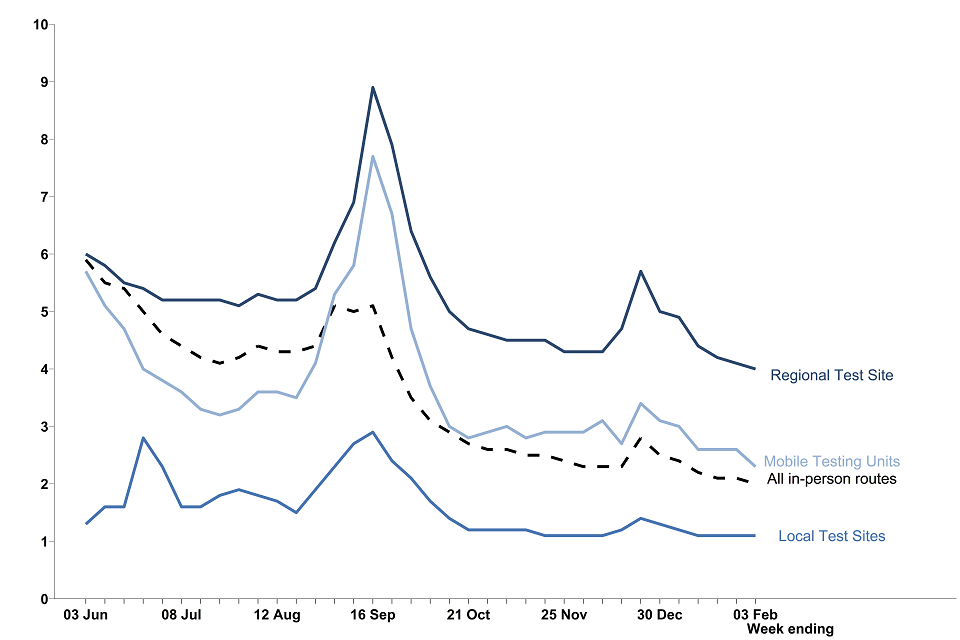
The median time to receive a test result after taking a test in-person gradually decreased since mid-December 2020. Prior to this, between late November 2020 and mid-December 2020 the median time had been steadily increasing.
The median time taken to receive a test result for in-person tests (regional tests sites, local tests sites and mobile testing units) decreased from mid-December to the most recent week.
Between 28 January and 3 February 2021, the median time taken to receive a test result for regional test sites decreased to 17 hours, from 18 in the previous week. The median time for local test sites decreased to 19 hours from 20 hours and mobile testing units stayed the same at 17 hours during the same period.
The median time to receive a test result after taking a test for home testing kits and satellite test centres has decreased again in the latest week.
The median time taken to receive a test result for home testing kits and satellite test centres gradually increased between the end of November 2020 and mid-December 2020. From the start of January 2021, the median time taken has been decreasing.
Compared with the end of November 2020, the median time taken to receive a test result from satellite test centres has decreased from 41 hours to 34 hours in the latest week, a decrease from 35 hours in the previous week. The median time for home testing kits has decreased from 37 hours at the end of November 2020 to 34 hours in the latest week, a decrease from 35 hours in the previous week.
Figure 4: median time (hours) from taking a test to receiving test results by route, England
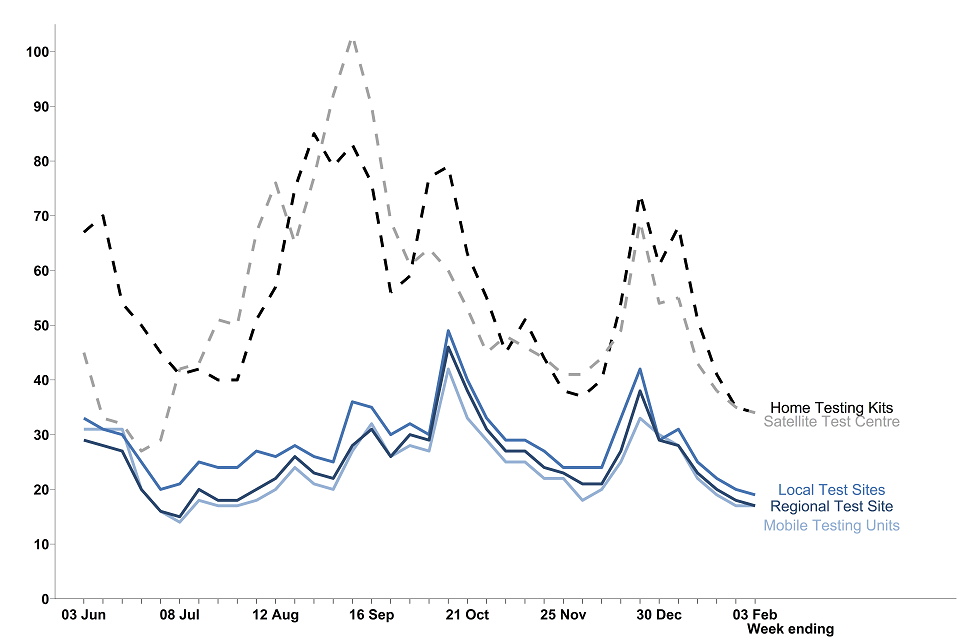
This data can be found in the ‘table 8’ tab of the ‘NHS Test and Trace statistics, 28 May 2020 to 3 February 2021: data tables’ document on the weekly collection page.
The percentage of test results received within 24 hours for in-person tests and within 48 hours for home testing kits and satellite test centres have both increased in the latest week.
In the most recent week, for in-person tests (local test sites, mobile testing units and regional test sites), 86.2% were received within 24 hours. The percentage of results received within 24 hours decreased between the end of November 2020 and mid-December 2020 but has since increased overall.
79.8% of test results were received within 48 hours for home test kits and satellite test centres, compared to 77.4% in the previous week. For all routes combined, 40.5% of tests from all test sites were received within 24 hours of a test being taken compared to 38.0% in the previous week. If we consider the day the test was taken, 97.6% of in-person tests results were received the next day after the test was taken and for all routes combined this was 67.7%.
For satellite test centres, 94.9% were received within 72 hours compared to 95.6% in the previous week. 96.0% of satellite tests were received within 3 days after the day they were taken. In the most recent week, approximately 95% of tests from satellite test centres were care home tests and removing the 5% of tests from other sites does not substantially change the turnaround figures.
Table 1: percentage of results received within 24 hours (in-person tests) or within 48 hours (home and satellite tests), by route, England
| 21 Jan to 27 Jan 2021 | 28 Jan to 3 Feb 2021 | Since Test and Trace launched: 28 May 2020 to 3 Feb 2021 | |
|---|---|---|---|
| Regional test sites within 24 hours | 86.9 | 89.3 | 47.8 |
| Local test sites within 24 hours | 76.2 | 82.9 | 35.5 |
| Mobile testing units within 24 hours | 88.3 | 88.0 | 50.4 |
| Satellite test centres within 48 hours | 80.1 | 81.5 | 43.2 |
| Home testing kits within 48 hours | 72.1 | 76.4 | 38.1 |
Distance to in-person testing sites for booked tests, pillar 2, England
The distance to testing sites for booked tests is calculated as the direct distance between the approximate centre of a person’s postal district and their chosen test location in straight line. This is reported as the median and associated percentiles for those who successfully booked a test at regional test sites, local test sites and mobile testing units in the latest week. More information is available in the NHS Test and Trace statistics methodology.
LFD tests have been made available to some individuals from 21 October 2020. These tests are not included in this section on distance to in-person testing sites.
The median distance to in-person testing sites for booked tests has decreased in the latest 4 weeks.
From mid-August to mid-September 2020, the distance to testing sites for booked tests increased across in-person routes. However, since mid-September 2020, the distance to testing sites for booked tests has decreased overall. Between 28 January and 3 February 2021, the median distance to an in-person test site decreased to 2.0 miles. 90% of people who booked a test at a test centre lived 8.7 miles or less away.
Considering each route individually, in the latest week the median distance to testing sites for booked tests at regional test sites has decreased to 4.0 miles from 4.1 miles in the previous week. For local test sites, the median distance to testing sites for booked tests remained at 1.1 miles. For mobile testing units the median decreased from 2.6 miles to 2.3 miles.
Figure 5: median distance (miles) to testing sites for tests booked at an in-person test site by route, England
This data can be found in the ‘table 9’ tab of the ‘NHS Test and Trace statistics, 28 May 2020 to 3 February 2021: data tables’ document on the weekly collection page.
Contact tracing in England
Once a person has a confirmed positive test result for coronavirus (COVID-19),[footnote 9] this person is transferred to NHS Test and Trace and a case is opened for them. The number of positive cases transferred to the contact tracing system may not always align with the number of people testing positive for COVID-19. There are several reasons for this which are outlined in the information for users document.
Positive cases and their contacts which are linked to potential outbreaks in specific settings are handled by Public Health England (PHE) local health protection teams (HPTs). These cases and contacts, previously known as complex, have been referred to as ‘cases and contacts managed by local HPTs’ since 29 October 2020. Furthermore, cases and contacts managed nationally either online or by call centres, previously known as non-complex, are referred to as ‘cases and contacts not managed by local HPTs’. Further information is available in the NHS Test and Trace statistics methodology.
Positive cases transferred to NHS Test and Trace
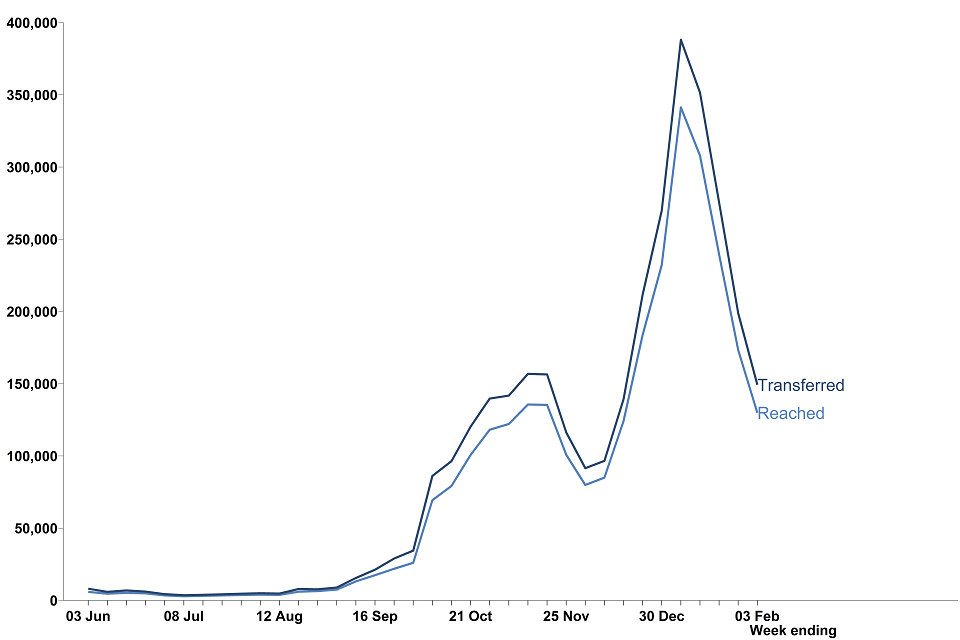
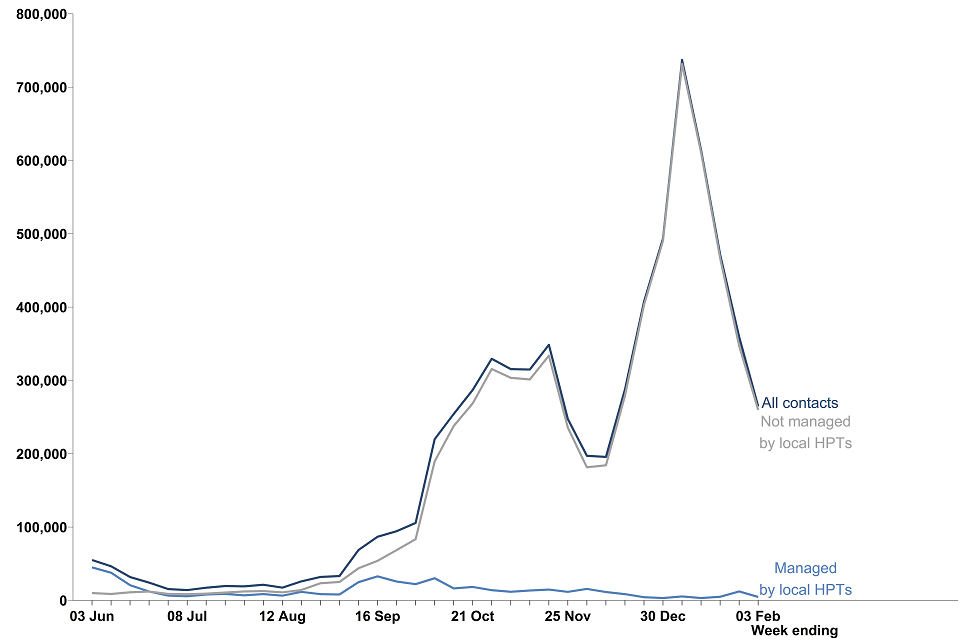
The number of positive cases transferred to NHS Test and Trace has decreased in the latest week.
Between 28 January and 3 February 2021, 149,317 cases were transferred to the contact tracing system, a 25% decrease compared to the previous week. The number of cases transferred has been decreasing for the last 4 weeks.
Between 28 January and 3 February 2021, over 4 in every 5 cases transferred to the contact tracing system were reached and asked to provide information about their contacts.
Out of the 149,317 cases transferred to the contact tracing system in the latest week, 129,880 (87.0%) were reached, 17,325 (11.6%) were not reached and 2,112 (1.4%) had no communication details provided. The proportion of cases reached has remained broadly similar since the start of November 2020. Since Test and Trace launched, 86.2% of all cases have been reached.
In the latest week, 6,317 cases who were reached and asked to provide details of close contacts were managed by local health protection teams (HPTs), whereas 123,563 cases were community-wide cases and, therefore, not managed by local HPTs.
For cases managed by local HPTs, their contacts are often managed at a situation rather than individual level, with advice being issued to the contact institution (for example in a care home or prison). Therefore, cases who were managed by local HPTs may not have been individually reached and asked to provide details of their recent close contacts. However, the cases and contacts will have been successfully dealt with as a whole.
For more information on the different ways of managing cases and the outcomes of contact tracing see the terminology section.
Figure 6: number of cases transferred to the contact tracing system and number of cases transferred who were reached and asked to provide details of recent close contacts (includes cases managed and not managed by local HPTs), England
This data can be found in the ‘table 10’ tab of the ‘NHS Test and Trace statistics, 28 May 2020 to 3 February 2021: data tables’ document on the weekly collection page.
Table 2: people transferred to the contact tracing system (includes cases managed and not managed by local HPTs) by whether they were reached and asked to provide contact details, England[footnote 10]
| 21 Jan to 27 Jan 2021 | 28 Jan to 3 Feb 2021 | Since Test and Trace launched: 28 May 2020 to 3 Feb 2021 | |
|---|---|---|---|
| People who were reached and asked to provide details of recent close contacts | 173,347 (87.2%) | 129,880 (87.0%) | 2,902,288 (86.2%) |
| People not managed by local HPTs | 164,708 | 123,563 | 2,778,297 |
| People managed by local HPTs | 8,639 | 6,317 | 123,991 |
| People who were not reached | 22,095 (11.1%) | 17,325 (11.6%) | 414,500 (12.3%) |
| People whose communication details were not provided | 3,406 (1.7%) | 2,112 (1.4%) | 51,846 (1.5%) |
| Total | 198,848 | 149,317 | 3,368,634 |
Proportion of people transferred to the contact tracing system who were reached by upper-tier local authority (UTLA)
Figure 7: percentage of cases reached and asked to provide details of recent close contacts by UTLA since Test and Trace began
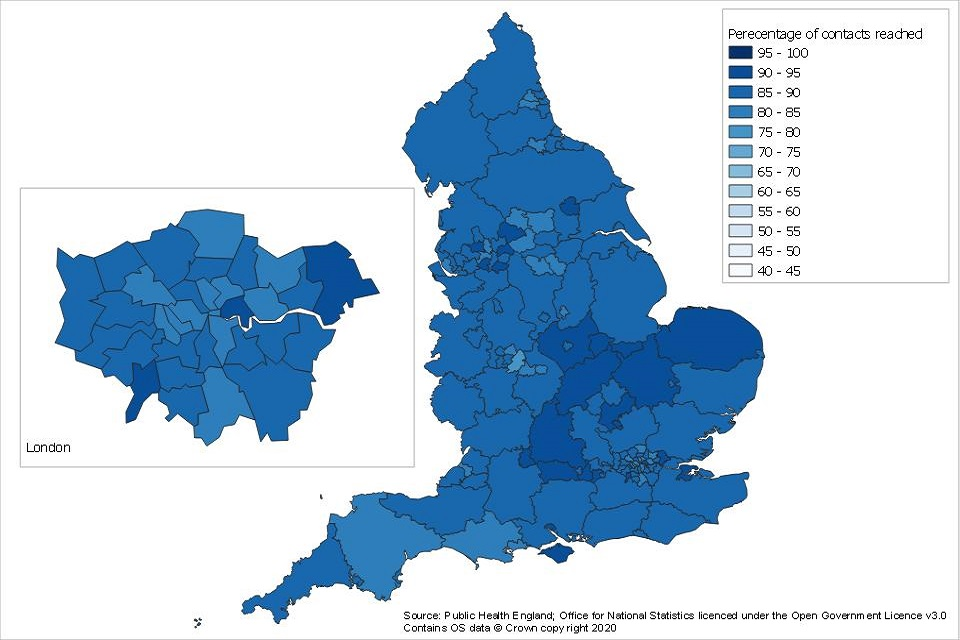
This data is available to download as a csv on the weekly publication collection page.[footnote 11]
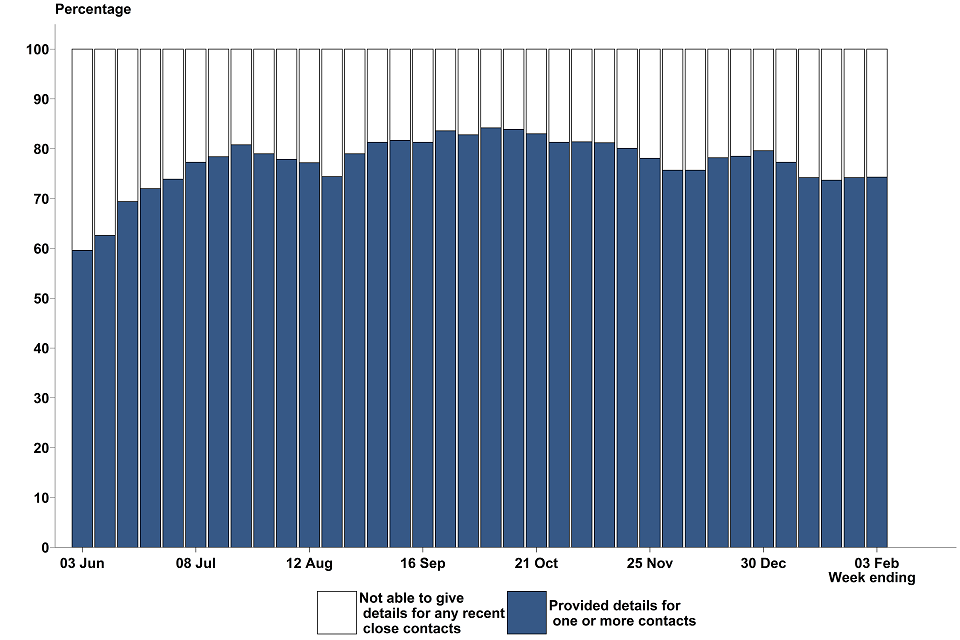
In the latest week, almost 3 in every 4 people who were reached and asked to provide information about their contacts, provided one or more close contacts.
Out of the 129,880 people reached between 28 January and 3 February 2021, 96,536 (74.3%) provided details of one or more close contacts. The proportion of people providing one or more contacts has remained broadly consistent since the end of June 2020.
The number who were not able to give any recent close contacts refers to people who were successfully reached by NHS Test and Trace, but either had no recent close contacts or could not provide details of close recent contacts to pass on for further contact tracing (for example, recent close contact with strangers on the bus).
In the most recent week, the median number of contacts provided per case managed by local HPTs was 31, an increase from 25 in the previous week. For cases not managed by local HPTs the median was 2, and this has been approximately constant since the start of Test and Trace.
Figure 8: proportion of people transferred to the contact tracing system (includes cases managed and not managed by local HPTs) who were reached and asked to provide details of recent close contacts by whether they provided details for contacts or not, England
This data can be found in the ‘table 11’ tab of the ‘NHS Test and Trace statistics, 28 May 2020 to 3 February 2021: data tables’ document on the weekly collection page.
The proportion of cases who were reached by phone rather than online has decreased since the start of October 2020 but has been broadly consistent since the end of October 2020.
Of the cases reached which were not managed by local HPTs between 28 January and 3 February 2021, 49,870 (40.4%) were reached online and 73,690 (59.6%) were reached via the phone. The proportion of cases reached online has increased from 22.0% at the beginning of October 2020, and the proportion reached by phone has decreased from 77.4% in the same period.
The percentage of cases reached online/by phone has been broadly consistent over the last 3 months, ranging from around 39% to 46% reached online since the end of October 2020. Since Test and Trace began, 41.2% of cases were reached online and 58.7% were reached by phone.
Most cases are offered the online route initially and are followed up with a phone call if they have not been reached online. For more information on how cases are contacted see the NHS Test and Trace statistics methodology page.
For cases not managed by local HPTs, over 7 in 10 were reached and asked to provide details about recent close contacts within 24 hours of their case being transferred to contact tracing.
Between 28 January and 3 February 2021, 73.6% of cases transferred (90,939) were reached within 24 hours, compared to 75.1% the previous week. Since Test and Trace launched on 28 May 2020, 71.5% of people (1,986,692) have been reached within 24 hours.
Note that because these timing statistics are from when a case was transferred to the contact tracing system, delays in transferring cases to contact tracing will not be captured in these figures.
Figure 9: proportion of people who were reached and asked to provide details about recent close contacts by time taken to reach them (excludes cases managed by local HPTs), England
This data can be found in the ‘table 13’ tab of the ‘NHS Test and Trace statistics, 28 May 2020 to 3 February 2021: data tables’ document on the weekly collection page.
Close contacts identified by NHS Test and Trace
The number of close contacts identified has decreased by 26% in the latest week, marking the fourth week in which it has decreased after reaching a peak at the start of January.
Between 28 January and 3 February 2021, 264,577 people[footnote 12] were identified as recent close contacts, of which 259,834 (98.2%) were not managed by local HPTs and 4,743 (1.8%) were managed by local HPTs.
The number of contacts not managed by local HPTs increased between the end of November 2020 and the beginning of January 2021 but has since been declining. There has been a substantial shift in the proportion of contacts who are managed by local HPTs compared to the beginning of June 2020. At the beginning of June 2020, contacts managed by local HPTs were 81.7% of contacts identified compared to only 1.8% in the most recent week.
From 18 November 2020, there has been a change in how household contacts under 18 are reached. These changes mean that under-18s in a household are no longer contact traced individually, providing the parent or guardian in the household confirms they have completed their legal duty to inform their child to self-isolate. From 27 November 2020, this change was also extended to cover adults in the same household, so they have the option to be traced via a single phone call.
Considering only the contacts where communication details were provided, 96.5% were reached and told to self-isolate in the most recent week. This has remained constant for the past 8 weeks
Figure 10: number of recent close contacts identified, England
This data can be found in the ‘table 14’ tab of the ‘NHS Test and Trace statistics, 28 May 2020 to 3 February 2021: data tables’ document on the weekly collection page.
93.4% of contacts not managed by local HPTs were reached and told to self-isolate in the latest week. This has remained consistent over the last 2 months.
Between 28 January and 3 February 2021, 259,834 recent close contacts not managed by local HPTs were identified of which 242,797 (93.4%) were reached and told to self-isolate. In the latest week, 8,995 (3.5%) contacts not managed by local HPTs were not reached and 8,042 (3.1%) people had no communication details. For more information on the different outcomes of contact tracing see the terminology section.
Almost all contacts managed by local HPTs continue to be reached and told to self-isolate.
Between 28 January and 3 February 2021, 4,743 close contacts were identified who were managed by local HPTs of which 4,714 (99.4%) were reached and told to self-isolate and 29 (0.6%) were not reached. Since Test and Trace launched, 97.9% of all contacts managed by local HPTs have been successfully reached.
For contacts managed by local HPTs, contacts are managed as a whole setting and are often managed at a situation rather than individual level, with advice being issued to the contact institution (for example in a care home or prison). Therefore, these contacts may not have been individually reached and told to self-isolate but should have received this advice from their institution. For this reason, contacts managed by local HPTs have a higher success rate compared with community wide contacts not managed by local HPTs.
Figure 11: proportion of contacts reached and told to self-isolate, England[footnote 13]
This data can be found in the ‘table 14’ tab of the ‘NHS Test and Trace statistics, 28 May 2020 to 3 February 2021: data tables’ document on the weekly collection page.
Proportion of close contacts identified not managed by local HPTs who were reached and told to self-isolate by upper-tier local authority
Figure 12: percentage of contacts not managed by local HPTs who were reached and told to self-isolate by UTLA since Test and Trace began
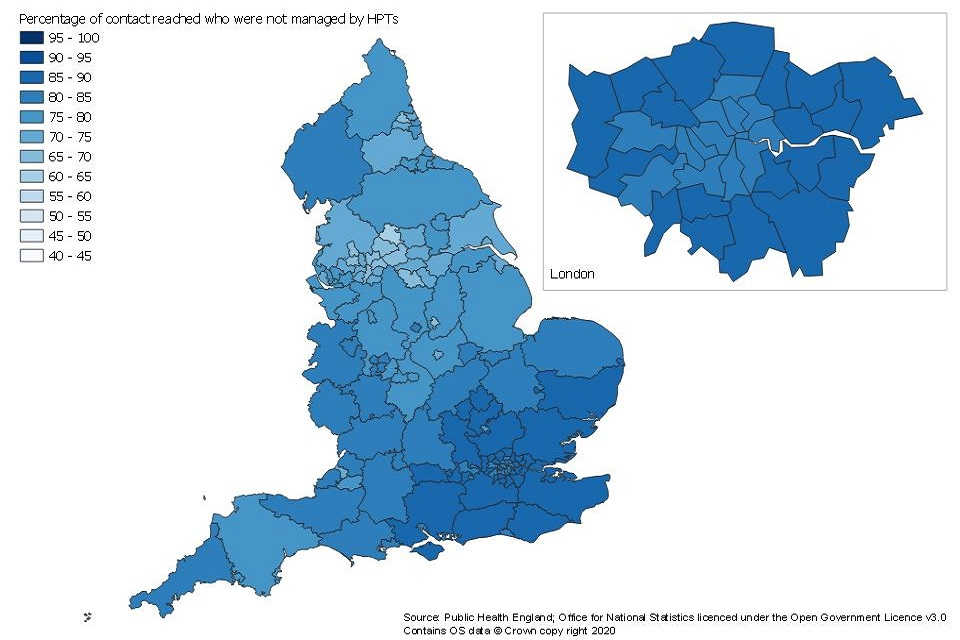
This data is available to download as a csv on the weekly publication collection page.[footnote 11]
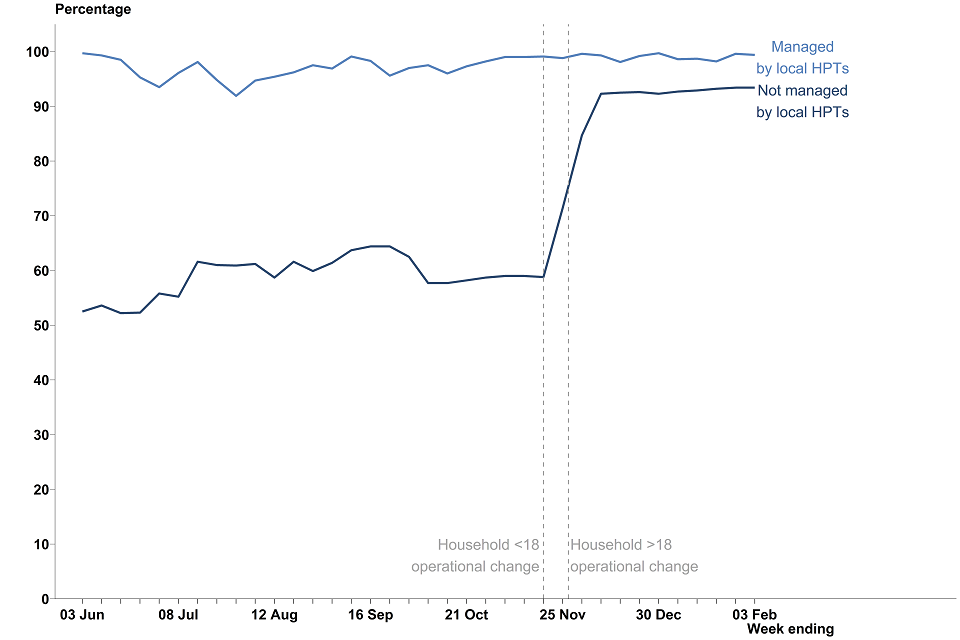
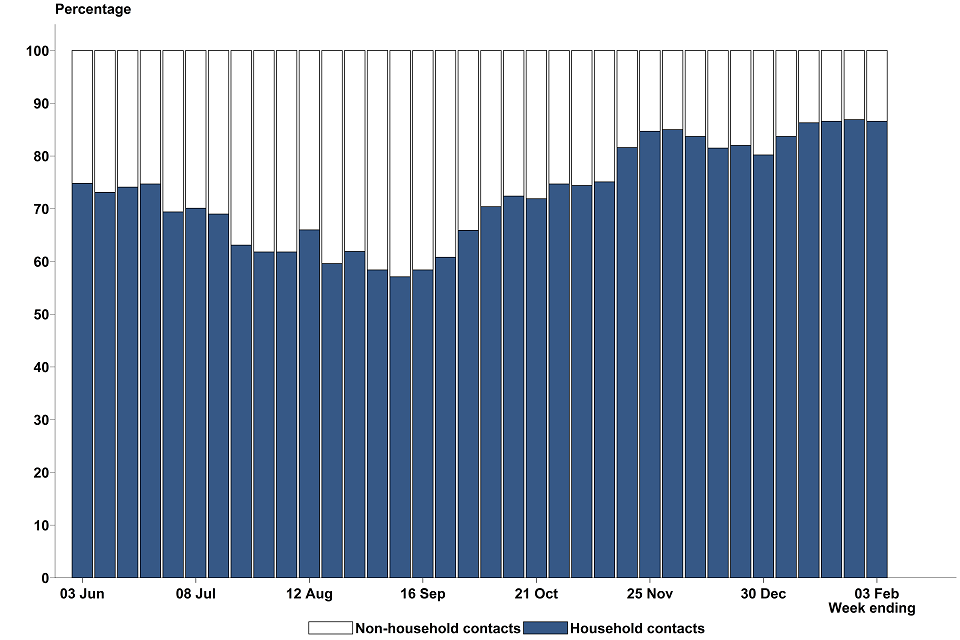
In the most recent week, over 4 out of 5 contacts not managed by local HPTs were from the same household as the case they were identified from, similar to the previous 3 weeks.
The proportion of close contacts not managed by local HPTs that were from the same household as the case they were identified from declined overall between the end of May 2020, when Test and Trace launched, and the beginning of September 2020. Since the end of September, the proportion of contacts who were from the same household has increased overall to 86.6% in the latest week.
Between 28 January and 3 February 2021, 96.9% of household contacts were successfully reached and told to self-isolate, which has remained consistent over the last 2 months.
Between 28 January and 3 February 2021, 70.8% of contacts who were from a different household to the case from which they were identified were successfully reached and told to self-isolate. This is similar to the 70.7% reported in the previous week.
Figure 13: proportion of recent close contacts not managed by local HPTs by whether they were from the same household as the case that they were identified from, England
This data can be found in the ‘table 15’ tab of the ‘NHS Test and Trace statistics, 28 May 2020 to 3 February 2021: data tables’ document on the weekly collection page.
The proportion of household contacts who were reached by their case remains high at 93.3% and the proportion of non-household contacts reached by phone rather than online has remained similar at 58.7%.
Of the household contacts who were reached and not managed by local HPTs between 28 January and 3 February 2021, 203,481 (93.3%) were reached and told to self-isolate by their household case, 7,446 (3.4%) were reached online and 7,186 (3.3%) were reached online and 9,753 (3.3%) were reached via the phone.[footnote 14] The proportion of contacts reached by their household has been broadly consistent since the operational change that was introduced in November 2020. For more information see the NHS Test and Trace statistics methodology page.
Of the non-household contacts who were reached, 10,169 (41.2%) were reached online and 14,493 (58.7%) were reached via the phone.
Most non-household contacts are offered the online route initially and are followed up with phone call if they have not been reached online. For more information on how cases are contacted see the NHS Test and Trace statistics methodology page.
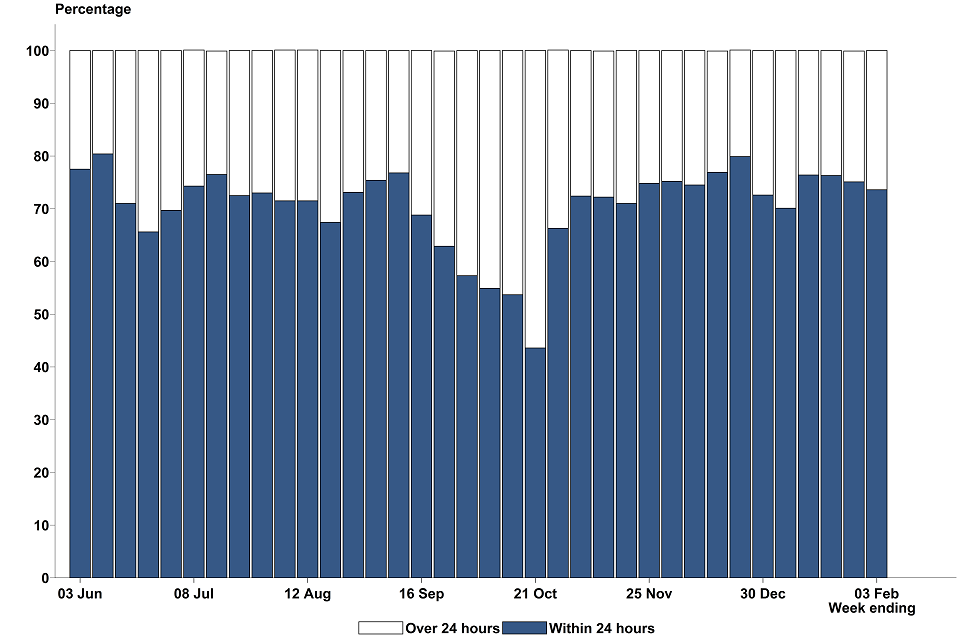
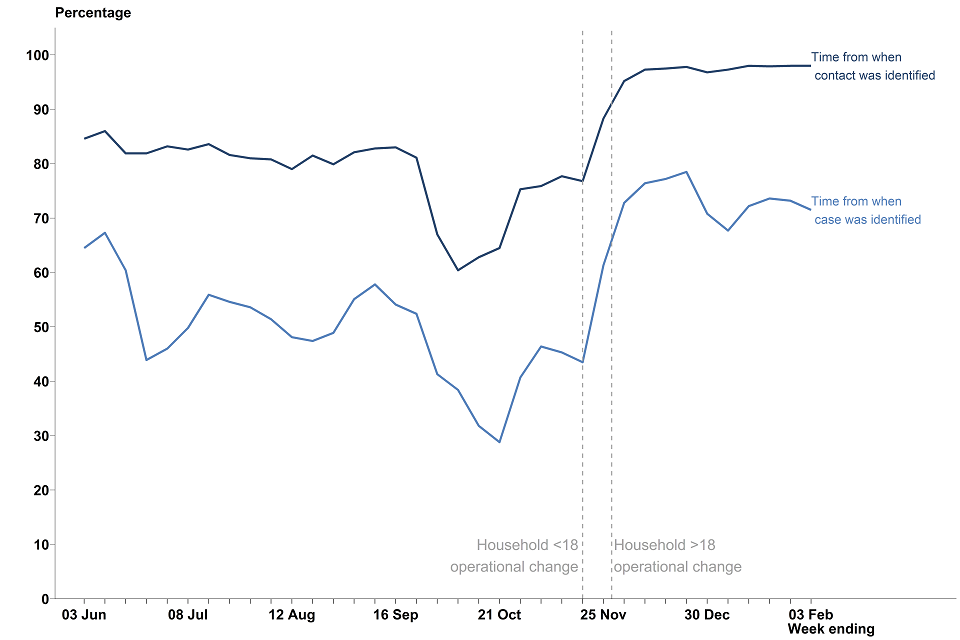
For contacts not managed by local HPTs who were told to self-isolate, 98.0% were reached within 24 hours of being identified. This has remained broadly similar for the last 9 weeks.[footnote 15]
Between 28 January and 3 February 2021, 98.0% of contacts who weren’t managed by local HPTs were reached and told to self-isolate within 24 hours of being identified, the same proportion as the previous week.
For contacts not managed by local HPTs who were told to self-isolate, the proportion reached within 24 hours of the case that reported them being transferred to the contact tracing system has decreased to 71.5%.
Between 28 January and 3 February 2021, 172,103 (71.5%) contacts who weren’t managed by local HPTs were reached and told to self-isolate within 24 hours of the case that reported them being transferred to the contact tracing system. This is a decrease in the percentage reached compared to the previous week and remains lower than the percentage reached in the week ending 23 December 2020. The percentage reached within 24 hours had previously been increasing between October 2020 and December 2020.
Note that because these timing statistics are from when a case was transferred to the contact tracing system, delays in transferring cases to contact tracing will not be captured in these figures.
Figure 14: proportion of recent close contacts who were told to self-isolate within 24 hours (excludes cases managed by local HPTs), England
This data can be found in the ‘table 17’ and ‘table 18’ tabs of the ‘NHS Test and Trace statistics, 28 May 2020 to 3 February 2021: data tables’ document on the weekly collection page.
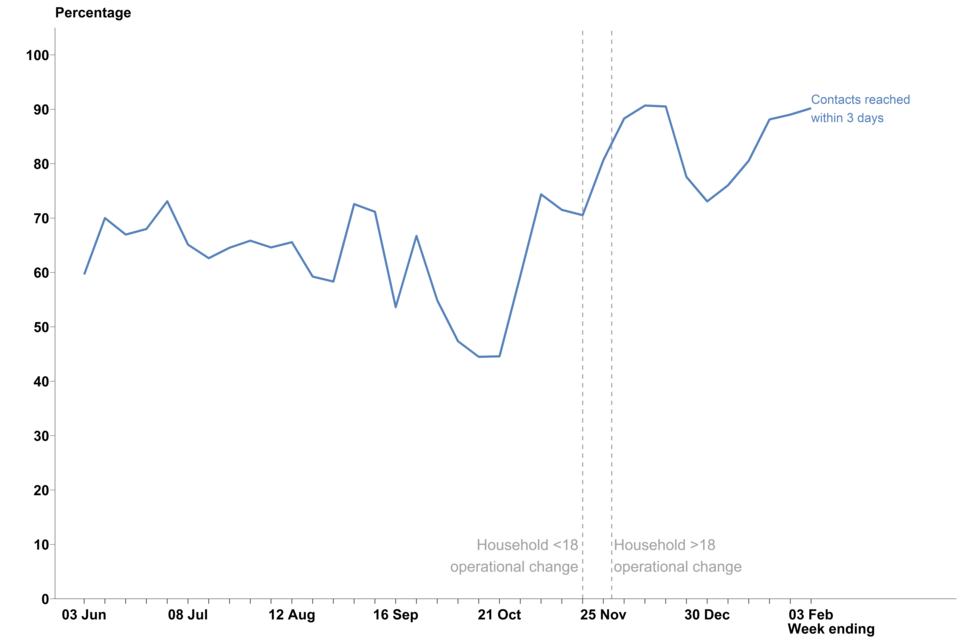
For contacts not managed by local HPTs who were told to self-isolate, 9 out of 10 were reached within 3 days of the case that reported them taking their test. This has been steadily increasing since mid-December 2020.
Between 28 January and 3 February 2021, 217,148 (90.2%) contacts that were reached and told to self-isolate were reached within 3 days of the case that reported them taking a test which subsequently returned a positive result. This is an increase from 89.0% in the previous week.
The percentage reached within 3 days steadily increased between October 2020 and early December 2020, with 90.7% successfully reached in the week ending 9 December. This percentage then began to decline over the Christmas and New Year period. This has since begin to steadily increase and with the most recent week, it has returned to around the levels observed at the start of December.
Figure 15: proportion of recent close contacts who were told to self-isolate within 3 days of the case taking a test (excludes cases managed by local HPTs), England
This data can be found in the ‘table 19’ tab of the ‘NHS Test and Trace statistics, 28 May 2020 to 3 February 2021: data tables’ document on the weekly collection page.
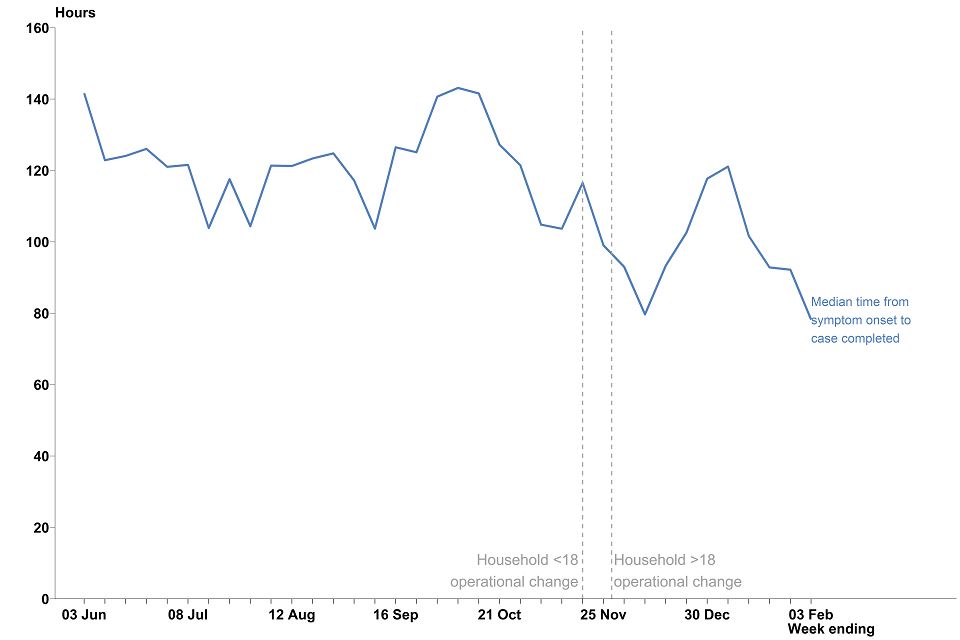
For contacts not managed by local HPTs who were told to self-isolate, the median time taken for contacts to be reached from the case that identified them reporting to first observe symptoms[footnote 16] was 78 hours.
Between late November 2020 and mid December 2020, the median time for contacts that were reached and told to self-isolate steadily decreased before beginning to gradually increase over the Christmas and New Year period. Since early January the median time in hours has been steadily decreasing.
Please note this data only includes contacts reported by cases who reported to experience at least one symptom. This data is collected by asking symptomatic people who tested positive and were subsequently reached by NHS Test and Trace to recall which day they first observed coronavirus symptoms. More information is available in the NHS Test and Trace statistics methodology.
Figure 16: median time from case first reporting symptoms to contact reached (excludes cases managed by local HPTs), England
This data can be found in the ‘table 20’ tab of the ‘NHS Test and Trace statistics, 28 May 2020 to 3 February 2021: data tables’ document on the weekly collection page.
NHS COVID-19 app in England and Wales
The NHS COVID-19 app has been widely available to download since 24 September 2020 and provides several tools to support testing and contact tracing in England and Wales including contact tracing, local area alerts and venue check-in.
The NHS COVID-19 app complements NHS Test and Trace in England and Test, Trace and Protect in Wales by extending the speed, reach and precision of contact tracing. It allows close contacts unknown to the individual who has tested positive, for example strangers on public transport, to be notified to self-isolate, if they are also an app user.
Since the app is anonymous and voluntary, contact tracers will not know whether someone who tests positive is an app user or whether the contacts they identify are app users. All positive cases, regardless of whether they are an app user, will be contacted by NHS Test and Trace in England or Test, Trace and Protect in Wales, and asked to provide details of recent, close contacts. Contacts will all be notified by NHS Test and Trace or Test, Trace and Protect, so may be notified by both the app and the contact tracers. More information is available in the NHS Test and Trace statistics methodology and on the NHS COVID-19 app website.
For information on contact tracing apps in Scotland and Northern Ireland see Protect Scotland and StopCOVID NI.
Prior to national release on 24 September 2020, the app was available to download from 13 August 2020 for those involved with the pilot.
The number of times the NHS COVID-19 app has been downloaded and the number of QR posters that have been generated through the GOV.UK coronavirus QR poster service are now available on the NHS COVID-19 app support website. This section will be removed from the weekly coronavirus publication on 18 February.
Terminology
Testing
Pillar 1 testing: swab testing for the virus in Public Health England (PHE) labs, NHS hospitals for those with a clinical need, and health and care workers.
Pillar 2 testing: swab testing for the virus for the wider population, through commercial partnerships,[footnote 17] either processed in a lab or more rapidly via lateral flow devices tests. Tests processed in a lab are carried out through several different routes:
- regional test sites, which includes drive-through testing centres
- local test sites,[footnote 8] which are similar to regional test sites but specifically for walk ups
- mobile testing units, which travel around the UK to increase access to COVID-19 testing. They respond to need, travelling to test people at specific sites including care homes, police stations and prisons
- satellite test centres, which includes test kits provided directly to ‘satellite’ centres at places like hospitals or care homes that have a particularly urgent or significant need
- home test kits, which are delivered to someone’s door so they can test themselves and their family without leaving the house
Pillar 3 testing: serology testing to show if people have antibodies from having had coronavirus.
Pillar 4 testing: blood and swab testing for national surveillance support by PHE, ONS and research, academic and scientific partners to learn more about the prevalence and spread of the virus and for other testing research purposes.
Virus testing: swab testing using polymerase chain reaction (PCR) assay within pillars 1, 2 and pillar 4 to show if someone currently has COVID-19.
Antibody testing: testing of a blood sample within pillar 3 and pillar 4 to show if people have antibodies from having had COVID-19.
People tested each week: refers to people who have been tested at least once in each reporting week, therefore if someone had multiple tests in a given week they would be counted once.
People testing positive each week: refers to the number of people who tested positive at least once in each reporting week, therefore if someone tested positive multiple times in a given week they would only be counted once.
Cumulative people tested: refers to the number of people who have been tested at least once since Test and Trace launched.
Cumulative people testing positive: refers to the number of people who have tested positive at least once since Test and Trace launched.
For pillar 2, there are 2 measures of the time taken to receive a coronavirus (COVID-19) test result:
- the time taken to receive a COVID-19 test result from time of booking is measured from the time that a person books an appointment on the website to the time when the person receives a notification of their test result via an email or an SMS. This data is only available for regional test sites, local test sites and mobile testing units, as test booking and registration processes for home testing and satellite test centres are currently undertaken on different systems
- the time taken to receive a COVID-19 test result from time of test is measured from the time a person completes a test registration (or the time a person indicates their test was taken for home testing kits) until the time that they receive a notification of the result of their test via an email or an SMS
Tracing
NHS Test and Trace has 2 ways of handling cases depending on the way in which they are managed:
Cases and contacts managed by local HPTs (previously known as complex)
PHE local health protection teams manage cases linked to outbreaks, examples include someone who works or has recently visited:
- a health or care setting, such as a hospital or care home
- a prison or other secure setting
- a school for people with special needs
- critical national infrastructure or areas vital for national security
Cases and contacts not managed by local HPTs (previously known as non-complex)
Wider online and other call centre capacity for individual community-wide cases and contacts.
When a case is transferred to NHS Test and Trace contact tracers will attempt to contact the individual which results in one the following 3 outcomes:
- Reached and provided information about recent close contacts: contact tracers or local HPTs successfully reached the individual and asked them to provide details for recent close contacts.
- Communication details not provided: people who had no communication details provided are those who were transferred to NHS Test and Trace but did not have any associated contact details (for example, phone number or email address).
- Not reached: the number of people who were not reached includes those people who the service has been unable to reach because there has been no response to text, email and call reminders. This includes those where the communication details are invalid. It also includes people who were reached but declined to give details of close contacts. There may also be a small number of people who have not been reached but where contact tracers are still in the process of trying to make contact.
When a close contact is identified, contact tracers or local HPTs will attempt to contact the individual or institution depending on the exposure setting, which results in the following outcomes:
- Reached and told to self-isolate: for contacts not managed by local HPTs contact tracers successfully reached the contact and told them to self-isolate, or for household contacts where the case has opted to inform them to self-isolate. For those managed by local HPTs, advice is provided to the institution which is passed on to contacts in the specific setting.
- Communication details not provided: people who were identified as recent close contacts but didn’t have any associated contact details (for example phone number or email address).
- Not reached: the number of contacts who were not reached includes those contacts who the service has been unable to reach because there has been no response to text, email and call reminders. There may also be a small number of contacts who have not been reached but where contact tracers are still in the process of trying to make contact.
Measuring the data
How the data was collected
UK-level testing data is collated centrally by DHSC from multiple sources across the different nations and pillars. Further details can be found in the NHS Test and Trace statistics methodology.
Testing data for pillars 1 and 2 for England is provided by PHE, NHS and commercial partners. Contact tracing data is collected from management information from the NHS Test and Trace service. Details about the data sources used can be found in the NHS Test and Trace statistics methodology.
Future development
We have integrated this data with those from other parts of NHS Test and Trace, particularly testing, to provide an end-to-end view of the service that follows the user journey. So far, UK level testing data, testing data for pillars 1 and 2 in England, testing turnaround times and NHS COVID-19 app statistics have been added. Further breakdowns for contact tracing continue to be incorporated, including breakdowns for cases and contacts managed or not managed by local HPTs, geographical breakdowns and household information.
To support user needs and data transparency, additional releases have been published alongside the weekly Test and Trace publication including:
- care home statistics up to 8 July 2020
- people tested for coronavirus (COVID-19) between 30 January and 27 May 2020
- demographic data for coronavirus testing in England between 28 May and 26 August 2020
- weekly rapid testing statistics
NHS Test and Trace continues to provide information for local authorities and their partners so that they have the information they need to help contain any outbreaks. In time, NHS Test and Trace intends to publish detailed data from across the program to support secondary analysis, for example in academic institutions.
We continue to explore the feasibility of adding new breakdowns to the publication to support user needs. Over the coming months, we intend to make the following available:
- additional demographic information for people tested
- additional data for new testing technologies
- details on testing in care homes
- details of close contacts who go on to test positive
The UK Statistical Authority has published a rapid review of the Test and Trace statistics. This includes recommendations on how the publication should develop it order to adhere fully to the Code of Practice. These recommendations continue to influence the development of the publication in the coming weeks and months.
Strengths and limitations
Given the importance of this service and the commitment of NHS Test and Trace to be open and transparent with the public it serves, this data are being released at the earliest possible opportunity. However, new IT systems and statistical outputs often take a period of time to bed in. This data should therefore be treated with caution as the system and understanding of the data develops.
More information on data limitations and how the figures in this publication can and can’t be used is outlined in the NHS Test and Trace methodology.
Quality
These statistics have been put together by NHS Test and Trace and DHSC with advice from the Office for National Statistics. As part of the quality assurance process, DHSC ensures that all published figures are replicable and any issues impacting on the quality of the data are clearly stated within the publication. Furthermore, the figures are often triangulated with other published sources to verify trends in the data.
Revisions to figures previous published
Figures for people tested and people testing positive for coronavirus (COVID-19) in previous releases have been revised. These revisions are because:
- there are sometimes delays in laboratories submitting data to PHE
- quality checks are conducted on the data to refine figures over time
Figures for pillar 2 testing turnaround times in previous releases have been revised. These revisions are because:
- the figures presented are based on a data-cut several days after the end of the reporting period. Some tests may continue to be processed after this period and therefore data may need to be revised over time
Figures for contact tracing in previous releases have been revised. These revisions are because:
- the figures presented are based on a data cut several days after the end of the reporting period, to give time for cases reported towards the end of the 7-day period to have an outcome. Some cases may continue to be in progress after this period, and therefore data may need to be revised over time
- typically, one week after initial publication the number of cases reached and consequently the number of contacts identified is expected to increase. Similarly, the number of cases and contacts reached within 72 hours is likely to increase
Cumulative figures for coronavirus (COVID-19) testing in the UK have been revised. These revisions are because:
- for tests processed and tests sent out, weekly totals reflect the sum of actual daily counts reported for the previous week. Each week there may be corrections to previously reported figures, for example, where labs (or studies under pillar 4) returned the results late or duplicates were identified and removed. These corrections are reflected in the cumulative figures. This means that previously published weekly counts will not necessarily sum to the latest cumulative figure. It also means that the latest cumulative count may not match the previous week’s cumulative count plus this week’s weekly count
More information on quality and how this publication adheres to the Code of Practice for statistics is available in the statement of compliance.
Feedback
For questions about the release please refer to the information for users document initially. For feedback and any further questions, please contact statistics@dhsc.gov.uk.
-
Deduplicated for the reporting week. For information on how the number of people are tested, and tested positive, in a reporting week is measured see the NHS Test and Trace statistics methodology. ↩ ↩2
-
The number of people identified includes duplicates as an individual may be named as a close contact for more than one case. See NHS Test and Trace statistics methodology for more information. ↩
-
Confirmatory PCR testing will continue for NHS England staff, adult social care, primary school teachers and hauliers. ↩
-
Deduplicated for the reporting week, methodology was revised from 15 October 2020. See NHS Test and Trace statistics methodology for more information. ↩
-
Deduplicated since testing began and the end of the most recent reporting week. People tested multiple times in this time period will only be counted once. See NHS Test and Trace statistics methodology for more information. ↩
-
Deduplicated for the reporting week. See NHS Test and Trace statistics methodology for more information. ↩
-
For all measures of time taken to receive a COVID-19 test result, there are a number of tests that were not completed. This covers any test where the results were not communicated, which may be because communication details (for example, phone number or email address) were not provided or were incorrect, or because the test was cancelled or abandoned, or no result was available. It also includes some tests which are still being processed. ↩
-
Previously local test sites were included together with regional test sites but from 17 September 2020 have been split out as a separate group. ↩ ↩2
-
All positive PCR test results under pillar 1 and pillar 2 should be transferred. In addition, all positive virus test results as part of prevalence studies (pillar 4) are also transferred to Test and Trace. People tested under pillar 3 (serology testing to show if people have antibodies from having had COVID-19) do not have their cases transferred to NHS Test and Trace. ↩
-
If NHS Test and Trace is not able to reach an individual testing positive or if no communication details are available, then it is not always possible to know if the case should be managed by a local HPT or not. Therefore, these breakdowns are not available. ↩
-
The regional data uses a different data cut to the main publication therefore cumulative totals will not exactly match. The data is available for the cumulative figures since Test and Trace launched up to the most recent week of reporting. Due to revisions that occur each week one week’s cumulative figures cannot be subtracted from a previous week’s to obtain weekly data by UTLA. ↩ ↩2
-
The number of people identified includes duplicates as an individual may be named as a close contact for more than one case. See NHS Test and Trace statistics methodology for more information. ↩
-
Contacts managed by local HPTs are reached when the situation has been dealt with and advice has been issued to the institution, whereas contacts not managed by local HPTs must be individually contact traced (unless they are a household contact) to be classified as reached. ↩
-
The number of contacts reached by the phone and online will not sum to the total number of contacts reached not managed by local HPTs. This is because household contacts where the case has told them to self-isolate are not included, and for some contacts the tracing route is unknown. ↩
-
Timing data does not include contacts which were subsequently escalated to a local HPT. ↩
-
The date a case first observed symptoms is the date they reported to NHS Test and Trace after a positive test. This only includes contacts where the case that reports them reporting experiencing at least one symptom to NHS Test and Trace. ↩
-
See more detail in scaling up our testing programmes. ↩