HMRC annual report and accounts 2021 to 2022
Published 18 July 2022

© Crown copyright 2022
This publication is licensed under the terms of the Open Government Licence v3.0 except where otherwise stated. To view this licence, visit nationalarchives.gov.uk/doc/open-government-licence/version/3 or write to the Information Policy Team, The National Archives, Kew, London TW9 4DU, or email: psi@nationalarchives.gov.uk.
Where we have identified any third party copyright information you will need to obtain permission from the copyright holders concerned.
This publication is available at https://www.gov.uk/government/publications/hmrc-annual-report-and-accounts-2021-to-2022/hmrc-annual-report-and-accounts-2021-to-2022--2
Performance overview
Read an overview of our performance in financial year 2021 to 2022, including information about our vision, objectives and the way we operate.
1. Performance analysis
This section provides an analysis of how we delivered against our strategic objectives and the commitments we made for financial year 2021 to 2022. It also includes analysis of our financial performance and strategic risks.
Financial review
This financial review covers our financial performance, setting out how we have managed our operational costs, delivered efficiencies, and met our commitments around benefits and credits payments and expenditure on COVID-19 and UK Transition. It sets out how we have performed over time, illustrating trends in expenditure, running costs and comparisons against budget.
Where our funding comes from
This year we spent £5,717 million on resource costs (£4,998 million in operational costs and £719 million in one-off working tax credit payments) and £665 million on capital investments. We also paid £51,319 million in benefits, tax credits and reliefs.
Our funding for this expenditure comes directly from government, based on funding settlements at Spending Reviews, which we closely monitor and use to measure our financial performance.
Figure 1: Our budgetary framework
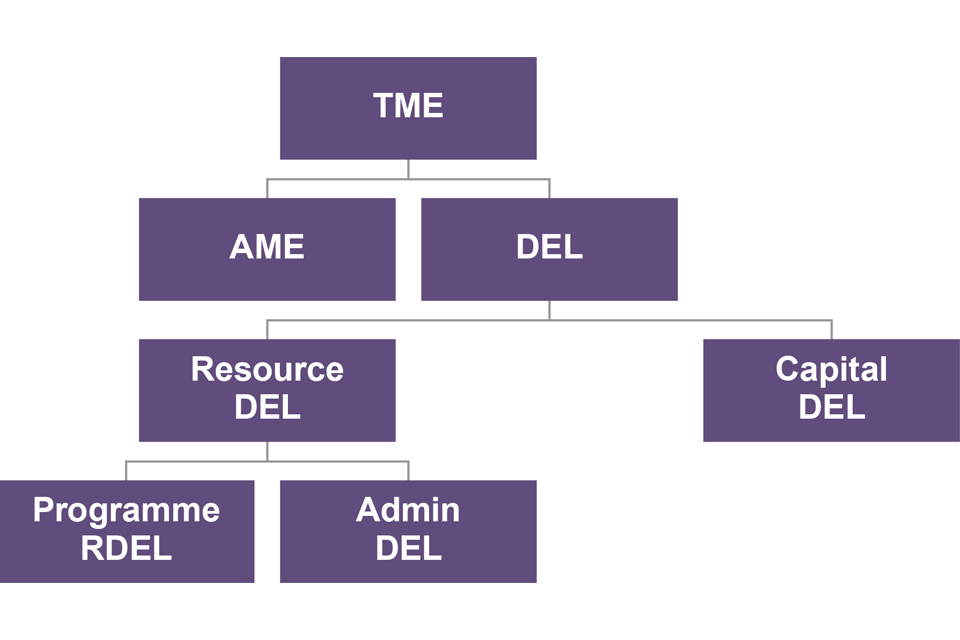
HM Treasury sets the budgetary framework for government spending including our Supply Estimate that sets out the proposed maximum spending for each department and is voted on by Parliament at the start of the financial year.
The total amount a department spends is referred to as Total Managed Expenditure (TME). This funding is subject to strict HM Treasury controls and consists of budgets voted by Parliament (including HMRC running costs, COVID-19 support payments and Child Benefit payments) and those where appropriation is covered in other legislation (including tax credits, other reliefs and allowances and the National Insurance Fund).
TME is split into:
-
Departmental Expenditure Limit (DEL): this is the firm budget set for our controllable expenditure. It is split between spending on day-to-day resources and administration (operational) costs, otherwise known as ‘Resource (RDEL)’, and spending on investment, otherwise known as ‘Capital (CDEL)’. RDEL is further split between two strands called ‘Programme’, which covers areas like front-line activities, and ‘Administration’, which covers areas like support services and corporate services.
-
Annually Managed Expenditure (AME): these are our more flexible budgets for volatile or demand-led expenditure, including personal tax credits, other reliefs and allowances, and Child Benefit. This spending may be unpredictable and is more challenging to control, so it requires careful monitoring. HM Treasury reviews these budgets annually.
How we performed against our budget
The following table summarises how we performed against our budgetary controls.
Table 1: Financial performance
| Estimate/Budget (£m) | Expenditure (£m) | Expenditure compared to estimate (£m) | |
|---|---|---|---|
| Operational (RDEL) | 6,024.0 | 5,716.7 | 307.3 |
| Investment (CDEL) | 738.1 | 664.5 | 73.6 |
| Total DEL | 6,762.1 | 6,381.2 | 380.9 |
| Benefits, credits, reliefs (AME) | 59,069.1 | 51,319.1 | 7,750.0 |
| Total Managed Expenditure | 65,831.2 | 57,700.3 | 8,130.9 |
In 2021 to 2022 we had an operational (RDEL) underspend of £307.3 million. This underspend has been mainly driven by; a technical non-cash accounting change - depreciation charges £141 million lower than budget (due to an annual review of the amortisation periods for intangible assets under IAS 38, which identified a need to update useful lives and/or net book values), lower than expected costs of £74 million in UK Transition activity and £51.8 million in our transformation portfolio. Through these and other underspends (£40.5 million total, due mainly to recruitment delays and lower than expected IT system costs in our core work), we absorbed some costs of our COVID-19 activity.
The investment (CDEL) underspend of £73.6 million is mainly comprised of £34.6 million within UK Transition activity and £54.4 million within our transformation programme portfolio, offset by an overspend of £15.4 million within our core business as usual activity.
The benefits, credits and other reliefs (AME) underspend of £7,750 million is made up of £2,432 million COVID-19 costs, £2,609 million in personal tax credits and around £2,709 million in other reliefs and allowances. There are small variances across other benefit and credit lines.
Our financial performance is broken down further in the Statement of Parliamentary Supply (SOPS) tables, where more detail of the underspend is set out. The SOPS is a key accountability statement that shows, in detail, how a department has spent against their Estimate.
There are some technical differences between how our expenditure appears in the financial statements and how it appears in relation to our funding and the wider government accounts. To make this difference easier to understand, we have included a reconciliation in SOPS 2.
Expenditure compared to total tax revenue in 2021 to 2022
Figure 2 shows what it cost to run HMRC in financial year 2021 to 2022. For a running cost of £4,998 million, we raised £731.1 billion of tax for the UK’s public services and provided £52,038 million in financial support for COVID-19, personal tax credits, Child Benefit and other reliefs.
Figure 2: RDEL and AME expenditure relative to total revenue (note 1)
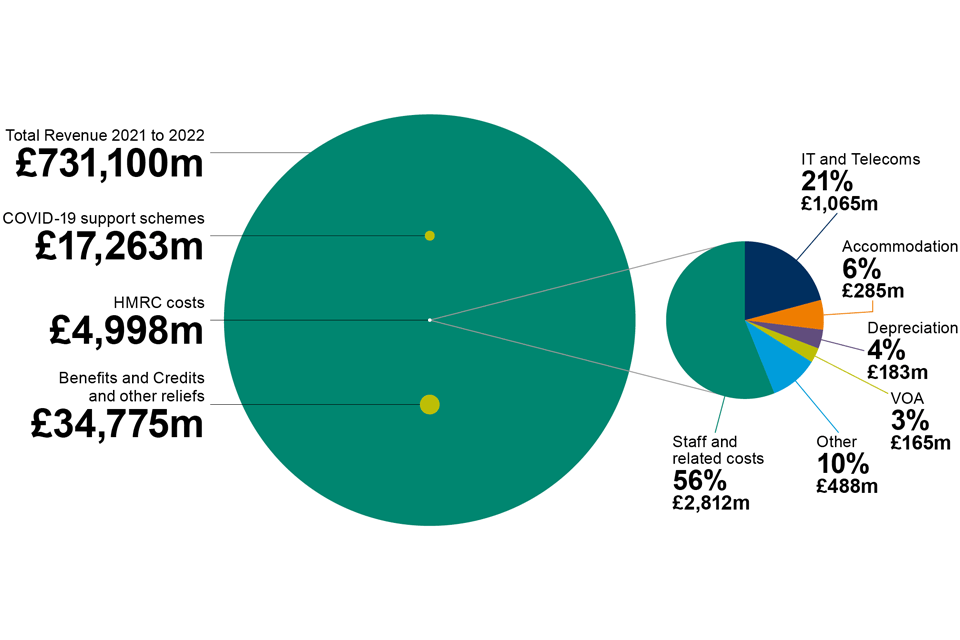
Note 1: Numbers may not sum due to rounding.
Figure 3 shows that operational (RDEL) expenditure increased in 2021 to 2022 due to the COVID-19 pandemic response, UK Transition and the increased use of service-based, rather than capital-based delivery in transformation projects. We have been delivering core business as usual activity throughout this time, but this was impacted by the need to prioritise responding to the COVID-19 pandemic and UK Transition activity.
Figure 3: Operational RDEL
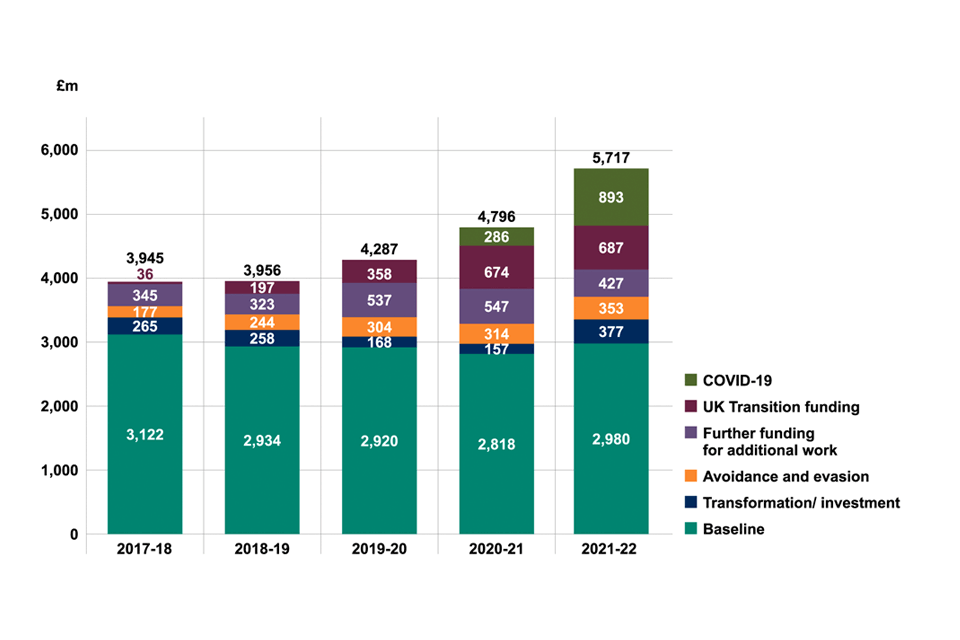
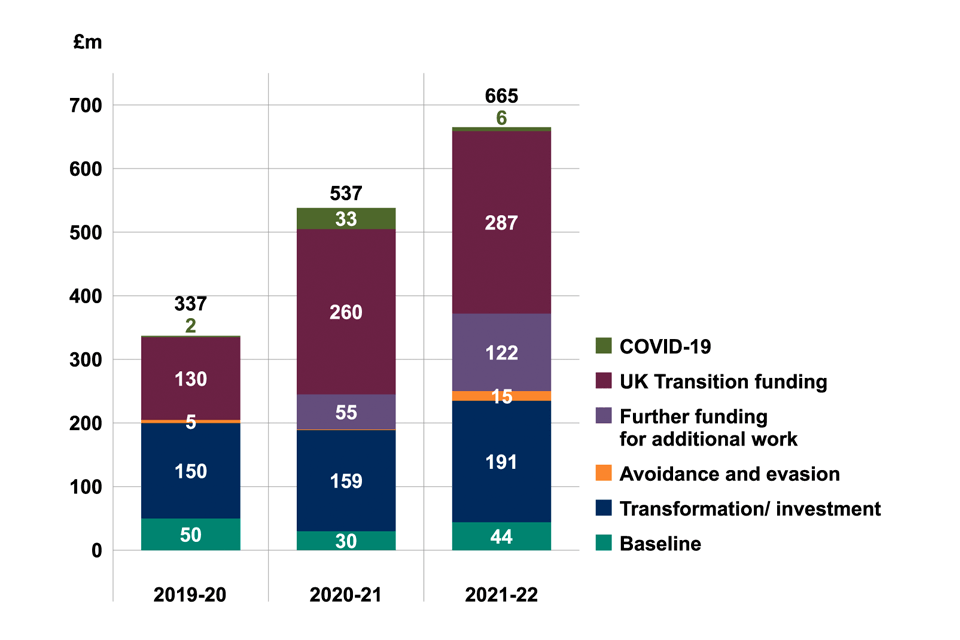
Figure 4 shows there has been an increase in our capital investment funding. This is largely due to UK Transition activity, for example delivering the Northern Ireland Trader Support Service and Inland Border Facilities. In addition, and as part of our transformation, we have increased activity on our Locations Programme, as well as a number of other major programmes such as Making Tax Digital, Securing our Technical Future, Technical Sourcing Programme, and our Contact Engagement Programme.
Figure 4: Capital Investment CDEL (note 1)
Note 1: Breakdown of capital investment figures between 2017 and 2019 is unavailable. Numbers may not sum due to rounding.
Figure 5 shows the trend of AME expenditure over time between 2017 to 2018 and 2021 to 2022.
Figure 5: Annually Managed Expenditure
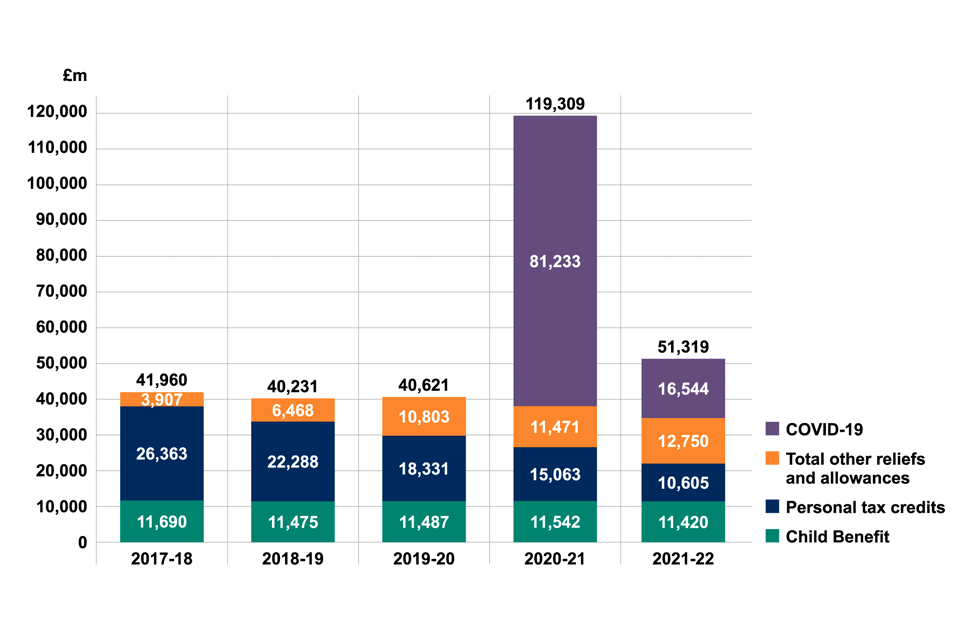
AME expenditure significantly increased during 2020 to 2021 as a result of COVID-19 financial support scheme payments. This decreased in 2021 to 2022 following the closure of COVID-19 schemes on 30 September 2021. There was also a decrease in personal tax credits payments, as anticipated in the Office for Budget Responsibility forecast.
How we delivered more efficiently
We delivered sustainable efficiencies of £131 million over 2021 to 2022, compared to £100 million in 2020 to 2021. We achieved these efficiencies primarily through using fewer staff and making better use of technology and our estate.
Our Customer Compliance Group contributed £62 million of efficiency savings towards our overall total, through continuous improvement activities such as moving from manual to electronic records and making greater use of robotics and automation in day-to-day tasks.
Additionally, our locations programme contributed £37 million of efficiency savings towards our overall total. This programme enables us to become a smaller and more digital organisation. This is through making better use of the data we have to change the way we do our compliance work, as well as bringing colleagues together in 13 regional centres.
Figure 6 shows that over the five-year period starting in 2017 to 2018 and ending in 2021 to 2022, we have delivered total sustainable efficiencies of £746 million. Over this period, to ensure challenges such as our COVID-19 response were met, we had to reprioritise some of our transformation work, which has had an impact on our ability to deliver sustainable cost savings. We anticipate sustainable cost savings will rise in 2022 to 2023.
Figure 6: Cumulative sustainable efficiencies
| Year | £m |
|---|---|
| 2017 to 2018 | 229 |
| 2018 to 2019 | 395 |
| 2019 to 2020 | 515 |
| 2020 to 2021 | 615 |
| 2021 to 2022 | 746 |
Figure 7 shows that in 2021 to 2022, the cost of collecting taxes was 0.50p for every pound we collected in tax revenue. Factors affecting the cost of collection include the continuation of COVID-19 financial support schemes in the first half of 2021 to 2022 and economic recovery, as the measures taken during the pandemic were eased.
Figure 7: Cost in pence per £1 collected
| Year | Cost in pence per £1 collected |
|---|---|
| 2017 to 2018 | 0.53 |
| 2018 to 2019 | 0.52 |
| 2019 to 2020 | 0.51 |
| 2020 to 2021 | 0.51 |
| 2021 to 2022 | 0.50 |
A change to the methodology for the overall cost of collection has been made in 2021 to 2022 and the ratio is now shown net of Customs and International Trade. This is because the nature of expenditure has moved towards border control rather than revenue collection. The 2019 to 2020 and 2020 to 2021 ratios are also restated net of Customs and International Trade. The previously stated figures that included Customs and International Trade were: 0.54p (2019 to 2020) and 0.59p (2020 to 2021).
Impacts on our expenditure: COVID-19
Our central role in providing financial support to customers during the COVID-19 pandemic had an impact on expenditure within our Resource Accounts.
On 20 March 2020, as part of the government’s response to the COVID-19 pandemic, the Chancellor announced a number of financial support schemes to protect jobs and businesses which we were responsible for delivering.
In 2021 to 2022 we continued to deliver two of these financial support schemes – the Coronavirus Job Retention Scheme and the Self-Employment Income Support Scheme – until the schemes closed on 30 September 2021. On 3 March 2021 the Chancellor also announced an additional one-off payment of £500 to eligible working households receiving tax credits who may have seen a reduction in their wages as a result of the pandemic. Overall, we provided £17,263 million of support payments to individuals and businesses affected by the pandemic in 2021 to 2022, and a total of £98,496 million across both financial years in which the schemes ran. These payments are shown in table 2.
Table 2: COVID-19 support scheme payments
| COVID-19 support schemes spend | Resource Account note | 2021 to 2022 Outturn (spent) (£m) | 2020 to 2021 Outturn (spent) (£m) |
|---|---|---|---|
| Coronavirus Job Retention Scheme | 4 | 8,201 | 60,677 |
| Self-Employment Income Support Scheme | 4 | 8,343 | 19,716 |
| Eat Out to Help Out | 4 | – | 840 |
| Working Households Receiving Tax Credits | 4 | 719 | – |
| Total | 4 | 17,263 | 81,233 |
Our day-to-day running costs have continued to be impacted by COVID-19. This was primarily due to staff costs (including contingent labour) that were necessary in order to deliver the financial support schemes and compliance work, as well as estates and other running costs.
Table 3: COVID-19 administrative expenditure
| COVID-19 RDEL | 2021 to 2022 Outturn (spent) (£m) | 2020 to 2021 Outturn (spent) (£m) |
|---|---|---|
| Staff costs | 126 | 197 |
| IT costs | 7 | 53 |
| Other costs | 41 | 36 |
| Capital costs | 6 | 33 |
| Total | 180 | 319 |
Within the overall total expenditure on COVID-19, an amount of £125 million was ringfenced (as per the 2021 to 2022 Supplementary Estimate). Of this amount we spent £119 million, which resulted in an unused ringfence underspend of £6 million. This is due to reductions in estates, IT and output management costs following the closure of the COVID-19 financial support schemes.
Impacts on our expenditure: UK Transition
Our total budget for supporting the UK’s Transition from the EU was £1,082.5 million for 2021 to 2022, and our outturn was £973.8 million. The underspend of £108.7 million (10%) was mainly due to:
- lower demand for UK Transition activities: £31.4 million lower staff and other costs and £2.6 million reduction to support grants for small and medium-sized businesses
- £36.5 million reduction in spend on infrastructure delivery and operational running of Inland Border Facilities
- £30.9 million reduction in spend on border IT systems due to policy driven scope and design changes
- £7.3 million saved in the running of the Trader Support Service through efficiencies within the live service
Table 4: UK Transition programme expenditure
| UK Transition | 2021 to 2022 Outturn (£m) | 2020 to 2021 Outturn (£m) |
|---|---|---|
| Staff and other costs | 250.5 | 340.7 |
| Customs and SME support grants | 24.6 | 54.3 |
| Infrastructure | 161.5 | 112.2 |
| IT project costs | 388.5 | 325.9 |
| Trader Support Service | 148.7 | 102.7 |
| Total | 973.8 | 935.8 |
Significant balance sheet movements in 2021 to 2022
The following movements in asset and/or liability balances took place during this financial year:
Transfer of 100 Parliament Street (our head office) to the Government Property Agency
The decision for the Government Property Agency to take ownership of government offices (in line with the stated aim of delivering greater resilience and flexibility across the Crown Estate) resulted in a £207.6 million reduction in our balance sheet and a £40.1 million impact on our expenditure.
Increase in balance sheet value of our intangible assets by £471.3 million (29%)
The majority of intangible software assets are acquired as assets under construction, prior to going into live service.
The increase in the net book value of £471.3 million from the balance at 31 March 2021 (£1,606.5 million) to 31 March 2022 (£2,077.8 million) is mainly due to:
- additions to assets under construction of £526.5 million mainly comprising the development of IT software
- net increase to net book value from revaluation of IT software of £64.0 million
Significant reduction of £5.2 billion in cash and cash equivalents
The most significant element of the cash and cash equivalents balance at 31 March 2021 was the balance of monies drawn down to fund the COVID-19 support scheme payments. HM Treasury confirmed that part of the balance could be used for 2021 to 2022 ‘business as usual’ (BAU) spending rather than monies required for this purpose being drawn down separately. Between 1 December 2021 and 31 March 2022, £4,333.6 million of funds had therefore been transferred to the account for BAU spend, thus contributing substantially to the reduction in cash and cash equivalents at 31 March 2022.
COVID-19: our vital role in supporting customers and the UK economy
HMRC was at the very centre of the government’s economic response to the COVID-19 pandemic. We acted quickly and effectively to deliver financial support schemes that helped millions of individuals and businesses and protected the UK economy during unprecedented circumstances. Our latest estimates show that error and fraud rates in these schemes were significantly lower than originally thought.
How we delivered financial support
-
Coronavirus Job Retention Scheme (CJRS): CJRS was created to pay a proportion of the wages of employees who were furloughed during the COVID-19 pandemic. From April 2020, CJRS supported 11.7 million unique employments and 1.3 million businesses. HMRC expenditure on CJRS was over £68 billion. The scheme was initially due to end in April 2021 but was extended and closed on 30 September 2021. With each extension, the cut-off date changed, making more of the employer population eligible. From July 2021, an employer contribution towards the cost of unworked hours was introduced, which began at 10% in July and rose to 20% in August and September.
-
Self-Employment Income Support Scheme (SEISS): SEISS was created to support self-employed individuals and members of partnerships whose businesses had been impacted by COVID-19. A total of 5 grants were available, covering the period from the start of the pandemic to the closure of the scheme on 30 September 2021. SEISS grants 4 and 5 were paid out in financial year 2021 to 2022, and were based on 2019 to 2020 tax returns, which meant more individuals were potentially eligible to claim a SEISS grant for the first time. In 2021 to 2022, we paid out over £8.3 billion via SEISS 4 and 5. In total we paid out over £28 billion across all five SEISS grants.
-
Statutory Sick Pay Rebate (SSPR): SSPR was launched to help small to medium-sized employers with the cost of statutory sick pay during a severe wave of COVID-19. The original scheme ended on 30 September 2021, with customers allowed to make claims and amendments up to 31 December 2021. In 2020 to 2021 the scheme paid out a total of £62.5 million. In December 2021 the government announced that the SSPR scheme would be reintroduced due to the Omicron variant. We re-opened the online SSPR claims service on 19 January 2022, allowing claims to be backdated to 21 December 2021. The scheme closed on 24 March 2022, and in total we paid over £126 million.
-
Working Households Receiving Tax Credits scheme (WHRTC): The government made a one-off payment of £500 to working households receiving tax credits, to provide extra support during the pandemic. In 2021 to 2022, over 1.4 million customers were paid a total of £719 million.
-
Other measures: In January 2022, we gave Income Tax Self Assessment customers an additional month to file their tax return whilst avoiding a penalty, and until 1 April 2022 to pay or set up a Time to Pay agreement without incurring further penalties. We also introduced a route for agents to submit a bulk appeal for late filing penalties on behalf of their clients, if they had claimed COVID-19 as a reasonable excuse.
Over the course of the pandemic, we also delivered more than 80 targeted smaller measures in response to COVID-19. These clarified tax rules and made temporary changes to make tax easier for customers. Of these easements, 17 have since been made permanent.
Estimates of error and fraud rates in the COVID-19 financial support schemes
We published error and fraud estimates for the COVID-19 financial support schemes in our 2020 to 2021 Annual Report and Accounts. Since then, additional data has become available, and we have refined our methodology to improve the quality of our estimates for 2020 to 2021 as well as providing new estimates for 2021 to 2022.
We have recently completed and reviewed the results of a Random Enquiry Programme (REP) for CJRS claim periods from 1 March 2020 to 30 June 2020 and from 1 July 2020 to 31 October 2020. For SEISS, we now have Income Tax Self Assessment tax returns for 2020 to 2021. We also have further insight from our ongoing compliance activity.
This new data and analysis has led us to assess the total level of error and fraud in the schemes as significantly lower than we originally thought. This is largely driven by our reassessment of error and fraud in CJRS.
Previous provisional estimates for the total value of error and fraud in 2020 to 2021 across CJRS, SEISS and EOHO (Eat Out To Help Out) stood at between £4.5 billion and £8.0 billion, with a most likely estimate of £5.8 billion (an error and fraud rate of between 5.5% and 9.9% with a most likely estimate of 7.2%).
Across the full two-year lifecycle of the three schemes (covering 2020 to 2021 and 2021 to 2022), the total value of error and fraud is now estimated to be between £3.2 billion and £6.4 billion, with a most likely estimate of £4.5 billion (an error and fraud rate of between 3.3% and 6.5% with a most likely estimate of 4.6%). This is less than the previously published range for 2020 to 2021 alone.
For CJRS, new data means that we now attribute a larger proportion of the error and fraud to error than we previously published and, where we have more granular data from the REP, we have observed that the value of error and fraud in claims made by employers is low. As the economy began to re-open, the government changed the design of the CJRS scheme to recognise that some businesses could start to trade again, and people could begin returning to work in a measured way. The level of CJRS error and fraud fell considerably following the introduction of flexible furlough, which enabled customers to bring back employees part-time and still receive a grant to pay employees for hours not worked.
Table 5: Detailed error and fraud provisional estimates for CJRS by grant claim period (note 1) (note 2)
| Claim periods to which the policy applied: | 1 March 2020 to 30 June 2020 | 1 July 2020 to 31 October 2020 | 1 November 2020 to 30 September 2021 |
|---|---|---|---|
| CJRS rate | 8.0% [5.2% to 12.0%] | 2.8% [2.0% to 3.8%] | 2.8% [2.0% to 3.7%] |
| CJRS value | £2,335m [£1,607m to £3,708m] | £382m [£253m to £480m] | £742m [£534m to £987m] |
Note 1: Most likely estimates are presented together with the simulated 95% confidence interval for each phase of the CJRS scheme.
Note 2: The final claim period of the CJRS policy runs across the two financial years 2020 to 2021 and 2021 to 2022 as shown in the table above.
For SEISS, increased targeting in SEISS grants 4 and 5 resulted in a reduction in total expenditure in 2021 to 2022. We designed SEISS grants 4 and 5 using 2019 to 2020 tax returns as the basis for eligibility and grant calculation, then introduced the financial impact declaration turnover test for the fifth grant, which helped to target and reduce its cost. As anticipated, when we introduced grants 4 and 5, this opened additional avenues for error and fraud, so rates did increase.
Table 6: Detailed error and fraud provisional assessments for SEISS during financial year 2020 to 2021 by grant phase (note 1)
| Grant phase: | SEISS 1: 13 May 2020 to 13 July 2020 | SEISS 2: 17 August 2020 to 19 October 2020 | SEISS 3: 20 November 2020 to 29 January 2021 | SEISS 4: 22 April 2021 to 1 July 2021 | SEISS 5: 29 July 2021 to 30 September 2021 |
|---|---|---|---|---|---|
| SEISS rate | 3.4% [2.5% to 4.2%] | 3.3% [2.5% to 4.0%] | 2.9% [2.1% to 4.0%] | 2.3% [1.5% to 3.8%] | 8.6% [7.5% to 11.1%] |
| SEISS value | £258m [£192m to £320m] | £197m [£150m to £239m] | £176m [£130m to £251m] | £130m [£81m to £212m] | £246m [£212m to £316m] |
Note 1: Most likely estimates are presented together with the simulated 95% confidence interval for each grant phase of the SEISS scheme.
The estimated levels of error and fraud in the Working Households Receiving Tax Credits scheme (WHRTC) were very low, only between 0.4% or 0.6% (£2.6 million to £4.2 million), attributable to the design of this payment. Post-payment compliance on this work is carried out by our tax credits compliance teams and is not part of the Taxpayer Protection Taskforce.
Table 6 shows our updated provisional estimates for 2020 to 2021 and our new provisional estimates for 2021 to 2022 for all the support schemes, except WHRTC.
Read more detailed breakdowns of error and fraud in the COVID-19 financial support schemes in the Principal Accounting Officer’s Report and within note 4 of the Resource Accounts.
More detail on our approach to estimating the level of error and fraud can be found in our supporting technical publication.
Table 7: Estimates of error and fraud in the COVID-19 support schemes prior to HMRC’s post-payment compliance activities
| 2020 to 2021 | CJRS | SEISS | EOHO | Total |
|---|---|---|---|---|
| Claims plus accruals (£m) (note 1) | 61,507 | 19,745 | 842 | 82,094 |
| Unprompted repayments and disclosures (£m) | (797) | (41) | (2) | (840) |
| Net cost (£m) (note 2) | 60,710 | 19,704 | 840 | 81,254 |
| Error and fraud (%) (note 3) | 5.3% [3.7% – 7.6%] | 3.2% [2.4% – 4.1%] | 8.5% [5.1% – 11.8%] | 4.8% [3.4% - 6.8%] |
| Error and fraud amount (£m) (note 3) | 3,218 [2,246 – 4,614] | 631 [473 – 808] | 71 [43 – 99] | 3,920 [2,762 - 5,521] |
| 2021-22 | CJRS | SEISS | EOHO | Total |
|---|---|---|---|---|
| Claims plus accruals (£m) | 8,727 | 8,372 | – | 17,099 |
| Unprompted repayments and disclosures (£m) | (113) | (17) | – | (130) |
| Net cost (£m) (note 2) | 8,614 | 8,355 | – | 16,969 |
| Error and fraud (%) (note 3) | 2.8% [2.0% – 3.7%] | 4.5% [3.5% – 6.3%] | – | 3.6% [2.7% – 5.0%] |
| Error and fraud amount (£m) (note 3) | 241 [172 – 319] | 376 [292 – 526] | – | 617 [464 – 845] |
| Cumulative totals | CJRS | SEISS | EOHO | Total |
|---|---|---|---|---|
| Net cost (£m) | 69,324 | 28,059 | 840 | 98,223 |
| Error and fraud (%) (note 3) | 5.0% [3.5% – 7.1%] | 3.6% [2.7% – 4.8%] | 8.5% [5.1% - 11.8%] | 4.6% [3.3% - 6.5%] |
| Error and fraud amount (£m) (note 3) | 3,459 [2,418 – 4,933] | 1,007 [765 – 1,334] | 71 [43 to 99] | 4,537 [3,226 to 6,366] |
| COVID-19 yield achieved (£m) (note 4, note 5) | 762 | |||
| Error and fraud amount minus COVID-19 yield to date (£m) (note 6) | 3,775 [2,464 – 5,604] |
Note 1: Claims and accruals as reported in HMRC’s Annual Report and Accounts 2021 to 2022. Accruals are amounts relating to claims made in a financial year that were paid out in a later financial year.
Note 2: Repayments occur when customers entitled to a grant choose to repay it, or when customers repay following a prompt from HMRC or an unprompted disclosure. For the error and fraud calculation, when the repayment is prompted, this is considered as covid yield so is deducted later in the calculation. The error and fraud estimate then represents the amount available for recovery by HMRC through post-payment compliance.
Note 3: Ranges as presented in square brackets represent the lower and upper limits of the simulated 95% confidence interval presented together with the most likely estimate. Total percentages by scheme and financial year have been rounded to the nearest 0.1%.
Note 4: Defined as post-payment compliance only.
Note 5: Of which £536 million is from before the Taxpayer Protection Taskforce commenced and £226 million reported above to the end of 2021 to 2022 year.
Note 6: Totals given do not account for ongoing compliance activity in 2022 to 2023.
How we acted to prevent or recover error and fraud
In 2021 to 2022 we prevented more than £350 million from being lost through error and fraud in the COVID-19 financial support schemes, either by preventing losses through pre-payment compliance activity or by recovering overclaimed grants. This brought the total amount stopped or recovered since the start of the schemes to more than £1.2 billion, with compliance activity still ongoing.
Preventing losses before payments were made
We designed the COVID-19 support schemes so that payments reached claimants quickly and prevented fraud and error through eligibility criteria and the claim process itself. We always knew they could be attractive to fraudsters and claimants could make mistakes. However, volume of claims for essential support, and the speed at which this had to be provided, meant it was not possible to prevent every case of fraud and error prior to a payment being made. We prevented over 100,000 ineligible or mistaken claims from being made by building automated controls into the digital claim process, while our data and risking experts blocked suspicious claims that showed signs of criminal activity.
Since the schemes started, we blocked claims worth a total of £425 million via pre-payment checks, including 38,000 claims worth over £125 million in 2021 to 2022 and 29,000 claims worth over £300 million in 2020 to 2021.
Table 8: 2021 to 2022 pre-payment compliance activity results from blocked/rejected claims
| Number of pre-payment blocked/rejected claims | Value of pre-payment blocked/rejected claims £m | |
|---|---|---|
| CJRS | 18,796 | 86.25 |
| SEISS | 20,034 | 38.90 |
| EOHOS (note 1) | 0 | 0 |
| Total | 38,830 | 125.15 |
Note 1: EOHOS (Eat Out To Help Out Scheme) was closed in August 2020.
Post-payment compliance
We began post-payment compliance activity in July 2020 as soon as we had the powers to do so. Since then, we have taken a supportive and reasonable approach where mistakes have been made, giving customers the opportunity to correct them without fear of sanctions.
The government invested over £100 million in a Taxpayer Protection Taskforce of around 1,200 HMRC staff to combat error and fraud in the schemes. In 2021 to 2022 the taskforce opened more than 27,000 one-to-one compliance interventions and contacted over 63,000 people via letter campaigns. We have recovered around £226 million in 2021 to 2022, in addition to the £536 million we recovered during 2020 to 2021.
We do not seek to actively identify or address claimants who have made small errors, although we will correct them, working with the claimant, if we find them. We are focussing on identifying claimants who have knowingly overclaimed grants or retained them when they know they are not entitled to do so.
The table below sets out the post-payment compliance activity we have undertaken for each of the schemes during 2021 to 2022.
Table 9: 2021 to 2022 post-payment compliance activity results
| Number of One to Many nudge letters (note 1) | Value of One to Many Disclosures (£m) | Number of One to One Enquiries opened | Number of One to One Enquiries closed | Value of One to One Enquiries (£m) | |
|---|---|---|---|---|---|
| CJRS | 9,640 | 14.9 | 5,476 | 4,262 | 152.4 |
| SEISS | 53,986 | 7.0 | 21,816 | 20,225 | 44.9 |
| EOHOS | – | – | 605 | 327 | 6.4 |
| Total | 63,626 | 21.9 | 27,897 | 24,814 | 203.7 |
Note 1: Letters for CJRS are issued to employers who claim on behalf of employees, whilst for SEISS letters are issued to individuals.
Where we identify that the recipient of a COVID-19 support payment was not entitled to the amount they received, we recover that money via an Income Tax or Corporation Tax charge. As of 31 March 2022, £114 million of these charges remained outstanding, which is included within receivables reported in the Trust Statement.
In some cases, customers make an unprompted choice to repay money. From claims made in 2021 to 2022, a total of £130 million was returned to HMRC without any intervention or prompting, either because the claimant decided they no longer needed the money they claimed, even though they were entitled to it, or because they recognised an error and returned the money. Claimants also returned £840 million from claims made in 2020 to 2021.
Where we find fraudulent behaviour, we continue to take tough action to tackle it. Anyone who has kept money despite knowing they were not entitled to it, faces repaying up to double the amount, plus interest and potentially criminal prosecution in serious cases.
Our Taxpayer Protection Taskforce investigates the most serious abuses of the COVID-19 financial support schemes. We opened 16 criminal investigations during 2021 to 2022 – which are now at various stages – and made 26 arrests involving CJRS, SEISS and Eat Out to Help Out. These investigations often include fraud against more than one financial support scheme, and can involve a large number of companies, claims and suspects.
The majority of fraud is addressed through civil fraud investigation procedures, but where appropriate we will conduct criminal investigations and seek criminal prosecutions if it is in the public interest, particularly where the behaviour is very serious or where a criminal prosecution will act as a strong deterrent.
Table 10: Total number of criminal investigations and arrests 2021 to 2022 (note 1)
| Total number of criminal investigations (note 1) | Total number of arrests | |
|---|---|---|
| CJRS | 11 | 5 |
| SEISS | 0 (note 2) | 7 |
| EOHOS | 5 | 14 |
Note 1: Included in overall one-to-one enquiries into the COVID schemes.
Note 2: Due to cases either being opened in the previous financial year and where cases involved both CJRS and SEISS fraud, where the arrests are included in CJRS arrest figures.
Strategic objective 1: Collect the right tax and pay out the right financial support
Our first strategic objective reflects our core purpose and is a priority outcome for us as a department. We want to ensure that every part of the tax and customs administration system works for the benefit of society: bringing in the revenue due under the law, reducing the tax gap, giving the right financial support and operating in a transparent and even-handed way.
Our commitments in 2021 to 2022
In our Outcome Delivery Plan for 2021 to 2022, we made 8 commitments as part of our core work to collect the right tax and pay out the right financial support.
| Commitment | What we delivered | Status |
|---|---|---|
| Budget 2020, avoidance, evasion and non-compliance | We are on track to deliver Budget 20 measures to tackle tax avoidance, evasion and other forms of non-compliance that will raise an additional £4.7 billion between 2020 to 2021 and 2024 to 2025 | On track or complete |
| Budget 2021 compliance measures | We are delivering a range of Budget 2021 measures to tackle non-compliance and set up a Taxpayer Protection Taskforce to combat fraud in the COVID-19 support schemes. | On track or complete |
| Budget 2021 policy measures | In 2021 to 2022 we legislated for, and implemented, Budget 2021 policy measures including: a new 130% first-year capital allowance for qualifying plant and machinery assets and a 50% first-year allowance for qualifying special rate assets; a temporary extension to the loss carry back rules for trading losses of both corporate and unincorporated businesses; red diesel changes introduced through Finance Bill 2021 to restrict the entitlement to use red diesel and rebated biofuels from April 2022 for qualifying purposes | On track or complete |
| National Insurance Contributions (NICs) Bill 2021 | We supported ministers to successfully legislate for the 2019 manifesto commitments on Freeports NICs relief (which can be claimed if you have business premises in a Freeport) and an employer NICs veterans’ holiday (providing a zero-rate of secondary Class 1 NICs for employers who hire veterans on a civilian contract after leaving the regular armed forces). | On track or complete |
| New anti-evasion measures | We continued to implement measures to tackle tax abuse in the construction sector, crack down on illicit tobacco and prevent profit-shifting by multinational companies to avoid paying taxes. Measures that tackle tax abuse in the construction sector and require large businesses to notify HMRC where there is an uncertain tax treatment in their tax return have now been delivered. | On track or complete |
| Manage Time to Pay | We continued to support our customers with their finances as they recovered from the pandemic, including offering ‘Time to Pay’ arrangements where necessary. By the end of 2021 to 2022, we were supporting 843,000 taxpayers in this way. | On track or complete |
| Breathing space for problem debt and the Debt Respite Scheme | In May 2021 we implemented a Breathing Space scheme which allows customers with debt problems up to 60 days ‘breathing space’ from all creditor actions. In 2021 to 2022, 4,495 customers with a tax debt signed up for this. The second phase of the Debt Respite Scheme (the Statutory Debt Repayment Plan) is on track for implementation in 2024. It will allow qualifying customers to repay their debts over a 3-to-10-year period, depending on their circumstances. | On track or complete |
| Supporting introduction of Universal Credit | We continued to support the Department for Work and Pensions with the introduction of Universal Credit, aiming to close the tax credits system in September 2025. This included supporting DWP with their campaign to encourage tax credit customers to move voluntarily to Universal Credit. | On track or complete |
How we performed
Collecting the right tax
A key measure of whether the right tax is being collected is the UK tax gap – the difference between the amount of tax that should, in theory, be paid to HMRC, and what is actually paid. The latest tax gap figure available is for financial year 2020 to 2021 and this is estimated to be 5.1% (£32 billion) of total theoretical tax liabilities. This means that in the unprecedented circumstances of the onset of the COVID-19 pandemic, we secured almost 95% of all tax due. There has been a long-term reduction in the overall tax gap, falling from 7.5% in 2005 to 2006 to 5.1% in 2020 to 2021. Between 2017 to 2018 and 2020 to 2021 the overall percentage tax gap has remained low and stable.
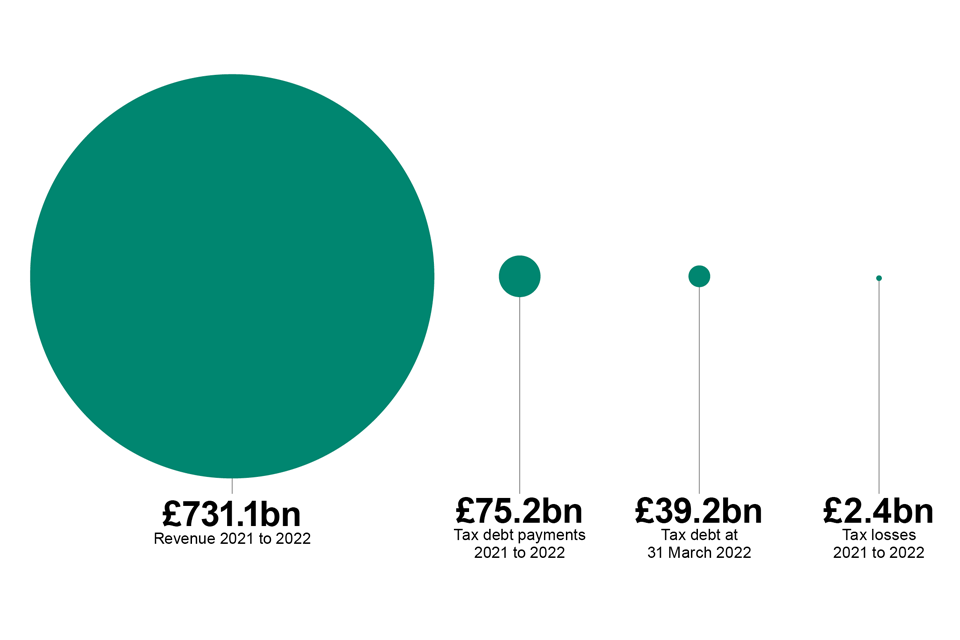
During financial year 2021 to 2022, as the pandemic continued to have a major impact on our customers and the UK economy, we collected total revenues of £731.1 billion (£122.3 billion more than the previous year). Figure 8 shows how total tax revenues have increased steadily up to financial year 2019 to 2020, before falling in 2020 to 2021, reflecting the significant impact of the COVID-19 pandemic on the economy. Most taxes saw increased revenue during the 2021 to 2022 financial year. Income Tax, National Insurance Contributions and VAT make up the three largest elements of total tax revenue, but it also includes a wide range of other taxes and duties (see a full breakdown chart by type of tax in figure 8).
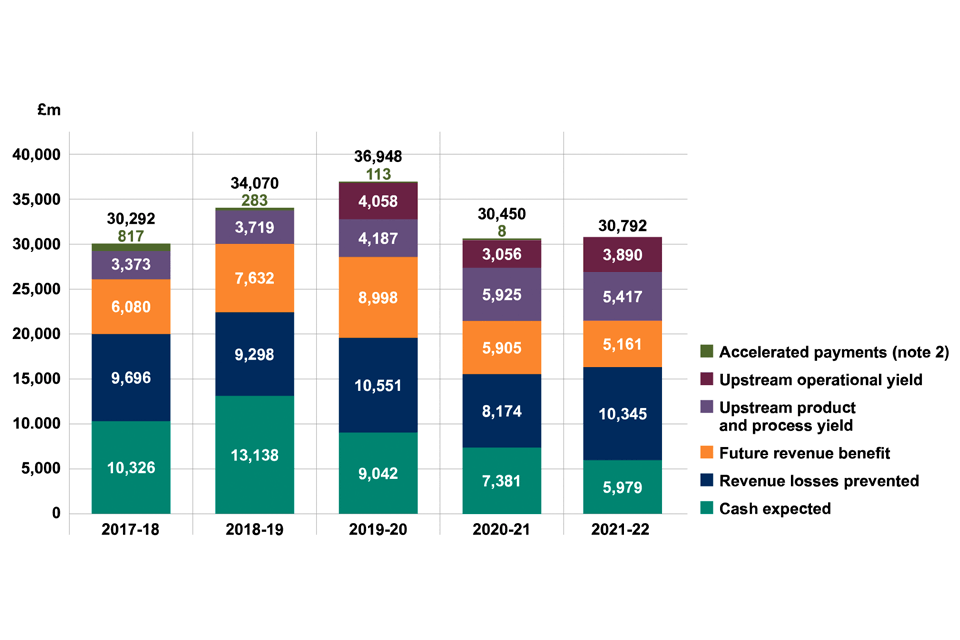
Compliance yield
Every year, we collect and protect billions of pounds of ‘compliance yield’ through our policy and process design and risk-based work to tackle non-compliance. This is tax revenue that would otherwise have been lost to the Exchequer through error, fraud and other non-compliance, so our compliance activity is a crucial part of keeping the tax gap small.
We collected and protected £30.8 billion in compliance yield in 2021 to 2022, similar to the £30.4 billion we delivered in 2020 to 2021 and lower than the £36.9 billion secured in 2019 to 2020, which was the last financial year prior to the COVID-19 pandemic (and also featured two exceptionally large and non-recurring cases). This measure does not include revenue collected or protected from our compliance work on the COVID-19 support schemes, which is measured separately – see Table 9.
Economic conditions, the COVID-19 pandemic and a number of other factors have impacted on compliance yield.
-
in 2020 to 2021, reduced levels of economic activity meant that tax liabilities and tax receipts were significantly lower, so we would naturally expect to collect less compliance yield. Tax receipts recovered in 2021 to 2022 to the levels we had forecast prior to the pandemic, but there is a lag from when a tax liability is created to compliance activity and then to yield. The reduced economic activity in 2020 to 2021 has led to less compliance yield in both 2020 to 2021 and 2021 to 2022
-
we redeployed HMRC tax compliance staff onto the Taxpayer Protection Taskforce to tackle non-compliance in the COVID-19 support schemes. We received additional funding for new people to backfill these tax compliance posts and as these new people are trained, we expect their performance to offset any opportunity cost from this year. This will be tracked as part of our usual engagement with the Office for Budget Responsibility on the Exchequer Impact of fiscal event measures
-
our most complex compliance activity can often take several years, and it is not unusual for the end date to move significantly with such variations averaging out over time. There were delays to several such cases which we had expected to close this year. This yield is still forecast to be delivered in future years
We make data-led, risk-assessed decisions on which cases to prioritise within our compliance work. Throughout the pandemic, we continued to work a balanced portfolio of risks to ensure our interventions had the greatest impact on overall compliance and protect the health of the tax system.
Read more detail on our response to error and fraud in the COVID-19 financial support schemes.
For more detail on tax and compliance activities across different customer groups, please see our technical note ‘Tax by different customer groups’.
Managing money owed to HMRC
When individuals and businesses owe taxes and duties, or tax credits to HMRC, we call these amounts ‘receivables’ for accounting purposes. At 31 March 2022, gross receivables amounted to £54.5 billion, compared to £69.6 billion at 31 March 2021, consisting of:
-
£51.2 billion for taxes and duties owed to HMRC (see Trust Statement). This has reduced from £65.3 billion as at 31 March 2021, mainly due to tax that was deferred under government measures during the pandemic being paid
-
£3.3 billion for tax credits owed to HMRC (see Resource Accounts)
Receivables in the Statement of Financial Position are reported after impairment, which is an estimate of potential non-payment. Therefore, they reflect the amount that is likely to be collected, taking into account the uncertain economic conditions.
HMRC’s debt balance
When amounts owed to HMRC become overdue for payment and are not under appeal, we categorise these as debts.
The debt balance at end of March 2022 was £41.6 billion, which is £15.9 billion lower than the balance at the end of March 2021. This includes £39.2 billion of tax debt (which equates to 5.4% of tax revenues) and £2.4 billion of tax credits debt.
The debt balance hit its lowest point since the start of the pandemic in January 2022 at £38.8 billion. Since then, it has steadily increased to £41.6 billion at the end of March 2022. We continue to secure payments significantly above pre-pandemic levels but not enough to prevent the debt balance increasing.
We understand that customers’ ability to pay is affected by macro-economic conditions, such as supply chain pressures and high inflation, and that some customers still have constrained finances from the pandemic. These conditions may persist beyond 2023 to 2024, with an associated impact on the debt balance. Therefore, we anticipate the debt balance remaining broadly static through 2022 to 2023, with initiatives to reduce it having a material impact during 2023 to 2024 and future years. The tax debt balance is likely to remain above the pre-pandemic average of 2.4% of tax revenues for some years.
At the end of March 2022, around 18% of the debt balance was in a managed position. In most cases this means the customer has entered an arrangement to pay in instalments. This was an increase of 7 percentage points on the pre-pandemic average. We expect the proportion of the debt balance in a managed position to increase steadily in the coming years as we engage with customers and many of them request to have an instalment arrangement.
In focus: How we helped customers to pay what they owe in instalments
UK VAT-registered businesses could defer VAT payments due between 20 March and 30 June 2020 either to 31 March 2021, or, if they applied for our ‘New Payment Scheme’, they could spread their payments across financial year 2021 to 2022.
As a result of the deferral period ending, during 2021 to 2022 we reduced the amount of deferred VAT debt from £22.5 billion to less than £1 billion, driving a reduction in the debt balance.
Time to Pay is a longstanding policy available to all businesses and individuals in temporary financial difficulty and unable to pay their tax in full on time. When agreeing a Time to Pay arrangement, we tailor the amount of payment and length of the repayment period to the customer’s circumstances to ensure payments are affordable, while clearing the debt as quickly as possible.
At the end of March 2022, we had £5.4 billion in Time to Pay arrangements. We aim to agree affordable and sustainable arrangements, and over 90% of debt entering a Time to Pay arrangement is paid as agreed.
Impacts on the debt balance in 2021 to 2022
The debt balance at the beginning of 2021 to 2022 was high due to the economic impact of the pandemic and decisions the government and HMRC made to mitigate this, such as allowing VAT from the first quarter of 2020 to 2021 to be deferred, and because we paused the majority of our debt pursuit activity for a total of 7 months during the highest level of public health restrictions (April to mid-June 2020 and mid-December 2020 to end of April 2021).
During the time we paused debt pursuit activity, we did not contact customers to seek payment or use any of our enforcement or collection powers. We continued to provide support – helping customers manage their tax debt, taking payments or agreeing arrangements to pay debt later or over longer periods as appropriate.
The COVID-19 pandemic continued to impact the debt balance throughout 2021 to 2022. Public health restrictions affected many customers’ ability to pay and hampered many of those with pre-existing debts from paying what they owe. We saw record levels of new debt created in 2021 to 2022.
We also saw record levels of debt cleared in 2021 to 2022. This was driven by our engagement with customers, the VAT New Payment Scheme managing down the deferred VAT debt and promoting the use of Time to Pay instalment arrangements.
Sometimes we can’t collect money owed to us - we take decisions on a case-by-case basis, and where we decide we can’t collect an amount it becomes a ‘tax loss’. Tax losses in 2021 to 2022 were £2.4 billion, split between remissions of £0.5 billion and write-offs of £1.9 billion. ‘Remissions’ describes money owed to us which we have decided not to pursue – for example, on the grounds of value for money. ‘Write-offs’ is the term used for money owed that we consider to be irrecoverable – for example, because there are no practical means of pursuing it.
Our approach to the debt balance in 2022 to 2023
Our approach in 2022 to 2023 remains that we strike a balance between doing everything we can to help customers with short-term financial difficulties and taking steps where customers don’t engage with us or refuse to pay. This balance is important – we need to collect money that funds public services and create a fair and even playing field for all customers, where everyone pays their fair share, but we understand the situation many of our customers find themselves in.
We are recruiting around 2,000 staff in 2022 to 2023, to make sure we’ve got more people available to support customers who need it. This represents both filling existing vacancies, as well as using the additional £62 million we received to fund around 500 additional Debt Management staff over the next three years.
We have resumed most of our debt enforcement activities, including in-person visits and insolvency action, and the placing of debts with Debt Collection Agencies (DCA). Our DCA partners only undertake desk-based activities, such as phoning customers, sending letters and SMS, and broadly speaking we only place debt with them after we’ve been unsuccessful in contacting the customers ourselves.
We will publish our plan to accelerate the rate we address the elevated debt balance in September 2022. This will include more detail on ways of measuring our performance in the current economic climate.
While the level of future losses is difficult to accurately forecast, as it is highly dependent on customers’ ability to pay, which is affected by the ongoing macro-economic conditions described above, we can anticipate losses from write-offs will increase in the coming years. This increase is anticipated due to both a ‘catching up’ of those insolvencies that would ordinarily have arisen during the pandemic period (but were temporarily prohibited as a result of the Corporate Insolvency and Governance Act 2020) as well as higher levels of new business failures reflecting tougher trading conditions.
Delivering financial support
Giving financial support to people is a core part of our purpose as a government department. In 2021 to 2022, we provided Child Benefit to more than seven million eligible families, supporting around 12.3 million children. Since we implemented our new Child Benefit IT service in February 2021, we have processed over 700,000 claims using the new service.
We also administer Tax-Free Childcare – and in 2021 to 2022 we saw a continuing upward trend of working parents claiming this. In March 2022, we supported 384,000 families with Tax-Free Childcare for 458,000 children, which compares with 282,000 families and 329,000 children in the previous year.
Although we are gradually transferring customers from tax credits to Universal Credit, administered by the Department for Work and Pensions (DWP), or Department for Communities (DfC) in Northern Ireland, we still provided tax credits to around 1.4 million families and 2.7 million children in 2021 to 2022. As part of the transfer to Universal Credit we also ended 152,000 claims during this financial year, of which over 146,000 involved active payments. We continued to work closely with DWP and DfC to help customers get their claims right before they move across to Universal Credit and maintained our performance in processing new UK claims and changes, taking an average of 15.4 days. For international customers we took an average of 84.1 days.
Tackling tax credits and Child Benefit error and fraud
Our approach to tackling error and fraud in tax credits and Child Benefit payments is increasingly focused on prevention - guiding customers to voluntarily meet their obligations and effectively manage their awards, through education and reminder campaigns.
We worked to keep overpayments in the tax credits system at no more than 5% of paid entitlement. As it takes around 14 months after the end of the tax year until all tax credits claims are finalised, our latest estimate of error and fraud for tax credits relates to 2020 to 2021. Our estimate suggests we met our expectation, with an error and fraud overpayment rate of 5.0% (£0.78 billion) of paid entitlement, in comparison to a final estimate of 5.3% or £0.94 billion in financial year 2019 to 2020. This level of error and fraud is in the context of ongoing pressures on resourcing for tax credits compliance work and changes to our usual compliance processes in response to COVID-19. To continue to support tackling error and fraud in tax credits, we secured additional compliance resource as announced in the March 2022 Spring Statement.
Our estimate of the overall level of Child Benefit error and fraud overpayment in 2021 to 2022 is 0.9% of total Child Benefit expenditure (£105 million), compared to the 2020 to 2021 estimate of 0.8% (£90 million).
Tax credits underpayments occur when an award for a tax year is finalised and it is found that HMRC has paid the claimant less than their finalised entitlement. Read more details on HMRC’s commitment to resolving underpayments.
Read more about error and fraud in the Principal Accounting Officer’s report.
Key performance metrics: Strategic objective 1
Figure 8: Total tax revenues
Total tax revenues represent all money HMRC received (or was due to receive), less any money that we owed or repaid. They are driven by the overall level of activity in the economy and the rates of taxation, allowances and reliefs set by Parliament and affected by our compliance activity. The chart below shows total tax revenues between financial years 2017 to 2018 and 2021 to 2022.

Figure 9: Compliance yield
Compliance yield is revenue collected and protected that would have otherwise been lost to the Exchequer through error or deliberate non-compliance, such as tax avoidance or evasion. It consists of a number of components as shown below (note 1).
Note 1: Numbers may appear not to sum due to rounding.
Note 2: Accelerated payments are incorporated within cash expected and upstream product and process yield from 2021 to 2022.
Accelerated payments: Disputed amounts of tax that people using tax avoidance schemes are required to pay up front within 90 days, and an estimate of the behavioural change caused by this policy.
Upstream product and process yield: Estimated annual impact on net tax receipts of legislative changes to close tax loop holes and changes to our processes which reduce opportunities to avoid or evade tax.
Future revenue benefit: Estimated effect of our compliance work on customers’ future behaviour.
Revenue losses prevented: Revenue that we prevented from being lost to the Exchequer.
Upstream operational yield: (Categorised with cash expected until 2019 to 2020) Estimated impact of operational activities undertaken to promote compliance and prevent non-compliance before it occurs. Does not include yield from legislative changes.
Cash expected: Additional revenue due when we identify past non-compliance, with a reduction to reflect revenue that we know will not be collected.
Figure 10: Receivables
When individuals and businesses owe taxes, duties, or tax credits to HMRC, we call these amounts ‘receivables’ for accounting purposes. The chart below shows receivables between financial years 2017 to 2018 and 2021 to 2022.
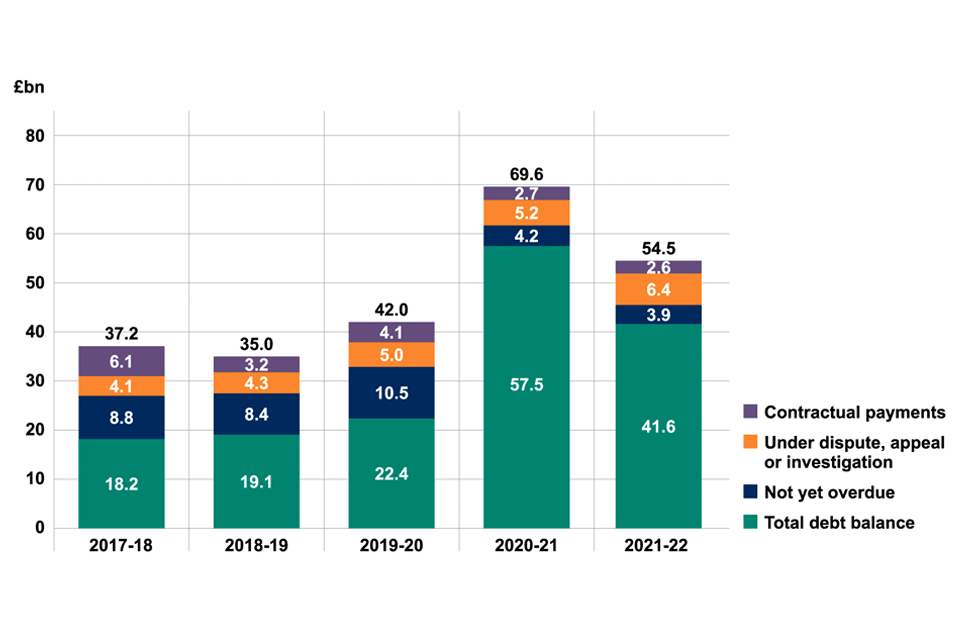
Figure 11: Total debt balance
The chart below shows the trend of our total debt balance between financial years 2017 to 2018 and 2021 to 2022
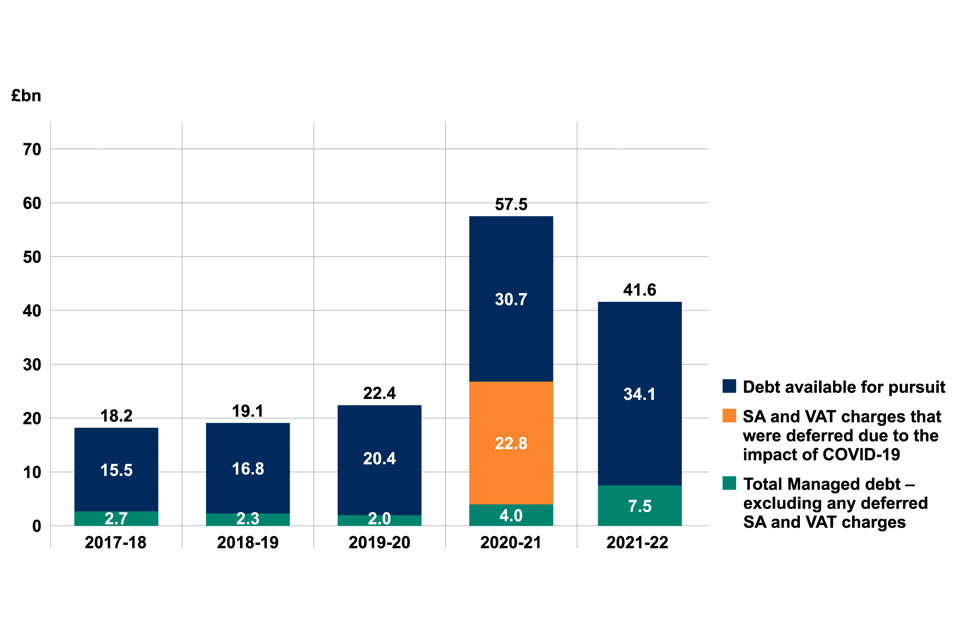
Figure 12: Tax debt and tax losses compared to revenue
The chart below shows a comparison of tax debt to total tax revenue.
Strategic objective 2: Make it easy to get tax right and hard to bend or break the rules
The most effective way of ensuring everyone pays the right tax is through the overall design of the tax system. Our approach is to make it easier for people to pay their taxes through good customer service, while making it hard to make errors or to avoid and evade paying tax.
Our commitments in 2021 to 2022
In our Outcome Delivery Plan for 2021 to 2022, we made 3 specific commitments as part of our work to make it easy to get tax right and hard to bend or break the rules.
| Commitment | What we delivered | Status |
|---|---|---|
| Supporting customers and making it easier to pay | We made progress towards delivering a Unique Customer Record (UCR) and Single Customer Account (SCA), powered by data received from taxpayers and a range of third parties. This year we determined the technical architecture for SCA, but there are risks to delivering UCR as planned due to resource availability and cost. | Risk to delivery |
| Contact Engagement Programme | Our Contact Engagement Programme will introduce a new telephony system which provides an intuitive user interface for customer-facing colleagues, allowing them to deal with queries in a more timely and accurate way. In May 2022, migration of the new platform commenced positively. There is a staged approach to migration of the platform, across lines of business throughout the course of 2022 to 2023, with the final line of business completing migration in August 2022. The new service will be rolled out to colleagues in HMRC, VOA and the Adjudicator’s Office. Programme closure is planned by the end of March 2023. | Risk to delivery |
| Making Tax Digital | We rolled out the mandating of Making Tax Digital for VAT-registered businesses with a turnover below £85,000 from April 2022. We also continued to pilot the Income Tax and Self Assessment (ITSA) service, which will be mandated from April 2024 for customers with business and / or property income over £10,000 per year. There are some challenges to getting the ITSA service right, which we are working to resolve. | Risk to delivery |
How we performed
Ensuring customers get tax right
It’s everyone’s responsibility to get their own tax right – but we can prevent non-compliance before it happens through well designed policies, processes, services and systems that make it harder to get things wrong. We can also help promote good compliance by educating and supporting our customers in their tax affairs, while continuing to respond robustly to those remaining non-compliant.
We apply this ‘prevent, promote, respond’ approach consistently for all our customers, whether they are individuals or small businesses with simple tax affairs, someone who needs extra support, or a large business or wealthy individual with complex circumstances. In all cases our actions are informed by a clear understanding of the risks and behaviours within each customer group.
In focus: How do customers rate their experience with us?
We conduct regular surveys of our customers on their experience with us. We use them to gain insight, understand what our customers need, and take action to improve the way we operate. Here is how small businesses, individuals and agents rated their experience of dealing with HMRC.
Ease of dealing with tax issues
Individuals: positive
57%
Small Businesses: positive
73%
Agents: positive
43%
Overall experience of dealing with HMRC over the last 12 months
Individuals: positive
62%
Small Businesses: positive
76%
Agents: positive
48%
Ease of finding information from HMRC
Individuals: positive
53%
Small Businesses: positive
64%
Agents: positive
47%
Promoting good compliance and preventing non-compliance
To support customers to get it right first time, and to remove opportunities and incentives for error or fraud, we undertake activity ‘upstream’ before a tax return is made. We base our activity on the known risks within each customer group and we engage with trade and industry groups to focus our interventions on those we believe will benefit most.
In 2021 to 2022 we:
- Undertook a range of activity to improve the experience of our customers undergoing compliance checks. See more about our work to embed the standards of the HMRC Charter in the Strategic objective 3 section
- Introduced the Domestic Reverse Charge to combat VAT fraud and the use of contrived supply chains and missing traders in the construction industry, resulting in increased payments and better compliance in the sector
- Worked with large retail stores to improve their understanding of how alcohol duty fraud was being committed using their wholesale products, enabling the retailers to cut off the illicit supply at source
- Provided targeted guidance to agents on the correct approaches to complex tax issues, enabling them to ensure returns were correct before being submitted to HMRC
- Started to publicly name tax avoidance schemes and those we consider promoted, or were involved in supplying, those schemes, using new powers
In focus: Using digital prompts to help customers get tax right
Digital prompts are a simple tool but can make a big difference to helping customers get their tax right – for example, flagging when a customer’s entry on our online Self Assessment (SA) system is out of line with what we expect to see. Our activity included:
- trialling more personalised and targeted prompts, including a prompt to customers in receipt of COVID-19 support scheme grants to account for the payments properly
- working on prompts in collaboration with commercial tax software vendors to maximise the impact on the large customer populations who no longer use HMRC software for their filing obligations
- developing a SA prompt targeted at self-employed people who do not contribute to private pensions, directing them to the Money Helper website for free impartial guidance
Customer experience on our digital and traditional channels
Providing a good experience for our customers across all our service channels is a vital element in preventing non-compliance and ensuring customers get their tax right.
Over the course of the pandemic, we made choices about the work we prioritised in order to protect our essential services and the livelihoods of our customer groups. We prioritised the COVID-19 support schemes, the UK’s smooth transition from the European Union (EU) and the essential services that keep the tax system running. In the first half of the year we stabilised our phone service and our tax credits and Child Benefit services, while we maintained our customs services well within expectations and supported the smooth running of the COVID-19 support schemes until they closed in October. This meant that some of our customer service levels were not where we would normally expect them to be, although we continued to see high levels of customer satisfaction with our digital services.
Across all our telephone helplines, adviser attempts handled – the proportion of callers wanting to speak to an adviser who were able to do so – was significantly below where we wanted it to be in April 2021 at 66.2%, but we improved as the year went on, achieving 71.2% by March 2022 and averaging 77.3% across the year. See more information in Figure 14: Telephony adviser attempts handled. We also faced challenges with our correspondence workload, which grew significantly driven by claims for tax relief for homeworking expenses and for repayment of tax deducted from interest in Payment Protection Insurance (PPI) compensation. The proportion of customer correspondence that we turned around within 15 working days was at 29.7% in April 2021, but by the end of March 2022 it had improved significantly to 65.4%.
We focussed on stabilising our phone service in the first half of the financial year. Once the bulk of the COVID-19 support schemes activity had been delivered, we were able to move more resources back into our core tax activities and add capacity through temporary recruitment.
Our focus over the second half of the financial year was on reducing the stock of correspondence that had built up during the pandemic whilst keeping our helpline service levels stable. By the end of the year, we had succeeded in reducing our correspondence stock to 1.9 million, down from a peak of 3.3 million in July 2021 and much closer to normal volumes. This stock level equates to around one month’s worth of correspondence receipts.
In December, we ran a trial reducing the hours on some of our telephony services so we could dedicate the time to working through our stocks of customer correspondence. We closed our VAT (with the exception of the bereavement line), and Corporation Tax (CT) phone lines on 3,10 and 17 December. This allowed us to successfully focus on processing CT repayments and VAT post, delays to which had been a key area of concern for customers and agents.
We also paused most of our webchat service for 3 months from 4 January 2022 to allow us to fully review these services. We found that webchat is most effective when we use it to answer simple queries or educate and coach customers in using our digital tools, but less efficient when supporting customers with complex queries. We’ll use this knowledge to help us deliver a more effective webchat service in the future.
Transforming our services
Our flagship Making Tax Digital (MTD) programme is designed to make it easier for businesses to get tax right by reporting closer to real time and with reduced risk of non-compliance. More than 1.7 million businesses have joined MTD for VAT since it was introduced in 2019, with independent research showing that users find preparing and submitting VAT returns easier, and that MTD has increased their confidence in managing their tax affairs and using technology.
In March 2022, we published research conducted by HMRC and peer reviewed by independent academics, which indicated that MTD for VAT is likely to have generated additional tax revenue (ATR) through reducing error. The latest MTD for VAT ATR estimate for 2021 to 2022 is £230 million, underpinned by methodology certified by the Office for Budget Responsibility (OBR). MTD for VAT was extended to include all VAT-registered businesses with a turnover below £85,000 for their first return on or after 1 April 2022.
Over the past year we have worked closely with partners in the business and tax communities on the design and scope of MTD for ITSA. In September 2021 we laid regulations in Parliament to help those impacted by the changes to prepare, and for their representatives to develop their own support and guidance. In recognition of challenges faced by many UK businesses and their representatives during the COVID-19 pandemic, and following stakeholder feedback, we will now introduce MTD for ITSA a year later than previously announced, in April 2024.
In March 2021, we also announced a new system of penalties for late payment and late submission of tax, beginning with VAT and ITSA. The new penalties will be introduced for VAT from 1 January 2023 and for customers mandated to use Maxing Tax Digital for ITSA from April 2024. For all other ITSA customers, the penalties will apply from April 2025.
Read Evaluating additional tax revenue from Making Tax Digital for VAT for more information.
Responding to non-compliance when it happens
When customers are not compliant with the rules, we work with them to get them back on the right track, and we tackle businesses and individuals who have tried to cheat the tax system – for example, in 2021 to 2022 we:
- recovered £195 million of assets from criminals and fraudsters, taking the overall figure recovered since 2016 to over £1 billion
- opened 265,000 compliance checks and closed 256,000
- collected or protected over £4.3 billion from our activity to tackle Serious Fraud
- achieved 215 criminal convictions, with a total of 262 years of custodial sentences. HMRC is increasingly targeting criminal investigations against the most serious fraud and delivering fewer, but better targeted, interventions against the hardest-to-reach targets. COVID-19 restrictions and pressure in the criminal justice system has resulted in additional reductions to the level of investigations, but numbers are expected to increase in 2022 to 2023 as pressures ease and HMRC is able to bring compliance activity, including criminal investigations, back to desired levels
- undertook our first seizure of cryptoassets including non-fungible tokens, as part of wider action taken against the use of Electronic Money Institutions for fraud
Our activity to tackle serious non-compliance has wider impacts beyond that which can be measured through compliance yield. It’s important that we take a broad view of our success in helping customers get tax right, taking account of harm prevention and the customer experience. To reflect this, we’re working on a broader range of measures, which will be introduced next year. See the Protecting society from harm section for more information about our work to respond to non-compliance.
Key performance metrics: Strategic objective 2
Figure 13: Customer experience – Net Easy
Our Net Easy performance metric is based on a survey offered after every telephone and digital interaction asking the question ‘How easy was it to deal with us today?’ The score represents the total of positive responses minus the total of negative responses to achieve a net score. The range for this score is -100 to +100, so a positive score reflects that more customers found it easy to deal with HMRC services than found it hard. HMRC started tracking Net Easy on our digital interactions in 2020 to 2021, expanding the scope to include telephone interactions in 2021 to 2022.
Figure 14: Telephony adviser attempts handled
Telephony Adviser Attempts Handled Percentage (AAH) is another core customer service performance metric that measures the proportion of callers that successfully got through to an adviser after hearing the automated messages and choosing to speak to an adviser. In 2021 to 2022 we received 35.2 million phone calls of which 29.0 million were handled either by an adviser or our automated systems, compared to receiving 33.3 million in 2020 to 2021.
In 2021 to 2022, ongoing challenges with recruitment and retention, as well as dealing with the additional correspondence demands and the level of stocks that built up as a consequence, meant HMRC’s AAH across all phone lines was 77.3%.
Historically we have reported against customer facing telephone numbers (such as tax credits, PAYE and SA) only. From 2021 to 2022, to enable HMRC to provide a complete picture of our telephony performance, we now include all HMRC helplines.
Webchat adviser attempts handled
The proportion of customers who requested a webchat that were then able to chat to an adviser remained consistent throughout 2021 to 2022 and averaged 92.9% for the year. Many of our webchat services were paused from January 2022 to March 2022 while we reviewed their effectiveness.
Figure 15: % of customer correspondence responded to within 15 working days of receipt
Customer correspondence this year included both post and iForms. In 2021 to 2022 we received a total of 16.3 million post items and 2.3 million iForms, compared to 15.7 million post items and 2.6 million iForms in 2020 to 2021 respectively. Out of the total customer correspondence received this year, 14.6 million required a direct response from HMRC. Where this is the case, we track the proportion we turned around within 15 working days of receipt, which was 45.5% across the year.
In 2021 to 2022, ongoing challenges with recruitment and retention, as well as a significant increase in our correspondence workload, meant stocks of correspondence accumulated while we prioritised work to stabilise telephone performance, alongside our work on the COVID-19 support schemes and the UK’s transition from the EU.
Strategic objective 3: Maintain taxpayers’ consent through fair treatment and protect society from harm
We want to ensure that we treat customers fairly when they are trying to get their tax right – providing support based on our Charter standards. We also have an important role to play in protecting society from harm by tackling promoters of tax avoidance, enforcing the minimum wage, preventing and tackling money-laundering and supporting wider law enforcement priorities, including modern slavery, economic and environmental crime.
Our commitments in 2021 to 2022
In our Outcome Delivery Plan for 2021 to 2022, we made 6 commitments as part of our work to maintain taxpayers’ consent through fair treatment and protect society from harm.
| Commitment | What we delivered | Status |
|---|---|---|
| Consolidating anti-evasion and avoidance measures and powers | This year we took further steps to ensure that our use of powers builds trust, and that safeguards are effective for taxpayers. We made improvements to guidance, including explaining how our safeguards operate, and assessed data ensuring our powers are applied proportionately and fairly. Having published additional compliance data, we are exploring wider publication of data on the use of our powers. Read more in the Powers and Safeguards section. | On track or complete |
| Tax credits underpayments | We helped customers to claim their full tax credits entitlement, so that underpayments through error would be no more than 0.7%. As it takes around 14 months after the end of the tax year until all tax credits claims are finalised, the latest estimate for underpayments relates to 2020 to 2021 and is 0.8% (£120 million). This means we were unable to meet our ambition to bring underpayments through error down to no more than 0.7%, likely due to the impact of the pandemic and the context of ongoing pressures on resourcing for tax credits compliance work and changes to our usual compliance processes in response to COVID-19. Underpayments are not significantly different in percentage terms from the 2019 to 2020 estimate of 0.9% (£170 million). COVID-19 had a significant impact on the administration of tax credits as frontline compliance staff were redeployed to customer service work and COVID-19 support schemes. | Risk to delivery |
| Tackling promoters of tax avoidance | We continued to tackle promoters of tax avoidance in line with our promoters strategy published in March 2020, including implementing legislation introduced in Finance Acts 2021 and 2022. Read more in the Protecting society from harm section. | On track or complete |
| HMRC Charter | We continued to increase colleagues’ awareness of our Charter and support them to develop the skills they need to deliver its standards. An internal staff survey in 2021 to 2022 suggested that 74% of HMRC colleagues knew about the Charter and 33% believed it influenced their work. While we recognise there is more to do, this provides a valuable baseline for measuring progress in embedding Charter standards. Read more in the Building public trust section. | Risk to delivery |
| Plastic Packaging Tax | We continued preparations to implement the new Plastic Packaging Tax, to encourage greater use of recycled plastic. All the necessary legislation was implemented and the IT service enabling businesses to register for the tax went live on 1 April 2022. | On track or complete |
| Sustainability targets | We achieved a reduction in carbon emissions to support our Net Zero ambitions and our targets under the Greening Government Commitments. We aim to achieve an 85% awareness score among colleagues of our Net Zero commitment by the end of 2022. Read more in the Becoming more sustainable section. | On track or complete |
How we performed
Building public trust
Ultimately, the tax system depends on public trust – this is founded on the experience customers have in their dealings with HMRC, as well as seeing that we apply the rules even-handedly and operate in a way that is recognised as fair.
We aim to increase transparency and build public trust by publishing more data and information on the exercise of powers. We publish key figures on our performance and activities online, as well as findings from our external research programme and a wide range of official and national statistics releases.
We have taken on board National Audit Office (NAO) recommendations and since September 2019, we have published several new metrics on a quarterly basis. These include customer experience, debt management, customs and compliance metrics such as net easy, closed civil and criminal compliance checks, prosecutions and criminal sentences, and outcomes of court decisions. We continue to work with external stakeholders to identify what other data and information could be published. We published HMRC’s Evaluation Framework in November 2021, outlining HMRC’s ambition for systematic evaluation, including the activities identified to achieve this and how it fits with wider government best practice guidance. It sets out HMRC’s criteria for making decisions about undertaking evaluation, which demonstrates how the department is moving towards its goal of maximising the impact of its spending through appropriate decisions on evaluation.
Customers want to know that we follow consistent standards – and the interactions they have with us shape their trust in the tax system. We define the service and standard of behaviour that customers should expect in our Charter and report on our performance in our Charter Annual Report. The Charter is underpinned by the principles of support for customers who need extra help. Although most of our customers can manage their own tax affairs, some need extra help when interacting with us as they go through life events, and the principles set out our commitment to providing tailored support and reasonable adjustments at the earliest opportunity.
In 2021 to 2022, our work to embed the standards of the HMRC Charter included:
- improving professional standards in our compliance activities, ensuring that compliance managers and their teams have the right skills to deliver the Charter standards, as well as continuing to develop new measures of professionalism and customer experience
- improving our processes, systems and guidance – for example, providing a smooth handover between compliance and debt management for customers who need extra help
- improving the quality of our customer letters by developing a single set of customer writing guidelines and training our colleagues to improve their clarity, empathy and tone
- publishing new guidance on GOV.UK to make sure our customers are aware of the extra help that is available to them if they need it
- strengthening links with the voluntary and community sector to support customers
Read our Charter Annual Report for 2021 to 2022 and our principles of support for customers who need extra help for more information.
In focus: Improving research and development tax reliefs
We are committed to ensuring that tax reliefs are used in the right way and that any attempt to abuse them to unfair advantage is prevented. At Spring Budget 2021 the Chancellor announced a review of the Research and Development (R&D) tax reliefs to ensure that they remain up to date, competitive and well-targeted. In response to the review, at Autumn Budget (and with further detail provided at Tax Administration Maintenance Day 2021), the government announced a package of measures to target abuse and improve compliance.
Read our tax relief statistics for more information.
Read more on tax reliefs error and fraud in the Principal Accounting Officer’s Report.
Powers and safeguards
To collect the tax revenue that pays for the UK’s public services and benefits system, it is important that we have the necessary powers to ensure everyone fulfils their responsibilities. Equally, to maintain and build public trust, the exercise of any powers must be accompanied with appropriate oversight and statutory safeguards. These provide taxpayers with the means to seek redress and help to ensure that HMRC acts proportionately, taking account of different taxpayers’ individual circumstances.
Safeguards for our customers, such as time limits for our enquiries and appeal rights against our decisions, are built into the tax administration framework. Through legislation, internal controls and governance, we offer a comprehensive set of safeguards for customers undergoing compliance checks.
In cases of fraud, wherever we can, we use our wide range of civil fraud investigation procedures and encourage people to come forward voluntarily, so that we can work with them to ensure their tax obligations are met. These disclosure opportunities give our customers the chance to put their tax affairs in order. This is an efficient and fair way of getting people back on track, whilst securing revenue for the Exchequer. We use criminal and specialist powers selectively, where non-compliant behaviour is severe, where we want to create a deterrent or where civil tax interventions will not work.
Following the 4 February 2021 publication of the report Evaluation of HMRC’s implementation of powers, obligations and safeguards introduced since 2012, we have continued to engage with taxpayers, voluntary organisations and community services, and tax professionals to deliver on the 21 commitments made in this evaluation.
Addressing customer complaints
Our aim is always to get our services right for our customers, but we also seek to deliver an easy and accessible complaints process when people experience difficulties. We want to reach the right outcome as soon as possible, acknowledging where we have made a mistake and learning from feedback.
We received 80,216 new complaints in financial year 2021 to 2022 compared to 78,542 the previous year. Although only a 2% increase year on year, when compared to 2019 to 2020, this represents an increase of 22%. The key drivers for the increase being complaints relating to the COVID-19 support schemes which continued into 2021 to 2022 and high levels of complaints about delays experienced by customers as we returned to our normal operational service levels post COVID-19. The larger number of complaints, and our focus on operational recovery, also meant we took longer to handle complaints this year, with new complaints taking on average 29.6 days to resolve compared to 16.3 days last year. The Adjudicator’s office investigates individual complaints that have gone through HMRC’s internal complaints process but have not reached a satisfactory resolution, providing a free, impartial, and independent service. If a customer remains dissatisfied with the decision, they can refer their complaint to the Parliamentary and Health Service Ombudsman (PHSO).
We work collaboratively with the Adjudicator to learn from complaints insight. Our formal response to the Adjudicator’s 2020 to 2021 annual report highlighted the progress made by HMRC to improve the complaint journey and further improve our customer experience. In 2021 to 2022 we worked with the Adjudicator to reduce the impact of cases that are prematurely escalated to their office, by ensuring focussed support for customers who need extra help and continuously improving customer communications. We reviewed our strategy for handling complaints and are continuing to develop, alongside the Adjudicator, a new case management system, CHART (Complaints Handling Analysis and Reporting Tool), which will be rolled out in 2022 to 2023.
We also work with the PHSO and other government departments to develop a shared vision for complaint handling through the Complaint Standards Framework. The framework sets out a single set of standards for colleagues across government to follow and provides a benchmark to help leaders learn from complaints. Although we do not have final figures from the PHSO about detailed investigations during 2021 to 2022 we continue to work closely with them on individual cases and comply with any recommendations made.
Read our response to the Adjudicator’s annual report 2020 to 2021 for more information.
Protecting society from harm
As well as working to operate the tax system in a way that ensures fairness for all taxpayers, we play a vital role in protecting society and the economy by making compliance the ‘norm’ and tackling those who set out to cheat or harm the tax system.
Tax avoidance involves ‘bending’ the tax rules to try and gain a tax advantage that was never intended, placing unfair burdens on the majority who pay their fair share and denying funds for our vital public services.
We take action to challenge the promotion of mass marketed tax avoidance schemes, working with partner bodies to debunk misleading communications. In 2021 to 2022 our work to tackle tax avoidance schemes included updating our “Tax avoidance: don’t get caught out” campaign to help contractors who work through an agency or umbrella company to understand their pay arrangements, so they don’t get an unexpected tax bill. We introduced a new interactive risk checker to help contractors check how they are being paid and whether they may be involved in tax avoidance. We are also now writing to all customers we suspect are involved in avoidance schemes within a few weeks of us becoming aware of their involvement.
Our Fraud Investigation Service (FIS) are a global leader in the fight against tax fraud. We have officers embedded in the National Economic Crime Centre (NECC) and engage in thousands of data exchanges with law enforcement partners each year. We are a key player in the major international governance groups aimed at tackling economic crime – such as the OECD – and are a founding member of the Joint Chiefs of Global Tax Enforcement (J5), an alliance which sees tax enforcement authorities from the UK, US, Netherlands, Canada and Australia work together to share tools, data, technology and expertise to tackle global tax crime. The J5 has a rapidly maturing portfolio of intelligence and investigative operations, focusing predominantly on international enablers of tax crime impacting both the UK and the other four jurisdictions in 2021 to 2022.
We continue to work with partner bodies to challenge misleading communications around mass marketed tax avoidance. After issuing a joint Enforcement Notice with the Advertising Standards Authority in November 2020, 14 websites have been shut down, and 8 have been amended to comply with the notice.
Tax fraud covers a wide range of illegal activity including deliberately submitting false tax returns to claim repayments, hiding income, wealth or assets offshore, or smuggling taxable goods. Some of this is carried out by determined individuals but organised criminal groups also deliberately target the UK’s tax system. When fraud does happen, we always seek to recover the money owed, using a range of powers and specialist investigation capabilities. We do this mostly using our civil powers, but we pursue criminal cases when it’s in the public interest.
Our role in protecting society from harm goes beyond enforcing tax compliance and preventing avoidance and evasion – we also play a part in tackling economic crime, as well as supporting government priorities on a broader range of crimes.
HMRC is one of the largest of the UK’s 25 Anti-Money Laundering Supervisors, which include the Financial Conduct Authority, the Gambling Commission and profession body legal and accountancy sector supervisors. We currently supervise the compliance of around 29,000 businesses across 9 sectors with the Money Laundering Regulations, checking they have systems and processes in place to protect themselves and their services from being exploited for the purposes of money laundering and terrorist financing. We have delivered all of our actions in the government’s Economic Crime Plan including the final commitment to increase interventions, carrying out 3,725 compliance interventions in 2021 to 2022, up from around 1,400 in 2018 to 2019.
We continue to enforce the National Minimum Wage (NMW), on behalf of the Department for Business, Energy and Industrial Strategy (BEIS), from education and outreach through to investigating suspected underpayments and helping recover wages owed. In 2021 to 2022 we supported over 7.8 million employers and workers to understand NMW law through our extensive, well-received educational and outreach programme which includes webinars, podcasts and direct communications. Although social distancing due to COVID-19 made progressing NMW investigations more challenging, in 2021 to 2022 we investigated 2,835 businesses and identified over £16.3 million in wage arrears for more than 120,000 workers.
We also work with domestic and international partners to address a broad range of government crime priorities, including the illegal drugs trade, modern slavery and child sexual exploitation and abuse. We have around 100 officers either embedded with law enforcement partners or directly supporting them, facilitating intelligence sharing and joint operations. This year we received and investigated 56 referrals where tax fraud was part of wider criminal behaviour. We also support work on non-tax crime priorities through participation in policy and strategy development and we contribute to a wide range of operational activity – for example, working with the Environment Agency on waste crime, which has fiscal and environmental impacts.
As a founding partner of the National Economic Crime Centre (NECC), we worked to enhance the cross-government response to tackling economic crime and engaged in thousands of data exchanges with our law enforcement partners. In September 2021 we took part in the fifth international annual exchange of Common Reporting Standard data. We exchanged with 91 jurisdictions and around 7.4 million accounts were reported to us, significantly increasing the volume and quality of data we receive to combat all forms of non-compliance.
In focus: Plastic Packaging Tax
During financial year 2021 to 2022 we continued preparations to introduce a new Plastic Packaging Tax to support the government’s environmental plans to tackle plastics pollution. Working closely with industry on the detailed design of the tax, we’ve legislated for the tax to be charged on plastic packaging manufactured in, or imported into the UK, which contains less than 30% recycled plastic. A new income tax service has been introduced, enabling businesses to register from 1 April 2022 when the tax came into force.
Becoming more sustainable
An important part of maintaining taxpayers’ consent is through demonstrating our commitment to being a sustainable organisation. We’re doing this through our commitment to Net Zero, the Greening Government sustainability targets and UN sustainable development goals, as well as a wide range of other social, environmental and economic measures.
The Greening Government Commitments Framework sets out the actions government departments and their agencies will take to reduce their environmental impacts between 2021 and 2025, against the new 2017 to 2018 baseline. The table below shows how we’re performing against our Greening Government sustainability targets.
See more detail on key Greening Government Commitment targets in Annex 3 Sustainability data tables.
Table 11: Performance against Greening Government Commitment targets
Table 11.1: Greenhouse gas emissions
Our target for greenhouse gas emissions combines emissions from our buildings and our domestic business travel. The 56% reduction is due to the impact of COVID-19 and our move from legacy offices into more energy-efficient regional centres. Read a breakdown of total greenhouse gas emissions data in Annex 3.
| Target (2025) | Baseline (2017 to 2018) | Progress from 2018 to 2019 to 2020 to 2021 (Tonnes of CO2e) | Performance in 2021 to 2022 |
|---|---|---|---|
| 60% reduction (35,353 tonnes of CO2e) | 88,382 tonnes CO2e (1.16 tonnes CO2e per FTE) | 2018 to 2019: 74,662 2019 to 2020: 60,036 2020 to 2021: 50,479 | 56% reduction since 2017 to 2018 baseline (38,452 tonnes of CO2e 0.61 tonnes CO2e per FTE) |
Table 11.2: Direct building emissions
The 26% reduction in our direct building emissions is a result of reduced occupancy due to COVID- 19 and our move from legacy offices – many of which used oil for heating – into more energy efficient regional centres.
| Target (2025) | Baseline (2017 to 2018) | Progress from 2018 to 2019 to 2020 to 2021 (Tonnes of CO2e) | Performance in 2021 to 2022 |
|---|---|---|---|
| 40% reduction (15,238 tonnes of CO2e) | 25,397 tonnes of CO2e (0.32 tonnes of CO2e per FTE) | 2018 to 2019: 24,954 2019 to 2020: 21,921 2020 to 2021: 25,094 | 26% reduction since 2017 to 2018 baseline (18,678 tonnes of CO2e 0.30 tonnes of CO2e per FTE) |
Table 11.3: Domestic flight emissions
We travelled more in 2021 to 2022, following the lifting of COVID-19 restrictions, but travel was still significantly reduced from pre-pandemic levels. We took 3,335 domestic flights (194 tonnes of CO2e), a reduction of 91% (33,301 fewer flights) against the 2017 to 2018 baseline. 46% of our domestic flights were to or from Northern Ireland. We also travelled 2.4 million miles for international travel in 2021 to 2022, a reduction of 70% against the 2017 to 2018 baseline. Read more detail in Annex 3.
| Target (2025) | Baseline (2017 to 2018) | Progress from 2018 to 2019 to 2020 to 2021 (Tonnes of CO2e) | Performance in 2021 to 2022 |
|---|---|---|---|
| 30% reduction (1,539 tonnes of CO2e) | 2,198 tonnes (CO2e 0.59 flights per FTE) | 2018 to 2019: 2,320 2019 to 2020: 1,558 2020 to 2021: 47 | 91% reduction since 2017 to 2018 baseline (194 tonnes of CO2e 0.05 flights per FTE) |
Table 11.4: Ultra-Low Emission Vehicles
We are working towards 25% of our vehicle fleet being ultra-low emission by December 2022 and installing charge points at our sites. At 31 March 2022, 82 of our fleet of 992 vehicles were either battery electric or plug-in hybrid.
| Target (2025) | Baseline (2017 to 2018) | Progress from 2018 to 2019 to 2020 to 2021 (Tonnes of CO2e) | Performance in 2021 to 2022 |
|---|---|---|---|
| 25% Ultra-Low Emissions Vehicles by December 2022 and 100% zero emission vehicles by December 2027 | N/A | N/A | 8.3% of all fleet and hire vehicles (9.6% excluding vans) No baseline set for this target |
Table 11.5: Waste generated
A reduction in our overall waste generated was impacted by having fewer colleagues on our sites during the pandemic. However, reductions have also been achieved through smarter waste management, behaviour change, reductions in paper use and IT efficiencies.
| Target (2025) | Baseline (2017 to 2018) | Progress from 2018 to 2019 to 2020 to 2021 (Tonnes of CO2e) | Performance in 2021 to 2022 |
|---|---|---|---|
| 15% reduction (8,044 tonnes) | 9,464 tonnes (0.12 tonnes per FTE) | 2018 to 2019: 8,504 2019 to 2020: 8,868 2020 to 2021: 4,980 | 48% reduction since 2017 to 2018 baseline (4,921 tonnes 0.08 tonnes per FTE) |
Table 11.6: Waste to landfill
Although just 0.20% (9 tonnes) of waste has gone to landfill, we are working hard to reduce this to zero. As the operator of the Landfill Tax, we are acutely aware of the need to reduce our reliance on landfill as a waste solution, and we continue to work with our suppliers to minimise this.
| Target (2025) | Baseline (2017 to 2018) | Progress from 2018 to 2019 to 2020 to 2021 (Tonnes of CO2e) | Performance in 2021 to 2022 |
|---|---|---|---|
| 5% or less | 1.9% | 2018 to 2019: 1.2% 2019 to 2020: 0.7% 2020 to 2021: 0.5% | 0.20% to landfill (9 tonnes) |
Table 11.7: Waste recycled
The percentage of waste recycled is significantly impacted by the disposal of confidential paper. We expect our recycling figures to fluctuate as we continue to dispose of confidential paper and other material as part of our transition to new regional centres.
| Target (2025) | Baseline (2017 to 2018) | Progress from 2018 to 2019 to 2020 to 2021 (Tonnes of CO2e) | Performance in 2021 to 2022 |
|---|---|---|---|
| At least 70% | 81% | 2018 to 2019: 78.4% 2019 to 2020: 80% 2020 to 2021: 85% | 76% recycled (3,759 tonnes) |
Table 11.8: Water consumption
A large part of the reduction in our water consumption was due to having fewer colleagues in offices during 2021 to 2022 and moving into more water-efficient regional centres. However, a downward trend in our water consumption was already evident from reducing the size of our estate, promptly repairing water leaks, and taking other water efficiency measures.
| Target (2025) | Baseline (2017 to 2018) | Progress from 2018 to 2019 to 2020 to 2021 (Tonnes of CO2e) | Performance in 2021 to 2022 |
|---|---|---|---|
| At least 8% reduction (520,792 m3) | 566,078 m3 (7.12 m3 per FTE) | 2018 to 2019: 539,633 2019 to 2020: 524,115 2020 to 2021: 283,474 | 58% reduction since 2017 to 2018 baseline (239,140 m3, 3.80 m3 per FTE) |
Table 11.9: Paper purchased
The fall in paper consumption is driven by our digital transformation, which includes the launch and promotion of user-friendly digital services for colleagues and customers. Millions of customers are now using our Personal Tax Accounts and Business Tax Accounts to handle their tax affairs quickly and easily online, leading to a reduction in paper-based communication.
| Target (2025) | Baseline (2017 to 2018) | Progress from 2018 to 2019 to 2020 to 2021 (Tonnes of CO2e) | Performance in 2021 to 2022 |
|---|---|---|---|
| 50% reduction (147,649 reams of A4 equivalent) | 295,297 reams of A4 (4.72 reams per FTE) | 2018 to 2019: 205,190 2019 to 2020: 142,389 2020 to 2021: 23,039 | 92% reduction since 2017 to 2018 baseline (22,831 reams of A4 equivalent, 0.34 reams per FTE) |
Read a breakdown of total greenhouse gas emissions data and more detail on domestic flight emissions in Annex 3 Sustainability data tables.
Achieving Net Zero by 2040
We have set a target for HMRC to be Net Zero by 2040. This means reducing carbon emissions to their lowest amount possible, using offsetting only as a last resort. We are developing a roadmap towards a Net Zero estate and a plan for electric vehicle charging infrastructure. We have also established a sustainability governance model to help us make responsible and sustainable decisions and embed Net Zero and sustainability into our ways of working.
Sustainable construction and adapting to climate change
We will have a climate change adaptation plan in place by 2025. We use digital information to monitor the internal and external environment of our buildings. Throughout our regional centre development programme, we have used information from construction and fit-out stages to support our strategic decisions, manage our assets better and reduce their operational impact.
Our new regional centres will all achieve a BREEAM (Building Research Establishment’s Environmental Assessment Method) excellent rating, with refurbished buildings achieving a BREEAM very good rating. They will have an Energy Performance Certificate rating in the top quartile, in line with government requirements. We are working with our construction partners and developers to maximise local resourcing of materials and labour.
Sustainable procurement
Government Buying Standards (GBS) are embedded in our contracts and we encourage our suppliers to go beyond the minimum requirements. The facilities management and catering contracts for our regional centres have all met GBS best practice.
Our catering providers comply with GBS for food, including procuring sustainable palm oil, palm kernel oil and derivatives. We also encourage our catering providers to procure food that meets British or equivalent production standards and to reduce their environmental impact. All our IT purchases meet or exceed the relevant GBS. We also carry out Sustainability Impact Assessments to make sure that all our devices meet sustainability requirements on power saving and repairs.
We are committed to reducing plastic waste from our estate and are on track to meet the Greening Government Commitment target to remove consumer single use plastic from the central government office estate by 2025. Reuse schemes will be considered where appropriate.
Since 2009, we have used a sustainability assessment tool to measure the environmental, social and economic impact of our supply chains. Suppliers are scored annually against a number of themes. Response rates dropped during the COVID-19 pandemic, and we are working to support more suppliers to complete this assessment.
Nature recovery, biodiversity action planning and rural proofing
We do not have a nature recovery plan as we have relocated to city centres with minimal green space. Work is underway to review our Inland Border Facilities and the opportunities they present to enhance nature and biodiversity. Policy leads consider rural proofing and climate change adaption on an ad hoc basis; however, there is no formal reporting of these considerations and we will consider where this may be necessary. HMRC Policy professionals have guidance on a range of impacting considerations including rural proofing, when developing policy. We continue to develop our guidance and learning materials, relating to this and other impacting work, for policy professionals.
Social responsibility
We supported 2,934 days of employee time for community activity in 2021 to 2022, encouraging our employees to work with schools, charities and third sector organisations and to participate in public duty roles such as being school governors or magistrates.
We also support colleagues who volunteer to serve in the Armed Forces Reserves. We currently have around 122 colleagues actively serving as part-time volunteer reservists (127 including VOA), several of whom have been mobilised in the last 12 months to support operations across the globe and provide military aid to civilian authorities in the UK. We offer 15 days paid special leave per year for reservist training or duties, ensuring our reservists are ready to support regular forces in times of crisis.
We also raised and donated £895,038 to charities in 2021 to 2022, including more than £12,000 for our annual BBC Children in Need appeal. The total includes £523,842 donated by colleagues individually through Payroll Giving to more than 900 charities of their own choice, and £326,562 raised and donated to the Charity for Civil Servants.
We take an active role in promoting economic sustainability through our external outreach. This year we had an average of 4,585 monthly views of our Tax Facts animations for young people, and our teaching and home learning packs were downloaded 876 times.
How we contribute to UN Sustainable Development Goals
We contribute to achieving a number of UN Sustainable Development Goals through our work.
| Strategic objective | What we’re doing | UN Sustainability Goals |
|---|---|---|
| Collect the right tax and pay out the right financial support | We are ensuring that the tax and customs system continues to work in the right way to bring in revenue due and working to maintain the long-term reduction in the tax gap. | 1 – No poverty, 8 – Decent work and economic growth |
| Make it easy to get tax right and hard to bend or break the rules | We are expanding and improving our digital services and data systems, including extending Making Tax Digital for VAT and Income Tax. | 8 – Decent work and economic growth |
| Maintain taxpayers’ consent through fair treatment and protect society from harm | We are protecting society from harm by reducing our own carbon emissions and those in our supply chain, working towards Net Zero by 2040. | 13 – Climate action, 17 – Partnership for the goals |
| Make HMRC a great place to work | We are building the leadership, tax and digital skills that we need for the future. By 2025, we will see an increase of 25% in the number of young people in our target audience who have seen our Tax Facts animations. We also launched British Sign Language versions of our Tax Facts videos in March 2021. | 4 – Quality education, 5 – Gender equality, 10 – Reduced inequalities |
| Support wider government economic aims through a resilient, agile tax administration system | We are improving our technology and data to ensure that the UK has a more resilient, agile tax administration system. | 1 – No poverty, 8 – Decent work and economic growth |
Key performance metrics: Strategic objective 3
Figure 16: Customer experience: customer satisfaction
Our current key measure of how we are maintaining taxpayers’ consent is through overall customer satisfaction. For 2021 to 2022 we extended reporting customer satisfaction to include phone contact as well as webchat and digital services, therefore the data is not comparable to previous years’ data. We achieved 65.5% customer satisfaction on our phone services, and 83.4% customer satisfaction across all our digital services (including webchat).
Table 12: Sustainable ICT
Our ICT strategy complies with the Greening Government Commitments, GBS, the government’s Cloud First policy and the Waste Electrical and Electronic Equipment Directive. It is designed to reduce our impact on the environment by increasing digital and hybrid ways of working, using more sustainable hardware and reaching a target of moving 100% of our onsite data centres to the Cloud by 2024. Our strategy will enable us to make efficient use of sustainable energy, using providers who are committed to Net Zero and renewable power. ICT waste reused includes waste that is redeployed across HMRC.
| 2019-20 (tonnes) | 2020-21 (tonnes) | 2021-22 (tonnes) | |
|---|---|---|---|
| Reused | 199 | 124 | 231 |
| Recycled | 65 | 48 | 122 |
Strategic objective 4: Make HMRC a great place to work
We’re proud of our workforce and we want them to feel trusted, respected and confident in their roles while working in modern, inclusive environments. By attracting and retaining skilled and engaged colleagues, we’ll also deliver a better service for our customers. This chapter provides an analysis of our approach to employee engagement, our employment offer, health and wellbeing, equality, diversity and inclusion, and whistleblowing.
Our commitments in 2021 to 2022
In our Outcome Delivery Plan for 2021 to 2022, we made 2 commitments as part of our activity to make HMRC a great place to work.
| Commitment | What we delivered | Status |
|---|---|---|
| Employee engagement | We continued to improve the working experience for colleagues and make progress towards achieving the Civil Service Employee Engagement Index (EEI) benchmark. Our People Survey EEI for 2021 to 2022 was 59% compared to 57% in 2020 to 2021. | On track or complete |
| Equality, diversity and inclusion | As of March 2022: | On track or complete |
| 17.1% of our colleagues have an ethnic minority background, up from 13.8% in March 2020 (target 15% by March 2024) | ||
| 46.5% of our colleagues are women in SCS roles, up from 45.8% in March 2020 (target 50% by March 2024) | ||
| 13.4% of our colleagues are disabled, compared to 13.5% in March 2020 (target 15% by March 2024) | ||
| 6.3% of our colleagues have an LGBO (Lesbian, Gay, Bisexual and Other) sexual orientation, up from 5.3% in March 2020 (target 6% by March 2024) | ||
| Declaration rates for each of the diversity fields have been steadily increasing, although none have yet reached the target we want to reach of 85% by March 2024. The declaration rate for disability was 72%, for ethnicity 78.1%, and for sexual orientation 69.2% | ||
| New diversity fields for socio-economic background have been introduced. |
How we performed
During financial year 2021 to 2022, it was vital to protect the wellbeing of everyone working for HMRC during the ongoing pandemic. We continued to ensure our offices were open and safe for the thousands of colleagues working from them. We also continued to support all colleagues who were working from home through investment in IT, equipment and wellbeing support. From March 2022, we were welcoming colleagues who had worked from home during the pandemic back to the office, under our new hybrid office-home working model. Throughout the year, we continued to focus on our five priorities for making HMRC a great place to work:
- Connection to purpose: having pride and confidence in what we do and sharing that pride with others
- A great environment: creating a fair, kind and human culture and a physical and digital environment that supports collaboration
- Enabling colleagues to do their best work: resulting in an easier, more straightforward and supported experience
- An attractive employment offer: including fair pay and support for flexibility in when, how and where we work
- A continuous learning culture: focussing on the skills we need for the future
Connection to purpose
To make HMRC a great place to work, we need to understand how engaged colleagues are and how they feel about working here, and act on their feedback. Each year we undertake a ‘People Survey’ to find out about the experience of people working in HMRC.
The EEI measures the connection colleagues feel to HMRC’s purpose, and how motivated and proud they feel in their work. Our score for 2021 was 59% – a 2 percentage point increase on 2020 and the second consecutive year it’s increased.
Our Inclusion and Fair Treatment Theme score in the People Survey 2021 also rose from 78% in the previous year to 81%, and 90% of respondents feel that they are treated with respect by the people they work with. See Table 13: Annual survey measure on fairness for more information.
We saw particular improvements in the scores of ethnic minority colleagues compared to the 2020 survey.
Encouragingly, the number of colleagues reporting bullying, harassment and discrimination continued to decrease – but with 7% declaring that they were bullied and/or harassed and 8% declaring that they were discriminated against. We do not accept bullying, harassment or discrimination and are committed to being an inclusive and respectful organisation that is representative of the UK population that we serve.
We have a wide range of actions in place to create the changes we need to make to eliminate discrimination, foster good relations between colleagues and make sure there is equality of opportunity within HMRC, as described in our Equality Objectives. Actions are focussed on all aspects of the employee lifecycle, and we are investing in ensuring we have the data and insight, skills and resources to focus on areas where we need to take most action – for example, closing disparity on ethnicity and improving the support to disabled colleagues.
In 2021, HMRC’s overall mean pay gap has reduced by 1.6% from last year’s figures, and 4.4% overall over the last 2 years. A major factor is more women having been promoted or recruited to higher grades. Our median gender pay gap has increased over the last year by 2.9%, although over the last 2 years it has reduced from 9.3% to 8.8%. The median gap is influenced by the higher proportion of women compared to men in the lower grades at AA and AO. This means a drop in the median salary for women when compared with the median for men.
Creating a more gender balanced workforce takes time and it also takes a holistic approach. We will continue our efforts to embed equality, diversity and inclusion into every policy and process, raise awareness of flexible and part-time working for all genders, encourage career development, and ensure our colleagues have the right support and guidance to make gender inclusive decisions.
Read HMRC’s equality objectives and HMRC’s gender pay gap report for more information.
A great environment
Our locations strategy, announced in 2015, remains key to enabling delivery of all our departmental objectives. Increasingly, we are operating out of large, modern regional centres as bases for colleagues to work together and be part of a professional community, creating opportunities and career paths in every region and country of the UK. Of around 170 ageing HMRC offices which were open when the locations programme was launched, 154 have now closed to employees, including 20 during 2021 to 2022.
In 2021 to 2022 we opened regional centres in Birmingham and Liverpool to join the seven regional centres already operational in other cities. Since then, Nottingham and Glasgow opened in April 2022 and Manchester in May 2022. We have also confirmed the new city centre location for our Newcastle Regional Centre and announced plans to keep a long-term presence in Portsmouth and East Kilbride. These sites will give us flexibility to accommodate colleagues in a way that best serves our customers.
In focus: Places for Growth
We were in the vanguard of the government’s Places for Growth agenda – and since 2016, we have relocated around 1,800 roles out of London. We are committed to moving a further 2,500 by 2030.
Hybrid office-home working has enabled us to optimise our use of space in our new buildings. We are working across government, in partnership with the Government Property Agency, to respond to demand from other departments for space outside London. We anticipate that by Autumn 2022, our regional centres will accommodate up to 10,000 full-time equivalent colleagues from other departments, alongside our own people.
A great working environment does not just mean our physical workspaces and digital environment, but our culture as well. This year we took action to make our workforce at all levels representative of the communities we serve, and to ensure our recruitment processes are fair and accessible. More than 50,000 colleagues participated in race equality workshops and we have consolidated our work on race equality through departmental-wide and customer-group level action. We also continued our Respect at Work programme to identify and remove barriers to living out Our Commitments of being, fair, kind and human.
Other equality, diversity and inclusion highlights for 2021 to 2022 include:
- implementing actions to improve the representativeness of our workforce at all levels and ensure our recruitment processes are fair and accessible
- continuing to improve the quality and transparency of our diversity data to enable an evidence-based approach to equality, diversity and inclusion across HMRC
- creating a more granular break-down of ethnicity data of our HMRC workforce against regional benchmarks, and including it in the quarterly diversity data packs accessible to all staff to reflect progress
- starting to monitor colleagues’ socio-economic backgrounds to broaden our approach to equality, diversity and inclusion
- developing, and rolling out, a template for career development programmes, which regions can tailor to different groups of colleagues
- being recognised in the Business Disability Forum’s Disability Smart Awards 2021 in the Disability Confident COVID-19 Innovation category for our approach to assistive technology
- continuing to support our diversity staff networks and conducting regular consultation with them about HR policy and development, including on return to the office
The health, safety and wellbeing of our employees is also paramount. In 2021 to 2022 we offered flu vaccinations to colleagues not eligible for the free NHS vaccination and installed Wellbeing Kiosks in our regional centres.
Our managers and colleagues are supported by comprehensive health and safety arrangements, guidance and learning, with access to in-house and third-party professional support and advice. To ensure we have effective health and safety arrangements for colleagues, we have trained a network of 582 Display Screen Equipment assessors and implemented new arrangements to provide statutory first aid and Incident Marshall cover in our workplaces using British Standard 9999.
Attractive employment offer
Following the overwhelming acceptance of HMRC’s Pay and Contract Reform by trade union members, we have now implemented many of the new reforms. Some of the policy changes have received extremely positive feedback from colleagues – for example, the new ‘Becoming a parent’ policy, which introduces gender neutral language and increases the amount of leave colleagues can take to support their partners during pregnancy and after the birth of the baby.
Terms and conditions have been restructured and modernised to make it easier to deploy colleagues where they’re most needed to meet customer demand. Changes include:
- the introduction of a new standard flexibility clause and Directorate Working Arrangements, so colleagues can be asked to work at different times during the week, including Saturdays where necessary, providing greater fairness and increasing workforce productivity as well as improving operational coverage for customers
- simplified and reduced legacy and outdated overtime rates and times to apply only for additional hours worked outside standard operating hours
- modernised attendance allowances for colleagues in fraud and investigative or specialist intelligence roles
Our next steps in implementing the reforms will include reviewing allowances, travel and subsistence, and leave provision for primary parents. Consultation is ongoing with the trade unions in relation to trainee grading and pay, with positive progress being made.
Continuous learning culture
We aim to recruit and retain a talented workforce and make sure they have the knowledge and skills they need to do their jobs well.
Our Tax Academy delivers tax technical training for new recruits. This year, its training had an enhanced focus on compliance professional standards and support for vulnerable customers. During 2021 to 2022, we trained 4,100 people in tax and compliance skills to equip them for front line roles and invested further in our apprenticeships.
Our Central Training Unit (CTU) was established within our Customer Compliance Group in July 2021 to train new civil compliance recruits. It has been set up to develop more flexible and adaptable compliance professionals, who can be deployed to key compliance risks and priorities at short notice. We focussed on embedding a consistent set of professional standards for customer compliance work and integrating this into the heart of our training products for new recruits. In 2021 to 2022, over 3,200 trainee compliance caseworkers benefited from the CTU’s comprehensive and consistent learning programme. This will also allow compliance officers to identify and support customers who need extra support.
We also updated our leadership development strategy and launched a new development programme to help managers develop their capability and confidence. Around 2,600 managers participated in the programme over the course of the financial year, with similar numbers planned for 2022 to 2023.
Our approach to whistleblowing
We aim to create an environment where people feel safe and supported in speaking up, and know their concerns are treated seriously and that they will be kept informed as their concern is dealt with. This year, we have improved training, tracking and processing around whistleblowing cases. We have also refreshed our guidance and held two ‘Speak Up’ weeks in 2021 promoting the work of our nominated officers who offer support to our people on their whistleblowing concerns.
During 2021 to 2022, we had 61 cases raised through various whistleblowing routes, of which 13 have been subsequently categorised as whistleblowing, while 11 are still being assessed. This is similar to the previous year, when we had 66 cases raised of which 15 were categorised as whistleblowing. These figures are significantly lower than previous years (145 cases raised of which 47 were categorised as whistleblowing in financial year 2019 to 2020, and 164 cases raised of which 39 were categorised as whistleblowing in financial year 2018 to 2019).
Key performance metrics: Strategic objective 4
The following tables set out our employee data across a range of diversity characteristics.
We publish workforce diversity data and equality information in our annual report on compliance with the public sector equality duties.
Figure 17: Male and female employees
Male
-
Director General, Directors and Deputy Directors 2021-22 53% All other employees 2021-22 48% Director General, Directors and Deputy Directors 2020-21 55% All other employees 2020-21 47%
Female
-
Director General, Directors and Deputy Directors 2021-22 47% All other employees 2021-22 52% Director General, Directors and Deputy Directors 2020-21 45% All other employees 2020-21 53%
Figure 18: Declared disability status of employees
-
Director General, Directors and Deputy Directors 2021-22 5% All other employees 2021-22 14% Director General, Directors and Deputy Directors 2020-21 6% All other employees 2020-21 14%
Figure 19: Declared ethnicity category of employees
BAME (Black, Asian and Minority Ethnic) is an aggregate category that includes colleagues who declared their ethnicity as Black, Asian, Chinese or mixed ethnic background. White ethnic minority backgrounds are not included in this data category.
-
Director General, Directors and Deputy Directors 2021-22 12% All other employees 2021-22 17% Director General, Directors and Deputy Directors 2020-21 11% All other employees 2020-21 15%
Figure 20: Declared religious belief status of employees
Religion or belief – Yes
-
Director General, Directors and Deputy Directors 2021-22 53% All other employees 2021-22 60% Director General, Directors and Deputy Directors 2020-21 54% All other employees 2020-21 61%
Religion or belief – No
-
Director General, Directors and Deputy Directors 2021-22 47% All other employees 2021-22 40% Director General, Directors and Deputy Directors 2020-21 46% All other employees 2020-21 39%
Figure 21: Declared sexual orientation category of employees
LGBO is an aggregated category that includes people who declared their sexual orientation as gay man, gay woman/lesbian, bisexual or ‘other’. Workforce diversity characteristics other than sex are voluntarily reported by colleagues and the declaration rate varies by characteristic, so the data reported below excludes colleagues who have not declared diversity information.
Our diversity characteristic figures and percentages are calculated using headcount figures. Due to different reporting methods, the total reported here for SCS colleagues may not correspond with the detail published elsewhere. Directors general are grade SCS3, directors and deputy directors are grades SCS2 and SCS1.
-
Director General, Directors and Deputy Directors 2021-22 7% All other employees 2021-22 11% Director General, Directors and Deputy Directors 2020-21 6% All other employees 2020-21 6%
Table 13: Annual survey measure on fairness
Over the past 4 years we have introduced new values, commitments and behaviour standards and made changes to policies, processes and key employee interactions such as giving feedback, managing performance and speaking up. The fairness and inclusion scores in our annual people survey reflect the improvement in colleagues’ experience of working at HMRC over the past 4 years.
| Questions | 2017 | 2018 | 2019 | 2020 | 2021 |
|---|---|---|---|---|---|
| I am treated fairly at work | 77% | 76% | 76% | 82% | 84% |
| I am treated with respect by the people I work with | 87% | 85% | 84% | 88% | 90% |
| Inclusion and fair treatment theme | 74% | 73% | 72% | 78% | 81% |
Table 14: Sickness absence data
Sickness absence levels are measured using Average Working Days Lost (AWDL), calculated by dividing the total number of days lost to sickness absence over a 12 month period by the current FTE. Whilst the total AWDL for financial year 2021 to 2022 is up on the previous 2 years, once adjusted for pandemic related absences the total remains below pre-pandemic levels at 6.65.
| Financial year | Pandemic-related absence | Non-pandemic absence | Total |
|---|---|---|---|
| 2021 - 2022 | 1.61 | 6.65 | 8.26 |
| 2020 - 2021 | 0.87 | 4.91 | 5.78 |
| 2019 - 2020 | 0 | 7.48 | 7.48 |
Reporting of Injuries, Diseases and Dangerous Occurrences Regulations 2013 (Northern Ireland 1997): reports to the Health and Safety Executive
Our colleagues are encouraged to report all accidents or instances of work-related ill health, with reports going to directors to highlight trends and inform our health and safety performance. Employers are required to report incidents in specific categories to the Health and Safety Executive, under the Reporting of Injuries, Diseases and Dangerous Occurrences Regulations (RIDDOR). In 2021 to 2022, there was a 28% decrease in RIDDOR incidents reported to the Health and Safety Executive (18, compared to 25 in 2020 to 2021). The number of non-RIDDOR incidents reported also reduced by 7.7% (890, down from 964 in financial year 2020 to 2021). See Annex 4 for a breakdown of incident reports.
Strategic objective 5: Support wider government economic aims through a resilient, agile tax administration system
We are modernising our IT estate to build a more resilient tax system for the future – and we are using innovative thinking to administer the tax system in a way that supports wider government economic objectives. During the year, our work included supporting the security of the UK’s borders, enabling international trade, delivering COVID-19 support schemes and supporting devolved governments.
Our commitments in 2021 to 2022
In our Outcome Delivery Plan for 2021 to 2022, we made 7 commitments as part of our work to support wider government economic aims through a resilient, agile tax administration system.
| Commitment | What we delivered | Status at year end |
|---|---|---|
| Borders and Trade | We finished implementing import controls on goods entering Great Britain from the EU and continued to deliver our commitments under the Northern Ireland Protocol, following the new Trade and Cooperation Agreement between the UK and the EU which came into force on 1 January 2021. | On track or complete |
| Freeports | HMRC supported the introduction of freeports in England, as announced at the 2021 budget. Two freeports became operational by the end of 2021, at Teesside and Thames, with an additional six due to be operational by the end of 2022 | On track or complete |
| Digitalising Business Rates | We carried out our initial work to design and develop Digitalising Business Rates to help modernise the business rates system in England. We secured £31 million of funding over the next 3 years to develop the work and will undertake a public consultation next year. | On track or complete |
| COVID-19 financial support schemes (combined CJRS and SEISS ODP commitments) | The Coronavirus Job Retention Scheme (CJRS) and the Self Employment Income Support Scheme (SEISS) both closed at the end of September 2021 (note 1). | On track or complete |
| Defer VAT payments | To support businesses through the COVID-19 pandemic, we allowed deferred payments to be spread over 2021 to 2022. We also extended the deadline for signing up to the scheme by 3 months, to 30 June 2021 (note 2). | On track or complete |
| One-off payment to eligible working households | We implemented the government’s one-off payment of £500 to working households receiving tax credits during the COVID-19 pandemic (note 3). | On track or complete |
Note 1: Read about their delivery in the COVID-19: our vital role in supporting customers and the UK economy section. Note 2: Read more in the Impacts on the debt balance in 2021 to 2022 section. Note 3: Read more in the COVID-19: our vital role in supporting customers and the UK economy section.
How we performed
Building a resilient tax system
We are making our services more resilient and available by migrating them to modern infrastructure in Cloud or Crown Hosting. In total, 155 services have been migrated to Cloud as we exit from legacy data centres, and the remaining 257 will be remediated before December 2023. Over the last 2 years we have made significant progress in de-commissioning obsolete IT services and moving our tax, finance and human resources platform to cloud-hosting.
We are also opening up our IT supply chain and changing the way that we work with partners and suppliers, so we can protect key live services, modernise our IT estate, ensure value for money, and access the latest technology. This year we began talking to the IT marketplace and launched our first group of procurements. A number of contracts have now been awarded.
As guardians of one of the largest data sets of customer and staff personal data in government, we have a responsibility to ensure our data is protected with the industry standard levels of security, and that our data use is transparent, proportionate, and aligned with the requirements of data protection laws. Last year, we reported that we were working with the Information Commissioner’s Office (ICO) to consider the implications of the independent review we had commissioned in 2020, which made it clear there were important issues that needed to be addressed in a timely manner. We have been transparent with the ICO – and in previous annual reports – about our data compliance challenges and we are working hard to address these and deliver the actions arising from that review.
During 2021 to 2022, we agreed an action plan with the ICO, recognising the significant programme of work we already had in place. This programme has progressed at pace, in spite of the additional challenges we face due to the considerable scale of our organisation and the age of our IT infrastructure, as well as the shift in priorities to deal with the special circumstances relating to COVID-19.
In 2021 to 2022 we have:
- increased the resources dedicated to the management and remediation of our data protection and security risks, which has significantly improved our risk posture
- undertaken significant work to address data retention and data risk issues and continued to review and enhance all data related policies, standards and governance
- continued to work with the ICO, reporting security incidents where required to do so, and actively collaborating with ICO questions relating to issues and the management of our responses to data subject requests and requests under the Freedom of Information Act. In these engagements we are being transparent about the risks we carry, working with the regulator to address their concerns and act on their recommendations
All our data protection compliance challenges are investigated and analysed so that we can understand and learn from them. Our organisational security maturity has continued to increase. We have measured this through our compliance with government security standards, and through assessment of improved governance, policies, processes and technology.
We understand that we will only achieve full data protection compliance through sustained investment, and by promoting a culture of data protection.
Read more about our work to manage data protection compliance risks in the HMRC’s strategic risks section.
Tackling cyber security
We are an attractive target to cyber criminals due to the quantity and sensitivity of the taxpayer information we hold and the potential for criminal and financial gain through fraud.
We have recognised the challenges presented by the rapidly evolving cyber threat landscape, initiating a new Enterprise Security Programme to reduce the cyber risk to protect customers, government and colleagues. This includes projects to deliver tactical cyber improvements, improve our ability to detect and respond to cyber-attacks, and maximise benefits from central government security initiatives.
Several UK public sector organisations suffered ransomware attacks in 2021. This is where an organisation’s IT systems are encrypted by malware and a ransom is demanded from the organisation in order to decrypt their own data, or to prevent release of stolen data. The potential impacts of a ransomware attack on HMRC include loss of confidentiality, accessibility of sensitive data and disruption of service delivery.
In common with similar-sized organisations, we are reliant on managed service providers to support business operations and we employ a variety of contractors to support our business. Increasingly, cyber threats will target an organisation’s supply chain, so a successful attack against one of our IT suppliers could also impact on our systems and data.
Over the course of 2021 to 2022, we have continued working to protect customers from all these evolving threats and to reduce cyber security risk to acceptable levels, and we continue to monitor the risks closely. During 2021 to 2022 we also mitigated several high-profile software vulnerabilities, orchestrating an effective operational response to mitigate risks to data and services.
In focus: cracking down on phishing
Fraudulent communications pretending to be from HMRC, known as ‘phishing’, pose a significant threat to us and our customers. We invest time and resources in mitigating this threat through education and awareness activities, and through a strategy of preventing attacks, promoting awareness and pursuing those responsible, using dedicated customer protection teams, innovative technologies and communications.
We saw a 57.6% reduction in reports of HMRC-branded phone scams during 2020 to 2021. This is a testament to the work of our teams, and also a signal that the public is more aware of cyber criminals and the methods they use, due in part to our awareness-raising efforts.
Supporting international trade
Throughout 2021 to 2022, we continued implementing the new UK Border Operating Model, to help our customers adapt to new trade arrangements and supporting trade flow at the border. On 1 January 2022 we introduced full customs controls for all goods entering Great Britain from the EU except for Ireland. This involved delivering enhancements to our systems, implementing new infrastructure, IT systems and process changes and making sure that ports and other border locations were ready in time.
From 1 January 2022 there was a significant increase in registrations for the Goods Vehicle Movement Service and other customs systems, as well as requests for goods movement references, as hauliers and traders began using full customs controls. This drove high demand for our Customs and International Trade helpline, which we extended to 24/7 operating hours in the weeks following 1 January.
We ensured that our Inland Border Facilities, which allow customs procedures to be completed away from ports, had the capacity, procedures and training in place to deal with new customs examinations on EU movements. Following a review of uptake at these facilities and revisions to forecast demand, we announced in June descoping of the Dover IBF site and early decommissioning of North Weald and Birmingham temporary sites. We will continue to decommission the temporary sites as planned and drive operational efficiencies from the enduring sites at Sevington and Holyhead.
The Prime Minister announced in April 2022 that no further import controls on EU goods will be introduced this year, and that Cabinet Office will publish a Target Operating Model for the border in the Autumn. This will set out our new Safety and Security and Phytosanitary controls and will target the end of 2023 as the revised introduction date.
In focus: getting customers ready for customs controls
We contributed to the cross-government UK Transition public information campaign to support our customers through the staged introduction of customs controls, providing targeted messaging and audience insight and promoting campaign content via our own channels.
We have delivered activity including 178 trader webinars which reached over 50,000 attendees, a widely distributed haulier leaflet translated into 10 languages, and 172 emails to over 155,000 traders and hauliers in the UK and EU. Our activity contributed to a 47% increase in visits to trader guidance on GOV.UK, and a 180% increase to haulier registration. 70% of importers reported that they felt well prepared.
Operating the Northern Ireland Protocol
In response to the Northern Ireland Protocol, we designed and delivered procedures that minimise the burden on traders while protecting the EU’s Single Market.
A key part of this is our procurement of the free Trader Support Service, which provides education on new customs processes and can submit declarations on traders’ behalf. As of 31 March 2022 over 45,000 traders were registered with the service and it had processed declarations for over 1.9 million consignments.
Full customs controls will not apply to goods moving from Ireland into Great Britain, while negotiations on the Northern Ireland Protocol continue. These arrangements are temporary and will be kept under review.
On 13 June 2022 the government introduced the Northern Ireland Protocol Bill to potentially amend parts of the Northern Ireland Protocol – making the changes necessary to ensure stability of the Belfast (Good Friday) Agreement is protected. It also published a document that summarises the issues arising from the Northern Ireland Protocol as it stands, and how the Bill seeks to resolve them. For now, and as the new legislation progresses through Parliament, current arrangements will remain in place; with businesses able to continue to move goods into and out of Northern Ireland in the same way they do now.
EU Commission’s infractions proceedings against the UK
In March 2018, the European Commission alleged that from 2011 to 2017 the UK did not take adequate steps to prevent customs undervaluation fraud and €2.7 billion of customs duty was therefore owed to the EU.
Following correspondence between the UK and the Commission, the case was referred to the European Court of Justice.
The case was heard on 8 December 2021 and in March 2022 the Court found against the UK on almost all liability points. However, the Court found that the Commission had failed to prove the specific sums which should have been paid by the UK, but stated that the Commission would be entitled to recalculate the figure owed.
With significant interest accruing (potentially 16% plus Bank of England base rate) the UK made a payment on the principal amount to the European Commission of €678,372,885.63 (equivalent to £578,903,408.60). The UK is paying what we believe to be the full amount due regarding cancelled customs assessments to the end of 2014 and, in respect of the subsequent period, representing an amount the UK consider due at this time, in light of the Court of Justice of the European Union judgment, stopping interest accruing on this amount. The UK awaits the Commission’s recalculation and will consider it carefully once received.
Working with devolved governments
The past decade has seen substantial devolution of tax powers. We implement Income Tax policy on behalf of the UK, Scottish and Welsh governments and work closely with devolved revenue authorities in Scotland and Wales to support each other in administering the taxes for which we have responsibility.
We are working with the Scottish Government on the introduction of Adult Disability Payment which will replace the Personal Independence Payment, ensuring our systems interact effectively and that tax credits customers get the payments they are entitled to. This builds on our work over the past year to develop an IT solution for the Scottish Child Disability Payment, which has replaced Child Disability Allowance, and interacts directly with our tax credits and Tax-Free Childcare operations. We have also been working to provide the Scottish Government with the HMRC data it needs to support new and existing Scottish benefits.
Throughout the COVID-19 response, we worked with all the devolved governments to understand the tax, tax credits and National Insurance implications of support schemes set up by the devolved authorities and help with delivery. We are working with the Welsh Government on the tax implications of its basic income pilot and with Northern Ireland on delivering new statutory parental bereavement leave and pay.
Further details regarding Devolved Taxes can be found at Note 13 Devolved taxes in the Trust Statement.
HMRC’s strategic risks
To protect public money, optimise performance and ensure we are likely to achieve our strategic objectives, we identify and manage our 9 strategic risks, shown below.
The following section provides a summary of each of our current strategic risks, each sponsored by a director general on behalf of our Executive Committee (ExCom). The information reflects the position up to 31 March 2022, with individual mitigations and associated objectives. Risks are assessed based on a combination of the probability of a risk occurring and the impact if it did. The assessment is the best estimate of the current position, based on the evidence at that point in time.
Our risks are linked to our strategic objectives in this year’s report:
- SO1: Collect the right tax and pay out the right financial support
- SO2: Make it easy to get tax right and hard to bend or break the rules
- SO3: Maintain taxpayers’ consent through fair treatment and protect society from harm
- SO4: Make HMRC a great place to work
- SO5: Support wider government economic aims through a resilient, agile tax administration system
Risk 1: Capacity, capability and engagement
| Risk rating | Probability | Impact | Strategic Objectives |
|---|---|---|---|
| Amber | Medium | Medium | 1, 4 |
There is a risk that we may not achieve high levels of business performance if we do not ensure our workforce has the skills, capability and working experiences which mean they and our organisation can thrive.
This risk is currently stable and rated amber, following work across HMRC to support staff during the last year with new and interchangeable policies, guidance and process to enable staff to work from home, return to our offices safely, and adapt to our new ways of working going forward.
We remain committed to making HMRC a great place to work. During 2021 to 2022, we have implemented key elements of our pay and contract reforms which look to modernise our working arrangements and provide us with greater flexibility to respond to the changing needs of our customers and give our colleagues fairer terms and conditions. We continue to invest in learning and development and making sure HMRC is a diverse and inclusive organisation, and in 2021, the HMRC People Survey EEI saw an increase of 2 percentage points to 59% (compared to 57% in 2020).
Looking ahead, we have identified workforce planning, learning and HR transformation activities that will help us reduce this risk, supported by our ongoing respect and inclusion work and development of HMRC’s Great Place to Work roadmap.
Risk 2: HMRC security
| Risk rating | Probability | Impact | Strategic Objectives |
|---|---|---|---|
| Red | High | Very high | 1, 2 |
There is a risk that business and critical services will fail because we do not operate our security processes and controls or manage our infrastructure and vulnerabilities effectively enough to protect HMRC, our customers, people and assets from harm or misuse.
This risk is improving but remains red, as we are still in the process of delivering our planned mitigations, focussing on moving away from legacy technologies and embracing newer and more secure systems. Cyber security remains a challenging area due to the rapidly evolving cyber threat landscape, and until improvements are fully implemented, this risk will remain significant.
This year we have successfully delivered our Cyber Tactical Remediation Programme, moved a significant number of our services out of legacy data centre environments and continued de-commissioning services all of which has improved our overall position. We have also implemented a new Security Incident Response tool, strengthening the identification and reporting of personal data breaches. Alongside these improvements, we are also in the process of implementing our 3-year Enterprise Security Programme and our Securing our Technical Future Programme, both of which are incrementally addressing and improving our security risks, with the aim of reaching a tolerable position by March 2025.
Risk 3: Exploiting information
| Risk rating | Probability | Impact | Strategic Objectives |
|---|---|---|---|
| Red | High | High | 1, 2 |
There is a risk that we fail to effectively exploit our data, resulting in reduced revenue collection, tax gap widening and weaker customer service by failing to build capability effectively.
Over recent years we have mitigated many of the most significant impacts of this risk. We have moved much of our data and key platforms on to modern cloud-based infrastructure (for example the ADEPT platform that drives our debt management work); established our new compliance operational risking platform; clarified policies we use to secure and control the data we hold; strengthened the processes we use to acquire and share data to perform our role; and, built a strong cadre of Analysts that enable us to use data to drive operational work right across HMRC.
However, this risk remains high. Our data is stored in a variety of complex systems and formats that presents challenges to its use and we have more to do to ‘master’ our data so that we can build the best possible view of our customers. Although we have mitigated the risk to some of our key platforms, more work is required to ensure the full range of data is available to them to enable the full benefits to operational teams; we need to improve the way we coordinate and focus our analysts on key business challenges to maximise their impact; we also need to ensure we have the right mix of analytical skills and tools to fully realise the benefits of machine learning and other advanced analytical techniques.
Mitigation will involve a mixture of technological change, development of policy and process, and investment in our people. As such, it is likely to be complex and require commitment over time. We anticipate mitigation will involve treating immediate risks (for example to operational activity) while also treating the underlying causes that will enable us to realise the benefits over the longer term.
Risk 4: External perception/loss of trust
| Risk rating | Probability | Impact | Strategic Objectives |
|---|---|---|---|
| Amber | Low | High | 1 |
There is a risk that we may be seen by our stakeholders as ineffective, inefficient or as not treating everyone impartially, leading to weaker compliance and potentially an increase in the tax gap.
This risk is currently stable and rated as amber. Positive annual stakeholder surveys showed that favourability, advocacy and trust towards us were at their highest levels since research started in 2012. Three out of four reputational measures showed improvement, with the fourth showing no change.
This year we continued our programme of engagement with customers, supporting the government-wide ‘Build Back Fairer’ agenda with timely and targeted communications, guidance and easements to support customers on COVID-19 scheme grants and payments and collection of associated tax liabilities. We have also continued to provide targeted support for customers through UK Transition arrangements. More broadly, we have continued to strengthen our overall approach to building trust through improved customer treatment and experience and ensuring regulatory compliance. This has meant directing significant resources to a range of areas, including data protection, cyber security, accessibility regulations and customer service delivery. We have continued to engage with taxpayers, voluntary organisations and community services, and tax professionals to deliver on the 21 commitments we made in February 2021 in our ‘Evaluation of HMRC’s implementation of powers, obligations and safeguards introduced since 2012’.
Lastly, we have started a wide-ranging programme of internal activity to improve the way we build trust. Whilst still at early stages, the programme focuses on four key areas: building further insight and data, improving the way we measure issues of fairness and trust, embedding trust within our wider culture, and developing our horizon-scanning capability.
Risk 5: Impact of future relationship with the EU on customs and tax administration
| Risk rating | Probability | Impact | Strategic Objectives |
|---|---|---|---|
| Amber | Medium | Medium | 1, 2 |
There is a risk that we fail to design and deliver robust policy, systems and operational changes required for the end-of-staged customs controls, implementation of the Withdrawal Agreement, the Northern Ireland Protocol and the Trade and Cooperation Agreement.
This risk is rated amber, due to continued uncertainty surrounding the outcome of negotiations with the EU on the Northern Ireland Protocol. This could lead to a change in the scope of controls on goods moving between Great Britain and Northern Ireland.
We successfully delivered the changes needed to implement full customs controls on 1 January 2022. This includes all HMRC-led Inland Border Facilities being ready for new customs examinations on EU movements, changes to existing IT systems, and an enhanced Customer Support Model. This Support Model built on the existing border service offer to provide increased support and capacity to customers, assisting in the smooth transition to the ending of staged controls and the new border systems which accompanied those changes. We will continue to monitor the readiness of traders and hauliers to make full customs declarations before moving their goods. We are also assessing trader engagement activity to build compliance with new rules and maintain the flow of trade across the UK border.
This risk was live during 2021 to 2022 when HMRC were working towards the end of staged customs controls. It was closed in March 2022 and will be replaced by a risk which reflects current challenges to implementing policy, systems and operational changes.
Risk 6: Improving customer experience
| Risk rating | Probability | Impact | Strategic Objectives |
|---|---|---|---|
| Red | Medium | High | 1, 2 |
There is a risk that we fail to deliver improvements in customer experience, in line with our objectives. This would lead to HMRC not fulfilling its vision to be a trusted, modern tax and customs department, with reduced compliance and lower satisfaction levels.
This risk is stable although remains rated red. During the pandemic, the need to develop and deliver new ways of supporting people and businesses put added requirements on HMRC, meaning resources had to be diverted from other activities. In addition, we prioritised services that provided most support to people and businesses likely to be in financial need. This meant that some of our customer service levels were not where we would normally expect them to be, although we also saw some of the highest-ever levels of customer satisfaction with our services. We focused on stabilising our phone service in the first half of the financial year and on reducing the built up stock of correspondence in the second half of the year.
We have also worked to identify and implement a range of activities to ensure we deliver the improvements needed for a better customer experience. Key activities have been focused on exploring and using customer insight, delivering robust technology and infrastructure and investing in new software. We have made progress by implementing our new customer experience framework and user guide, which puts customer experience at the centre of our approach to policy and process design. We have also enhanced our governance arrangements by reporting quarterly through our Customer Experience Committee and strengthened the effectiveness of managing this risk through the establishment of a cross cutting HMRC group. We have developed business owned management actions that will have most impact in improving customer experience and mitigate the causes of the risk which range from culture and values where we have not yet created the full environment for our people to serve our customers in a way that is consistent with our Charter and values to public sector equalities duty. We have ensured that all of these activities are driven by our HMRC Charter, Customer Experience Framework and HMRC Strategies.
Making it easy for customers to get things right and hard to get things wrong is our customer strategy, and there is still work to do. Over this coming year we are particularly focussed on setting out our customer experience ambition over the short, medium and longer term, using customer insight and data to benchmark current customer experience, prioritise activities to maximise customer experience improvements, together with adding to our set of performance metrics to better measure progress against our ambition.
Risk 7: Data protection
| Risk rating | Probability | Impact | Strategic Objectives |
|---|---|---|---|
| Red | High | Very High | 1, 2 |
There is a risk that we will be unable to provide customer and staff personal data with the level of protection required by law, nor to fully facilitate the exercise by our staff and customers of their legal rights under data protection legislation. This could result in enforcement action from the ICO (including fines, information notices, penalty notices and powers of inspection), significant reputational damage, staff or customer compensation claims, and erode customer trust impacting on our overriding objective to be a modern and trusted tax department.
This risk is improving, although still rated red. We take our legal obligations seriously and are acutely aware of on-going requirement to meet our responsibilities to act as one of the largest guardians of customer personal data in the UK.
We have assessed ourselves against the ICO Accountability Framework, which enables organisations to minimise risks associated with processing personal data and has defined target standards for HMRC. Over the course of this year, we have completed activities which led to significant improvement across a number of components of the framework. This includes embedding an agreed framework for governing and protecting data, leading to strengthened leadership and records management. We also undertook considerable deletion of personal data items and addressed cyber security issues via the Cyber Tactical Remediation Programme.
We plan further work during 2022 to deliver an enterprise data model, data governance tooling and to complete business process mapping exercises for the VAT, PAYE and SA tax regimes, which should bring this risk towards a more tolerable position.
Read more about our work to protect data in the Tackling cyber security section.
Risk 8: Delivering the change portfolio
| Risk rating | Probability | Impact | Strategic Objectives |
|---|---|---|---|
| Amber | Medium | Medium | 1, 2 |
There is a risk that we will not deliver the 2021 to 2022 change agenda priorities aligned to the Spending Review 2020 one-year settlement to enable us to deliver our strategic objectives and benefits commitments within financial allocations.
This risk is improving and has moved from a red rating to amber as we delivered the significant budget measures and manifesto commitments that were due by the end of 2021 to 2022. Successful programme delivery included COVID-19 schemes (CJRS and SEISS), ‘Time to Pay’ that supports our customers as they recover from the pandemic, and ‘Breathing Space’ giving customers with problem debt up to 60 days relief from HMRC creditor actions. Internally, we also improved delivery planning across our portfolio to enable us to track more accurately whether programme milestones would deliver against our strategic objectives and our benefits commitments.
This risk will continue to evolve however, with the agreement of a new programme of investment announced at Spending Review 21. We are now focussed on delivering a successful early set of design and scoping phases of this new programme of work, to avoid the risk of delivery delays and non-realisation of benefits.
Risk 9: Funding and affordability
| Risk rating | Probability | Impact | Strategic Objectives |
|---|---|---|---|
| Amber | Low | High | 1, 2, 3, 4, 5 |
There is a risk that we are unable to deliver our strategic objectives or operate within our budget.
This risk has reduced in overall long-term exposure from Red to Amber, following a successful Spending Review bid and receipt of supplementary funding from HM Treasury which reduced the probability of materialisation to low for 2021 to 2022 and for the Spending Review period up to March 2025. The potential financial impact remains high as we have challenging efficiency savings to make in the next three years, plans for which are yet to be ratified.
During 2022 to 2023 we are introducing targeted changes to our financial business planning processes that will further strengthen the low probability of this risk materialising. These include establishing a new central efficiency planning function to improve the management of financial opportunities across HMRC and a more integrated approach to the management and delivery of financial controls across HMRC, better equipping budget holders to make sequencing and scoping decisions which will help us live within our budget.
Jim Harra
Accounting Officer
6 July 2022
2. Our accountability
This section reports on how we meet the key accountability requirements to Parliament.
Governance statement
Foreword by Dame Jayne-Anne Gadhia, HMRC’s Non-Executive Chair
During another year of extraordinary demand, HMRC has once again demonstrated its resilience, adaptability, and innovation in meeting all challenges. While playing a central role in successfully delivering the UK’s transition out of the EU and supporting businesses and citizens through the COVID-19 pandemic, we have made strides in restoring pre-pandemic levels of customer service and forged ahead with an ambitious transformation agenda.
Non-executive directors and independent advisers have continued to provide challenge and support to an open and engaged executive. The clarity and consistency of messaging from the executive team to the Board, has enabled frank, productive discussions throughout the year. The benefits of this leadership are reflected in the most recent staff survey results. We are one of only 4 departments that have seen our engagement index increase since 2020 – and this year we achieved the biggest improvements across the engagement index and theme scores.
One important change to governance implemented this year was to formally establish the Board’s Performance Committee. Attended by the entire Board, and chaired by me, the committee ensures consistent, rigorous monthly scrutiny of organisational performance, including policy implementation and operational and change delivery. We also refreshed the People Committee with a renewed mandate to support a strong, diverse and inclusive culture that underpins HMRC’s objective to be a great place to work. Nominations matters are now discussed at Board level.
Our Customer Experience Committee has been working with the executive team to restore customer service levels following the exceptional demand created by COVID-19. It is also working with HMRC teams on ‘Making Tax Digital’, which is a critical part of our focus on making it easier for customers to pay the correct tax and providing them with timely and appropriate support when they need it.
Underpinning all this work, I have drawn assurance from the Audit and Risk Committee’s (A&RC) focus on regulating and monitoring the department’s whistleblowing processes, the adequacy of its control framework, and the quality of its business-critical models and risk management.
As HMRC continues to recover its services after pandemic, the Board will continue our active role in challenging and supporting HMRC to deliver its best for all stakeholders.
Dame Jayne-Anne Gadhia
Lead Non-Executive
For more details on Whistleblowing, please see the Our approach to whistleblowing section.
Our governance arrangements
This governance statement sets out our governance, risk management and internal control arrangements for the financial year 1 April 2021 to 31 March 2022 and up to the date of approval of the annual report and accounts, in accordance with HM Treasury guidance.
Ministerial arrangements
HMRC is a non-ministerial department established by the Commissioners for Revenue and Customs Act 2005 (CRCA). This gives legal powers and responsibilities for managing our day-to-day functions to commissioners appointed by the Queen. Our status as a non-ministerial department is intended to ensure that administration of the tax system is fair, impartial and does not bring political decision-making into individual taxpayer affairs. We are accountable to the Chancellor of the Exchequer for how we conduct our business. The Chancellor has delegated responsibility for overseeing HMRC to the Financial Secretary to the Treasury – the Rt Hon Lucy Frazer QC MP.
We comply with directions of a general nature given by Treasury ministers, for example on our strategies, operational policies and targets. We work in partnership with HM Treasury to advise ministers on developing and delivering tax policy. HM Treasury leads on strategic policy development, supported by HMRC. HMRC leads on policy maintenance and delivery, supported by HM Treasury. This policy partnership covers direct and indirect taxes and duties, National Insurance, tax credits and Child Benefit, for which HMRC has administrative responsibility.
Commissioners of Revenue and Customs
The commissioners are responsible for collecting and managing revenue and payments and managing tax credits. They conduct business according to the CRCA and are entitled to appoint officers of Revenue and Customs, who must comply with their directions. In the financial year 2021 to 2022, we had 9 commissioners – Jim Harra, Angela MacDonald, Justin Holliday, Penny Ciniewicz, Myrtle Lloyd (from 13 May 2021), Ruth Stanier (until 18 July 2021), Sophie Dean (from 13 May 2021), Katherine Green (from 13 May 2021) and Joanna Rowland (from 14 May 2021).
First and Second Permanent Secretaries
Our First Permanent Secretary and Chief Executive, Jim Harra, is HMRC’s Principal Accounting Officer. He is responsible for delivering our strategy and is accountable to Parliament for managing our resources. He chairs the ExCom and is a member of HMRC’s Board. We set out Accounting Officer responsibilities in the Principal Accounting Officer’s report. Our Second Permanent Secretary and Deputy Chief Executive is Angela MacDonald.
Tax Assurance Commissioner
The Tax Assurance Commissioner (TAC) has an explicit challenge role and provides assurance in HMRC’s largest and most sensitive disputes, and a sample of smaller cases. Justin Holliday was appointed as TAC on 4 August 2020. Decisions relating to resolving our largest and most sensitive cases are decided by 3 commissioners, led by the TAC, who reports each year in the annual Tax Assurance Commissioner’s report.
Non-executive directors
Non-executive directors bring external experience and expertise to HMRC. They play an important role in providing advice, challenge and scrutiny to the work of ExCom and HMRC in board and sub-committee meetings and more widely. They also support the effectiveness of programme boards for our most significant transformation programmes.
Dame Jayne-Anne Gadhia is our Lead Non-Executive Director (NED) and chairs the HMRC Board. She meets regularly with other non-executive directors and the First and Second Permanent Secretaries. She also actively liaises with lead non-executive directors across government and is responsible for developing and appraising non-executives as effective board members.
Our governance committee structure
HMRC has 2 top-level governance committees:
-
HMRC Board
-
HMRC Executive Committee
This framework enables our ExCom to undertake effective and transparent decision-making and provides appropriate support, challenge and assurance by our non-executives.
Figure 22: HMRC Committee structure during 2021 to 2022
Executive Committee
The HMRC Executive Committee oversees HMRC’s performance and transformation for both immediate and future objectives. Also responsible for improving our performance, customer experience and change agendas.
The Executive Committee (ExCom) has 3 sub-committees:
-
Strategy Committee: provides oversight and approval of HMRC’s strategy for tax administration. It also has an assurance role to ensure that strategy is delivered.
-
Change, Investment and Design Committee: provides oversight and approval of how change is designed and implemented and approve spend on change within its delegations. It also helps to assure that the right change is being delivered.
-
Professional Standards Committee: provides oversight of how HMRC administers the tax system and applies policies in accordance with its values. Considers how HMRC’s actions could affect trust in the tax system and public perception of fairness.
HMRC Board
The HMRC Board provides challenge and advice on HMRC strategy, performance and capability. The Board is advisory and does not have a role in operational decision-making, tax policy or individual taxpayer matters.
The Board has 4 sub-committees:
-
People Committee: provides advice and scrutiny on nominations, succession planning, leadership and HR strategy.
-
Audit and Risk Committee: provides independent assurance to the Board and Principal Accounting Officer. This covers the integrity of financial statements as well as the comprehensiveness and reliability of assurances across HMRC on governance, risk management and the control environment.
-
Customer Experience Committee: provides challenge and support on customer experience related issues to help HMRC deliver on its strategic objectives and vision. Monitors departmental performance against the HMRC Charter and produces the Charter annual report for the HMRC Commissioners.
-
Performance Committee: enables the Board to review, challenge and support the department on implementation and operational matters. Established in line with guidance from Cabinet Office and the Government Lead-Non-Executive, to ensure robust and transparent governance around non-executive scrutiny of organisational performance.
HMRC Board
The Board helps to guide HMRC strategically by drawing on wide-ranging public and private sector expertise. It also provides challenge, advice and assurance to the First and Second Permanent Secretaries and the executive team on developing and implementing their strategy, business plan and performance. The Board is advisory and does not have a role in operational decision-making, tax policy or individual taxpayer matters.
Chaired by Jayne-Anne Gadhia, the Board met 11 times in 2021 to 2022, focusing on:
- contributing to the development of HMRC’s long-term strategy and delivery plans
- monitoring and supporting the progress of HMRC’s long-term risks
- monitoring performance against targets and challenging on customer service delivery
- reviewing HMRC’s Spending Review submission and settlement
- reviewing progress on HMRC’s transformation programme
- supporting and scrutinising HMRC’s delivery of exiting the EU and future borders and trade strategy
- supporting work on COVID-19 programmes and support schemes
- reviewing plans to modernise the IT estate
- supporting and scrutinising the implementation of HMRC’s Pay and Contract Reform
- refreshing the remit of the People Committee and supporting the Great Place to Work strategy
Board effectiveness
The Board conducts a thorough review of its effectiveness each year, by completing the structured Cabinet Office questionnaire and through individual discussions. The review is used as an opportunity for the Board to assess progress against recommendations from previous reviews and to ensure there is continuous improvement in the Board’s effectiveness and impact. The 2021 to 2022 review found that the Board is engaged and clear on its responsibilities with the right composition, culture and structures to undertake its duties effectively. There is an open atmosphere at Board meetings, with good engagement from both non-executives and executives. The quality of meetings and data provided has improved and the Board is now operating more effectively than 12 months ago. The review identified further improvements that would enable it to build on progress made in 2022 to 2023. These include:
- better visibility of key priority areas of focus for Board sub-committees and greater alignment with Board agendas
- continue to strengthen the relationship with the Financial Secretary to the Treasury to elevate the effectiveness of the Board
- build in greater opportunity for the Board to engage outside of formal meetings and ensure all Board meetings are in person by default
HMRC Board sub-committees
The HMRC Board is supported by 4 sub-committees:
Audit and Risk Committee
Chaired by Michael Hearty, Audit and Risk Committee met 8 times and oversaw the production and integrity of the 2020 to 2021 Annual Report and Accounts for HMRC, National Insurance Fund for Great Britain, National Insurance Fund for Northern Ireland and Revenue and Customs Digital Technology Services (RCDTS) Ltd. Additionally the committee advised and provided assurance on annual statements, the assessment of risk, controls and governance made by ExCom members as well as monitoring processes for whistleblowing, the adequacy of HMRC’s control framework and risk management.
People Committee
On 14 June 2021 the People and Nominations Committee approved a recommendation to the board to stand itself down and form a People Committee to focus on holding the department to account for delivery of the Great Place to Work programme and the effectiveness of the employment framework. This was ratified by the Board on 20 July 2021 with the first meeting of the People Committee taking place on 6 September 2021. The nominations responsibilities of the People and Nominations Committee reverted to the Board.
Chaired by Alice Maynard, PNC met once and the People Committee met 3 times. It set up the new People Committee with tighter terms of reference to replace the People and Nominations Committee and placed delivering the Great Place to Work programme at the heart of the new meeting structure. 2 independent advisers with extensive private sector HR experience were recruited.
Customer Experience Committee
Chaired by Juliette Scott, the Customer Experience Committee met 5 times and continued to support implementation activity for the HMRC Charter. It also ran sessions on customer experience issues in key areas such as transformation, communications and customer service performance. The committee ran working groups with non-executive directors and independent advisers around HMRC’s new channel strategy, and the fiscal benefits of investment in customer services advising on the development of a customer-focused culture maximising use of insight and data.
Performance Committee
Chaired by Jayne-Anne Gadhia, the Performance Committee met 8 times and focused on detailed scrutiny of customer service recovery plans, a review of Change Portfolio and Transformation Agenda, deep dives into key departmental risks and a review of HMRC financial performance.
Executive Committee and sub-committees
Executive Committee
Chaired by Jim Harra, ExCom met 36 times and oversees HMRC’s performance and transformation, both in terms of immediate and future objectives. ExCom considered the development of the government’s tax administration strategy; delivery of new processes and systems for the end of the UK Transition period; delivery of key government COVID-19 support schemes; delivery of HMRC’s services and managing key departmental risks. ExCom also discussed employee engagement and respect at work, leading colleagues through the COVID-19 restrictions, return to office, and pay and contract reform.
The sub-committees of ExCom are detailed below.
Strategy Committee
Chaired by Jonathan Athow, this committee met 10 times and considered changes to strategic approaches and products, ensuring that they support HMRC’s strategic direction and intent. The committee advised on early thinking about an Enterprise Data and Information Strategy; Horizon Scanning; Data Science strategy; Channel strategy; and an Ethical framework for AI and Machine Learning.
Change Investment and Design Committee
Chaired by Justin Holliday and Jonathan Athow, this committee met 12 times and was the approval point for business cases over the Investment Board threshold. The committee also developed, supported and assured design principles and standards across HMRC, and shaped and informed HMRC’s planning for the Spending Review.
Resources and Performance Committee
The Resources and Performance Committee met until 4 June 2021. Its purpose was to provide support to ExCom decision-making by providing advice on resources, corporate performance, efficiency, and productivity. From June, these were managed at group-level and issues were escalated directly to ExCom as required.
Chaired by Justin Holliday, the committee met twice in 2021 to 2022.
Professional Standards Committee
Chaired by Jonathan Athow, this committee met 4 times, steering and challenging HMRC as it seeks to maintain and build trust. The committee evaluated the importance of considerations in the development of technology such as artificial intelligence and machine learning.
See Our governance for more information on the main decision-making, executive and managerial bodies at HMRC.
Register of interests
HMRC maintains a register of interests (see Figure 23) to ensure that potential conflicts of interest can be identified, and appropriate mitigations put in place, in line with the Code of Conduct for Board Members of Public Bodies. No mitigations were required to be utilised in 2021 to 2022.
The Resource Accounts confirms that no member of the board had any related-party interests, significant company directorships or other interests that may conflict with their management responsibilities.
Figure 23: Non-executive directors’ interests
| HMRC Board non-executive directors | Name of company or organisation | Type of interest (e.g., Pay, fees, shareholding) | Position Held | Other relevant Information |
|---|---|---|---|---|
| Dame Jayne-Anne Gadhia | USnoop Ltd | Pay | Executive Chair | |
| Tate | Unpaid | Senior Independent Director/Chair of Audit Committee and Finance and Operations Committee | ||
| Economy Honours Committee | Unpaid | Member | ||
| UniCredit | Pay | Non-Executive | ||
| Gadhia Consultants | Unpaid | Director | ||
| Lloyd of London Culture Advisory Group | Pay | Director | Ended September 2021 | |
| Goldacre | Pay | Non-Executive Chair | Ended November 2021 | |
| Gadhia Group | Unpaid | Director | Ended May 2022 | |
| Mayors Business Advisory Board | Unpaid | Member | ||
| Alice Maynard | Future Inclusion Limited | Shareholding | Director | |
| The Cross and Stable Charities | Unpaid | Director/Trustee | ||
| Transport for London | Pay | Board member | Left Transport for London in September 2021. | |
| Remuneration Committee, Govt Commercial Office | Pay | Member | ||
| Financial Conduct Authority | Pay | Non-Executive Director | ||
| Juliette Scott | Versus Arthritis | Not paid | Trustee | |
| Spellins Consulting Services Limited | Shareholding | Director | ||
| Michael Hearty | Public Health England | Salaried | Non-Executive Director | |
| Financial Reporting Council | Salaried | Independent Advisor | ||
| Hywel Dda University Health Board | Salaried | Independent Advisor | ||
| Patricia Gallan | Trade Remedies Authority | Fees Paid | Non-Executive Director | |
| Red Thread Charity | Unpaid | Trustee | ||
| Drapers’ Brookside Infant and Junior School Local Governing Body | Unpaid | Chair of Governors | ||
| Paul Morton | TaxAid (Charity) | Unpaid | Trustee and Treasurer | |
| Supervisory Board of the International Fiscal Association (Professional Association) | Unpaid | Member | ||
| Fractal Labs/Untied | Fee | Chair of Oversight Committee | ||
| David Cooper | Enitor Consulting Limited | Shareholding | Director |
| HMRC Committee non-executive directors | Name of company or organisation | Type of interest (e.g., Pay, fees, shareholding) | Position Held |
|---|---|---|---|
| Elizabeth Fullerton-Rome | Hampden Agencies Limited | Fees | Independent Non-Executive Director and Chair of the Audit and Risk Committee and member of the Conflicts Committee of Hampden Capital plc, of which Hampden Agencies is a subsidiary. |
| Great American International Insurance Limited | Fees | Independent Non-Executive Director and Chair of the Risk Committee and member of Audit Committee | |
| The Taxation Disciplinary Board | Fees | Non-Executive Director | |
| The Walpole Society | Unpaid | Trustee and Treasurer | |
| Tom Taylor | NHS Counter Fraud Authority | Fee paid | Chair |
| Northern Ireland Government Department of Finance | Fee paid | Non-Executive Director | |
| Government Legal Department | Fee paid | Non-Executive Director |
On 14 April 2021, the Cabinet Office commissioned Permanent Secretaries across government to undertake assurance that any outside employment held by SCS does not present a conflict of interest. HMRC responded to this request by asking all SCS to immediately declare any actual or potential conflicts of interest. In addition, we immediately reviewed our processes to ensure that there was appropriate central oversight.
In compliance with business appointment rules, we are transparent in the advice given to individual applications for senior staff and publish details on a quarterly basis on GOV.UK. In addition, the Audit and Risk Committee takes a paper on business appointment rules quarterly to consider and scrutinise HMRC’s application of the rules.
Statistics cover the period 1 April 2021 to 31 March 2022:
Table 15: Statistics on the application of business appointment rules
| SCS Population | For AA-G6 population | |
|---|---|---|
| Number of exits from Crown Service (civil servants and special advisors) | 48 | 6,061 |
| Number of exits where BARs applications were required | 11 | 31 |
| Number of exits where BARs conditions were set | 8 | 5 with conditions set, 1 not approved |
| Any enforcement actions the department has taken with regard to breaches of the rules in the preceding year | 0 | No detail available |
In April 2022 HMRC is introducing a new Business Appointment Rules (BAR) assurance tool and governance group. The new assurance tool will help the SCS community to identify whether a full BAR application is needed when colleagues decide to leave HMRC. The tool will also provide additional data to support the oversight role of our Audit and Risk Committee. The governance group will provide central oversight of full BAR applications, and also consider data on leavers where no BAR application is required.
Our conflict of interest policy
Within our policies on conduct, we have a ‘conflict of interest’ policy which is aligned to the Civil Service Management Code. This applies to all employees and non-executive directors. The policy explains what a conflict of interest is, and provides information on declaring, recording and managing these.
A conflict of interest will arise when personal interests, activities or relationships may potentially interfere, or be perceived to interfere, with business decisions, may compromise the ability to remain fair and objective, or may result in a personal gain or advantage.
Individuals are responsible for notifying their managers of any conflicts. The relevant manager or business area must determine whether there is in fact a conflict (actual, potential or perceived) and what mitigating action is to be taken, and the manager is responsible for recording this information. If the individual moves to another team or business area, they must assess whether a new notification needs to be made in relation to the new role.
In high-risk areas, conflicts are recorded on a register, which is maintained at a business unit level. HMRC Board members and sub-committee members are required to declare real and potential conflicts of interest on appointment and to notify of any arising during their term.
Read advice regarding specific business appointments at HMRC: business appointment rules advice.
HMRC’s non-executive directors board members (end of March 2022)
Dame Jayne-Anne Gadhia
Lead Non-Executive
Patricia Gallan
Committees: People, Customer Experience, Professional Standards
Michael Hearty
Committees: Audit and Risk, Customer Experience
Alice Maynard
Committees: People, Professional Standards
Paul Morton
Committees: Customer Experience, Audit and Risk and Professional Standards
Juliette Scott
Committees: Customer Experience
David Cooper
Committees: Data Protection and Delivery Board
Non-executive and sub-committee members (end of March 2022)
Elizabeth Fullerton-Rome
Committees: Audit and Risk
Tom Taylor
Committees: Audit and Risk
HMRC’s Executive Committee (end of March 2022)
Jim Harra
Commissioner of Revenue and Customs, Chief Executive and First Permanent Secretary, Principal Accounting Officer, and member of the Board
Angela MacDonald
Commissioner of Revenue and Customs, Deputy Chief Executive and Second Permanent Secretary and member of the Board
Penny Ciniewicz Commissioner of Revenue and Customs, Director General Customer Compliance
Sophie Dean and Katherine Green
Directors General Borders and Trade (Job share), Commissioners of Revenue and Customs
Alan Evans
General Counsel and Solicitor
Justin Holliday
Commissioner of Revenue and Customs, Chief Finance Officer, Tax Assurance Commissioner (TAC) and member of the Board
Myrtle Lloyd
Director General Customer Services, Commissioner of Revenue and Customs
Daljit Rehal
Chief Digital Information Officer
Joanna Rowland
Director General Transformation Group, Commissioner of Revenue and Customs
Jonathan Russell
Chief Executive of the Valuation Office Agency
Jonathan Athow
Commissioner of Revenue and Customs, Director General Customer Strategy and Tax Design
Esther Wallington
Chief People Officer
Table 16: Meeting attendance by executive and non-executive directors
| NEDs Board Members | Date started or left role | Board | ARC | Perf.C | PC | PNC (note 1) | CEC | ExCom |
|---|---|---|---|---|---|---|---|---|
| Dame Jayne-Anne Gadhia | 11 | 8 | ||||||
| Patricia Gallan | 10 | 7 | 2 | 1 | 3 | |||
| Michael Hearty | 10 | 8 | 8 | 1 | ||||
| Alice Maynard | 30 June 2022 (left) | 11 | 7 | 3 | 1 | |||
| Paul Morton | 11 | 8 | 7 | |||||
| Juliette Scott | 10 | 3 | 5 | |||||
| David Cooper | 10 May 2021 (joined) | 10 | 8 | |||||
| NEDs | ||||||||
| Elizabeth Fullerton-Rome | 8 | |||||||
| Tom Taylor | 7 | |||||||
| Executives | ||||||||
| Jim Harra | 11 | 8 | 32 | |||||
| Angela MacDonald | 10 | 8 | 1 | 3 | 32 | |||
| Penny Ciniewicz | 1 | 33 | ||||||
| Sophie Dean/Katherine Green | 29 | |||||||
| Alan Evans | 2 | 1 | 33 | |||||
| Justin Holliday | 11 | 7 | 33 | |||||
| Myrtle Lloyd | 2 | 1 | 32 | |||||
| Daljit Rehal | 31 | |||||||
| Joanna Rowland | 31 | |||||||
| Ruth Stanier | 18 July 2021 (left) | 2 | 5 | |||||
| Jonathan Athow | 4 October 2021 (joined) | 2 | 19 | |||||
| Jonathan Russell | 32 | |||||||
| Esther Wallington | 3 | 1 | 29 |
Note 1: PNC stopped meeting from 14 June 2021 and was replaced by People Committee which first met on the 6 September 2021.
Risk management and assurance
Our approach to risk management
HMRC has a well-established culture of managing risks, which is fundamental to the effective operation of our control framework. In the Performance Analysis section, we provide an overview of some of the specific risks facing HMRC and how we are managing them due to their significance in delivering our strategic objectives. This section outlines the approach we are taking to manage all risks across HMRC.
There are 2 main types of risk that we manage:
- Strategic risks: these are risks to the management of HMRC and delivery of our strategic objectives. We manage these risks across all levels of HMRC, from decision making on individual cases to delivering large-scale change and strategic policymaking. The ExCom, HMRC Board and the Audit and Risk Committee review these risks.
- Process risks: these are risks to the efficient operation of our processes. We are enhancing our approach to effective process management to put in place controls to manage those risks and to obtain assurance that those controls are effective.
HMRC’s control framework
We continually take steps to improve the way we are managing risk so we can understand and improve the effectiveness of our processes and controls. Our control framework is based on the application of the ‘3 lines of defence’ assurance model which outlines the different roles people have and the types of activities we undertake in the management of risks.
We have implemented a number of standards for process owners to comply with, including the Process Management Standard, Data Standard, and the Controls Standard. We continue to build capability in developing and reporting of controls and are documenting the controls in our processes and improving controls capability in our change programmes.
Figure 24: HMRC’s 3 lines of defence
| HMRC’s 3 lines of defence | Description |
|---|---|
| Line of Defence 1 | Controls in place to mitigate risks to strategic objectives and business processes |
| Line of Defence 2 | Assure and report on the effectiveness of controls in Line of Defence 1 |
| Line of Defence 3 | Independently assure control effectiveness, risk management and assurance processes |
The control framework covers:
- governance: ensuring that authorities and accountabilities are clear, with appropriate strategies and plans, and that our success in operating the control framework is reflected in the annual governance statements
- risk management: identifying, assessing, managing and reporting the risks to the delivery of our objectives
- process management: taking the necessary action to ensure our processes are effective, efficient, well-controlled, and easy for our customers to use
- controls: embedding effective controls in our business processes to ensure objectives are met and any risks reduced
- management assurance: assuring the controls in place are sufficient and operating as intended, and taking the necessary action to address any weaknesses
- independent assurance: internal and external audit to challenge or confirm the effectiveness of our control framework
- data: ensuring that the data on which our business relies is secure and accurate
The HMRC Control Board is responsible for managing the integration of these different activities. It is chaired by the Director of Finance Operations and is attended by the Directors of Risk Management, Internal Audit, Data, Customer Insight and Design, Head of Governance and the ExCom Secretariat as well as senior leaders from each Business Group. The Control Board reports progress on improving the control framework to our ExCom and Audit and Risk Committee.
For information on how we comply with requirements for specific sectors and jurisdictions governed by the relevant authorities, see the Compliance with the code of good practice section of the Principal Accounting Officer’s report.
Responding to external scrutiny
As a government department, we are accountable to customers, stakeholders and external scrutiny bodies. We take this responsibility seriously – it is an important part of the way we administer tax and payments and work to build public trust.
Recommendations made by external scrutiny bodies
We monitor the implementation of recommendations by external scrutiny bodies including the NAO, Public Accounts Committee and Infrastructure Projects Authority.
In the 2021 to 2022 financial year, we have received and responded to recommendations from the following Parliamentary reports:
- Committee of Public Accounts (PAC) report on HMRC’s management of tax debt
- Committee of Public Accounts (PAC) report on HMRC’s Annual Report and Accounts
We accepted 25 recommendations from NAO value for money reports published after April 2019 with 6 confirmed as implemented by 1 April 2022. Further detail on the status of these recommendations can be found via the NAO recommendations tracker.
We accepted 56 recommendations from the NAO management letter 2019 to 2020, of which 34 were implemented by 1 April 2022.
We also implemented 93 recommendations from the Infrastructure and Projects Authority.
Anti-bribery and anti-corruption
We take a zero-tolerance approach to fraud, bribery and corruption. This is set out in our ‘Counter internal fraud, bribery and corruption’ policy. This is supplemented with a fraud response plan and strategy, which describe our response to bribery and corruption threats. Our Chief Finance Officer (CFO) has day-to-day accountability for the policy, which applies to all our employees, suppliers, contractors and business partners.
Human rights
We have procedures in place to ensure that all our policies and legislation are compliant with the requirements of the Human Rights Act 1998. Our approach is to understand our customers and their needs, treat everyone with respect, recognise that we have privileged access to information (and need to protect that information), and behave professionally with integrity. As part of this, we promote mutual respect and the dignity of the individual.
Personal data-related incidents
All government departments are required to publish information about any serious data-related incidents, which must be reported to the Information Commissioner. A summary of these incidents is shown in Table 17.
Table 17: Summary of protected personal data-related incidents reported to the ICO
| Nature of incident | Number of breaches 2021-22 | Number of breaches 2020-21 |
|---|---|---|
| Personal information used to make changes to customer records on HMRC systems without authorisation | 3 | 11 |
| Loss of inadequately-protected electronic equipment, devices or paper documents from secured government premises | 1 | 0 |
| Loss of inadequately-protected electronic equipment, devices or paper documents from outside secured government premises | 0 | 0 |
| Insecure disposal of inadequately-protected electronic equipment, devices or paper documents | 0 | 1 |
| Unauthorised disclosure | 16 | 5 (note 1) |
| Other | 2 | 1 |
Note 1: The number of unauthorised disclosure ICO notifications for 2020 to 2021 incidents has been raised to 5 (published as 4 in the 2020 to 2021 Annual Report). This is due to an incident at the end of March 2021 which initially did not impact on personal data, but which ongoing investigations subsequently highlighted as having affected customers, of which the ICO was notified in early April 2021. This increases the total number of customers potentially affected by 2020 to 2021 ICO notifiable incidents to 18,298.
We have seen several instances of unauthorised disclosure during 2021 to 2022, which we have notified to the ICO. The number of customers potentially affected by ICO notifiable incidents reported in 2021 to 2022 is 10,896 (2020 to 2021: 18,298).
This figure could still change over time, as new information becomes available as a result of further enquiries and ongoing security incident investigations. The number of unauthorised disclosure incidents reported to the ICO increased in 2021 to 2022 due to enhanced GDPR awareness across the department (the number of centrally recorded unauthorised disclosure incidents which did not require reporting to the Information Commissioner has reduced). We take all of these incidents seriously and are taking steps to address them. For more information see the Building a resilient tax system section.
We have learnt lessons from these incidents and used these to review and strengthen our customer identity and authentication processes. Protecting customer data is important to us and we monitor our processes continually to prevent recurrences. We are also delivering enhanced data security, governance and reporting across HMRC.
Other protected personal data-related incidents
Incidents which did not require reporting to the Information Commissioner are recorded centrally within HMRC and are set out in the table below. The overall number of centrally recorded incidents (particularly unauthorised disclosure) has reduced significantly due to enhanced GDPR awareness across the department. Small, localised incidents are not included in these figures. Figures for financial year 2020 to 2021 are shown separately.
Table 18: Summary of other protected personal data-related incidents
| Nature of incident | Number of breaches 2021-22 | Number of breaches 2020-21 |
|---|---|---|
| Personal information used to make changes to customer records on HMRC systems without authorisation | 1 | 0 |
| Loss of inadequately-protected electronic equipment, devices or paper documents from secured government premises | 1 | 0 |
| Loss of inadequately-protected electronic equipment, devices or paper documents from outside secured government premises | 0 | 0 |
| Insecure disposal of inadequately-protected electronic equipment, devices or paper documents | 0 | 2 |
| Unauthorised disclosure | 1 | 10 |
| Other | 2 | 0 |
Statement on information risk
The number of centrally-managed security incidents impacting on protected personal data in HMRC reduced from 12 to 5 in 2021 to 2022. The number of customers potentially affected by these centrally-managed incidents was 911 (2020 to 2021: 8,737). The figures quoted for the number of customers affected can change over time, as new information becomes available due to further enquiries and ongoing security incident investigations.
For more information on how we manage our data, please see the Building a resilient tax system section.
Principal Accounting Officer’s report
HMRC’s Chief Executive, Jim Harra, has been appointed by HM Treasury as Principal Accounting Officer for HMRC. In this report, he sets out how our accounts are prepared and reviews the effectiveness of our governance, risk management and internal control. This report also contains the elements required for HMRC’s Accounting Officer System Statement.
How we prepare the accounts
HMRC is responsible for collecting the majority of the UK’s tax revenue, including Income Tax for the Scottish and Welsh governments, and its financial information is reported in 2 separate accounts. The Trust Statement reports the revenues, expenditures, assets and liabilities related to the taxes and duties for the financial year. The Resource Accounts report the costs of running HMRC, including making payments of Child Benefit and tax credits. The VOA and RCDTS Ltd are consolidated into the Resource Accounts. Both sets of accounts are prepared under HM Treasury direction on an accruals basis.
Trust Statement
The HM Treasury ‘accounts direction’, issued under section 2 of the Exchequer and Audit Departments Act 1921, requires HMRC to prepare the Trust Statement to give a true and fair view of the state of affairs of the collection and allocations of taxes and duties, the revenue income and expenditure, and cash flows for the financial year.
Resource Accounts
The HM Treasury ‘accounts direction’, issued under the Government Resources and Accounts Act (GRAA) 2000, requires HMRC to prepare consolidated Resource Accounts to give a true and fair view of the state of affairs of HMRC and the departmental group and of the income and expenditure, Statement of Financial Position (SoFP) and cash flows of the departmental group for the financial year.
Principal Accounting Officer’s responsibilities
HM Treasury has appointed me, as HMRC’s Chief Executive, to be Principal Accounting Officer of HMRC, VOA and RCDTS Ltd, with overall responsibility for preparing the Trust Statement and Resource Accounts and for providing them to the Comptroller and Auditor General. In preparing these accounts, I am required to comply with the requirements of the Government Financial Reporting Manual (FReM) and in particular to:
- observe the accounts directions issued by HM Treasury, including the relevant accounting standards and disclosure requirements, applying suitable accounting policies on a consistent basis
- ensure that HMRC has in place appropriate and reliable systems and procedures to carry out the consolidation process
- make judgements and estimates on a reasonable basis, including those judgements involved in consolidating the accounting information provided by the VOA and RCDTS Ltd
- state whether applicable accounting standards as set out in the FReM have been followed, and disclose and explain any material departures in the accounts
- prepare the accounts on a going concern basis
As Principal Accounting Officer, I take personal responsibility for the annual report and accounts and confirm that I have judged it to be fair, balanced and understandable.
Accounting Officers for the Resource Accounts
For the financial year 2021 to 2022, I, Jim Harra was the Principal Accounting Officer.
Jonathan Russell, Chief Executive of the Valuation Office Agency, was an Additional Accounting Officer and was accountable for the parts of HMRC’s accounts relating to specified lines of the Estimate and the associated assets, liabilities and cash flows. This appointment does not detract from my overall responsibility for the department’s accounts.
The allocation of Accounting Officer responsibilities in the department was as follows:
- estimate sections A, C-K and N-Q: Jim Harra, Chief Executive and Permanent Secretary
- estimate sections B, L and M: Jonathan Russell, Chief Executive of the Valuation Office Agency
More detail about the performance against the Estimate can be found in Statement of Parliamentary Supply (SOPS) notes 1.1 and 1.2 in the Parliamentary Accountability disclosures section.
In addition to being the Accounting Officer for HMRC, I am also the Accounting Officer of RCDTS Ltd, a sponsored non-departmental public body. As Accounting Officer of HMRC I am responsible for ensuring that appropriate systems and controls are in place to ensure that any grants we make to our sponsored bodies are applied for the purposes intended. In addition, ensuring that such expenditure and the other income and expenditure of the sponsored bodies are properly accounted for, for the purposes of consolidation within the Resource Accounts. As Accounting Officer of the sponsored body, I am accountable for the use, including the regularity and propriety, of the grants received and the other income and expenditure of the sponsored body.
My responsibilities as Accounting Officer – which include the propriety and regularity of the public finances for which I am answerable, keeping proper records and safeguarding the assets of the department or non-departmental public body for which I am responsible – are set out in Managing Public Money published by HM Treasury.
Auditors
Both sets of accounts are audited by the Comptroller and Auditor General. The Trust Statement is audited under section 2 of the Exchequer and Audit Departments Act 1921. The Resource Accounts are audited under the GRAA 2000. The notional charge for both these audit services is disclosed in Note 2 Expenditure in the Resource Accounts. No non-audit work was carried out by the auditors for HMRC. As far as I am aware, there is no relevant audit information of which the auditors are unaware. As the Accounting Officer, I have taken all the necessary steps to make myself aware of any relevant audit information and to establish that the auditors are aware of that information.
How we comply with the code of good practice for corporate governance in central government departments
Financial responsibilities within HMRC
As HMRC’s Principal Accounting Officer, I delegate financial authority to each of HMRC’s directors general through annual letters of delegation to manage the budget for their business areas within agreed financial limits and Managing Public Money guidelines. The directors general are supported by their finance directors and finance business partners. They cascade delegations of the financial authorities within their business areas, at each stage setting the limits of financial authority and our policy requirements.
This Scheme of Delegations is supported by our financial control framework, which ensures that we adhere to financial control standards in all our financial processes. The HMRC Control Board oversees the development and administration of our control standards, ensuring that financial risks are effectively and efficiently managed through proportionate risk-based controls. The effectiveness of the controls is subject to regular specialist financial control assurance review, and independent review by Internal Audit and the NAO.
Ministerial directions
We deliver a wide range of activity, including new and existing policy, and major investment in our change programme portfolio. We continued to deliver several key time limited support schemes this year in response to the COVID-19 pandemic, including the CJRS, SEISS, and the new one-off Working Households Receiving Tax Credits Scheme (WHRTCS). We also successfully delivered reintroduction of the Statutory Sick Pay Rebate (SSPR), which we administer on behalf of the Department for Work and Pensions (DWP).
As is the case with any new and continued activity carried out by a department, I am required by Managing Public Money guidelines to ensure that the activity meets the 4 key expectations set out by Parliament:
- that the department has the legal power to undertake the activity
- that it complies with propriety expectations, and the activity will deliver the policy objective
- the activity delivers value for money for the Exchequer
- that the scheme is feasible, meaning that we can deliver it within the timeframe and to the design agreed
If an activity is unable to meet one of these expectations, I am required to seek a ministerial direction before I can proceed with delivery responsibility. In 2021 to 2022, I did not seek any ministerial directions.
Statements and reports made by Executive Committee (ExCom) members
Each member of ExCom provides an annual Governance Statement, setting out the control framework arrangements (governance, risk, control, assurance, process and data) in their business areas. These statements are reviewed by Internal Audit Control Board, the Corporate Risk Team, as well as teams that lead on different aspects of the control framework. HMRC’s Audit and Risk Committee also provides assurance of these statements.
The TAC prepares a Tax assurance report. We focus on delivering our core government objectives through a process of robust planning and governance.
Additional Accounting Officers
I receive assurance from HMRC’s Additional Accounting Officers:
- Jonathan Russell has responsibility for VOA administration
- Ruth Stanier had responsibility for the Scottish and Welsh rates of Income Tax until 18 July 2021 and Jonathan Athow assumed responsibility from 4 October 2021
- Justin Holliday has responsibility for the signature of the Account of Duties Collected in the Isle of Man (IoM)
- Patrick Whittome, HMRC Director of Finance Operations, has responsibility for the signature of the Account of R.N. Limited
The VOA provides a separate governance statement and I take assurance from this and from the review which underpins it.
Security
ExCom receives weekly security incident reports, which include details of any personal data-related incidents we report to the ICO, as specified in the Personal data-related incidents section. A regular security incident report is also presented to the Audit and Risk Committee. I also receive formal assurance from HMRC’s Senior Information Risk Owner that information risk has been appropriately managed in the conduct of our business.
National Insurance funds
There are 2 National Insurance funds, one for Great Britain and one for Northern Ireland. Each has its own annual report and accounts, including a governance statement, which I sign separately. Many of the activities relating to the transactions of the 2 funds are carried out by other departments and agencies (for example, the DWP and Department for Communities in Northern Ireland) and I receive letters of assurance from the accounting officers of each of these.
Quality assurance
Quality assurance of business-critical models
We have developed a departmental framework, including central guidance, to underpin quality assurance of business-critical analytical models (BCMs). We maintain a register of these models, consistent with the recommendations of the 2013 Macpherson review. We are continuing to develop our quality assurance of BCMs by further improving model documentation, increasing independent assurance and exploring publishing the BCM register. These developments are in line with recommendations set out by the NAO in their Financial Modelling in Government report (published January 2022), which reviewed BCMs across government.
Management and quality assurance of the analytical models is monitored via the register and the framework is promoted regularly to support the implementation of the guidance among modelling teams. We have a team which carries out independent reviews on a sample of the business-critical models, to provide assurance and share best practice.
Each year, our Audit and Risk Committee considers the quality assurance of our business-critical models and need for any further actions.
Read the register of business-critical models for more information.
Internal audit
The Director of Internal Audit’s opinion to me, as Principal Accounting Officer, and to the Board is limited assurance that HMRC has an adequate and effective framework for governance, risk management and internal control. HMRC’s risk exposure has remained high throughout 2021 to 2022, both operationally and in change delivery.
-
Risk management:
Our opinions in relation to risk management were generally comparable to last year. Risks are largely understood, and the risk management framework is adequate at business group level to support HMRC in dealing with these challenges. The department is taking forward opportunities to strengthen its corporate risk management processes, including the development and roll out of an effective corporate risk management strategy and tool, which remains a work in progress. Overall risk exposure is unlikely to reduce in the short-to medium-term. Risks to technical sourcing, data protection, change management, modernisation of IT systems, security and post-COVID-19 working arrangements demand strong governance, risk and control arrangements. Capacity and funding pressures have been, and will continue to be, a limiting factor. Increased risks to workforce planning and the need to exploit opportunities to improve efficiency, reduce demand and to critically assess plans, will need to be closely managed. Positively there has been further risk assessment work undertaken to better understand long-term IT, GDPR and process and data issues, the control limitations in place and the effort required to update, repair and re-shape systems and controls. -
Governance:
Governance of the organisation is largely effective, albeit HMRC should ensure that ownership is overtly clear for the key components of its control framework at a corporate level – process, technology, data, people and product. Any significant governance issues identified in the course of our work were generally at operational or delivery levels, particularly where systems cross organisational boundaries and/or where accountabilities were less clear. Assessment categories in our governance findings were largely comparable to last year, except for strategy and planning, where there was a 5% increase in audits identifying significant opportunities for improvement and more positively, audit outcomes in relation to monitoring and assurance, which improved by 10%. Through the work of the Control Board, understanding of the second line of defence has improved, but remains uncoordinated in parts, with the opportunity to improve its overall efficiency and coverage. -
Internal control:
The overall results of our audits provide a similar pattern of assurance to last year, with 80% of audits providing a substantial or moderate assurance for control effectiveness. The improvements to control effectiveness I reported last year have been largely consolidated, with a 6% improvement in audit outcomes in relation to achievement of objectives and a 4% improvement in relation to application and compliance. However, whilst there are areas of good control, HMRC has some long-standing control issues that are significant and limit the opinion that I can provide. Notably, the top 10 control issues I raised in my 2019 to 2020 opinion remain largely a work in progress, with ‘security’ added as a separate control issue this year. Delivery of improved control against many of these issues has been slower because they are either cross-cutting and/or legacy issues for which there are no easy fixes. Much of the IT estate, and therefore the control framework, is adversely impacted by long-standing issues, with a commensurate impact on control design, efficiency and effectiveness. Positively, however, for all but one of these control issues I can report an increased focus on resolution and for eight of the issues, an overall upward control trajectory. Design and agreement of a process ownership model has seen progress, though data ownership and improvement activity has been slower to progress. Until these models and associated standards are fully embedded, HMRC does not have the clear accountabilities for process, controls and data that are a prerequisite to improving its control environment, and the effective application thereof.
Accountability relationships with arm’s length bodies
HMRC has 3 arm’s length bodies: Valuation Office Agency (VOA) an executive agency of HMRC, RCDTS Ltd, and R.N. Limited. I am satisfied that each of these has systems in place which meet appropriate standards of governance, decision-making and financial management.
Figure 25: HMRC accountability system
Valuation Office Agency (VOA)
The VOA is an executive agency of HMRC and provides valuations and property advice to the government and local authorities in England, Scotland and Wales. The VOA receives its funding to undertake valuations for local taxation purposes from HMRC through the Parliamentary supply process. It also recovers elements of its expenditure from other government departments where it has provided valuation services.
Performance monitoring
Jonathan Russell is a member of HMRC’s ExCom. He was appointed Interim CEO and Accounting Officer for the VOA on 7 September 2020 and appointed as the VOA’s new Chief Executive on 9 September 2021 and Accounting Officer on the 12 October 2021.
HMRC’s ExCom performance hub and ExCom transformation performance pack include VOA data, and assurance is provided by HMRC’s Internal Audit function.
HMRC has a dedicated sponsor team for the VOA and ExCom sponsor, Justin Holliday. The team has a good understanding of the VOA and provides me with an update ahead of VOA Board meetings. I am content that our oversight is working well and our work to integrate corporate services will bring further benefits and efficiencies to VOA and HMRC. I hold Quarterly Business Reviews with Jonathan Russell, and he and Sue Hall, the VOA’s Lead NED, attend the HMRC Board at least once a year.
The chair of HMRC’s A&RC attends 2 meetings of the VOA Audit and Risk Assurance Committee (ARAC) each year. The chair of the VOA ARAC attends at least one HMRC A&RC meeting annually and presents an annual report to them. VOA ExCom members are part of HMRC’s functional leadership team in our CFO business area. A member of HMRC’s Chief Digital and Information Officer (CDIO) business area attends the VOA ExCom as a standing invitee.
The VOA provides monthly financial statements consolidated into HMRC’s accounts for HM Treasury returns and end-of-year statutory accounts, as well as statutory accounts audited by the NAO.
Accountability for spending
Jonathan Russell is accountable to Parliament for the propriety and regularity of the public finance within his charge, meeting the requirements of Managing Public Money, HM Treasury and Cabinet Office guidance, Public Accounts Committee and other Parliamentary select committees or authorities. As Principal Accounting Officer, I am accountable for ensuring a high standard of financial management by strategic oversight of the VOA.
Revenue and Customs Digital Technology Services Limited (RCDTS Ltd)
RCDTS Ltd is a non-profit making company wholly controlled by and operated for HMRC which supplies the department with IT services. It is a separate legal entity with an arm’s length relationship with HMRC. The RCDTS Ltd Board has 7 directors, all employed by HMRC.
RCDTS Ltd has received funding from HMRC in the form of a long-term repayable loan. There is a funding facility between HMRC and RCDTS Ltd for general working capital and investment purposes for supplying of IT services to HMRC. RCDTS Ltd invoices HMRC for the services it provides and is a non-profit making company, recharging all costs to HMRC (its only customer).
Performance monitoring
HMRC has a sponsor team to provide me with assurance as Accounting Officer of RCDTS Ltd. The team advises HMRC and ExCom, acting on our behalf in managing financial risk and return of RCDTS Ltd, challenging and supporting the board and RCDTS Ltd in achieving its objectives. At an operational level it ensures compliance with the Master Services Agreement and Framework Agreement.
Accountability for spending
HMRC Finance and Operations team produces and publishes RCDTS Ltd accounts. The team also maintains and monitors a control register for delivery of key operational processes, for example, delivering the balance sheet to the RCDTS Ltd Board, and submitting the VAT return. The team also monitors cash flow to ensure sufficient funds are held to meet working capital commitments.
Future of RCDTS Ltd
Following the Technology Sourcing Programme review of HMRC’s future IT strategy, it has been decided that the services RCDTS Ltd currently provides will in future be provided by a mixture of HMRC and third parties, depending on where the service can most effectively and efficiently be delivered. Closure of RCDTS Ltd is planned for late 2023 once services have transferred.
R.N. Ltd
R.N. Ltd is a private company limited by shares held by the Treasury Solicitor on trust for the HMRC Commissioners. R.N. Ltd acts as a nominee for the Commissioners and the company holds charges over assets that secure tax debts owing to HMRC. It holds registered title over assets assigned to HMRC in settlement of tax liabilities. R.N. Limited had 4 directors on 31 March 2022. The Accounting Officer is Patrick Whittome, HMRC Director of Finance Operations who has authority delegated by the HMRC Commissioners to give directions to the Treasury Solicitor on the shareholding of R.N. Ltd.
There is a formal agreement between HMRC and R.N. Ltd and ExCom-level sponsorship from Justin Holliday. R.N. Ltd has no employees. HMRC’s Finance and Operations team provides case work administration, accounts production and secretarial services. The running costs of R.N. Ltd are met by HMRC.
Performance monitoring
The R.N. Ltd Board meets quarterly. All board meetings discuss strategy and monitor the success of R.N.’s strategies as well as any associated risks. The Finance Operations team monitors the risks and provides regular updates to the R.N. Ltd Board.
Accountability for spending
R.N. Ltd has no specific budget. The value of the assets over which the company holds charges and has title assigned amounts to £13.3 million (Voluntary Legal Charges £7.6 million and Funding Bonds/ Shares £5.7 million). These assets are excluded from the R.N. Ltd balance sheet, as the company holds these in a nominee capacity. In addition to preparing the accounts for R.N. Ltd, the HMRC Finance Operations team also keeps a register for R.N. Ltd where all controls are listed and monitored.
Other organisations
Entrust is an organisation that regulates the Landfill Communities Fund (a tax credit scheme enabling landfill operators to fund environmental bodies to undertake specified environmental projects). A levy on contributions to environmental bodies, set annually by HMRC and announced at Budget, funds Entrust. Entrust is not an arm’s length body of HMRC but has a close relationship to HMRC similar to other bodies.
Accountability for major contracts and outsourced services
The scope of this section is limited to major contracts and outsourced services. In 2021 to 2022 HMRC provided the following grant schemes in accordance with relevant guidelines:
- COVID-19 grant activity as part of the government’s response to the COVID-19 pandemic (the CJRS and SEISS)
- within Borders and Trade where grants are made to eligible applicants to help educate them on customs processes including help with customs declarations, and
- to the charity sector who provide advice and assistance to vulnerable clients on their financial affairs (including tax affairs) operated by third parties
HMRC has a number of major contracts that are significant in ensuring that it can deliver its core services. Our IT services are provided through contracts with Capgemini, Fujitsu, Accenture and Kcom, valued approximately at £884 million in total, each year.
Mapeley
Between August 2018 and June 2019, in advance of the STEPS Private Finance Initiative (PFI) Contract expiry on 1 April 2021, HMRC undertook 3 procurement exercises for regional Facilities Management services and a National Security service, which would be required to underpin HMRC’s Building Our Future Locations Programme and give the department contractual resilience across the country.
These new regionally focussed Facilities Management contracts and single national security contract have been completed and awarded via further competition using the Crown Commercial Services Framework agreements RM3830 (Hard and Soft FM) and RM6089 (National Security Services) and have resulted in the award of 7 contracts to 5 suppliers. The combined value of these contracts over a 5-year period is circa £250 million to £300 million, which will expire between December 2023 and March 2024, however all contracts have the option to extend by 2 years on a one plus one basis.
IT contracts
HMRC continues to deliver better value for money from the IT contracts by using well-established performance measures, which during 2021 to 2022 has focussed on our post Aspire contracts with Cap, Fujitsu and Accenture. Any new agreements are operating under modern framework contracts with improved and standardised performance measures. Expanding our supplier base has allowed us to take better advantage of technical innovations and keep pace with technology trends. This approach supports our digital transformation and move to lower-cost and highly resilient cloud data storage services.
The expenditure values for the IT contracts for HMRC’s 2021 to 2022 Resource Accounts are as follows:
- IT Public Private Partnership contract (PPP) payments: £137.7 million
- IT services and consumables: £896.5 million
- Total: £1,034.2 million
Control challenges in financial year 2021 to 2022
Over the past year, we have actively managed the following issues that posed a risk to delivery of our core work.
Tax credits error and fraud
The Comptroller and Auditor General has qualified his opinion on HMRC’s Resource Account for payments that we make that are not in accordance with Parliamentary intent, due to error and fraud in personal tax credits. The underlying cause of this is the design of the tax credit system (an annual cycle and year-end reconciliation). Tax credits are being replaced by Universal Credit (UC), so opportunities to resolve this issue through major system, product or process changes are significantly limited.
The error and fraud overpayment rate has reduced from the high levels of 8.9% seen in financial year 2008 to 2009, hitting an all-time low of 4.4% in financial year 2014 to 2015. HMRC has maintained the levels of error and fraud within an established range of 4.5 to 5.5% in every year between financial years 2015 to 2016 and 2020 to 2021. Ministers retained the target to restrict error and fraud to no more than 5% of entitlement for 2018 to 2019 and 2019 to 2020 but in line with other HMRC metrics during the COVID-19 pandemic we did not set an error and fraud target for 2020 to 2021 or 2021 to 2022.
The level of error and fraud is impacted by the migration to UC and continued pressures on error and fraud compliance resourcing. We reallocated staff to handle the impact of COVID-19 on our business, leading to a reduction in compliance activity as frontline compliance staff were redeployed to customer service work and COVID-19 support schemes.
The central estimate of the error and fraud overpayment rate is estimated to have decreased to 5.0% in 2020 to 2021 from 5.3% in the final estimate for 2019 to 2020. We estimate that the action taken to respond to the COVID-19 pandemic accounted for £144 million or added 0.8 percentage points to the central error and fraud estimate in 2019 to 2020. This means if it were not for the impact of the pandemic, the central estimate of error and fraud would have been around 4.5% for that year.
HMRC’s accounts have been qualified since the inception of tax credits. We expect the qualification of the accounts to continue as error and fraud will remain a significant issue until the closure of tax credits.
Research and development tax relief error and fraud
The Comptroller and Auditor General has again qualified his opinion on HMRC’s Resource Account to include error and fraud in research and development (R&D) tax reliefs. There has been a significant increase in the cost and take-up of these reliefs in recent years. At Autumn Budget 2021 the government announced that R&D tax reliefs would be reformed. One of the aims of this reform is to target abuse of the reliefs and improve compliance.
2021 to 2022 is the third financial year where an estimate of this error and fraud has been prepared for the annual report and accounts. The overall estimate of the level of error and fraud is 4.9% of the estimated cost of the reliefs: The level of error and fraud for the SMEs (Small and Medium Enterprises) scheme was 7.3% and the level for the RDEC (Research and Development expenditure credit) scheme was 1.1%. The estimate is based on historic claim data, compliance results and tax gaps, and by its nature is uncertain. This estimate does not differentiate between error and fraud and covers a wide range of non-compliant behaviours. The rate is higher than the 2020 to 2021 estimate and reflects improvements in HMRC’s risk identification process.
HMRC identified a pattern of irregular R&D claims in April 2022. In response, and reinforcing HMRC’s commitment to tackling error and fraud in the R&D tax reliefs, HMRC implemented additional measures including: establishing a threat risk assessment process for all research and development claims; implementing additional payment identification and verification controls for all research and development payments; and accelerating the creation of HMRC’s Research and Development Anti Abuse Unit which was announced in the autumn budget.
COVID-19 support schemes error and fraud
The Comptroller and Auditor General has qualified his opinion on HMRC’s Resource Account to include error and fraud in the COVID-19 Schemes.
In the CJRS, the error and fraud rate for 2020 to 2021 was 5.3%, within the range of 3.7% to 7.6%, and for 2021 to 2022 is 2.8%, within the range of 2.0% to 3.7%.
In the SEISS, the error and fraud rate for 2020 to 2021 was 3.2%, within the range of 2.4% to 4.1%, and for 2021 to 2022 is 4.5%, within the range of 3.5% to 6.3%.
Our 2021 to 2022 compliance activities have resulted in over £125 million losses prevented and £226 million recovered, bringing the overall compliance outcome since the start of the schemes to £1.2 billion. Since compliance work commenced on the schemes a great deal has been learnt about the types and levels of error and fraud.
Our pre-payment controls have been even more effective than anticipated and we have not seen the levels of organised crime and criminal attacks originally expected. We have also not seen the level of overall fraud originally anticipated in estimates, and the majority of losses identified by our Taxpayer Protection Taskforce have been a result of error.
Conclusion and compliance with the code of good practice
I have assessed HMRC’s compliance with the ‘Corporate governance in the central government departments code of good practice 2017’.
The code focuses on governance arrangements for ministerial departments. There are elements which are not directly relevant to HMRC due to our statutory framework and status as a non-ministerial department, for example, commissioners make arrangements for the conduct of their proceedings and the delegation of functions (section 12 and section 14, CRCA) and ministers attending the board. However, we comply with the spirit and principles of the code and by this, and other means, good governance is achieved in HMRC.
Our corporate governance arrangements have continued to evolve during the year. An organisation of HMRC’s size and complexity will always have multiple risks to manage at any one time. I am satisfied that the governance arrangements in place throughout 2021 to 2022 have been sufficient to continue managing risks effectively.
Based on the review outlined above, I conclude that HMRC has a sound system of governance, risk management and internal control that supports the department’s aims and objectives for 2021 to 2022.
Read the Corporate governance in the central government departments code of good practice 2017 for more information.
Jim Harra
Accounting Officer
6 July 2022
Tax Assurance Commissioner’s report
Foreword
As TAC and alongside my role as CFO, I support HMRC’s ambition to build a trusted, modern tax administration system. Specifically, as TAC, I aim to provide confidence that HMRC resolves tax disputes fairly, carefully and consistently. Alongside 2 other Commissioners, I decide whether to accept or reject resolution proposals in HMRC’s largest and most sensitive tax disputes. We also oversee our wider dispute resolution processes, including reviewing a sample of smaller cases.
There is legitimate public interest in the way HMRC resolves disputes, particularly with large corporates. The aim is to settle all disputes, large and small, by agreement with taxpayers: we offer a range of ways for taxpayers and HMRC to reach a resolution. Any proposal to resolve a dispute will be considered in line with HMRC’s published Litigation and Settlement Strategy, which sets out that HMRC will not settle for an amount that is less than it would reasonably expect to obtain from litigation. I am assured by both the oversight of the formal governance boards, and my own personal oversight of the largest and most sensitive cases, that this is the case.
As part of the ongoing commitment to make improvements to the way disputes are resolved, HMRC has delivered a programme of work to embed the standards of the HMRC Charter into day-to-day operations. I am happy to report that this has led to improved professional standards in our compliance activities, as well as a single set of HMRC writing guidelines being created and followed, which has enhanced the way we communicate with taxpayers. You can read more about this in the wider Annual Report, alongside more information on Powers and safeguards and working with taxpayers who need extra support. Safeguarding and supporting taxpayers during the dispute resolution process is of vital importance to HMRC.
This year HMRC refocused the Tax Settlement Assurance Programme (TSAP). My report sets out progress across both key themes of our compliance professionalisation work and at a case level. On balance, quality is improving but there is still more to do. I am confident that HMRC colleagues will continue working to improve results over the coming year.
I am very proud of all the teams across HMRC who have continued to deliver. I look forward to providing ongoing assurance of the way tax disputes are resolved to both the public and Parliament, contributing to building further confidence in HMRC.
Justin Holliday
Tax Assurance Commissioner and Chief Finance Officer
Our approach to tax disputes
We are committed to improving our customer experience and the HMRC Charter defines the service and standard of behaviour that customers should expect when interacting with us. Where possible, we support customers to get their tax affairs right without the need for a dispute. We do this in several ways, including designing well-framed guidance and legislation and providing one-to-one support through online web chats, phone calls and correspondence. We deal with fraud by using civil fraud investigation procedures where necessary. We reserve our criminal investigation powers for cases where HMRC needs to send a strong deterrent message, or where the conduct involved is such that only a criminal sanction is appropriate.
However, we know there will be occasions where customers disagree with us on the amount of tax that is due. We seek to resolve any dispute as quickly and cost-effectively as possible, in accordance with the law, our Litigation and Settlement Strategy (LSS) and our ‘Code of Governance for resolving tax disputes’. Customers and HMRC have a range of ways to reach resolution by agreement, ultimately if that is not possible the customer can ask for a statutory review of the decision and additionally appeal to an independent tax tribunal. In certain cases, it is possible to use mediation through Alternative Dispute Resolution.
Read HMRC’s code of governance for resolving tax disputes, HMRC’s criminal investigation policy and HMRC’s Charter for more information.
Governing the resolution of disputes
The role of TAC was introduced in 2012, as part of a package of measures to strengthen governance of tax disputes. The TAC has ultimate responsibility for civil dispute governance across HMRC, and for the LSS. They provide assurance and transparency, with an explicit role to challenge decision-making in the largest and most sensitive disputes, and a sample of smaller cases. The TAC has no role in the tax affairs of specific taxpayers and no line management responsibility for caseworkers, maintaining clear separation of responsibilities.
Most case resolution decisions are taken by caseworkers with the oversight of their managers and, where relevant, advice from specialists. Decisions are assured, on a sample basis, through HMRC programmes such as the Tax Settlement Assurance Programme. In larger or more sensitive cases, proposed settlement decisions are considered by departmental governance boards. In the largest and most sensitive disputes, a panel of 3 HMRC commissioners, usually including the TAC, assure the resolution of disputes.
Read HMRC’s LSS for more information.
Figure 26: Structure of HMRC’s dispute resolution governance
In the financial year 2021 to 2022, the commissioners considered risks referred from the Tax Disputes Resolution Board (TDRB) as well as a sample of cases from the Customer Compliance Group Dispute Resolution Board (CCG DRB). Additionally, the commissioners considered risks referred to it by the Anti-Avoidance Board.
HMRC’s governance boards comprise of senior officers from across HMRC, including lawyers and representatives from policy, technical and operational areas, independent of the case team. If the tax at risk in a dispute is greater than £5 million (non-Large Business customers) or £15 million (Large Business customers), it falls within the remit of CCG DRB. But when the total tax at risk for all ongoing disputes with a customer exceeds £100 million, each individual dispute comes within the remit of the TDRB, which makes recommendations to the commissioners on any proposal to resolve those disputes.
As part of their governance, the commissioners noted that case teams continued to pay attention to establishing the taxpayer’s behaviour leading to the risk. This ensured that penalties were being charged when appropriate.
Table 19: HMRC Commissioners: outcome of referrals
| 2021-22 | 2020-21 | |
|---|---|---|
| Total number of meetings held (including via correspondence) | 18 | 15 |
| Total referrals to the commissioners | 49 (note 1) | 40 (note 1) |
| Reason for referrals | ||
| £100m plus tax or £500m adjustment | 34 | 26 |
| Decisions on sensitive case or risk | 2 | 1 |
| Decisions on sample cases | 10 | 10 |
| Director referral | 1 | 2 |
| Direct re-referral following remittance for further work | 2 | 1 |
| Outcome of referral | ||
| Taxpayer’s position accepted | 27 | 17 |
| Taxpayer’s position rejected | 19 | 19 |
| Taxpayer’s position conditionally rejected | 0 | 1 |
| Taxpayer’s position partially rejected | 1 | 1 |
| Remitted for further work | 2 | 2 |
Note 1: In addition there are four referrals not included in this figure, two from the Anti-Avoidance Board (AAB) and two not included as they were not decisions on a substantive proposal. Four referrals from 2020 to 2021 were considered in 2021 to 2022. One referral will be heard in 2022 to 2023.
Table 20: HMRC Commissioners: tax under consideration in decisions referred to commissioners
| 2021-22 (£m) | 2020-21 (£m) | |
|---|---|---|
| Taxpayer’s position accepted | 3,238.2 | 2,405.0 |
| Taxpayer’s position rejected | 1,845.5 | 4,330.0 |
| Taxpayer’s position conditionally rejected | – | 243.8 |
| Taxpayer’s position partially rejected | 95.8 | 15.6 |
| Remitted | 84.9 | 28.3 |
Table 21: Tax Dispute Resolution Board: outcome of referrals
| 2021-22 | 2020-21 | |
|---|---|---|
| Referrals to TDRB | 38 (note 1) | 36 |
| Referred to commissioners | ||
| Taxpayer’s position accepted | 21 | 15 |
| Taxpayer’s position rejected | 12 | 16 |
| Taxpayer’s position conditional accepted | 0 | 0 |
| Taxpayer’s position partially rejected | 1 | 1 |
| Total referred to commissioners | 34 (note 2) | 32 |
| Not referred | ||
| Remitted for further work | 1 | 2 |
| Guidance provided | – | 1 |
| Decision taken by TDRB under its remit | 3 (note 3) | 1 |
| Total not referred to commissioners | 4 | 4 |
Note 1: 1 referral heard by TDRB in 2021 to 2022 will be heard by TAC in 2022 to 2023.
Note 2: In addition one referral was penalty only and not included in these figures.
Note 3: 3 referrals were made to TDRB for decisions due to capacity at CCG DRB. These were not referred on to the commissioners.
Table 22: The Customer Compliance Group Dispute Resolution Board: outcome of the total referrals to the CCG DRB
| 2021-22 | 2020-21 | |
|---|---|---|
| Total referrals to CCG DRB | 84 | 71 |
| Taxpayer position accepted | 34 | 29 |
| Taxpayer position rejected | 44 | 37 |
| Board remitted for further work before re-referral | 5 | 4 |
| Board provided advice and guidance – no decision sought | 1 | 1 |
| Sample cases | 10 | 10 |
Issues governance
We have governance processes in place to determine our approach to issues that affect multiple taxpayers in a consistent and even-handed manner. Policy teams refer issues to the Contentious Issues Panel (CIP) for non-avoidance issues or to the AAB for avoidance issues. Both these bodies include senior operational, legal and policy experts.
During 2021 to 2022:
- the CIP met 7 times and considered 6 issues (5 times and 5 issues in 2020 to 2021); they considered a variety of issues involving Income Tax, CT, VAT, Landfill Tax, Excise Duty and Customs Duty
- the AAB met 6 times and considered 11 issues (9 times and 17 issues in 2020 to 2021)
No issues were referred to the commissioners from the CIP (as was the case in 2020 to 2021).
One issue was referred to the commissioners from the AAB (one referral in 2020 to 2021 that was heard by the commissioners this year).
General Anti-Abuse Rule (GAAR)
The purpose of the GAAR is to discourage taxpayers from entering into abusive arrangements, and to deter the promotion and enabling of such arrangements. The GAAR Advisory Panel is an independent body made up of experts with legal, accountancy and commercial backgrounds. It provides an early opinion on whether tax arrangements are unreasonable.
We are legally required to consider the opinions issued by the panel in reaching a final decision on whether to use the GAAR to address the tax advantage arising from the arrangements, or whether to apply penalties to enablers who facilitated the use of those arrangements. Courts must also take into account the panel’s opinion if the tax arrangements are considered by them. The panel’s opinions are published on GOV.UK to help taxpayers recognise abusive tax avoidance schemes.
In 2021 to 2022 the panel provided opinions in 2 cases (2 in financial year 2020 to 2021). In each case, the opinion of the panel has been that entering into and carrying out the arrangements was not a reasonable course of action.
Since 2018, we have issued around 6,100 GAAR opinion notices (applying GAAR Advisory Panel opinions) to taxpayers who have used these arrangements. Taxpayers have the right to appeal against any adjustments made under the GAAR and any penalties that may be due if their case is settled under the GAAR.
Read more about GAAR on the Tax avoidance: General Anti-Abuse Rule page of GOV.UK.
Ensuring a standard approach to penalties
We charge our customers penalties where we find that they have filed an inaccurate tax return, claim or document, and the inaccuracy occurred because of careless or deliberate behaviour on their part.
We work hard to ensure consistency in our decisions to charge penalties. We do this by maintaining effective controls to make sure decisions are considered and authorised at the appropriate level, taking into account both the size and complexity of the tax risk and the corresponding penalty.
We control penalty decision-making through line manager authorisation checks, and specific governance boards for the most complex cases. We utilise networks of senior tax professionals to support our caseworkers with advice and assurance.
Within our FIS, where the taxpayer does not agree with a proposed penalty decision relating to deliberate non-compliance, it is reviewed by a national penalties team.
For the very largest and most complex cases worked in Large Business, decisions are assured by the Penalties Consistency Panel (PCP). Cases the PCP considers include those:
- that are subject to determination by CCG DRB, TDRB or TAC
- where the potential tax lost exceeds £10 million and a penalty might be charged in relation to the tax loss
- where deliberate inaccuracies are alleged involving Customs Civil Evasion Penalties
How we resolve tax disputes
The vast majority of tax disputes are resolved following collaborative work with customers and by agreement. However, where agreement is not possible, HMRC and customers have access to several ways to help resolve disputes.
The customer can ask for a statutory review of the decision and additionally appeal to an independent tribunal. In certain cases, it is possible to use mediation through ADR. Customers are entitled to have someone else deal with the matter on their behalf, such as an accountant, friend or a relative throughout the entire dispute process, as long as they have been authorised by the customer to do so. To protect our customers, HMRC also works with professional bodies to set the standard expected of professional agents who support customers to meet their tax obligations.
We always try to resolve disputes as quickly and cost-effectively as possible, in accordance with the law, our LSS and our ‘Code of Governance for resolving tax disputes’.
HMRC’s LSS is the framework within which HMRC resolves tax disputes covered by civil law processes and procedures. The LSS applies irrespective of whether the dispute is resolved by agreement with the customer or through litigation. It supports HMRC to obtain the best practicable return for the Exchequer and to bear down on avoidance and evasion.
HMRC does not ‘do deals’ with anyone and resolves disputes in line with current law. We resolve each dispute separately and do not enter into “package deals” across a number of separate disputes with the same customer, although we may settle different matters concurrently.
The LSS frames how HMRC applies its litigation effort to those risks where the overall revenue flows potentially involved would make it worthwhile. HMRC does not generally concede disputes it is likely to win in litigation, as long as the amounts involved justify doing so.
Alternative Dispute Resolution
ADR is a flexible dispute resolution tool, which can help HMRC and the taxpayer resolve disputes (or reach key decision points) in a cost-effective and efficient manner. Although available at any point of a compliance check or enquiry, most ADR applications are made once we have made a decision and the customer has appealed to the tribunal.
Taxpayers may apply online for ADR. Where our mediators have concerns about whether ADR will be effective, the case is referred to an internal governance panel for consideration. Where we agree to enter into ADR, an impartial HMRC mediator will work with the HMRC caseworker and the taxpayer to try to resolve the dispute.
In response to the COVID-19 pandemic, we have used video conferencing and telephone conferencing when mediating tax disputes. This has enabled us to continue a mediation service despite the limitations of social distancing and successive ‘lock-downs’.
The resolution rates over the periods reviewed indicate that virtual mediations have been an effective forum for mediation and not impacted the successful record of ADR in resolving disputes.
Table 23: Alternative dispute referrals
| 2021-22 | 2020-21 | |
|---|---|---|
| Total applications for ADR (either side can propose ADR) | 1,047 (note 1) | 834 |
| Cases rejected by governance panels | 283 (note 2) | 163 |
| Cases rejected as being Out of Scope | 298 | – |
| Cases awaiting decision | 25 | 44 |
| Active cases | 147 (note 3) | 140 |
| Cases resolved | 269 (note 4) | 172 |
| % of cases resolved | 80% | 78% |
| Cases going to litigation | 96 | 62 |
Note 1: This figure does not include 169 applications filtered out via the online portal, because there was no appeal in place.
Note 2: This figure does not include ‘Out of Scope’ applications.
Note 3: This figure could include applications from a previous tax year.
Note 4: 269 resolved out of 335 closed.
Settlement opportunity published in 2021 to 2022
Where multiple taxpayers are affected by a similar disputed issue, such as a tax avoidance scheme, we may publish our position on the disputed issue and invite affected taxpayers to resolve their case on the published basis. This enables us to handle such issues efficiently, with transparency and consistency.
On 6 September 2021 we published a time limited settlement opportunity for Eclipse Film Partnership members to resolve any Eclipse related tax issues. The settlement opportunity is only for individuals who are current or former members of any Eclipse LLPs and for tax issues arising from Eclipse. It does not apply to any individual under criminal investigation.
We have contacted those eligible for the settlement opportunity setting out what they needed to do. Those who join the settlement opportunity, and settle under its terms, will not be pursued for tax on income treated as paying back borrowings, including for periods after individuals had exited the LLPs.
Settlement under the terms of the opportunity will recover all the tax avoided with interest and will also remove the need for further litigation.
Read more about the settlement opportunity for Eclipse Film Partnership members on GOV.UK.
Reviews and appeals
If a customer disputes an appealable tax decision, they can request a statutory review of the decision or appeal to the independent tax tribunal. As most reviews settle disputes, and reviews are a more cost-effective and quicker option than appeals, it can be beneficial to customers to seek a review in the first instance. If a customer requests a review and does not agree with the outcome, they can still make an appeal to the tribunal. All HMRC reviews and appeals are dealt with by officers who are tax, legal or accountancy professionals working in our Solicitor’s Office and Legal Services Group.
How we review decisions
The statutory review process provides an additional opportunity to resolve disputes without the need for tribunal proceedings. Review officers are technical specialists who are not involved in making the original decisions and so provide an objective and impartial review service. Review officers check whether the decision is in line with legislation and technical guidance, policy and practice. The review is also an opportunity to provide feedback internally to HMRC caseworkers and, thereby, improve decision making.
We carry out the review ensuring:
- a transparent review of decisions
- quality and consistency in our review conclusions
- even-handed dealing with taxpayers at review
- as many disputes as possible are resolved without tribunal proceedings
The project initiated to take forward the recommendation made by the Office of Tax Simplification to build further confidence in the impartiality of statutory reviews has made significant progress.
The work undertaken promoting statutory reviews to external stakeholders and canvassing their views continues, as well as the research conducted by an external agency (Ipsos Mori) on our behalf, concerning customer and agent experience of statutory reviews, has been concluded.
Read the resulting report Understanding perceptions of the statutory review process for more information.
Building on the conclusions of that research, work is underway to refine guidance on GOV.UK and identify opportunities to improve the communication of the review process and its benefits to our customers.
The figures reported below show a lower number of statutory reviews in 2020 to 2021, which is reflective of fewer decisions being issued by HMRC and consequently fewer disputes being raised because of COVID-19. We are now starting to see an increase in requests for reviews, which should be reflected in next year’s figures.
Table 24: Overview of outcomes of reviews
| All cases | 2021-22 | 2020-21 |
|---|---|---|
| Dealt with in the year | 40,785 | 10,026 |
| Original decision upheld | 10,672 | 3,475 |
| Varied | 2,240 | 670 |
| Cancelled | 27,873 | 5,881 |
| Percentage where original decision was upheld | 26% | 35% |
| Number closed where the taxpayer was not represented by an agent | 38,263 | 8,133 |
| Percentage closed where the taxpayer was not represented by an agent | 94% | 81% |
| Automated penalty cases including default surcharge cases | ||
| Dealt with in the year | 36,419 | 6,876 |
| Original decision upheld | 7,293 | 1,122 |
| Varied | 1,582 | 255 |
| Cancelled | 27,544 | 5,499 |
| Percentage where original decision was upheld | 20% | 16% |
| All other reviews | ||
| Dealt with in the year | 4,366 | 3,150 |
| Original decision upheld | 3,379 | 2,353 (note 1) |
| Varied | 658 | 415 |
| Cancelled | 329 | 382 |
| Percentage where original decision was upheld | 77% | 75% |
Note 1: There was a typographical error in the 2020 to 2021 report, this is the correct number.
In 2021 to 2022, 94% of reviews were requested by unrepresented taxpayers. The increase in the upheld rate for reviews of automated penalties arose as fewer people were able to show they had a reasonable excuse as a reason for the penalty charge to be removed than the previous year.
Appeals
Where a dispute cannot be settled by agreement, the taxpayer can appeal to the independent tax tribunal. All appeals are heard by the First-tier Tribunal (FTT). If either the taxpayer or HMRC are dissatisfied with the decision of the FTT then they can appeal to the Upper Tribunal (UT). Decisions made by the UT are appealable through the court system. The tribunals and courts are independent of HMRC and listen to both sides of the dispute before making a decision.
In 2021 to 2022 the Tribunal notified us of 15,613 new appeals, of which approximately 2% related to late payment or late filing penalties and surcharges.
In March 2020, Her Majesty’s Courts and Tribunal Service (HMCTS) decided to host hearings virtually (either via video or telephone) to comply with national COVID-19 restrictions. HMRC worked closely with HMCTS during the pandemic to help facilitate this change in practice. Following the lifting of all remaining COVID-19 restrictions in early 2022, HMRC continues to work with HMCTS to facilitate hybrid working arrangements and enable hearings to be conducted both in person and virtually where it is suitable and appropriate to do so.
There were approximately 36,500 appeals in progress on 31 March 2022. Over 16,000 of these are appeals to the FTT that have been stood over. This is, generally, where we and the taxpayer have agreed to put the appeal on hold while waiting for a decision in a related lead case that is being litigated. As stood over cases are not actively progressed by the Tribunal, they can remain on hand for many years while the lead case is decided. An appeal not stood behind a lead case would typically be resolved within 12 to 18 months. Staying appeals behind lead cases ensures that disputes are resolved as efficiently as possible and minimises costs to both taxpayers and HMRC.
The success rate recorded in table 25 below is calculated as the percentage of hearings where the decision is in our favour or substantive elements of our case succeeded. In 2021 to 2022 3,445 appeals were concluded; including some by agreement before the hearing progressed, which can be down to a variety of reasons.
The tax protected through litigation in the year is £8.2 billion (£9.8 billion in 2020 to 2021). Tax protected is a measure of the tax at risk in litigation where HMRC has successfully defended its decisions. If a specific appeal is challenging an aspect of law that would have implications for a large number of cases, then the tax protected figure will include an estimate of this wider tax at risk. Tax protected in any year is usually a reflection of a small number of cases that have a large amount of tax at stake.
HMRC’s success rate for all decided appeals across all tribunals and courts was 88% (86% in 2020 to 2021).
Table 25: Data relating to decided appeals
| First-tier Tribunal (2021-22) | Upper Tribunal (2021-22) | High Court (2021-22) | Court of Appeal (2021-22) | Supreme Court (2021-22) | First-tier Tribunal (2020-21) | Upper Tribunal (2020-21) | High Court (2020-21) | Court of Appeal (2020-21) | Supreme Court (2020-21) | |
|---|---|---|---|---|---|---|---|---|---|---|
| Total | 833 | 54 | 3 | 27 | 4 | 1,052 | 53 | 3 | 17 | 5 |
| Decision for HMRC | 689 | 37 | 2 | 21 | 1 | 855 | 42 | 3 | 11 | 1 |
| Decision where substantive elements of HMRC’s case succeeded | 46 | 5 | 1 | 4 | 1 | 50 | 2 | 0 | 3 | 1 |
| Decision for customer | 98 | 12 | 0 | 2 | 2 | 147 | 9 | 0 | 3 | 3 |
| HMRC success rate | 88% | 78% | 100% | 93% | 50% | 86% | 83% | 100% | 82% | 40% |
Included in the figures above were decisions issued in a total of 42 (38 in 2020 to 2021) cases involving or related to tax avoidance, with 37 (35 in 2020 to 2021) decided wholly or partially in HMRC’s favour – protecting tax revenue of around £0.6 billion (£1.7 billion in 2020 to 2021).
Tax Settlement Assurance Programme
To improve results and enhance the professionalism of our compliance casework, in July 2020 we launched a single set of Compliance Professional Standards (CPS), aligned to the HMRC Charter, and we are strengthening our controls and assurance activities. The CPS provide the focus for our training and for building capability, and we will use them to measure and evaluate the quality of our performance, including how responsive we are to our customers.
In 2021 to 2022 we began an assurance programme to check the effectiveness of CPS. Although at the time of report writing the first-year review is yet to be finalised, early indicators are that the programme will offer further insight into areas of strength and where shortcomings or gaps in performance are identified. We will use them to drive improvements to how we work with our customers.
Since 2013, under the Tax Settlement Assurance Programme (TSAP), a specialist team, independent of operational casework, has reviewed a small sample of settled civil compliance cases to test whether we have met our own case quality standards and governed decisions relating to disputes correctly. This includes testing adherence to internal processes such as customer service requirements. We do this as part of our overall assurance programme to help drive continuous improvement in our management of tax disputes.
As reported last year we have, in 2021 to 2022, refocused the TSAP to enhance the assurance of our casework. The programme continues to review settled civil compliance cases to test whether we have met our own standards. The programme currently consists of testing 400 cases in 2 tranches (bi-annually) and now includes:
- focus on the governance and customer impact aspects of compliance case working, providing a more detailed understanding of this area of our casework
- a bi-annual approach of testing cases settled in the last 6 months, which retains a real time look but also allows time between review periods to address and respond to issues, as well as share best practice
- reporting outcomes at a theme level, rather than singular case outcomes, which will provide a balanced view of where we are doing well and enable targeted improvement action across our casework operation
Although this new approach limits some comparison capabilities to earlier years results, we have, where possible, compared findings for 2 financial years 2021 to 2022 and 2020 to 2021 and the results are shown below.
In 2021 to 2022, 400 settled cases were reviewed, a similar number to the 401 cases reviewed in 2020 to 2021. The cases reviewed provide solid evidence of casework compliance across each directorate and tax regime. Internal Audit has positively validated the Assurance Team’s methodology and results.
We set high standards for governance, quality and professionalism of our compliance casework and the binary scoring system dictates what cases met or did not meet all of our standards. By breaking down results into themes we are able to determine areas of strength and direct continuous improvement activity.
We test 7 standards in 400 cases and 85% of the standards were fully met. The chart below shows themed result averages with a comparison to the year 2020 to 2021. Themes represent the life cycle of a case, including financial impact for the customer and HMRC to fulfil enquiry obligations. We were then able to take an average across all themes to provide a composite indicator. The comparison to 2020 to 2021 shows improvements across several themes and overall performance.
Figure 27: Summary of theme scoring for 2020 to 2021 and 2021 to 2022
The exceptions to our standards are spread through the cases:
- 29% (116/400) of the cases reviewed met or exceeded all our required governance and quality standards
- 63.5% (254/400) fell short of our governance and quality standards, with no financial impact on the customer
- 7.5% (30/400) fell short of our governance and quality standards with a financial impact. Of the 30 cases, 7 were identified where the taxpayer had paid too much tax. Corrective activity has since been instigated and we check to ensure appropriate actions are completed
- Of the 284 cases that fell short of our standards 106 (37%) had only one identified error across all areas tested
The following table provides a comparison of results across the 2 years.
Table 26: Two-year annual comparison of TSAP findings
| 2021-22 | 2020-21 | |
|---|---|---|
| No. of cases | 400 | 401 (note 1) |
| Met or exceeded | 29% (116 cases) | 36% (146 cases) |
| Fell short | 63.5% (254 cases) | 54% (215 cases) |
| Fell short with a financial impact | 7.5% (30 cases) | 10% (40 cases) |
Note 1: Only includes settlements up to September 2020.
In addition to settlement authorisations, a small number of the largest risks require governance at one of the dispute resolution boards (the remits of the DRBs are summarised in the relevant section of the TAC report). The TSAP monitors whether cases have been decided through the correct governance board, and where cases do not require a referral to a formal case governance board, ensure the settlement was authorised at the appropriate level. For 2021 to 2022 our checks have revealed a marked improvement in both settlement authorisation and governance procedures.
The following table provides a comparison of results across the 2 years.
Table 27: Two-year annual comparison of governance and authorisation
| Year | 2021-22 | 2020-21 |
|---|---|---|
| Settlement authorised at appropriate level | 97% (222 out of 229 cases) | 87% (215 out of 248 cases) |
| Correct governance followed, where required | 100% (9 out of 9 cases) | 83% (10 out of 12 cases) |
The themes that we quality assure often matter less to our customers than to HMRC. There is an overall downturn in cases meeting all our standards but the total number of standards being met is better, especially in customer financial impact, settlement authorisation and case progression. There is room for improvement. In 2021 to 2022 we introduced dedicated improvement actions which we expect to bear fruit in 2022 to 2023.
Staff and remuneration report
This report provides details on the size of our workforce and the cost of our staff and leadership team.
Staff numbers
HMRC’s departmental group – including RCDTS Ltd and the VOA – had 67,085 full-time equivalent (FTE) employees at the end of financial year 2021 to 2022. This included 62,709 in HMRC, 736 in RCDTS Ltd and 3,640 in VOA (All figures exclude Contingent Labour which was 3,136 for HMRC/RCDTS Ltd and 140 for VOA as of 31 March 2022).
Table 28 below gives the average number of FTE for 2021 to 2022:
Table 28: Average number of full-time equivalent persons employed
| Operational permanently employed staff | Capital permanently employed staff (note 1) | Operational others | Capital others (note 2) | 2021-22 Total | 2020-21 Total | |
|---|---|---|---|---|---|---|
| Core department | 58,462 | 739 | 194 | – | 59,395 | 57,727 |
| Valuation Office Agency | 3,242 | – | 302 | – | 3,544 | 3,231 |
| Revenue and Customs Digital Technology Services Limited | 175 | 592 | 30 | 116 | 913 | 909 |
| Departmental group total | 61,879 | 1,331 | 526 | 116 | 63,852 | 61,867 |
Note 1: Capital relates to staff building capital assets.
COVID-19 and UK Transition redeployments
In 2020 to 2021, we redeployed a significant number of our colleagues to deliver the government’s response to the COVID-19 pandemic. At the start of the 2021 to 2022 financial year we had around 4,200 FTE employees deployed on COVID-19 related activity. As COVID-19 queries and support schemes came to an end, the demand for resource reduced and a large proportion of colleagues returned to their original business areas with temporary employees being released. This number has continued to reduce to reach around 1,900 FTE in March 2022. In 2022 to 2023 we will retain a core team for compliance activity (as agreed by the Exchequer) and to support the upcoming COVID-19 Public Inquiry.
By the end of 2021 to 2022, we had around 5,900 FTE employees funded to support the UK’s transition from the EU. These comprised around 5,000 full-time HMRC employees and around 900 FTE contractors and temporary employees who were directly recruited to support UK Transition work.
Recruitment
This year we recruited 10,844 full-time equivalent roles to ensure we have the skills we need in our key strategic locations. This included 10,139 in HMRC, 65 in RCDTS Ltd and 640 in VOA. We recruited 1,992 FTE from other government departments.
Leavers and exits
In 2021 to 2022, 4,496 full-time equivalent employees left HMRC’s departmental group through natural wastage, where they chose to resign or retire, which includes transfers to other government departments. This included 4,182 (turnover 7%) in HMRC, 100 (turnover 13%) in RCDTS Ltd and 214 (turnover 6%) in VOA.
Our workforce across the UK
We employ thousands of people across the UK, with new regional centres in cities like Edinburgh, Glasgow, Cardiff and Belfast providing high quality jobs with excellent long-term career prospects.
Our workforce (by nation)
| Region | Percentage of workforce | Head count | Comments |
|---|---|---|---|
| England | 78.7% | c49,420 FTE | This compares to the 84% of the UK’s population who live in England. |
| Scotland | 11.2% | c7,000 FTE | This is significantly higher than the 8% of the UK’s population who live in Scotland. |
| Wales | 6.5% | c4,080 FTE | This is higher than the 5% of the UK’s population who live in Wales. |
| Northern Ireland | 3.6% | c2,250 FTE | This is consistent with Northern Ireland having 3% of the UK population. |
For more information on devolution and the Union, please see the Working with devolved governments section.
For more information on our locations programme, please see the A great environment section.
Our workforce in England (by region)
| Region | % |
|---|---|
| East | 2 |
| London | 13.8 |
| East Midlands | 6.3 |
| West Midlands | 6.8 |
| North East | 15.8 |
| North West | 21.1 |
| South/South East | 3 |
| South West | 2.2 |
| Yorkshire and Humber | 7.7 |
Staff costs
Table 29: The costs of persons employed during the year (£m)
| Permanently employed staff | Others | 2021-22 Total | 2020-21 Total | |
|---|---|---|---|---|
| Wages and salaries | 2,185.4 | 16.8 | 2,202.2 | 2,064.9 |
| Social security costs (note 1) | 221.2 | 1.0 | 222.2 | 199.8 |
| Other pension costs | 559.0 | 3.1 | 562.1 | 511.2 |
| Sub Total | 2,965.6 | 20.9 | 2,986.5 | 2,775.9 |
| Less recoveries in respect of outward secondments | (2.7) | – | (2.7) | (2.5) |
| Total net costs | 2,962.9 | 20.9 | 2,983.8 | 2,773.4 |
Note 1: Social security costs include the Apprenticeship Levy which is £10.9 million for 2021 to 2022 (2020 to 2021: £9.9 million).
Reconciliation to staff costs in the Resource Account
In the Resource Accounts staff costs do not include recoveries in respect of secondments, which are included in income or the amount charged to capital where they relate to the building of capital assets.
Table 30: Reconciliation to staff costs in the Resource Account
| 2021-22 Total (£m) | 2020-21 Total (£m) | |
|---|---|---|
| Total net costs | 2,983.8 | 2,773.4 |
| Recoveries in respect of outward secondments | 2.7 | 2.5 |
| Less net costs charged to capital budgets | (51.6) | (38.8) |
| Sub-total | 2,934.9 | 2,737.1 |
| Travel, subsistence and hospitality | 16.5 | 13.3 |
| Recruitment and training | 26.5 | 23.1 |
| Early severance schemes | 4.0 | 4.8 |
| Staff and related costs in Consolidated Statement of Comprehensive Net Expenditure (CSoCNE) | 2,981.9 | 2,778.3 |
We want HMRC to be inclusive, respectful, and representative of the communities we serve. Our workforce of just over 67,000 has been a vital part of the UK’s national resilience and crisis response during 2021 to 2022. Read more about our people, including diversity, wellbeing and health and safety reports in the Strategic Objective 4 section of the performance analysis section.
Civil Service Pensions
HMRC group
Pension benefits are provided through the Civil Service pension arrangements. The Principal Civil Service Pension Scheme (PCSPS) and the Civil Servant and Other Pension Scheme (CSOPS) – known as “alpha” – are unfunded multi-employer defined benefit schemes. Our share of underlying assets and liabilities are not identifiable.
The scheme actuary valued the PCSPS as at 31 March 2016. Further details can be found in the resource accounts of the Cabinet Office: Civil Superannuation
Read more on Civil Service pension arrangements at the Civil Service pension scheme website.
For 2021 to 2022, employers’ contributions of £555.8 million were payable to the PCSPS (2020 to 2021: £505.3 million) at one of four rates in the range 26.6% to 30.3% of pensionable earnings, based on salary bands.
The Scheme Actuary reviews employer contributions usually every four years following a full scheme valuation. The contribution rates are set to meet the cost of the benefits accruing during 2021 to 2022 to be paid when the member retires and not the benefits paid during this period to existing pensioners.
Pensions payable under Classic, Premium, Classic plus, Nuvos and Alpha are increased annually in line with pensions increase legislation.
Partnership Pensions
Employees can opt to open a partnership pension account, a stakeholder pension with an employer contribution. Employers’ contributions of £3.5 million (2020 to 2021: £3 million) were paid to one or more of the panel of three appointed stakeholder pension providers. Employer contributions are age-related and ranged from 8% to 14.75%. Employers also match employee contributions up to 3% of pensionable earnings. In addition, employer contributions of £0.1 million (2020 to 2021: £0.1 million), 0.5% of pensionable pay, were payable to the PCSPS to cover the cost of the future provision of lump sum benefits on death in service or ill health retirement of these employees. Contributions due to the partnership pension provider at the reporting date were nil. Contributions prepaid at that date were nil.
In 2021 to 2022, 33 individuals (2020 to 2021: 53 individuals) retired early on ill-health grounds; the total additional accrued pension liabilities in the year amounted to £0.3 million (2020 to 2021: £0.2 million).
Valuation Office Agency (note 1)
A number of the VOA’s employees are members of the Local Government Pension Scheme (LGPS). Contributions into this scheme for 2021 to 2022 were £0.6 million (2020 to 2021: £0.6 million).
Read full information about the VOA employee contributions in the VOA annual report and accounts.
Note 1: VOA only.
Revenue and Customs Digital Technology Services Ltd
RCDTS Ltd has a contract-based defined contribution pension scheme, administered by Aviva plc and overseen by the RCDTS Ltd Board. Contributions into this scheme for 2021 to 2022 were £2.4 million (2020 to 2021: £2.3 million). A number of RCDTS Ltd people have contractual rights to the PCSPS under Fair Deal policy. RCDTS Ltd has Admitted Bodies status into the scheme, managed by the Scheme Management Executive within Cabinet Office. Contributions into this scheme for 2021 to 2022 were £0.4 million (2020 to 2021: £0.5 million).
Read details of the salary and pension benefits for members of the HMRC’s ExCom in the Remuneration report for senior civil servants.
Exit packages
Redundancy and other departure costs have been paid in accordance with the provisions of the Civil Service Compensation Scheme, a statutory scheme under the Superannuation Act 1972. Exit costs are accounted for in full in the year in which the obligation becomes binding on HMRC. Where the department has agreed early retirements, those costs in excess of obligations usually met by the Civil Service Pension Scheme, are met by the department. Ill-health retirement costs are met by the pension scheme and are not included in the table.
The numbers included in the table below include departures of members of the LGPS. Their compensation arrangements are outside the scope of the Civil Service compensation scheme. The cost of early retirements reflects the excess cost of providing any payment due to the individual on retirement. In certain circumstances, it also includes the cost associated with the increase in future liability to pay pension.
Read full details about the VOA staff exit packages in the VOA annual report and accounts.
Table 31: Exit packages 2021 to 2022 (note 1)
| Exit package cost band | Number of compulsory redundancies (2021-22) | Number of compulsory redundancies (2020-21) | Number of other departures agreed (2021-22) | Number of other departures agreed (2020-21) | Total number of exit packages by cost band (2021-22) | Total number of exit packages by cost band (2020-21) |
|---|---|---|---|---|---|---|
| <£10,000 | 2 | 2 | 38 | 77 | 40 | 79 |
| £10,000 - £25,000 | 15 | 56 | 160 | 613 | 175 | 669 |
| £25,000 -£50,000 | 4 | 3 | 203 | 862 | 207 | 865 |
| £50,000 - £100,000 | – | – | 48 | 420 | 48 | 420 |
| £100,000+ | – | – | 9 | 82 | 9 | 82 |
| Total number of exit packages by type | 21 | 61 | 458 | 2,054 | 479 | 2,115 |
| Of which: | ||||||
| Core department and agency | 21 | 61 | 458 | 2,054 | 479 | 2,115 |
| Revenue and Customs Digital Technology Services Limited | – | – | – | – | – | – |
| Total number of exit packages by type | 21 | 61 | 458 | 2,054 | 479 | 2,115 |
| Total resource cost (£000s) | 332 | 917 | 13,975 | 81,339 | 14,306 | 82,256 |
| Of which: | ||||||
| Core department and agency | 332 | 917 | 13,975 | 81,339 | 14,306 | 82,256 |
| RCDTS Limited | – | – | – | – | – | – |
| Total resource cost (£000s) | 332 | 917 | 13,975 | 81,339 | 14,306 | 82,256 |
Note 1: The prior year figures in the 2020 to 2021 published account showed other departures agreed as 2,051 with a total resource cost of £80,696 thousand. These figures have been adjusted above to account for instances where individuals’ final costs changed from the original estimate after the date of submission of the accounts.
People off-payroll
HMRC has reviewed all relevant off-payroll engagements during the financial year 2021 to 2022. Where engagements have been within scope of the off-payroll (IR35) legislation, both the worker and the paying agency have been advised of this determination meaning appropriate tax deductions are made at source from payments made in respect of the engagement. We confirm that no tax liabilities have been incurred or penalties imposed due to any failure to comply with the Intermediaries (IR35) working legislation.
The tables below provide details of the off-payroll engagements for 2021-22, including those from the VOA and RCDTS Ltd. HM Treasury guidance this year means that all engagements regardless of start date between 1 April 2021 and 31 March 2022 should be included in Table 32. Previously only those that had reached six months in duration were reported, this has resulted in an increase over previous years in the numbers of engagements reported.
Table 32: Temporary off-payroll worker engagements as of 31 March 2022, earning £245 a day or greater
| HMRC | RCDTS | VOA | |
|---|---|---|---|
| Number of existing engagements as of 31 March 2022 | 496 | 84 | 5 |
| Of which: | |||
| Number that have existed for less than one year at time of reporting | 276 | 17 | 5 |
| Number that have existed for between one and two years at time of reporting | 122 | 35 | – |
| Number that have existed for between two and three years at time of reporting | 74 | 32 | – |
| Number that have existed for between three and four years at time of reporting | 24 | – | – |
| Number that have existed for four or more years at time of reporting | – | – | – |
Table 33: All temporary off-payroll workers engaged at any point during the year ended 31 March 2022, earning £245 per day or greater
| HMRC | RCDTS | VOA | |
|---|---|---|---|
| Number of off-payroll workers engaged during the year ended 31 March 2022 | 775 | 139 | 10 |
| Of which: | |||
| Not subject to off-payroll legislation | 735 | 123 | 10 |
| Subject to off-payroll legislation and determined as in-scope of IR35 (note 1) | 40 | 16 | – |
| Subject to off-payroll legislation and determined as out-of-scope of IR35 | – | – | – |
| Number of engagements reassessed for compliance or assurance purposes during the year | 618 | 83 | – |
| Of which: Number of engagements that saw a change to IR35 status following review | – | – | – |
Note 1: Include engagements through Umberella companies
Table 34: Board members and/or senior officials with significant financial responsibility, between 1 April 2021 and 31 March 2022
| HMRC | RCDTS | VOA | |
|---|---|---|---|
| Number of off-payroll engagements of board members, and/or, senior officials with significant financial responsibility, during the financial year | – | – | – |
| Total number of such individuals, including both on payroll and off-payroll engagements | 95 | – | 6 |
Consultancy and temporary employees
We use professional service providers to help with specialist work – including consultancy, contingent labour (temporary workers), legal advice, translation, interpretation and research services. Use of these is limited to occasions when we do not have the necessary skills internally, or where an independent external expert opinion on a complex issue is required.
We continue to follow Cabinet Office guidelines to reduce the use of consultancy across central government.
Expenditure on consultancy continues to be controlled robustly via commercial governance procedures and has decreased from £8.6 million (including VOA) in financial year 2020 to 2021 to £1.8 million in financial year 2021 to 2022, equating to 0.13% of our annual expenditure.
The main reason for the increases in contingent labour have been to support the HMRC response to COVID-19, UK Transition and the support of business as usual processes during this uncertain landscape.
Table 35: Consultancy and contingent labour expenditure in accordance with HM Treasury definitions (note 1)
| Consultancy 2021-22 £m | Contingent labour 2021-22 £m | Consultancy 2020-21 £m | Contingent labour 2020-21 £m | |
|---|---|---|---|---|
| HMRC | 0.9 | 170.7 | 7.5 | 82.0 |
| VOA | 0.9 | 1.7 | 1.1 | 0.5 |
| RCDTS | – | 12.6 | – | 16.1 |
Note 1: HMRC report contingent labour as part of contracted out services.
Trade Union Facility Time Allocation
HMRC and VOA continue to recognise the important role the trade unions can play in a modern workplace, and we are committed to engaging constructively with them.
We recognise the Public and Commercial Services Union (PCS) and the Association of Revenue and Customs (ARC, a specialist section of the FDA specifically for HMRC) for collective bargaining and staff representation. VOA recognises Prospect and the PCS. The arrangements follow principles in the Trade Union and Labour Relations (Consolidation) Act 1992 and codes of Practice issued by the Advisory, Conciliation and Arbitration Service (ACAS) under that legislation.
Table 36: Total number of employees who were relevant union officials during 2021 to 2022
| HMRC | VOA | |
|---|---|---|
| PCS | 843 | 6 |
| ARC | 62 | – |
| Prospect | – | 3 |
| Total | 905 | 9 |
Table 37: Percentage of time spent on facility time
| Percentage of time | Number of employees HMRC | Number of employees VOA |
|---|---|---|
| 0% | 261 | – |
| 1-50% | 637 | 8 |
| 51-99% | 6 | 1 |
| 100% | – | — |
With the continued impact of both the COVID-19 pandemic and the implementation of Pay and Contract Reform six trade union representatives from ARC and PCS have spent more than 50% of their time on trade union duties. This figure includes the two trade union presidents.
This exception to the Cabinet Office framework was agreed to support the critical and continuous role of the trade unions in working collaboratively with HMRC both on the impact of COVID-19, and in the implementation of Pay and Contract Reform.
VOA granted extra facility time for one trade union representatives due to the continuous demands in relation to the COVID-19 pandemic.
Facility time has been reviewed on a regular and individual basis and extended only where the needs of the business required this level of trade union engagement to continue.
All exceptions to the 50% limit for trade union duties and activities was agreed and signed off by Jim Harra in his role as HMRC Permanent Secretary.
The percentage of the total paybill spent on facility time, calculated as (total cost of facility time / total pay) x 100 is 0.068%.
In accordance with the Cabinet Office’s facility time framework, this figure includes all paid time off for union work, comprising general representative duties, national official duties, safety representative duties, union learning representative duties, and union training.
Paid trade union activities
Of the total paid facility time hours worked by relevant trade union officials during 2021 to 2022, none were spent on paid trade union activities.
Further disclosure required for the Trade Union (Facility Time Publication Requirements) Regulations 2017 will be submitted by 31 July 2022 on the Public-sector trade union facility time data page of GOV.UK.
Remuneration report for senior civil servants
This report contains information about HMRC’s senior employees and covers our policies on salaries, bonuses and benefits in kind, as well as on performance assessment and contract termination.
Remuneration policy
The SCS comprises senior leaders employed across government, with a common framework of terms and conditions. SCS pay and conditions are not delegated to individual departments. Our SCS performance management system is governed by the Cabinet Office. Recommendations on SCS pay are provided by the independent Review Body on Senior Salaries in an annual report to the Prime Minister. The government responds to its recommendations, and the Cabinet Office sets out the approach departments must follow in SCS pay guidance. In line with Cabinet Office guidance, SCS pay and non-consolidated awards at HMRC are then decided by the department’s Remuneration Committee.
Senior Civil Service (SCS) employee numbers and approved posts
As of the 31 March 2022 we had 537 SCS employees. The total number of SCS posts (as opposed to individual employees) was 556.
Table 38: HMRC and VOA Senior Civil Service (SCS) employee and post numbers (note 1)
| HMRC | VOA | Total | |
|---|---|---|---|
| SCS employee numbers | 515 | 22 | 537 |
| SCS posts | 535 | 21 | 556 |
Note 1: There are a number of reasons for the difference between figures for posts and people. For example, some posts are currently vacant, some people fill a post through job sharing while others may be on maternity leave or special leave.
Table 39: HMRC Senior Civil Service (SCS) employee numbers comparison
| Number at 31 March 2022 | Number at 31 March 2021 | Percentage change | |
|---|---|---|---|
| Permanent Secretary | 2 | 2 | 0% |
| SCS3 | 11 | 10 | 10% increase |
| SCS2 | 65 | 62 | 5% increase |
| SCS1 | 416 | 399 | 4% increase |
| On loan/secondment | 21 | 20 | 5% increase |
| Total | 515 | 493 | 4% increase |
SCS structure and recruitment
There are 3 levels of senior civil servant below the posts of Permanent Secretary: Director General, Director and Deputy Director. These are underpinned by a job evaluation which assesses the demands of a job and determines the relatives between one role and another.
A total of 115 HMRC and VOA SCS posts were advertised last year. Qualified individuals from both within and outside the Civil Service were appointed through level moves and promotions.
Remuneration Committee
Our Remuneration Committee, which represents HMRC and the VOA comprises: the Chief Executive (First Permanent Secretary), the Deputy Chief Executive (Second Permanent Secretary), all directors general and an independent observer. It signs off overall departmental performance group allocations for deputy directors and directors.
The performance of deputy directors and directors is moderated by directors general and for the latter, also by the Remuneration Committee. Performance of directors general is moderated by permanent secretaries with advice from an independent observer; with performance and award arrangements for permanent secretaries managed by Cabinet Office.
Pay awards
Due to the global impact of COVID-19, 2020 to 2021 and 2021 to 2022 have been unprecedented and challenging years for the Civil Service, wider public sector, and the country as a whole. At the Spending Review, the Chancellor announced a temporary pay pause for the majority of the public sector, including the SCS for 2021 to 2022.
This meant that for 2021 to 2022, HMRC implemented the following elements as set out in the Cabinet Office guidance:
- no consolidated salary increases in alignment with the public sector pay pause
- end of year non-consolidated performance bonuses for Top performing colleagues paid as usual for the 2020 to 2021 performance year
- in-year non-consolidated performance bonuses for exceptional performance during 2020 to 2021 to colleagues in accordance with the criteria set out in the Cabinet Office guidance
Base pay awards were paid to all performers.
Non-consolidated performance awards
Exceptional delivery of performance against objectives is rewarded through non-consolidated end-of-year and in-year performance awards. In line with Cabinet Office guidance, non-consolidated end-of-year and in-year performance awards are funded from an agreed allocation of 3.3% of the SCS basic paybill and subject to a pay control limit of £17,500:
- awards of £6,000 (SCS1), £9,000 (SCS2) and £12,000 (SCS3) were paid to 140 ‘Top’ performers due on 1 April 2021, for performance from April 2020 to March 2021
- in-year awards ranging from £250 to £5,000 were paid to 213 SCS members based on performance from April 2021 to March 2022
Awards that are above and beyond the control limit of £17,500 limit are agreed in non-standard contracts, in line with the HM Treasury senior pay approval process. Non-consolidated performance award decisions are monitored to guard against bias or discrimination.
Policy on notice periods and termination payments
We follow standard policy for SCS notice periods and termination payments in the Civil Service management code.
Service contracts
There is a legal requirement that all Civil Service appointments must be made on merit, and on the basis of fair and open competition. Recruitment principles published by the Civil Service Commission explain the limited circumstances when other appointments can be made. Executive members hold open-ended appointments, unless otherwise stated in the remuneration tables. Early termination, other than for misconduct, would result in the individual receiving compensation as set out in the Civil Service compensation scheme. No compensation payments were made to those in the remuneration report during 2021 to 2022.
Read Civil Service Commission recruitment principles for more information.
Executive Committee (ExCom) and non-executive members remuneration and pension benefits
The following table provides details of the service contracts, salaries and pension entitlements of the department’s most senior officials. Where there is no end date of term, it means their appointment is on a permanent basis.
Details are shown for each individual, including those who have held more than one role in the year, by their current or last held role. Where service on ExCom has included more than one role, the title and full-year equivalent of the latest role is disclosed.
Pension figures show pension earned in PCSPS or CSOPS (Alpha) as appropriate. Where the official has benefits in both PCSPS and Alpha the figure is the combined value of benefits in the 2 schemes – but note part of the pension may be payable from different ages. The accrued pension is the pension the member is entitled to receive when they reach pension age, or immediately on ceasing to be an active member of the scheme if they are already at or over pension age.
Table 40: Senior officials’ single total figure of remuneration and pension benefits
| Senior officials | Salary (full year equivalent) (£000) 2021-22 | Salary (full year equivalent) (£000) 2020-21 | Bonus payments (£000) 2021-22 | Bonus payments (£000) 2020-21 | Benefits in kind (to the nearest £100) 2021-22 | Benefits in kind (to the nearest £100) 2020-21 | Pension benefits (to the nearest £000) 2021-22 | Pension benefits (to the nearest £000) 2020-21 | Total (£000) 2021-22 | Total (£000) 2020-21 | Pension scheme | Accrued annual pension at pension age and related lump sum (£000) as at 31 March 2022 (note 6) | Real increase in pension and related lump sum at pension age (£000) | Cash Equivalent Transfer Value (CETV) (to the nearest £000) as at 31 March 2022 (note 6) | Cash Equivalent Transfer Value (CETV) (to the nearest £000) as at 31 March 2021 (note 7) | Cash Equivalent Transfer Value (CETV) (to the nearest £000) Real increase | Employer contribution to partnership pension account (to the nearest £100) |
|---|---|---|---|---|---|---|---|---|---|---|---|---|---|---|---|---|---|
| Jim Harra, Chief Executive and Permanent Secretary (from 1 Oct 2019), member of ExCom from 16 Apr 2012 | 180-185 | 180-185 | 15-20 | 15-20 | – | – | – | – | 200-205 | 200-205 | Partnership Pension Account from 1 Nov 2018 | – | – | – | – | – | 27,100 |
| Angela MacDonald, Second Permanent Secretary (from 1 Aug 2020), member of ExCom from 7 Aug 2017 | 145-150 | 150-155 | – | 10-15 | – | – | 59 | 57 | 205-210 | 215-220 | Alpha | 35-40 | 2.5-5 | 481 | 428 | 32 | – |
| Penny Ciniewicz, Director General Customer Compliance (from 4 Sep 2017), member of ExCom from 20 Jul 2015 | 140-145 | 140-145 | – | – | – | – | 82 | 59 | 145-150 | 200-205 | Alpha | 45-50 Lump sum 115-120 | 0-2.5 Lump sum 0 | 1,040 (note 1) | 984 | -5 | – |
| Sophie Dean, Director General Borders and Trade, member of ExCom from 2 Dec 2019 | 90-95 (note 2) | 85-90 (note 2) | 5-10 | 5-10 | – | – | 26 | 102 | 125-130 | 200-205 | Alpha | 30-35 | 0-2.5 | 453 | 417 | 10 | – |
| Katherine Green, Director General Borders and Trade, member of ExCom from 2 Dec 2019 | 90-95 (note 2) | 85-90 (note 2) | 5-10 | 5-10 | – | – | 22 | 114 | 120-125 | 210-215 | Alpha | 30-35 Lump sum 55-60 | 0-2.5 Lump sum 0 | 480 | 446 | 7 | – |
| Alan Evans, General Counsel and Solicitor, member of ExCom from 1 Jan 2019 | 140-145 | 140-145 | 10-15 | – | – | – | 28 | 63 | 180-185 | 200-205 | Alpha | 70-75 | 0-2.5 | 1,255 | 1,173 | 8 | – |
| Justin Holliday, Chief Finance Officer, member of ExCom from 9 Mar 2015 | 165-170 | 165-170 | 0-5 | 0-5 | – | – | 40 | 85 | 210-215 | 250-255 | Alpha | 80-85 | 2.5-5 | 1,296 | 1,210 | 14 | – |
| Myrtle Lloyd, Director General Customer Services, member of ExCom from 22 Feb 2021 | 120-125 | 10-15 (125-130) | – | – | – | – | 89 | 5 | 210-215 | 15-20 | Alpha | 40-45 | 2.5-5 | 653 | 557 | 61 | – |
| Joanna Rowland, Director General Transformation, member of ExCom from 7 Aug 2020 | 125-130 | 80-85 (125-130) | 10-15 | 10-15 | – | – | 51 | 33 | 190-195 | 130-135 | Alpha | 40-45 | 2.5-5 | 513 | 461 (note 8) | 24 | – |
| Daljit Rehal, Chief Digital and Information Officer, member of ExCom from 14 Sep 2020 | 195-200 | 105-110 (200-205) | 35-40 | – | – | – | 77 | 42 | 315-320 | 150-155 | Alpha | 5-10 | 2.5-5 | 100 | 35 | 49 | – |
| Jonathan Russell, Chief Executive of the Valuation Office Agency, member of ExCom from 7 Sep 2020 | 115-120 | 70-75 (115-120) (note 3) | 5-10 | 5-10 | – | – | – | – | 125-130 | 80-85 | Partnership Pension Account | – | – | – | – | – | 21,300 |
| Ruth Stanier, Director General Customer Strategy and Tax Design, member of ExCom from 18 Jul 2018 to 18 Jul 2021 (note 4) | 40-45 (140-145) | 135-140 | – | – | – | – | 9 | 56 | 50-55 | 190-195 | Alpha | 55-60 | 0-2.5 | 929 | 895 | 2 | – |
| Esther Wallington, Chief People Officer, member of ExCom from 1 Dec 2016 | 125-130 (note 5) | 120-125 (note 5) | – | – | – | – | 49 | 48 | 170-175 | 170-175 | Alpha | 30-35 | 2.5-5 | 384 | 342 | 23 | – |
| Jonathan Athow, Director General Customer Strategy and Tax Design, member of ExCom from 4 Oct 2021 | 60-65 (125-130) | – | – | – | – | – | -12 | – | 45-50 | – | Alpha | 50-55 | 0 | 796 | – | -12 | – |
Note 1: Opted out of pension scheme.
Note 2: The full-time equivalent salary is £125,000-£130,000 (2020 to 2021 £125,000-£130,000). Sophie Dean and Katherine Green job share, working part-time hours (0.7 FTE each).
Note 3: The salary for Jonathan Russell disclosed in HMRC’s 2020 to 2021 Annual Report and Accounts included an element of backdated salary, resulting in the banding for that year being higher than in 2021 to 2022.
Note 4: Left the department on a 12-month career break.
Note 5: The full-time equivalent salary is £140,000-£145,000 (2020 to 2021: £135,000-£140,000). Esther works part-time hours 0.9 FTE.
Note 6: Unless stated otherwise, values reported are as at 31 March 2022 or the date the individual ceased to be a member of ExCom where earlier.
Note 7: Unless stated otherwise, values reported are as at 31 March 2021 or the day before the individual was appointed to ExCom where later.
Note 8: The prior year CETV figure has been recalculated due to a retrospective update to service history.
Explanatory notes for tables 40 and 41
Salary
Salary covers both pensionable and non-pensionable amounts and includes gross salary, overtime, recruitment and retention allowances, reserved rights to other allowances and any other allowance that it is subject to UK taxation.
Bonus payments
Bonus payments are paid while serving on ExCom for exceptional work in the performance year. Year-end performance awards are based on performance achieved in post(s) held in the previous year and are made as part of the performance and pay award process. Bonus payments are considered non-consolidated pay awards.
Benefits in kind
The monetary value of benefits in kind covers any benefits provided by HMRC and treated as taxable, such as hospitality provided at external development events.
Pension benefits
Pension Benefits accrued during the reporting period are calculated as follows:
Real increase in pension x 20
add Real increase in any lump sum
less Contributions made by the individual
= The value of pension benefits accrued during the period
The real increases exclude increases due to inflation or any increases or decreases due to transfer of pension rights. The value of pension benefits can vary year to year due to factors which include the date an individual joined or left, an individual receiving a higher pay increase in one year to another.
Cash equivalent transfer values
The CETV is the actuarially assessed capitalised value of the pension scheme benefits accrued by a member at a point in time. The benefits valued are the member’s accrued benefits and any contingent spouse’s pension payable from the scheme. A CETV payment is made by a pension scheme (or arrangement) when a member leaves a scheme and chooses to transfer the pension benefit they have accrued in that scheme to secure pension benefits in another pension scheme (or arrangement).
The value shown relates to the benefits the individual has accrued because of their membership of the pension scheme, not just their service in a senior capacity. CETVs are calculated in accordance with the Occupational Pension Schemes (Transfer Values) (Amendment) Regulations 2008 and do not take account of any actual or potential reduction to benefits resulting from Lifetime Allowance Tax, which may be due when pension benefits are taken.
Real increase in CETV
This reflects the increase in CETV that is funded by the employer. It does not include the increase in accrued pension due to inflation, contributions paid by the employee (including the value of any benefits transferred from another pension scheme or arrangement) and uses common market valuation factors for the start and end of the period.
Non-executive directors single total figure of remuneration
The fees of the external appointees, which include any other allowance that is subject to UK taxation, are detailed below. Non-executive members are appointed for a fixed term of usually 3 years.
Table 41: Non-executive directors single total figure of remuneration
| Fees (full year equivalent) (£000) 2021-22 | Fees (full year equivalent) (£000) 2020-21 | Benefits in kind (to the nearest £100), 2021-22 | Benefits in kind (to the nearest £100), 2020-21 | Total (£000), 2021-22 | Total (£000), 2020-21 | |
|---|---|---|---|---|---|---|
| Dame Jayne-Anne Gadhia, Lead non-executive and Chair of the Board, 1 Jan 2021 – 31 Dec 2023 | 25-30 | 5-10 (25-30) | – | – | 25-30 | 5-10 |
| David Cooper, 10 May 2021 – 09 May 2024 | 15-20 (15-20) | – | – | – | 15-20 | – |
| Patricia Gallan, 15 Jul 2019 – 14 Jul 2022 | 20-25 | 15-20 | – | – | 20-25 | 15-20 |
| Michael Hearty, 15 Jul 2019 – 14 Jul 2022 | 25-30 | 20-25 | – | – | 25-30 | 20-25 |
| Alice Maynard (note 1), 1 Jul 2016 – 30 Jun 2022 | 25-30 | 25-30 | – | – | 25-30 | 25-30 |
| Paul Morton, 15 Jul 2019 – 14 Jul 2022 | 15-20 | 15-20 | – | – | 15-20 | 15-20 |
| Juliette Scott, 21 Nov 2017 – 22 Nov 2023 | 20-25 | 20-25 | – | – | 20-25 | 20-25 |
| Elizabeth Fullerton-Rome, 13 Jun 2018 – 12 Jun 2024 | 15-20 | 15-20 | – | – | 15-20 | 15-20 |
| Thomas Taylor, 13 Jun 2018 – 12 Jun 2024 | 15-20 | 15-20 | – | – | 15-20 | 15-20 |
Note 1: Fees incorporate the cost of a support worker as a reasonable adjustment under the Equality Act 2010.
Fair pay
Reporting bodies are required to disclose the relationship between the remuneration of the highest-paid director in their organisation and the lower quartile, median and upper quartile remuneration of the organisation’s workforce.
The banded remuneration of the highest-paid director in HMRC and VOA in the financial year 2021 to 2022 was £235,000 – £240,000 (2020 to 2021, £525,000 – £530,000). Please see Table 40 Senior officials’ single total figure of remuneration and pension benefits for more information. This was 7.7 times (2020 to 2021, 19.1) the median remuneration of the workforce, which was £30,751 (2020 to 2021, £27,565).
In 2020 to 2021 and 2021 to 2022 no employees received remuneration in excess of the highest paid director. Remuneration ranged from £21,249 to £240,000 (2020 to 2021 £19,500 – £530,000)
Total remuneration includes salary, non-consolidated performance-related pay and benefits-in-kind. It does not include severance payments, employer pension contributions and the cash equivalent transfer value of pensions.
Table 42a: Pay ratio/values
| 25th percentile pay ratio | Median pay ratio | 75th percentile pay ratio | |
|---|---|---|---|
| 2021-22 | 10.75 | 7.72 | 5.91 |
| 2020-21 | 24.6 | 19.14 | 14.59 |
Table 42b: Total pay and benefits and salary component for the employees at the 25th percentile, median and 75th percentile
| 25th percentile pay ratio, Total pay and benefits | 25th percentile pay ratio, Salary component | Median pay ratio, Total pay and benefits | Median pay ratio, Salary component | 75th percentile pay ratio, Total pay and benefits | 75th percentile pay ratio, Salary component | |
|---|---|---|---|---|---|---|
| 2021-22 | £22,084 | £22,084 | £30,751 | £30,751 | £40,175 | £40,175 |
| 2020-21 | £21,441 | £21,441 | £27,565 | £27,565 | £36,159 | £36,159 |
In 2021 to 2022 there was a change in the highest paid director. In 2020 to 2021 the highest paid director was engaged on a temporary fee-paid basis until a permanent appointment was made under Civil Service recruitment rules. For more information see the Fair Pay section of the 2020 to 2021 HMRC Annual Report and Accounts. As a result of this change the total remuneration for the highest paid director reduced by 55% (see table 42c) from £525,000 – £530,000 to £235,000 – £240,000.
The increase in employee remuneration for 2021 to 2022 largely results from Pay and Contract Reform. This, together with a reduction in the highest paid director remuneration in 2021 to 2022, has contributed to the significant decrease in the pay ratios. See Table 42a Pay ratio/values for more information.
Table 42c: Annual percentage change in remuneration of directors and employees
| Percentage change from prior year | Salary and allowances | Performance pay and bonuses payable | Total remuneration | |
|---|---|---|---|---|
| 2020-21 / 2021-22 | Highest paid director | -63% | N/A (note 1) | -55% |
| Employees | 7% | -85% (note 2) | 7% |
Note 1: The highest paid Director in 2020 to 2021 did not receive any performance pay or bonus payment.
Note 2: As part of reforms agreed for HMRC’s pay, terms and conditions for colleagues in grades AA-6, in-year performance bonuses ceased to apply.
The table above shows the percentage change in both the highest paid director and employees salary and allowances, performance pay and bonuses payable and non-cash benefits between 2020 to 2021 and 2021 to 2022.
Jim Harra
Accounting Officer
6 July 2022
Parliamentary accountability
Consolidated Statement of Outturn Against Parliamentary Supply (SOPS)
In addition to the primary statements prepared under International Financial Reporting Standards (IFRS), the FReM requires us to prepare a Statement of Outturn against Parliamentary Supply (SOPS) and supporting notes.
The SOPS is a key accountability statement that shows, in detail, how an entity has spent against their Supply Estimate. Supply is the monetary provision (for resource and capital purposes) and cash (drawn primarily from the Consolidated fund), that Parliament gives statutory authority for entities to utilise. The Estimate details supply and is voted on by Parliament at the start of the financial year.
Should an entity exceed the limits set by their Supply Estimate, called control limits, their accounts will receive a qualified opinion.
The format of the SOPS mirrors the Supply Estimates, published on GOV.UK, to enable comparability between what Parliament approves and the final outturn.
The SOPS contain a summary table, detailing performance against the control limits that Parliament have voted on, cash spent (budgets are compiled on an accruals basis and so outturn will not exactly tie to cash spent) and administration.
The supporting notes detail the following: outturn by Estimate line, providing a more detailed breakdown (note 1); a reconciliation of outturn to net operating expenditure in CSoCNE, to tie the SOPS to the financial statements (note 2); a reconciliation of outturn to net cash requirement (note 3); and an analysis of income payable to the Consolidated Fund (note 4).
The figures in the areas highlighted within table 43 are voted totals which are subject to Parliamentary control. Although not a separate voted limit, any breach of our administration budget will also result in an excess vote.
Table 43: Summary of Resource and Capital outturn
| SOPS note | Estimate Voted | Estimate Non-voted | Estimate Total | Outturn Voted | Outturn Non-voted | Outturn Total | 2021-22 £000 Voted variance: saving | 2020-21 £000 Total Outturn | |
|---|---|---|---|---|---|---|---|---|---|
| Departmental Expenditure Limit | |||||||||
| – Resource | 1.1 | 5,779,355 | 244,626 | 6,023,981 | 5,465,401 | 251,344 | 5,716,745 | 313,954 | 4,795,291 |
| – Capital | 1.2 | 738,064 | – | 738,064 | 664,529 | – | 664,529 | 73,535 | 536,576 |
| Annually Managed Expenditure | |||||||||
| – Resource | 1.1 | 32,098,963 | 26,970,160 | 59,069,123 | 29,017,062 | 22,302,083 | 51,319,145 | 3,081,901 | 119,308,829 |
| – Capital | 1.2 | 10 | – | 10 | 7 | – | 7 | 3 | 4 |
| Total budget | 38,616,392 | 27,214,786 | 65,831,178 | 35,146,999 | 22,553,427 | 57,700,426 | 3,469,393 | 124,640,700 | |
| Of which: | |||||||||
| Total Resource | 1.1 | 37,878,318 | 27,214,786 | 65,093,104 | 34,482,463 | 22,553,427 | 57,035,890 | 3,395,855 | 124,104,120 |
| Total Capital | 1.2 | 738,074 | – | 738,074 | 664,536 | – | 664,536 | 73,538 | 536,580 |
| Total | 38,616,392 | 27,214,786 | 65,831,178 | 35,146,999 | 22,553,427 | 57,700,426 | 3,469,393 | 124,640,700 | |
| Net Cash Requirement | 3 | 43,489,926 | 37,363,662 | 6,126,264 | 96,085,805 | ||||
| Administration costs | 984,619 | 884,711 | 99,908 | 946,960 |
Explanations of material variances between the Estimate and outturn are provided in SOPS note 1. A reconciliation of total resource outturn to the Statement of Comprehensive Net Expenditure is provided in SOPS note 2.
Notes to the Statement of Outturn against Parliamentary Supply
SOPS 1. Outturn detail, by Estimate Line
We are required to ensure that our expenditure remains within the voted limits set by Parliament. This note provides details of how we performed against each line of the Estimate.
Voted expenditure includes the costs of running HMRC as well as COVID-19 support scheme payments, also, payments to individuals for social benefits and payments in lieu of tax relief. It also includes certain rates payments, shown as line L (2020 to 2021 line J), made by the VOA. RCDTS Ltd expenditure and income is included within lines A and B as appropriate.
HMRC also makes payments for which the funding is not subject to the vote system. This non-voted expenditure mainly relates to personal tax credits, other reliefs including certain corporation tax reliefs and our costs related to the National Insurance Fund.
HM Treasury requires us to further analyse our income and expenditure between administration, which relates to running the department (for example: human resources, finance, estates management) and programme, which relates to delivering our frontline services (for example: parts of HMRC that interact directly with our customers).
The following tables record our actual outturn expenditure for Departmental Expenditure Limit (DEL) and Annually Managed Expenditure (AME), voted and non-voted, against the limits set by Parliament for each line of the Estimate. SOPS 1.1 (table 44) provides analysis of resource expenditure and SOPS 1.2 (table 45) capital expenditure.
Full information about the VOA activities can be found within their accounts viewed at the Valuation Office Agency page on GOV.UK.
SOPS 1.1 Analysis of resource outturn by Estimate line
Table 44: Analysis of resource outturn by Estimate line
| Estimate Net Total (2021-22 £000) | Estimate Administration Gross (2021-22 £000) | Estimate Administration Income (2021-22 £000) | Estimate Administration Net (2021-22 £000) | Outturn Programme Gross (2021-22 £000) | Outturn Programme Income (2021-22 £000) | Outturn Programme Net (2021-22 £000) | Outturn Net Total (2021-22 £000) | Variance: saving/ (excess) (2021-22 £000) | Outturn Total (2020-21 £000) | |
|---|---|---|---|---|---|---|---|---|---|---|
| Spending in Departmental Expenditure Limit | ||||||||||
| Voted: | ||||||||||
| A HMRC administration | 4,781,684 | 925,144 | (96,463) | 828,681 | 3,896,804 | (154,643) | 3,742,161 | 4,570,842 | 210,842 | 4,335,323 |
| B VOA administration | 173,935 | – | – | – | 179,510 | (35,515) | 143,995 | 143,995 | 29,940 | 141,100 |
| C Utilised provisions | 52,736 | – | – | – | 31,502 | – | 31,502 | 31,502 | 21,234 | 96,219 |
| D COVID-19 | 771,000 | – | – | – | 719,062 | – | 719,062 | 719,062 | 51,938 | – |
| Total voted | 5,779,355 | 925,144 | (96,463) | 828,681 | 4,826,878 | (190,158) | 4,636,720 | 5,465,401 | 313,954 | 4,572,642 |
| Non-voted: | ||||||||||
| E National Insurance Fund | 244,626 | 56,030 | – | 56,030 | 195,314 | – | 195,314 | 251,344 | (6,718) | 222,649 |
| Total non-voted | 244,626 | 56,030 | – | 56,030 | 195,314 | – | 195,314 | 251,344 | (6,718) | 222,649 |
| Total spending in Departmental Expenditure Limit | 6,023,981 | 981,174 | (96,463) | 884,711 | 5,022,192 | (190,158) | 4,832,034 | 5,716,745 | 307,236 | 4,795,291 |
| Spending in Annually Managed Expenditure | ||||||||||
| Voted: | ||||||||||
| F Child Benefit | 11,932,223 | – | – | – | 11,420,034 | – | 11,420,034 | 11,420,034 | 512,189 | 11,541,713 |
| G Tax-Free Childcare | 421,275 | – | – | – | 428,406 | – | 428,406 | 428,406 | (7,131) | 253,047 |
| H Providing payments in lieu of tax relief to certain bodies | 130,061 | – | – | – | 130,003 | – | 130,003 | 130,003 | 58 | 140,071 |
| I Lifetime ISA | 546,325 | – | – | – | 418,943 | – | 418,943 | 418,943 | 127,382 | 346,120 |
| J Help to Save (note 1) | 29,725 | – | – | – | 20,361 | – | 20,361 | 20,361 | 9,364 | – |
| K HMRC administration | 36,000 | – | – | – | 8,072 | – | 8,072 | 8,072 | 27,928 | 52,212 |
| L VOA payments of Local Authority rates | 78,000 | – | – | – | 82,473 | (4,412) | 78,061 | 78,061 | (61) | 75,646 |
| M VOA administration | 2,000 | – | – | – | 1,010 | – | 1,010 | 1,010 | 990 | 1,184 |
| N Utilised provisions | (52,746) | – | – | – | (31,510) | – | (31,510) | (31,510) | (21,236) | (96,223) |
| O COVID-19 | 18,976,100 | – | – | – | 16,543,682 | – | 16,543,682 | 16,543,682 | 2,432,418 | 81,233,264 |
| Total voted | 32,098,963 | – | – | – | 29,021,474 | (4,412) | 29,017,062 | 29,017,062 | 3,081,901 | 93,547,034 |
| Non-voted: | ||||||||||
| P Personal tax credits | 13,214,009 | – | – | – | 10,605,482 | – | 10,605,482 | 10,605,482 | 2,608,527 | 15,063,222 |
| Q Other reliefs and allowances | 13,756,151 | – | – | – | 11,696,601 | – | 11,696,601 | 11,696,601 | 2,059,550 | 10,698,573 |
| Total non-voted | 26,970,160 | – | – | – | 22,302,083 | – | 22,302,083 | 22,302,083 | 4,668,077 | 25,761,795 |
| Total spending in Annually Managed Expenditure | 59,069,123 | – | – | – | 51,323,557 | (4,412) | 51,319,145 | 51,319,145 | 7,749,978 | 119,308,829 |
| Non-budget spending | ||||||||||
| Voted: | ||||||||||
| Total voted | 37,878,318 | 925,144 | (96,463) | 828,681 | 33,848,352 | (194,570) | 33,653,782 | 34,482,463 | 3,395,855 | 98,119,676 |
| Total non-voted | 27,214,786 | 56,030 | – | 56,030 | 22,497,397 | – | 22,497,397 | 22,553,427 | 4,661,359 | 25,984,444 |
| Total | 65,093,104 | 981,174 | (96,463) | 884,711 | 56,345,749 | (194,569) | 56,151,179 | 57,035,890 | 8,057,214 | 124,104,120 |
Note 1: Help to Save is a new reporting line in 2021 to 2022 therefore there is no Outturn shown for 2020 to 2021.
Full information about VOA payments of Local Authority rates can be found at the Valuation Office Agency page on GOV.UK.
SOPS 1.2 Analysis of capital outturn by Estimate line
Table 45: Analysis of capital outturn by Estimate line
| Estimate Net Total (2021-22 £000) | Outturn Gross (2021-22 £000) | Outturn Income (2021-22 £000) | Outturn Net Total (2021-22 £000) | Variance: saving/(excess) (2021-22 £000) | Outturn Total (2020-21 £000) | |
|---|---|---|---|---|---|---|
| Spending in Departmental Expenditure Limit | ||||||
| Voted: | ||||||
| A HMRC administration | 714,789 | 961,568 | (317,689) | 643,879 | 70,910 | 529,830 |
| B VOA administration | 23,275 | 21,369 | (719) | 20,650 | 2,625 | 6,746 |
| C Utilised provisions | – | – | – | – | – | – |
| D COVID-19 | – | – | – | – | – | – |
| Total voted | 738,064 | 982,937 | (318,408) | 664,529 | 73,535 | 536,576 |
| Non-voted: | ||||||
| E National Insurance Fund | – | – | – | – | – | – |
| Total non-voted | – | – | – | – | – | – |
| Total spending in Departmental Expenditure Limit | 738,064 | 982,937 | (318,408) | 664,529 | 73,535 | 536,576 |
| Spending in Annually Managed Expenditure | ||||||
| Voted: | ||||||
| F Child Benefit | 10 | 7 | – | 7 | 3 | 4 |
| G Tax-Free Childcare | – | – | – | – | – | – |
| H Providing payments in lieu of tax relief to certain bodies | – | – | – | – | – | – |
| I Lifetime ISA | – | – | – | – | – | – |
| J Help to Save | – | – | – | – | – | – |
| K HMRC administration | – | – | – | – | – | – |
| L VOA payments of Local Authority rates | – | – | – | – | – | – |
| M VOA administration | – | – | – | – | – | – |
| N Utilised provisions | – | – | – | – | – | – |
| O COVID-19 | ||||||
| Total voted | 10 | 7 | – | 7 | 3 | 4 |
| Non-voted: | ||||||
| P Personal tax credits (note 1) | – | 675,963 | (675,963) | – | – | – |
| Q Other reliefs and allowances | – | – | – | – | – | – |
| Total non-voted | – | 675,963 | (675,963) | – | – | – |
| Total spending in Annually Managed Expenditure | 10 | 675,970 | (675,963) | 7 | 3 | 4 |
| Total voted | 738,074 | 982,944 | (318,408) | 664,536 | 73,538 | 536,580 |
| Total non-voted | – | 675,963 | (675,963) | – | – | – |
| Total | 738,074 | 1,658,907 | (994,371) | 664,536 | 73,538 | 536,580 |
Note 1: The transfer of personal tax credit receivables balance to DWP results in capital grant in kind entries that net to nil.
The total resource outturn for the year was £57,035.9 million, £8,057.2 million (12%) below the Estimate. The total capital outturn for the year was £664.5 million, £73.5 million (10%) below the Estimate. Explanations of material variances between the Estimate and outturn are provided below.
Resource Annually Managed Expenditure (AME)
I Lifetime ISA – Outturn was £127.4 million (23%) less than the Estimate. The anticipated increase in take up of the scheme following the pandemic has proven to be less than the Estimate which had been determined from OBR data.
K HMRC administration – Outturn was £27.9 million (78%) less than the Estimate. Provisions for the HMRC Locations Programme and new legal cases in the latter part of the year were less than anticipated in the Estimate.
N Utilised Provisions – Outturn was £21.2 million (40%) less than the Estimate. The utilisation of legal and HMRC Locations Programme provisions in the latter part of the year were less than anticipated in the Estimate.
O COVID-19 – Outturn was £2,432.4 million (13%) less than the Estimate. Schemes were closed on 30 September 2021 with Outturn having been less than forecast.
P Personal tax credits – Outturn was £2,608.5 million (20%) less than the Estimate. Outturn is less than was anticipated in the Estimate, this resulting from the rate of migration of customers to UC.
Q Other reliefs and allowances – Outturn was £2,059.6 million (15%) less than the Estimate. This primarily reflects corporation tax reliefs expenditure, the net impact of slightly higher creative industries reliefs being offset by lower than forecast research and development reliefs expenditure.
SOPS 2. Reconciliation of outturn to net operating expenditure
As noted in the introduction to the SOPS, outturn and the Estimates are compiled against the budgeting framework, which is similar to, but different from, IFRS. Therefore, this reconciliation bridges the resource outturn to net operating expenditure, linking the SOPS to the financial statements. These are detailed and explained below.
Table 46: Reconciliation of net resource outturn to net operating expenditure
| Reference | Outturn (2021-22 £000) | Outturn (2020-21 £000) | |
|---|---|---|---|
| Statement of Parliamentary Supply: Total resource outturn | |||
| Departmental Expenditure Limit | SOPS 1.1 | 5,716,745 | 4,795,291 |
| Annually Managed Expenditure | SOPS 1.1 | 51,319,145 | 119,308,829 |
| – | – | ||
| 57,035,890 | 124,104,120 | ||
| Excluded from SOPS total resource outturn: | |||
| Expenditure: Transfer of personal tax credits receivables to DWP | SOPS 1.2 | 675,963 | 325,634 |
| Expenditure: Non-current assets donated via a grant | SOPS 1.2 | 207,424 | – |
| Expenditure: Child Trust Fund | SOPS 1.2 | 7 | 4 |
| Expenditure: Non-current asset costs outside of budgeting | (158,024) | 16,871 | |
| Income: Developer contribution received to purchase non-current assets | SOPS 1.2 | (84,673) | (126,140) |
| Income: Payable to the Consolidated Fund | SOPS 4 | (7,544) | (1,837) |
| 633,153 | 214,532 | ||
| Excluded from CSoCNE net operating expenditure: | |||
| Expenditure: Service concession arrangements liability repayment | (7,641) | (21,182) | |
| (7,641) | (21,182) | ||
| Consolidated Statement of Comprehensive Net Expenditure: Net operating expenditure | Resource Accounts | 57,661,402 | 124,297,470 |
Explanation of additions and deductions
The receivable balance relating to customers who have made a valid claim to UC, now administered by DWP.
Non-current assets donated via a grant
The value of non-current assets donated by way of a capital grant in kind relates to the transfer of 100 Parliament Street assets to the Government Property Agency.
Developer contribution
The value of incentives received as we incur expenditure.
Non-current asset costs outside of budgeting and service concession arrangements
The National Accounts basis for recognising service concession arrangements is broadly similar to UK-Generally Accepted Accounting Practice (UK-GAAP), applying a risk-based test to determine the financial reporting. International Financial Reporting Standards (IFRS)-based recognition of service concession arrangements (International Financial Reporting Interpretations Committee (IFRIC) 12) is determined using control tests, which can result in a different on/off SoFP treatment. With the introduction of IFRS accounting, properties that HMRC sold to private sector contractors and subsequently leased back under a Private Finance Initiative contract were capitalised as finance leases under IFRIC 12.
For 2021 to 2022, this value includes the transfer to Government Property Agency of the liability associated with the lease of 100 Parliament Street.
Income payable to the Consolidated Fund
Income that is either in excess of limits included in the vote or is outside the scope of what is allowed to be retained. For these reasons, this income is excluded from the SOPS.
SOPS 3. Reconciliation of net resource outturn to Net Cash Requirement
Net cash requirement calculation only applies to core department and agency. As noted in the introduction to the SOPS, outturn and the Estimates are compiled against the budgeting framework, not on a cash basis. Therefore, this reconciliation bridges the resource and capital outturn to the net cash requirement.
Table 47: Reconciliation of net resource outturn to net cash requirement
| SOPS note | Estimate £000 | Outturn £000 | Outturn compared to Estimate: saving/excess £000 | |
|---|---|---|---|---|
| Resource Outturn | 1.1 | 65,093,104 | 57,035,890 | 8,057,214 |
| Capital outturn | 1.2 | 738,074 | 664,536 | 73,538 |
| Remove arms length bodies resource and capital | – | (96) | 96 | |
| Accruals to cash adjustments: | ||||
| Remove non-cash items: | ||||
| Depreciation and amortisation | (333,734) | (179,441) | (154,293) | |
| New provisions and adjustments to existing provisions | (38,000) | 2,654 | (40,654) | |
| Other non-cash items | (2,478) | (49,866) | 47,388 | |
| Reflect movement in working balances: | ||||
| Capital grant in kind: | ||||
| Transfer of personal tax credit receivables to DWP | – | 675,963 | (675,963) | |
| Increase/(decrease) in inventories | – | 528 | (528) | |
| Increase/(decrease) in receivables | – | (609,447) | 609,447 | |
| (Increase)/decrease in payables | 5,195,000 | 2,314,933 | 2,880,067 | |
| Use of provisions | 52,746 | 31,510 | 21,236 | |
| Other adjustments: | ||||
| Remove non-voted budget items: | ||||
| Funded outside the Vote | (27,214,786) | (22,553,427) | (4,661,359) | |
| Finance lease liability repayment | – | 4,373 | (4,373) | |
| Other | – | 25,552 | (25,552) | |
| Net cash requirement | 43,489,926 | 37,363,662 | 6,126,264 |
The net cash requirement outturn for 2021 to 2022 was £37,363.7 million, £6,126.3 million (14%) below the Estimate.
Depreciation and amortisation – Outturn was £154.3 million (46%) less than the Estimate. In 2021 to 2022, HMRC’s annual review of the amortisation periods for intangible assets under IAS 38 identified a need to update either useful lives and/or net book values which resulted in lower than anticipated outturn figures.
New provisions and adjustments to existing provisions – Outturn was £40.7 million (107%) less than the Estimate. This is the result of provisions for the HMRC Locations Programme and new legal cases in the latter part of the year being less than anticipated in the Estimate.
Other non-cash items – Outturn was £47.4 million (1,912%) more than the Estimate. This is primarily due to the loss on disposal of £25.3 million and loss on impairment of £19.3 million which were not anticipated at the point of the estimate.
Receivables – There was no Estimate value with Outturn being £609.4 million. This is primarily the result of the transfer of personal tax credit receivable to DWP.
Payables – Outturn was £2,880.1 million (55%) less than the Estimate. This is due to uncertainty surrounding the potential value of COVID-19 payments at the point of the Estimate.
Use of provisions – Outturn was £21.2 million (40%) less than the Estimate. The utilisation of legal and Locations Programme provisions in the latter part of the year were less than anticipated in the Estimate.
SOPS 4. Income payable to the Consolidated Fund
SOPS 4.1 Analysis of income payable to the Consolidated Fund
In addition to income retained by HMRC, the following income is payable to the Consolidated Fund. This is income which is outside the ambit of the Supply Estimate and is required to be paid over to HM Treasury.
Table 48: Analysis of income payable to the Consolidated Fund
| Reference | Outturn Accruals (2021-22 £000) | Outturn Cash Basis (2021-22 £000) | Outturn Accruals (2020-21 £000) | Outturn Cash Basis (2020-21 £000) | |
|---|---|---|---|---|---|
| Income outside the ambit of the Estimate | SOPS 2 | 7,544 | 7,544 | 1,837 | 1,837 |
| Excess cash surrenderable to the Consolidated Fund | – | – | – | – | |
| Total amount payable to the Consolidated Fund | Consolidated Statement of Changes in Taxpayers’ Equity | 7,544 | 7,544 | 1,837 | 1,837 |
SOPS 4.2 Consolidated Fund income
Consolidated Fund income shown in SOPS note 4.1 above does not include any amounts collected by the department where it was acting as agent of the Consolidated Fund rather than as principal. Full details of income collected as agent for the Consolidated Fund are in the department’s Trust Statement.
Losses and special payments
These losses and special payments relate to the running of the departmental group. Full details on revenue losses can be found in HMRC’s Trust Statement.
Losses statement
Losses are made up of remissions and write-offs. Remission is the process used to identify and separate money owed to HMRC which we have decided not to pursue – for example, on the grounds of value for money. Write-offs is the term used to describe money owed to HMRC that was considered to be irrecoverable – for example, because there were no practical means for pursuing it.
Table 49: Losses statement
| Core department and agency cases (2021-22) | Core department and agency £m (2021-22) | Departmental group cases (2021-22) | Departmental group £m (2021-22) | Core department and agency cases (2020-21) | Core department and agency £m (2020-21) | Departmental group cases (2020-21) | Departmental group £m (2020-21) | |
|---|---|---|---|---|---|---|---|---|
| COVID-19 support schemes: | ||||||||
| Coronavirus Job Retention Scheme remissions and write-offs | 155 | 0.8 | 155 | 0.8 | 1,058 | 8.7 | 1,058 | 8.7 |
| Self-Employment Income Support Scheme remissions and write-offs | 360 | 0.3 | 360 | 0.3 | 15,877 | 14.1 | 15,877 | 14.1 |
| Eat Out to Help Out (EOHO) remissions and write-offs | – | – | – | – | 7 | – | 7 | – |
| Working Households Receiving Tax Credits | 2,929 | 1.5 | 2,929 | 1.5 | – | – | – | – |
| Personal tax credits remissions | 499,438 | 24.2 | 499,438 | 24.2 | 583,812 | 30.2 | 583,812 | 30.2 |
| Personal tax credits write-offs | 6,759 | 5.6 | 6,759 | 5.6 | 18,735 | 22.9 | 18,735 | 22.9 |
| Child Benefit remissions and write-offs | 53,133 | 5.5 | 53,133 | 5.5 | 17,635 | 4.3 | 17,635 | 4.3 |
| Exchange rate losses | 40 | 0.8 | 40 | 0.8 | 26 | 2.1 | 26 | 2.1 |
| Others | 1,006 | (1.0) | 1,006 | (1.0) | 1,776 | (0.2) | 1,776 | (0.2) |
| Total | 563,820 | 37.7 | 563,820 | 37.7 | 638,926 | 82.1 | 638,926 | 82.1 |
In 2021 to 2022, £2.6 million of debt in respect of the COVID-19 support schemes was remitted/ written-off as uncollectable (2020 to 2021 £22.8 million). For further information see Note 4.1 Receivables and accrued revenue receivable of the Resource Accounts. In 2021 to 2022 £29.8 million of personal tax credit debt was remitted/written-off as it was uncollectable (2020 to 2021 £53.1 million). For further information see Notes 5.1.1 and 5.1.2 of the Resource Accounts. In 2021 to 2022 the department remitted £5.5 million of Child Benefit debt that was uncollectable (2020 to 2021 £4.3 million).
Details of cases more than £300,000
There were no individual cases of more than £300,000.
Special payments
These include compensation and ex-gratia payments in respect of personal injury, damage to property and those which result from the department’s redress policy. For further information on reporting requirements please see guidance in Managing Public Money, Annex 4.13.
Table 50: Special payments
| Core department and agency cases (2021-22) | Core department and agency £m (2021-22) | Departmental group cases (2021-22) | Departmental group £m (2021-22) | Core department and agency cases (2020-21) | Core department and agency £m (2020-21) | Departmental group cases (2020-21) | Departmental group £m (2020-21) | |
|---|---|---|---|---|---|---|---|---|
| Payments and accruals (note 1) | 27,317 | 15.5 | 27,317 | 15.5 | 18,822 | 4.2 | 18,822 | 4.2 |
Severance payments are included within special payments shown above. These are paid under certain circumstances to employees, contractors and others outside of normal statutory or contractual requirements, when leaving employment in the public service, whether they resign, are dismissed, or reach an agreed termination of contract. For 2021 to 2022, we made 17 payments totalling £519,369 (2020 to 2021 6 payments totalling £103,500) in respect of severance cases. The highest payment was £87,000 (2020 to 2021 £28,000) and the lowest payment was £490 (2020 to 2021 £4,500). The median payment was £25,000 (2020 to 2021 £18,000).
HMRC has made a number of special payments, in agreement with HM Treasury, to European Economic Area (EEA) and Swiss residents, who did not apply for EU Settlement Scheme Status by 30 June 2021 deadline. Failure to meet the deadline, meant that these citizens faced losing their legal entitlement to access Government benefits and services. These special payments enable HMRC to support and protect our most financially vulnerable claimants, for a time limited period whilst their status is resolved. HMRC paid 13,211 claims at a value of £11.6 million, and with an average payment of £877.
Details of cases more than £300,000
There were no individual cases of more than £300,000.
Note 1: Special payments, in agreement with HM Treasury, to EEA and Swiss residents, who did not apply for EU Settlement Scheme Status by 30 June 2021, have been reported on a paid basis.
Fees and charges
The fees and charges table lists the services HMRC provides to external and public sector customers where the full cost to HMRC exceeds £10 million. This includes services hosted by HMRC on behalf of other government departments as HMRC has the required infrastructure. In accordance with HM Treasury guidance in Managing Public Money, it is HMRC’s financial objective to recover the full cost of each service unless otherwise stated. Disclosed in the table for each service is the income received, the full cost incurred and the amount of any surplus or deficit between the income received and full cost charged. Surpluses and deficits can arise for a number of reasons, including demand fluctuations or variations to HMRC costs during the year.
Income received by the department which is not disclosed in this note amounts to £235.5 million and as this figure is not material to the accounts the department no longer publish a separate income note.
Table 51: Analysis of income where full cost exceeds £10 million
| Income (2021-22 £m) | Full cost (2021-22 £m) | Surplus/(deficit) (2021-22 £m) | Income (2020-21 £m) | Full cost (2020-21 £m) | Surplus/(deficit) (2020-21 £m) | |
|---|---|---|---|---|---|---|
| Fees and charges raised by the VOA | ||||||
| District valuer services | 16.2 | 14.4 | 1.8 | 14.5 | 15.3 | (0.8) |
| Fees and charges raised by the core department | ||||||
| Memorandum of Terms of Occupation (note 1) | 59.1 | 59.1 | – | 69.4 | 69.4 | – |
| National Minimum Wage | 25.6 | 25.6 | – | 25.1 | 25.5 | (0.4) |
| Economic Crime Supervision (note 2) | 24.9 | 20.1 | 4.8 | 22.8 | 19.9 | 2.9 |
| UK Border Agency | 11.5 | 11.5 | – | 11.5 | 11.5 | – |
| Collection of student loans | 10.2 | 10.1 | 0.1 | 11.7 | 11.7 | – |
| Total | 147.5 | 140.8 | 6.7 | 155.0 | 153.3 | 1.7 |
Note 1: Memorandum of Terms of Occupation (MoTO). MoTO is when there is an agreement between two or more Crown Bodies which allows for them to share the costs of occupying a building or part of a building. The income and full cost shown above is where HMRC is the major occupier of a building and has recharged the costs to other Crown Bodies who also occupy the buildings.
Note 2: This was formerly called Anti-Money Laundering Service.
Remote contingent liabilities
These are remotely possible obligations that arise from past events whose existence will be confirmed only by the occurrence of one or more uncertain future events not wholly within HMRC’s control.
The department has the following quantifiable remote contingent liabilities.
Table 52: Indemnities
| 1 April 2021 (£m) | Increase in year (£m) | Liabilities crystallised in year (£m) | Obligation expired in year (£m) | 31 March 2022 (£m) | Amount reported to Parliament by departmental minute (£m) | |
|---|---|---|---|---|---|---|
| Indemnities | 9.9 | 2.8 | – | (0.5) | 12.2 | – |
Managing Public Money requires that the full potential costs of indemnified contracts be reported to Parliament.
Jim Harra
Accounting Officer
6 July 2022
3. Our accounts
Trust Statement
Statement of Revenue, Other Income and Expenditure
| For the year ended 31 March | Note | 2022 £bn | 2021 £bn |
|---|---|---|---|
| Taxes and duties | |||
| Income Tax | 2.1 | 233.4 | 192.0 |
| Value Added Tax | 2.2 | 148.8 | 122.1 |
| Corporation Tax | 2.3 | 68.3 | 53.7 |
| Hydrocarbon oils duties | 2.4 | 25.8 | 21.3 |
| Stamp taxes | 2.5 | 18.7 | 12.6 |
| Capital Gains Tax | 2.6 | 15.8 | 12.0 |
| Alcohol duties | 2.7 | 13.1 | 12.1 |
| Tobacco duties | 2.8 | 10.2 | 9.8 |
| Other taxes and duties | 2.9 | 33.3 | 27.8 |
| Total taxes and duties | 567.4 | 463.4 | |
| Other revenue and income | |||
| National Insurance Contributions | 3.1 | 158.3 | 141.5 |
| Student Loan recoveries | 3.3 | 3.2 | 2.9 |
| Fines and penalties | 3.4 | 2.2 | 1.0 |
| Total other revenue and income | 163.7 | 145.4 | |
| Total revenue | 731.1 | 608.8 | |
| Less expenditure | |||
| Impairment charges | 4.4 | (2.5) | (6.8) |
| Provisions in-year expenditure movement | 7.1 | (1.8) | (0.1) |
| Total expenditure | (4.3) | (6.9) | |
| Less disbursements | |||
| National Insurance Contributions paid and payable to the National Insurance Funds and NHS | 3.1 | (158.3) | (141.0) |
| Appropriation of revenue to Resource Account | 3.2 | (21.9) | (25.1) |
| Student Loan recoveries paid and payable to the Department for Education (DfE) | 3.3 | (3.2) | (2.9) |
| Taxation paid to the Isle of Man | 3.5 | (0.3) | (0.3) |
| Total disbursements | (183.7) | (169.3) | |
| Total expenditure and disbursements | (188.0) | (176.2) | |
| Net revenue for the Consolidated Fund | 543.1 | 432.6 |
There were no recognised gains or losses accounted for outside the above Statement of Revenue, Other Income and Expenditure.
Notes 1 to 14 to the Trust Statement form part of this statement.
Statement of Financial Position
| As at 31 March | Note | 2022 £bn | 2021 £bn |
|---|---|---|---|
| Non-current assets | |||
| Receivables falling due after one year | 4.1 | 1.8 | 1.7 |
| Current assets | |||
| Receivables | 4.1 | 35.0 | 48.9 |
| Accrued revenue receivable | 4.1 | 120.7 | 93.0 |
| Total current assets | 155.7 | 141.9 | |
| Total assets | 157.5 | 143.6 | |
| Current liabilities | |||
| Payables | 5 | (22.5) | (21.5) |
| Accrued revenue payable | 5 | (44.5) | (37.3) |
| Deferred revenue | 5 | (2.7) | (2.2) |
| Cash and cash equivalents | 5.1 | (1.6) | (1.6) |
| Total current liabilities | (71.3) | (62.6) | |
| Assets less current liabilities | 86.2 | 81.0 | |
| Non-current liabilities | |||
| Provision for liabilities | 7 | (13.6) | (12.9) |
| Total assets less total liabilities | 72.6 | 68.1 | |
| Balance on Consolidated Fund Account | 8 | 72.6 | 68.1 |
Jim Harra
Accounting Officer
6 July 2022
Notes 1 to 14 to the Trust Statement form part of this statement.
Statement of Cash Flows
| For the year ended 31 March | 2022 £bn | 2021 £bn |
|---|---|---|
| Net revenue for the Consolidated Fund | 543.1 | 432.6 |
| (Increase)/decrease in non-cash assets | (13.9) | (16.2) |
| Increase/(decrease) in non-cash current liabilities | 8.7 | 4.2 |
| Increase/(decrease) in provision for liabilities | 0.7 | (1.4) |
| Net cash flow from operating activities | 538.6 | 419.2 |
| Less: Cash paid to the Consolidated Fund | (538.6) | (419.4) |
| Increase/(decrease) in cash and cash equivalents in this period | – | (0.2) |
| Net funds as at 1 April (opening cash and cash equivalents balance) | (1.6) | (1.4) |
| Net funds as at 31 March (closing cash and cash equivalents balance) | (1.6) | (1.6) |
Notes 1 to 14 to the Trust Statement form part of this statement.
Notes to the Trust Statement
Notes to the financial statements provide additional information required by statute and accounting standards to explain a particular feature of the financial statements. The notes which follow will also provide explanations and additional disclosure to assist readers’ understanding and interpretation of the financial statements.
1. Statement of accounting policies
1.1 Basis of accounting
The Trust Statement is prepared in accordance with:
- the Accounts Direction issued by HM Treasury under Section 2 of the Exchequer and Audit Departments Act 1921
- the 2021 to 2022 Government Financial Reporting Manual (FReM) issued by HM Treasury
- International Financial Reporting Standards (IFRS) adapted or interpreted for the public sector context
- the accounting policies detailed in subsequent notes
The accounting policies have been developed by HMRC in consultation with HM Treasury and have been reviewed during 2021 to 2022. These policies have been applied consistently in dealing with items considered material in relation to the accounts. The Trust Statement is prepared on a going concern basis.
The financial information presented is rounded to the nearest £0.1 billion, except for taxation due to the IoM (note 3.5), revenue losses (note 4.3), and Certificates of Tax Deposit (note 9), which are rounded to the nearest £1 million, due to the much smaller amounts disclosed in these notes.
1.2 Accounting convention
The Trust Statement has been prepared in accordance with the historical cost convention. The majority of taxes and duties are accounted for on an accruals basis. As agreed with HM Treasury, CT for smaller companies that do not pay by instalments and Capital Gains Tax reported via SA are accounted for on a partial accruals basis, as not enough information is known to reliably accrue for the revenue, hence there is no accrued revenue receivable estimate in the SoFP for these elements.
Stamp Duty, National Insurance Classes 1A and 1B, Import One Stop Shop (IOSS) and some repayments are accounted for on a cash basis as agreed with HM Treasury. Student Loans are accounted for on a cash basis to reflect HMRC’s role in the collection of Student Loan recoveries on behalf of the Department for Education. Accounting for these elements on a cash basis does not have a material impact on revenue.
1.3 Revenue recognition
Taxes and duties are measured at the fair value of the consideration received or receivable net of repayments. Revenue is recognised as per the FReM, which is in accordance with International Financial Reporting Standard 15 with adaptations applied, as taxes and duties arise from statute and not a contract.
Revenue is recognised when a taxable event has occurred, the revenue can be measured reliably and it is probable that the economic benefits from the taxable event will flow to HMRC. The taxable events for the material taxes and duties are described in note 2 below. Note 4 provides an explanation of accrued revenue receivable, note 5 provides an explanation of accrued revenue payable, note 6 describes the circumstances and approaches used where revenue estimation is needed. Revenues are deemed to accrue evenly over the period for which they are due.
The tax gap is not recognised in the Trust Statement, in accordance with the requirements of the FReM. The tax gap is the difference between the amount of tax that should, in theory, be paid to HMRC (the theoretical liability), and what is actually paid. The theoretical tax liability represents the tax that would be paid if all individuals, businesses and companies complied with both the letter of the law and HMRC’s interpretation of the intention of Parliament in setting law (referred to as the spirit of the law). The tax gap arises for a number of reasons. Some taxpayers make simple errors in calculating the tax that they owe, despite their best efforts, while others don’t take enough care when they submit their returns. Legal interpretation, evasion, avoidance and criminal attacks on the tax system also result in a tax gap.
HMRC promotes good compliance by helping customers to get things right and prevent non-compliance occurring by using data and system design to block fraud and prevent mistakes. Given the uncertainty of both the probability of economic flow and reliability of estimated figures, future revenue flows in relation to this activity are not recognised in the accounts until such time as a liability is assessed or established and/or the certainty of revenue flow to HMRC is probable.
Further information on tax gap can be found in the section Performance analysis, Collecting the right tax.
Further accounting policies are explained under the relevant notes starting at note 2.
2. Accounting policies and analysis
2.1 Income Tax
| For the year ended 31 March | 2022 £bn | 2021 £bn |
|---|---|---|
| Pay As You Earn and other Income Tax | 188.4 | 163.7 |
| Self Assessment | 44.6 | 27.8 |
| Simple Assessment | 0.4 | 0.5 |
| Total | 233.4 | 192.0 |
The taxable event for Income Tax is the earning of assessable income during the taxation period by the taxpayer. Where payments are received in advance of Self Assessment returns, the estimate of the Income Tax component is based on prior year Income Tax liabilities. See Note 6.2 Income Tax Self Assessment for further information.
Due to the uncertainty of the impact of COVID-19 on Income Tax self assessment (ITSA), 2020 to 2021 accrued revenue was underestimated by £8 billion. See Note 6.1 Uncertainty around the estimates for further information.
As part of the government announcement in March 2020, the government funded up to 80% of employees’ wages as part of the CJRS. As part of the SEISS, the government funded 5 grants to self-employed individuals. These government funded amounts are subject to IT. SEISS grants were taxed as income for the year in which they were received. Both schemes ended on 30 September 2021. For further information see Note 4 in the Resource Accounts.
COVID-19 support payments are recoverable as Income Tax if the recipient was not entitled to the amount in accordance with the scheme under which the payment was made. The amount chargeable is the amount the recipient is not entitled to. For the period ended 31 March 2022, COVID-19 support payments recovered via Income Tax totalled £67 million.
Given the significance of the Scottish and Welsh Income Tax arrangements a full disclosure note appears at Note 13 Devolved taxes.
2.2 Value Added Tax
| For the year ended 31 March | 2022 £bn | 2021 £bn |
|---|---|---|
| Gross revenue | 256.2 | 215.1 |
| Less: revenue repayable | (107.4) | (93.0) |
| Net revenue | 148.8 | 122.1 |
The taxable event for VAT is the supply of goods and services that attract VAT during the taxation period by the taxpayer. VAT is structured in such a manner that taxpayers are also entitled to claim repayments; hence a breakdown of gross revenue and repayments is disclosed.
Two new opt-in online systems have been introduced from 1 July 2021: a One Stop Shop (OSS) quarterly VAT reporting and payment system for distance selling, and an IOSS monthly VAT reporting and payment system for imports. Businesses not registered for OSS or IOSS will continue to use the current VAT reporting and payment system.
UK VAT Mini One Stop Shop (MOSS) has now been withdrawn as part of UK Transition. The final return for the UK’s VAT MOSS system was for the period ending 31 December 2020. The deadline for return amendments was 31 December 2021.
2.3 Corporation Tax
| For the year ended 31 March | 2022 £bn | 2021 £bn |
|---|---|---|
| Total | 68.3 | 53.7 |
The taxable event for CT is the earning of assessable profit during the taxation period by the taxpayer. Voluntary repayments of CJRS grants are treated as a reduction in the amount of taxable income of a company. The nature of CT legislation and our associated systems mean that accrued revenue is required to be estimated, as tax returns reporting taxpayer liabilities, reliefs or associated tax payments are not filed until after the Trust Statement has been published. See Note 6.3 Corporation Tax for further information.
Due to the uncertainty of the impact of COVID-19 on CT liabilities, 2020 to 2021 accrued revenue was underestimated by £2 billion. See Note 6.1 Uncertainty around the estimates for further information.
CT is accounted for on a partial accrual basis, as agreed with HM Treasury, because not enough information is known to reliably accrue for the revenue for smaller companies that do not pay by instalments. There is no accrued revenue receivable estimate in the SoFP for these smaller companies. For further information, please see Note 1.2 Accounting convention.
In certain circumstances, UK groups have been able to claim group relief for losses incurred in the EEA and EEA-resident companies trading in the UK through a UK Permanent Establishment have been able to surrender losses as group relief. Following the UK’s exit from the EU, from 27 October 2021 group relief rules relating to EEA-resident companies have been brought into line with those for non-UK companies resident elsewhere in the world.
Estimated corporation tax reliefs (CTR) are reported in the Resource Accounts. As per the FReM, £11.0 billion (£9.8 billion in 2020 to 2021) is recorded in the Trust Statement as revenue received to offset the CTR expenditure incurred by the Trust Statement. For further information see Note 5.1.4 Corporation tax reliefs in the Resource Accounts.
COVID-19 support payments are recoverable as CT if the recipient is a company and was not entitled to the amount in accordance with the scheme under which the payment was made. The amount chargeable is the amount the recipient is not entitled to.
For the period ended 31 March 2022, COVID-19 support payments recovered via CT totalled £73 million.
2.4 Hydrocarbon oils duties
| For the year ended 31 March | 2022 £bn | 2021 £bn |
|---|---|---|
| Total | 25.8 | 21.3 |
The taxable event for Hydrocarbon oils duty is the date of production, date of import or movement of relevant goods out of a duty suspended regime (a regime where, under UK legislation, certain goods benefit from a temporary suspension or reduction of import duties).
2.5 Stamp taxes
| For the year ended 31 March | 2022 £bn | 2021 £bn |
|---|---|---|
| Stamp Duty Land Tax | 14.2 | 8.9 |
| Stamp Duty Reserve Tax | 2.9 | 2.9 |
| Stamp Duty | 1.5 | 0.7 |
| Annual Tax on Enveloped Dwellings | 0.1 | 0.1 |
| Total | 18.7 | 12.6 |
The taxable event for Stamp Duty Land Tax (SDLT) is the purchase of property. For the period 8 July 2020 to 30 September 2021, the government applied temporary increases to the nil rate band for SDLT, therefore raising the threshold at which SDLT is payable for property purchases completed within that period.
The taxable event for Stamp Duty and Stamp Duty Reserve Tax is the purchase of shares. HMRC can only record Stamp Duty when a stamp is presented to HMRC and hence the duty is recognised on a cash basis. For further information, please see Note 1.2 Accounting convention.
The taxable event for Annual Tax on Enveloped Dwellings (ATED) is a company owning or part-owning a UK residential property valued at £500,000 or more during a chargeable period. ATED applies to a property that is a dwelling, if all or part of it is used, or could be used, as a residence.
2.6 Capital Gains Tax
| For the year ended 31 March | 2022 £bn | 2021 £bn |
|---|---|---|
| Total | 15.8 | 12.0 |
The taxable event for Capital Gains Tax (CGT) is the disposal of a chargeable asset leading to a taxable gain.
CGT receipts for UK residents are reported in the Trust Statement on a partial accrual basis and repayments are reported on a cash basis in the period the repayment is made. For further information, please see Note 1.2 Accounting convention.
2.7 Alcohol duties
| For the year ended 31 March | 2022 £bn | 2021 £bn |
|---|---|---|
| Wine, cider and perry | 4.9 | 4.9 |
| Spirits | 4.5 | 4.1 |
| Beer | 3.7 | 3.1 |
| Total | 13.1 | 12.1 |
The taxable event for alcohol duties is the date of production, date of import or date of movement of relevant goods out of a duty suspended regime (a regime where, under UK legislation, certain goods benefit from a temporary suspension or reduction of import duties).
2.8 Tobacco
| For the year ended 31 March | 2022 £bn | 2021 £bn |
|---|---|---|
| Cigarettes | 7.6 | 7.4 |
| Hand-rolling tobacco | 2.4 | 2.2 |
| Cigars | 0.1 | 0.1 |
| Tobacco for heating and other | 0.1 | 0.1 |
| Total | 10.2 | 9.8 |
The taxable event for tobacco duties is the date of production, date of import or date of movement of relevant goods out of a duty suspended regime (a regime where, under UK legislation, certain goods benefit from a temporary suspension or reduction of import duties).
2.9 Other taxes and duties
| For the year ended 31 March | Note | 2022 £bn | 2021 £bn |
|---|---|---|---|
| Insurance Premium Tax | 6.7 | 6.1 | |
| Inheritance Tax | 6.1 | 5.6 | |
| Customs Duties | 2.9.1 | 4.9 | 3.2 |
| Apprenticeship Levy | 3.3 | 2.9 | |
| Betting and Gaming duties | 3.1 | 2.9 | |
| Bank Surcharge | 2.8 | 0.9 | |
| Climate Change Levy | 2.0 | 2.0 | |
| Bank Levy | 1.2 | 1.9 | |
| Air Passenger Duty | 1.2 | 0.3 | |
| Landfill Tax | 0.7 | 0.6 | |
| Digital Services Tax | 0.5 | 0.5 | |
| Aggregates Levy | 0.4 | 0.4 | |
| Soft Drinks Industry Levy | 0.3 | 0.3 | |
| Diverted Profits Tax | 0.2 | 0.2 | |
| Petroleum Revenue Tax | (0.1) | – | |
| Total | 33.3 | 27.8 |
Significant changes to taxes and duties are detailed further below:
2.9.1 Customs Duties
Traders importing goods into the UK from the EU between 1 January 2021 and 31 December 2021 were able to delay submitting supplementary declarations by up to 175 days if certain conditions were met. As at 31 March 2022, declarations may not have been received for the period up to December 2021 and therefore, an estimate of £17 million (£27 million in 2020 to 2021) has been included within Customs Duties.
For further information see Supporting international trade.
3. Other revenue, income and disbursements
3.1 National Insurance Contributions
| For the year ended 31 March | 2022 £bn | 2021 £bn |
|---|---|---|
| National Insurance Fund Great Britain (NIF GB) | 125.2 | 112.1 |
| National Insurance Fund Northern Ireland (NIF NI) | 2.7 | 2.3 |
| National Health Services (NHS) | 30.4 | 27.1 |
| Total National Insurance Contributions (NICs) | 158.3 | 141.5 |
| Less: NIC expenditure | – | (0.5) |
| NICs due to NIF and NHS | 158.3 | 141.0 |
NICs are collected by HMRC on behalf of the National Insurance Funds (NIF) of Great Britain and Northern Ireland and the NHS for England, Wales, Scotland and Northern Ireland. They are payable to the NIF and the NHS when received and not when accrued.
National insurance classes 1A and 1B receipts are recognised on a cash basis in the accounting period in which the contributions are allocated. For further information on National insurance classes 1A and 1B, see the Trust Statement Note 1.2 Accounting Convention.
As part of the government announcement in March 2020, the government funded up to 80% of employees’ wages as part of the CJRS and provided grants for up to 80% of the average monthly trading profits for self-employed individuals as part of the SEISS. These government funded amounts are subject to NICs. Both schemes ended on 30 September 2021. For further information see Note 4 in the Resource Accounts.
3.2 Appropriation of revenue to the Resource Accounts
| For the year ended 31 March | 2022 £bn | 2021 £bn |
|---|---|---|
| Personal tax credits | 10.9 | 15.3 |
| Corporation tax reliefs | 11.0 | 9.8 |
| Total Appropriation of revenue to Resource Accounts | 21.9 | 25.1 |
The expenditure relating to PTC and corporation tax reliefs (CTR) is accounted for in the Resource Accounts.
The Trust Statement is responsible for the payment of PTC and CTR through the tax collection and repayment process. As per the FReM, these amounts are recorded in the Trust Statement as revenue received and as a disbursement to Resource Accounts.
For further information on personal tax credits and corporation tax reliefs, see Note 5.1.1 and 5.1.4 respectively in the Resource Accounts.
Please see the Resource Accounts, Consolidated Statement of Changes in Taxpayers’ Equity.
3.3 Student Loan recoveries
HMRC collects Student Loans on behalf of the DfE. The majority of Student Loans are collected through PAYE. An element of Student Loans is also collected through Self Assessment. Any difference between the cash received and the cash paid to the DfE is shown as a payable (note 5 – other revenue payables).
3.4 Fines and penalties
This consists of income arising from the levying of tax fines and penalties. Penalties relating to NICs are accounted for as NIC income and paid over to the National Insurance Fund.
3.5 Taxation due to the Isle of Man
Under the Isle of Man Act 1979, a revenue sharing arrangement exists between the UK and the IoM. Detail of the revenue sharing arrangement was agreed on 24 March 2020, superseding all previous agreements. Certain tax revenue streams, known as ‘common duties’ are pooled and then shared on an agreed basis. The IoM is entitled to the share of common duties collected in the UK and the IoM that are attributable to goods consumed and services supplied in the island. If the IoM agreed share is greater than revenues collected and retained by the IoM, this results in the UK making payment to the IoM to ensure the IoM receives the correct share. This is shown as a disbursement. Where the IoM collects and retains more than agreed under the sharing arrangement, the IoM makes payment to the UK. This is shown as other revenue and income.
For the period ended 31 March 2022 net payments to the IoM totalled £252 million (£284 million net payments in 2020 to 2021).
4. Receivables, accrued revenue receivable and impairment charges
4.1 Receivables and accrued revenue receivable (ARR)
| Receivables as at 31 March 2022 £bn | Accrued revenue receivable as at 31 March 2022 £bn | Total as at 31 March 2022 £bn | Receivables as at 31 March 2021 £bn | Accrued revenue receivable as at 31 March 2021 £bn | Total as at 31 March 2021 £bn | |
|---|---|---|---|---|---|---|
| Non-current assets | ||||||
| Receivables due after one year: | ||||||
| Inheritance Tax | 1.8 | – | 1.8 | 1.7 | – | 1.7 |
| Non-current assets after impairment | 1.8 | – | 1.8 | 1.7 | – | 1.7 |
| Current assets | ||||||
| Receivables and ARR due within one year: | ||||||
| Income Tax | 10.4 | 41.9 | 52.3 | 9.6 | 29.7 | 39.3 |
| Value Added Tax | 16.2 | 46.1 | 62.3 | 33.0 | 37.2 | 70.2 |
| Corporation Tax | 5.5 | 9.4 | 14.9 | 5.9 | 5.7 | 11.6 |
| National Insurance Contributions | 6.5 | 16.7 | 23.2 | 6.4 | 13.7 | 20.1 |
| Other taxes and duties | 10.8 | 8.5 | 19.3 | 8.7 | 8.2 | 16.9 |
| Current assets before impairment | 49.4 | 122.6 | 172.0 | 63.6 | 94.5 | 158.1 |
| Less impairment (note 4.2) | (14.4) | (1.9) | (16.3) | (14.7) | (1.5) | (16.2) |
| Total current assets after impairment | 35.0 | 120.7 | 155.7 | 48.9 | 93.0 | 141.9 |
| Total assets before impairment | 51.2 | 122.6 | 173.8 | 65.3 | 94.5 | 159.8 |
| Less impairment (note 4.2) | (14.4) | (1.9) | (16.3) | (14.7) | (1.5) | (16.2) |
| Total assets after impairment | 36.8 | 120.7 | 157.5 | 50.6 | 93.0 | 143.6 |
4.1.1 Receivables
Receivables represent all taxpayer liabilities that have been established, irrespective of whether due or overdue, for which payments have not been received at the SoFP date. Further information on receivables can be found in the section ‘Performance analysis’, Figure 10: Receivables.
4.1.2 Accrued revenue receivable
ARR represents amounts of taxes and duties where the taxable event has occurred but the return has not been received from the taxpayer by the end of the reporting period. For taxes where HMRC has received returns since the end of the reporting period, the department used this information to support its valuation of ARR. For those taxes where HMRC is yet to receive taxpayer returns, principally Income Tax (SA) and CT, the department has estimated ARR. Further information on significant estimates can be found in note 6.
HMRC has a number of taxpayer liabilities which have been postponed pending finalisation of enquiries. These items arise predominantly under Income Tax and CT. HMRC undertakes a review of large postponed cases for CT to ensure that revenue that meets the revenue recognition criteria, as set out in note 1.3, is recognised in the accounts. As a result, an amount of £1.4 billion (£1.2 billion in 2020 to 2021) has been included in ARR.
4.2 Impairment of receivables and ARR
| Receivables as at 31 March 2022 £bn | Accrued revenue receivable as at 31 March 2022 £bn | Total as at 31 March 2022 £bn | Total as at 31 March 2021 £bn | |
|---|---|---|---|---|
| Balance as at 1 April | 14.7 | 1.5 | 16.2 | 11.4 |
| Increase/(decrease) in impairment | (0.3) | 0.4 | 0.1 | 4.8 |
| Balance as at 31 March | 14.4 | 1.9 | 16.3 | 16.2 |
Receivables and ARR in the SoFP are reported after impairment to reflect an amount that is likely to be collected. This amount is estimated based on HMRC’s analysis of existing receivables and ARR historical trends of collection rates, losses, discharges, amendments and cancellations.
4.2.1 Impairment calculation
The FReM does not require HMRC to determine impairments in accordance with IFRS 9, as the standard relates to financial instruments, and taxes and duties arise from statute and not a contract. However, impairments have been measured applying the expected credit loss model set out in IFRS 9.
HMRC assesses the collectability of amounts due that are considered individually significant and the remainder are placed into groups of similar receivables and ARR, based on risk, and assessed collectively.
Implications of COVID-19 have been observed, such as HMRC reducing debt collection activity in order to provide more support to taxpayers impacted by COVID-19. This resulted in a higher debt balance and reduced losses, meaning HMRC debt collection rates since April 2020 are not considered a good basis for estimating expected credit losses. Therefore, multi-year averages of historic impairment rates have been used in our calculation from the 3 years prior to 2020 to 2021. HMRC has then considered the reasonableness of these average impairment rates by reviewing post-pandemic tax receipt information and making comparisons to prior years.
VAT deferrals outstanding as at 31 March 2022 were £1 billion, a reduction of £21.1 billion from 31 March 2021. VAT deferrals been impaired based on an estimated value for taxpayer non-payment (£0.3 billion), which was revised in March 2022 ahead of the 2022 Spring Budget and in the OBR Economic and Fiscal Outlook publication.
The 2021 to 2022 total impairment rate is 9.3% (note 1). The receivables impairment rate is 28.1% (note 2), which comprises of 35.7% impairment for deferrals and 28.0% impairment for non-deferred receivables. The ARR impairment rate is 1.5% (note 3).
Note 1: Total impairment divided by total receivables and ARR before impairment.
Note 2: Receivables impairment divided by total receivables before impairment.
Note 3: ARR impairment divided by total ARR before impairment.
4.2.2 Impairment Rate Analysis
The 2021 to 2022 total impairment rate is 10.1%. HMRC has considered many factors to determine whether a reduction in impairment rate is appropriate, including review of the OBR Economic and Fiscal Outlook published in March 2022, and a Bank of England report published in May 2022. We have also studied the effects on debt collection and losses of the global recession in the years following the financial crisis in 2008.
Our review of these external publications concluded that in 2021 the economy recovered from the impacts of COVID-19 faster than the five-year recovery after the 2008 banking crash, although recognising economic conditions remain uncertain.
We have also considered plans to support debt collection activities over the next few years which include:
- supporting more taxpayers with Time to Pay arrangements compared to prior years, including a ‘Breathing Space’ scheme which allows customers with debt problems more time from all creditor action
- implementing the ‘Debt Respite’ scheme, allowing qualifying customers to pay their overdue tax over a 3 to 10 year period
- continuing to collect monies under the VAT deferral scheme
- recruiting to increase the resource available for debt collection activity
Some of these arrangements will result in debts being paid over a longer period of time but should reduce the risk of a loss.
HMRC consider these factors to reduce the risk of non-payment associated with uncertain economic conditions and have concluded that the 2021 to 2022 impairment rate is reasonable.
4.2.3 Sensitivity Analysis
HMRC recognises that future economic conditions remain uncertain and have produced sensitivity analysis to demonstrate the possible outcomes if impairment rates were to differ from our estimate.
The total impairment rate is 9.3% (note 1).This comprises of 28.1% (note 2) impairment for receivables and 1.5% (note 3) impairment for ARR.
Potential impact on impairments
| Impairment Rate Change | Increase £bn | Decrease £bn |
|---|---|---|
| Total impairment rate (+/-1%) | 1.7 | (1.7) |
| Total impairment rate (+/-2%) | 3.5 | (3.5) |
| Total impairment rate (+/-3%) | 5.2 | (5.2) |
| Total impairment rate (+/-4%) | 7.0 | (7.0) |
| Total impairment rate (+/-5%) | 8.7 | (8.7) |
| Receivables impairment rate (+/-12%) applied for 2008 to 2009 financial crisis | 6.1 | (6.1) |
Note 1: Total impairment divided by total receivables and ARR before impairment.
Note 2: Receivables impairment divided by total receivables before impairment.
Note 3: ARR impairment divided by total ARR before impairment.
4.3 Revenue losses
| Remissions 31 March 2022 £m | Write-offs 31 March 2022 £m | Total 31 March 2022 £m | Remissions 31 March 2021 £m | Write-offs 31 March 2021 £m | Total 31 March 2021 £m | |
|---|---|---|---|---|---|---|
| Income Tax | 241 | 280 | 521 | 240 | 271 | 511 |
| Value Added Tax | 12 | 980 | 992 | 16 | 698 | 714 |
| Corporation Tax | 5 | 157 | 162 | 11 | 154 | 165 |
| National Insurance Contributions | 40 | 196 | 236 | 24 | 253 | 277 |
| Fines and penalties | 136 | 160 | 296 | 137 | 130 | 267 |
| Other remissions and write-offs | 81 | 119 | 200 | 17 | 11 | 28 |
| Total revenue losses | 515 | 1,892 | 2,407 | 445 | 1,517 | 1,962 |
Revenue losses occur when we formally cease collection activity. The vast majority are driven by individual and business insolvencies.
Revenue losses are made up of remissions and write-offs. Remissions are debts capable of recovery but HMRC has decided not to pursue the liability on the grounds of value for money. Write-offs are debts that are considered to be irrecoverable because there is no practical means for pursuing the liability.
For certain taxes, only a partial split between remissions and write-offs is known. Where information is unavailable the percentage split of the known element is applied to the remainder to calculate a total estimated remission and write-off split.
Fines and penalties losses relating to NICs are accounted for as NICs revenue losses.
Revenue losses have increased compared to the prior year, however they are still significantly lower than pre-pandemic levels (41% lower when compared to 31 March 2020). These continuing low levels are due to the reduction in insolvencies following government measures to financially support individuals and businesses by temporarily restricting the use of statutory and certain winding up petitions during the COVID-19 pandemic, and the related operational restrictions which have reduced the amount of HMRC compliance activity. The 22.7% increase in revenue losses compared to the prior year is due to these restrictions being phased out from 1 October 2021.
Further information on losses can be found in the section ‘Performance analysis’, Impacts on the debt balance in 2021 to 2022.
Revenue losses – cases more than £10 million
For the period ended 31 March 2022, there were 21 cases (9 cases as at 31 March 2021) where the loss exceeded £10 million, totalling £541 million (£320 million as at 31 March 2021). Details are shown below.
There were 18 write-offs (6 cases as at 31 March 2021) relating to Insolvency and one remission (one case as at 31 March 2021) totalling £377 million (£140 million as at 31 March 2021).
There was one write-off case (nil as at 31 March 2021) of £12 million relating to Missing Trader Intra Community Fraud (MTIC). All MTIC cases are assessed to establish if there is potential to recover revenue and, where appropriate, proactive insolvency action is initiated.
There was one bulk remission for Self Assessment penalties of £152 million (£162 million as at 31 March 2021) relating to 86,925 cases (60,440 cases as at 31 March 2021), where it had been identified customers were no longer liable for SA or were no longer self-employed and had ceased to trade. HMRC decided not to pursue on the grounds of value for money.
4.4 Breakdown of impairment charges
Impairment charges are made up of revenue losses and the movement in the impairment of receivables and ARR.
| For the year ended 31 March | Note | 2022 £bn | 2021 £bn |
|---|---|---|---|
| Increase/(decrease) in impairment of receivables and ARR | 4.2 | 0.1 | 4.8 |
| Revenue losses | 4.3 | 2.4 | 2.0 |
| Total impairment charges | 2.5 | 6.8 |
5. Payables, accrued revenue payable and deferred revenue
| Payables as at 31 March 2022 £bn | Accrued revenue payable as at 31 March 2022 £bn | Deferred revenue as at 31 March 2022 £bn | Total as at 31 March 2022 £bn | Total as at 31 March 2021 £bn | |
|---|---|---|---|---|---|
| Income Tax | 2.1 | 3.7 | – | 5.8 | 5.0 |
| Value Added Tax | 2.9 | 18.0 | 0.1 | 21.0 | 18.6 |
| Corporation Tax | 10.7 | 1.9 | 0.4 | 13.0 | 11.2 |
| National Insurance Funds and the NHS | 1.3 | 20.7 | – | 22.0 | 18.5 |
| Other revenue payables | 2.4 | 0.2 | 2.2 | 4.8 | 4.4 |
| Other payables | 0.1 | – | – | 0.1 | 0.1 |
| Payments on account | 3.0 | – | – | 3.0 | 3.2 |
| Current liabilities before cash and cash equivalents | 22.5 | 44.5 | 2.7 | 69.7 | 61.0 |
| Cash and cash equivalents | 1.6 | – | – | 1.6 | 1.6 |
| Total current liabilities | 24.1 | 44.5 | 2.7 | 71.3 | 62.6 |
Payables are amounts recorded as due to customers by HMRC at the end of the reporting period but payment has not been made. Payments on account are taxpayer credit amounts that have not been allocated to a tax charge at the reporting period end date.
Accrued revenue payable (ARP) is recognised for:
- amounts due to VAT traders that have an established revenue repayment claim relating to the financial year, but the date the claim is received is after the end of the reporting period
- amounts of receivables and accrued revenue receivable that when received will be passed to a third-party after adjusting for expenditure, e.g. NICs due to the National Insurance Funds and NHS
- amounts in respect of CT, Income Tax and other small taxes likely to be repayable by HMRC pending finalisation of taxpayer liabilities, and for expected CT overpayments
Deferred revenue includes duties and taxes paid in the current year which relate to future accounting periods.
There are no liabilities in the table above which fall due after one year.
5.1 Cash and cash equivalents
This reflects the net position of cash in HMRC bank accounts and payments that have been authorised to issue but the money has not cleared through the banking process as of 31 March.
6. Accounting estimates
The nature of tax legislation and our associated systems mean that some of the accrued revenue receivable figures and some other items are subject to estimation. This note considers the significant revenue estimates. There are separate estimation disclosures on impairment of receivables and ARR in Note 4.2, provision for liabilities and Contingent liabilities in Note 7 and Devolved taxes in Note 13.
Tax forecasting models are used to produce the revenue estimates, and these are based on a combination of projections including the most recent revenue flows and forecasts of economic variables on which future revenue flows depend. The forecasts are based on what HMRC believes to be the relevant inputs.
Due to the nature of tax legislation, the most difficult taxes to estimate are CT and Self Assessment Income Tax.
Estimates have been made to support the ARR and ARP balances where tax returns reporting taxpayer liabilities or associated tax payments are not filed until after the Trust Statement has been published. The estimates take into consideration the economic assumptions prepared for the March 2022 Budget and the Economic and Fiscal Outlook published by the OBR in March 2022. Estimates have been prepared using the judgement of professional departmental economists and statisticians having substantial experience of tax forecasting.
6.1 Uncertainty around the estimates
Estimation uncertainty is based on a combination of factors, such as, evidence from the performance of our estimation models over previous years, changes to reflect the March 2022 Budget, and the Economic and Fiscal Outlook published by the OBR in March 2022.
Actual outcomes could differ from the estimates used, due to the areas of uncertainty involved. Estimation uncertainty has increased due to COVID-19, which may result in material adjustments to the carrying values of our Accrued Revenue Receivables and Payables within the next financial year.
Each year HMRC reviews the performance of its estimation models. Last year, the ARR underestimation was £11.1 billion (1.8% of 2020 to 2021 total revenue). ARP underestimation was £0.9 billion (0.1% of 2020 to 2021 total revenue).
Underestimation of 2020 to 2021 accrued revenue
ITSA ARR 2020 to 2021 outturn data was significantly higher (£8 billion) than that estimated last year. The estimate was based on the OBR’s March 2021 forecast of ITSA liabilities with extremely limited information on ITSA incomes. At Spring 2021, the OBR expected sharp falls in self-employment income in 2020 to 2021 due to COVID-19. These sharp falls were reduced due to Self Employed Income Support Scheme grants paid out in 2020 to 2021 which are part of taxable income for 2020 to 2021. Provisional analysis of ITSA returns at Spring 2022 suggested that the incomes of sole traders and partners held up much better than expected. Higher self-employed income than forecast resulted in higher tax liabilities.
CT ARR 2020 to 2021 outturn data was significantly higher (£2 billion) than that estimated last year. The estimate included amounts based on the OBR’s March 2021 forecast of CT liabilities. Outturn liabilities for 2020 to 2021 were significantly higher than forecast due to companies recovering more quickly from the COVID-19 pandemic than was expected last year.
ITSA and CT ARR estimation is always uncertain due to it being based on a forecast, however 2020 to 2021 was particularly difficult to forecast due to the uncertain impact of COVID-19. HMRC therefore do not expect this level of variance to be repeated given how unprecedented the impact of COVID-19 was.
The 2020 to 2021 underestimated accrued revenue has been accounted for in 2021 to 2022. As a result, revenue reported in the SORE and current assets reported in the SOFP were lower in 2020 to 2021 and higher in 2021 to 2022. There is no expected impact on future accounting periods.
The process for each significant estimate is described in more detail below.
6.2 Income Tax Self Assessment
ITSA ARR is estimated to be £20.3 billion this year (£13.0 billion in 2020 to 2021), which is included in the total Income Tax ARR of £41.9 billion (£29.7 billion in 2020 to 2021) in Note 4.1 Receivables and Accrued Revenue Receivable. Also see Note 6.1 Uncertainty around the estimates for further information. The ARR represents taxpayer liabilities due where the taxable event has already occurred, but the return has not been submitted by the taxpayer by the end of the financial year.
The SA regime involves long filing and payment lags, so the ARR estimate is driven by the March 2022 Budget forecast and the underlying economic determinants are based on the OBR central forecast including expected impacts of COVID-19, rather than by receipts data.
The estimation process has 3 stages:
- estimation of accrued tax liabilities for 2021 to 2022. Information from SA returns relating to 2021 to 2022 are not available at the point of estimation, therefore the March 2022 Budget ITSA forecast has been revised in line with the latest economic and tax receipts data that has been received
- deduction from the estimated 2021 to 2022 accrued tax liabilities of relevant payments received by the end of the financial year
- a further deduction from the estimated 2021 to 2022 accrued tax liabilities for payments due by the end of the financial year but not made by that date. These amounts relate to payments on account due by 31 January. These are included within Note 4.1 Receivables and Accrued Revenue Receivable.
There are several key economic factors that underpin these estimates and are the main contributors to the increase in the ARR estimate from 2020 to 2021. These include self employed income growth, dividend income growth and Average Effective Tax Rates (AETR). AETR is total tax liability as a proportion of total income across all individuals.
Sensitivity analysis has been produced to demonstrate the impact of changes to key assumptions used in the current estimate and the results are shown in the table below.
Based on historic data, changes in key assumptions are unlikely to exceed the percentages within the table below, but this is less certain than normal given the range of impacts that COVID-19 has had on Income Tax.
Impact on ITSA ARR of varying key economic factors
| Key assumption (percentage point change) | Increase £bn | Decrease £bn |
|---|---|---|
| AETR on Non-Saving Non-Dividend income of mainly SA individuals (note 4) (+/-0.6%) | 1.6 | (1.6) |
| Self employed income growth (+/-5%) | 1.3 | (1.3) |
| Non-Saving Non-Dividend SA liability of mainly PAYE individuals (note 5) (+/-43%) | 0.9 | (0.9) |
| Dividend AETR of mainly SA individuals (note 4) (+/-3%) | 0.8 | (0.8) |
| Deduction rate on PAYE income of mainly SA individuals (note 4) (+/-0.55%) | (0.5) | 0.5 |
| Dividend AETR of mainly PAYE individuals (note 5) (+/-1%) | 0.4 | (0.4) |
| Land Expenses (+/-4%) | 0.4 | (0.4) |
| Adjustments to Profit (+/-24%) | 0.4 | (0.4) |
| Dividend income growth (+/-3%) | 0.3 | (0.3) |
Note 4: Mainly SA Individuals are those within SA who have some Non-Saving Non-Dividend income from non PAYE sources such as self-employed income, property income, foreign income or do not have a PAYE source.
Note 5: Mainly PAYE individuals are those within SA whose Non-Saving Non-Dividend income is entirely from PAYE sources (Employment/ Pension).
6.3 Corporation Tax
CT ARR is £9.4 billion (£5.7 billion in 2020 to 2021) which includes an estimated amount of £6.5 billion (£4.1 billion in 2020 to 2021). See Note 6.1 Uncertainty around the estimates for further information.
The ARR represents taxpayer liabilities due where the taxable event has already occurred, but the return has not been submitted by the taxpayer by the end of the financial year. As with SA, the filing of CT returns and payments are subject to a considerable lag, so the ARR estimate is subject to uncertainty, since there is less outturn data available.
The key drivers of the ARR estimate are outturn CT receipts received to date, and a series of assumptions. CT receipts reflect COVID-19 impacts occurring during 2021 to 2022 and have increased from 2020 to 2021, contributing to the increase in the ARR estimate. The assumptions used are needed to estimate the total amount of accrued tax liabilities from CT returns that relate to 2021 to 2022 but are not available at the point of estimation and are explained further below.
Sensitivity analysis has been produced to demonstrate the impact of changes to key assumptions used in the current estimate and the results are shown in the table below.
Based on recent historic data, changes in key assumptions are likely to fall within the ranges in within the table below, but this is less certain than normal given the range of impacts that COVID-19 has had on CT during this period.
Impact on CT ARR of varying key economic factors
| Key assumption (percentage point change) | Increase £bn | Decrease £bn |
|---|---|---|
| Late payments (+/-2%) | 0.3 | (0.3) |
| Overpayments (+/-5%) | (0.9) | 0.9 |
| CT liability growth (+/-10%) | 0.3 | (0.3) |
| Proportion of companies’ CT liabilities paid with in-year QIPs (+/-5%) | (0.5) | 1.4 |
Separate ARR estimates have been calculated for onshore and North Sea companies because of differences in how these companies operate and, in particular, the number of instalments paid. Further detail can be found below.
Onshore companies
CT for large onshore companies is paid by 4 QIPs. CT ARR has been estimated where between one and four QIPs for onshore companies have been received using a model that forecasts companies’ CT liabilities based on the number and value of QIPs received by a given date.
The key assumptions used in this modelling are the proportion of CT that is paid late and/or overpaid (needed to adjust observed payments to match underlying liabilities) and the proportion of CT liabilities paid in each quarterly instalment. These assumptions are informed by looking at historic trends in outturn data.
For accounting periods where no QIPs have been received, ARR has been estimated using OBR’s March 2022 CT forecast.
CT is assumed to accrue evenly throughout the companies’ accounting periods. Assumptions for the proportions of companies’ CT liabilities that are remitted with each QIP and adjustments for overpayments and late payments of CT liabilities are based on analysis of historical data.
ARP has been estimated for expected overpayments based on historical trends.
As agreed with HM Treasury, CT for smaller companies that do not pay by instalment are accounted for on a partial accrual basis, as a reliable ARR estimate for these companies cannot be formed.
North Sea companies
North Sea companies pay their CT liabilities in three instalment payments (TIPs).
Most TIPs relating from 1 January to 31 March are not due in sufficient time to be included in the TIPs estimation model and these amounts are therefore estimated. This estimate is based on the OBR’s March 2022 North Sea taxes forecast which has increased from 2020 to 2021 as a result of the impact of the Ukraine crisis on the global energy markets. This is a contributing factor to the increase in the ARR estimate from 2020 to 2021.
6.4 Value Added Tax
VAT ARR is £46.1 billion (£37.2 billion in 2020 to 2021) and ARP is £18.0 billion (£14.9 billion in 2020 to 2021). A large amount of the VAT ARR and ARP is based on actual receipts data and is not therefore subject to significant estimation uncertainty. It is necessary to estimate (ARR of £7.4 billion and ARP of £2.2 billion) as returns submitted in June and July relating to the current financial year are not available at the time of producing the estimate. An estimate is produced by calculating the value of these returns as a proportion of the total value of the returns in the preceding period last year. Those proportions are then applied to the value of returns for the corresponding period this year.
A number of further adjustments need to be made to reflect VAT that is accounted for outside the process described above. These adjustments relate to import VAT, repayments made to government departments, and officers’ assessments of errors in submitted VAT returns. These are based largely on actual return information although some forecast element remains using the methodology described above.
Economic growth throughout 2021 to 2022 following a decline in 2020 to 2021 as a result of COVID-19 is the main reason for the larger ARR estimate in 2021 to 2022.
7. Provision for liabilities and contingent liabilities
Provisions are recognised when HMRC has a present legal or constructive obligation as a result of a past event, it is probable that HMRC will be required to settle that obligation and an amount can be estimated reliably.
The contingent liabilities relate to legal cases for which the outcome is uncertain and HMRC consider that there is only a possible rather than probable likelihood that a payment will be required and/or the amount cannot be measured reliably.
Provision for liabilities
| Legal claims £bn | Oil and gas field decommissioning £bn | Total 2022 £bn | Total 2021 £bn | |
|---|---|---|---|---|
| Balance as at 1 April | 3.4 | 9.5 | 12.9 | 14.3 |
| Provided in the year | 0.7 | 2.1 | 2.8 | 1.7 |
| Provision not required written back | (0.4) | (0.6) | (1.0) | (1.6) |
| Provision utilised in the year | (0.5) | (0.6) | (1.1) | (1.5) |
| Balance as at 31 March | 3.2 | 10.4 | 13.6 | 12.9 |
Analysis of expected timing of cash flows
| Legal claims £bn | Oil and gas field decommissioning £bn | Total 2022 £bn | |
|---|---|---|---|
| Amounts payable within 5 years | 3.0 | 2.3 | 5.3 |
| Amounts payable after 5 years | 0.2 | 8.1 | 8.3 |
| Balance as at 31 March | 3.2 | 10.4 | 13.6 |
7.1 Provisions in-year expenditure movement
| Legal claims £bn | Oil and gas field decommissioning £bn | Total 2022 £bn | Total 2021 £bn | |
|---|---|---|---|---|
| Total provided in the year | 0.7 | 2.1 | 2.8 | 1.7 |
| Provision not required written back | (0.4) | (0.6) | (1.0) | (1.6) |
| Net movement increase/(decrease) | 0.3 | 1.5 | 1.8 | 0.1 |
7.2 Legal claims
Provision for liabilities
HMRC is involved in a number of legal and other disputes which can result in claims against HMRC by taxpayers. It is in the nature of HMRC’s business that a number of these matters may be the subject of litigation over several years. The department, having taken legal and other specialist advice, has established a provision having regard to the relevant facts and circumstances of each matter in accordance with accounting requirements. Due to an element of uncertainty in the estimate of the provision, the ultimate liability for such matters may vary from the amounts provided and is dependent upon the outcome of litigation proceedings, investigations and possible settlement discussions. Provisions were reviewed during 2021 to 2022; discounting has not been applied on the basis of materiality.
Contingent liabilities
Contingent liabilities are disclosed at a value made in accordance with a best estimate based on the information available at the end of the reporting period. Those estimates are subject to change and, for some legal cases, are inherently uncertain. Regular review of the contingent liabilities leads to the recognition of new cases where appropriate. Existing cases may also be revalued, recognised as provisions, or removed from the contingent liability disclosures (i.e. where the probability that HMRC will be required to make a payment to settle the liability is now considered to be remote).
As at 31 March 2022, HMRC has 7 cases estimated to have a value of £3.2 billion (compared to 5 cases with an estimated value of £3.1 billion as at 31 March 2021) where the maximum potential tax repayment, before losses, capital allowances and other tax reliefs, is over £100 million. Each case may include a lead case with follower claimants and cover a range of heads of duty, including CT, Income Tax and VAT.
Further claimants may opt to follow a lead case but are not yet known to HMRC or the Courts. Wider adoption claims of this nature are difficult to quantify with sufficient reliability and therefore deemed to fall outside of criteria in the relevant accounting standards. They are not recognised in the accounts or disclosed in these notes.
7.3 Exchequer liabilities arising from oil and gas infrastructure
There are 2 taxes levied on companies exploring and producing oil and gas from the UK Continental Shelf (UKCS): Petroleum Revenue Tax (PRT) and offshore CT, the latter comprising of 2 elements: Ring-fenced CT and Supplementary Charge.
The legislation governing the losses from decommissioning costs (Oil Taxation Act 1975) allows participators in an oil and gas field liable to PRT to carry-back decommissioning losses almost indefinitely against profits it has previously made from the field, or which previous participators in the field have made. This may result in the repayment of PRT. With respect to offshore CT, the Corporation Tax Act 2010 allows for a company’s decommissioning loss to be carried back against its own historical profits dating back to April 2002. Again, this may result in a repayment of offshore CT.
Provision for oil and gas field decommissioning
The provision is estimated as the appropriately discounted sum of all forecast decommissioning repayments over the expected lifetime of the North Sea oil and gas fields. Repayment profiles are derived from the output produced by HMRC’s North Sea Forecasting Model developed at the individual company and field level. There has been no significant change in the model since last year.
A provision of £10.4 billion has been reported in 2021 to 2022 based on the estimated tax repayments of PRT £2.1 billion (£3.3 billion in 2020 to 2021) and offshore CT £8.3 billion (£6.2 billion in 2020 to 2021) by HMRC to companies over the period to 2065 due to losses from decommissioning expenditure.
The key determinants of the provision estimate are future decommissioning costs from the North Sea Transition Authority’s (NSTA) Asset Stewardship Survey, economic determinants (including oil and gas prices, production and the US Dollar/Sterling exchange rate) from the OBR and the BEIS as well as the discount rates from HM Treasury.
There has been a £0.9 billion increase in the overall provision since last year. The main causes of the increase were higher decommissioning expenditure in nominal terms as well changes in discount rates, partly offset by the effect of higher forecast oil and gas prices in the short/ medium term which reduces the provision.
The provision utilised in-year is the tax repayments in 2021 to 2022 due to decommissioning expenditure.
Uncertainty around the estimate of the provision
There is inherent uncertainty surrounding forecasting oil and gas revenues over 30+ years ahead.
The £10.4 billion provision is based on a view of assumptions as mentioned above. However, low and high estimates of the provision have been prepared based on different views:
- the high estimate of £15.9 billion is based on a lower fossil fuel demand scenario (i.e. lower price assumptions and production)
- the low estimate of £8.8 billion is based on a higher fossil fuel demand scenario
The sensitivity of the £10.4 billion provision to individual inputs is as below.
The largest impact on the size of the provision, and biggest source of uncertainty in estimating it, is future decommissioning costs. Annually, the NSTA estimates the total costs of remaining oil and gas decommissioning for the UKCS, including newly sanctioned projects, and changes to the portfolio of potential, as yet unsanctioned projects. Recognising the uncertainty around this, the NSTA gives a range for expected decommissioning costs for UKCS oil and gas infrastructure over the remaining life of the North Sea basin.
The provision included in the Trust Statement is calculated using the NSTA’s central estimate for remaining decommissioning costs due to be published in August 2022. Using the NSTA’s lower and upper decommissioning cost estimates would instead give provision estimates of £8.0 billion and £14.3 billion respectively.
A major economic determinant which drives the provision are oil and gas prices. The model has utilised certain BEIS projections and applied a growth rate to projected prices for later years. Compared to the baseline oil and gas price forecasts a ten percent increase (decrease) would decrease (increase) the provision by approximately £0.6 billion (£1.0 billion).
The provision is also impacted by discount rates and foreign exchange rates as follows:
- an increase in the discount rate will reduce the present value of the provision. An overall increase in the discount rates of 50 basis points will decrease the overall provision by £0.6 billion. The same decrease in discount rates would increase the provision by £0.7 billion
- as oil prices are denominated in US Dollars, the overall provision is impacted by changes in the US Dollar/Sterling exchange rate. A 10-cent appreciation in the US Dollar gives rise to higher Sterling oil prices resulting in a £0.4 billion decrease in the provision. A 10-cent depreciation of the Dollar results in a £0.5 billion increase in the required provision
8. Balance on Consolidated Fund Account
| Movements on Consolidated Fund account | 2022 £bn | 2021 £bn |
|---|---|---|
| Balance on Consolidated Fund as at 1 April | 68.1 | 54.9 |
| Net revenue for the Consolidated Fund | 543.1 | 432.6 |
| Less amount paid to Consolidated Fund | (538.6) | (419.4) |
| Balance on Consolidated Fund Account | 72.6 | 68.1 |
9. Certificates of tax deposits
Under the Certificate of Tax Deposits (CTD) scheme, HMRC previously accepted deposits from people liable to UK taxes and other liabilities. Relevant taxes and liabilities can be found at the Pay your tax bill by Certificate of Tax Deposit page of GOV.UK. HMRC administers this scheme on behalf of HM Treasury, and the accounts of the National Loans Fund include the principal and accrued interest for all issued CTDs as at 31 March.
From 23 November 2017, the CTD scheme has been closed for new purchases but existing certificates will continue to be honoured until 23 November 2023. The value redeemed for the year ended 31 March 2022 totalled £32 million (£56 million in 2020 to 2021).
Delays in processing between redemption of CTDs and the transfer of funds to and from the National Loans Fund can result in an outstanding balance at the year end; this balance is included within payables in the SoFP in the Trust Statement.
10. R.N.Limited
R.N. Limited is a registered company that administers, on behalf of HMRC, the holding of charges securing tax debts owed to HMRC. These tax debts are reflected in the Trust Statement. The company’s parent undertaking and controlling party is HMRC.
R.N. Limited also holds on behalf of HMRC, assets that have been assigned to HMRC in settlement of tax debts. These are not recognised in the Trust Statement until realised. There is no designation order requiring R.N. Limited’s financial statement to be consolidated within HMRC’s Accounts. R.N. Limited’s accounts can be viewed at Companies House.
11. Third party assets
The department holds cash and other assets which have been seized in relation to ongoing legal proceedings. These assets do not belong to the department and do not form part of these accounts although, where seized assets are forfeited without legal proceedings, proceeds are recognised as penalty income.
The department holds Euro deposits in relation to traders who have registered with HMRC to use the VAT MOSS scheme. This entails the making of payments to HMRC who will then forward any relevant amounts onto the tax authorities in the EU member state(s) where the consumers of telecommunications, broadcasting and e-services are subsequently located. VAT MOSS traders were able to amend returns until 31 December 2021 and make payments until 31 January 2022. HMRC forwarded the final amounts to EU tax authorities on 20 February 2022. Neither the department nor the government have any beneficial interest in these funds.
The department holds amounts in relation to businesses operating under the terms of the Northern Ireland (NI) protocol who have registered with HMRC to use the OSS scheme to report and pay VAT due to the EU. This entails the making of payments to HMRC who will then forward any relevant amounts to the EU. The scheme was implemented on 1 July 2021 and covers goods sold from NI to consumers in the EU.
12. Related party transactions
Due to the nature of HMRC’s business, we have a large number of transactions, relating to taxation income, with other government departments and other central government bodies. No Board member, key manager or other related party has undertaken material transactions with the department during the year.
13. Devolved taxes
13.1 Scottish Income Tax
The Scottish Parliament has the power to set and change its own tax rate bands and limits, introduce new ones, and include a zero rate, to all non-savings non-dividend (NSND) Income Tax paid by Scottish taxpayers (Scotland Acts 2012, 2016). These powers were fully effective from 6 April 2017.
Starting from the 2018 to 2019 tax year and continuing up to the 2021 to 2022 tax year there have been 5 Income Tax bands in Scotland with different limits and rates applied to each. These range from the Starter rate of 19% up to the Top rate of 46%. This means that a Scottish taxpayer can pay a different amount of total Income Tax compared to someone from England and Northern Ireland earning the same amount of income. More information on the Scottish Income Tax rates for the 2021 to 2022 tax year can be found at the Income Tax in Scotland page of GOV.UK.
13.2 Welsh rates of Income Tax
The Wales Act 2017 gives the Welsh Parliament the power to set Welsh Rates of Income Tax (WRIT). This allows the Welsh Government to affect the amount of Income Tax that Welsh taxpayers pay and, as a result, the amount that the Welsh Government can spend in Wales. WRIT is calculated on a tax year basis and was introduced with effect from 6 April 2019.
The Welsh rates for the 2019 to 2020 to 2021 to 2022 tax years were set at 10% for each of the tax bands. This means that a Welsh taxpayer paid the same amount of total Income Tax as someone from England and Northern Ireland earning the same amount of income, but for the Welsh taxpayer 10 percentage points of each tax band was owed to the Welsh Government with the remainder owed to the UK Consolidated Fund.
13.3 Scottish and Welsh rate of Income Tax estimates for 2021 to 2022
The provisional estimate of revenue raised in 2021 to 2022 from Scottish Income Tax is £13.3 billion and from Welsh rates of Income Tax it is £2.4 billion.
These figures have been estimated because actual data is unavailable. For example, minimal disclosure has been made to HMRC in respect of SA revenue for the 2021 to 2022 tax year, and PAYE revenue is not available for taxpayers whose accounts have not been reconciled at the time the estimate has been produced for the Trust Statement. They also include estimates for the impact of budget measures, Gift Aid and other effects, such as broader demographic changes before the amount is apportioned between Scotland, Wales and the remainder of the UK.
The Scottish and Welsh shares of Income Tax liabilities are estimated using a model based on the HMRC Survey of Personal Incomes which reflects data collected in 2019 to 2020. These are also adjusted to take account of the latest 2020 to 2021 Income Tax for the Scottish and Welsh final outturn data. This latter adjustment involves scaling each of the provisional estimates in 2021 to 2022 by the percentage difference between their 2020 to 2021 final outturn data and the underlying methodology’s estimates of 2020 to 2021 based on the HMRC Survey of Personal Incomes.
The underlying methodology estimated higher Scottish Income Tax receipts in 2020 to 2021 than the final outturn, therefore, the 2021 to 2022 provisional estimate has been scaled down by a proportionate amount. The methodology also estimated higher Welsh rates of Income Tax receipts for 2020 to 2021 than the final outturn and the 2021 to 2022 provisional estimate has been scaled down by a proportionate amount.
Further information on revenue for the tax year 2021 to 2022 that becomes available during 2021 to 2022 will allow refinement of these calculations. Updated figures will be disclosed in the 2022 to 2023 Trust Statement, allowing a final reconciliation for the 2021 to 2022 tax year.
13.4 Scottish and Welsh rates of Income Tax outturn for 2020 to 2021
Provisional estimates for Scottish Income Tax of £12.0 billion and £2.1 billion for Welsh rates of Income Tax were disclosed in last year’s accounts. Now that HMRC has established approximately 97% of the tax liabilities for the year, the final outturn figures for 2020 to 2021 have been calculated as £11.9 billion for Scottish Income Tax and £2.1 billion for Welsh rates of Income Tax.
For full details on the 2020 to 2021 outturn please refer to the HMRC publications released on 7 July 2022. The outturn publications are not subject to NAO audit.
HM Treasury is responsible for ensuring that the proceeds are made available to fund expenditure by the Scottish and Welsh Governments; these transfers are not accounted for in the HMRC Trust Statement.
The costs of collecting and administering are charged to the Scottish and Welsh Governments and accounted for in the Resource Accounts, but these are not individually disclosed due to materiality.
14. Events after the reporting period
There are no reportable events after the reporting period. These accounts have been authorised for issue by the Accounting Officer on the same date as the Comptroller and Auditor General’s Audit Certificate.
Accounts direction given by HM Treasury in accordance with Section 2 of The Exchequer and Audit Departments Act 1921
-
This direction applies to those government departments listed in appendix 2.
-
The Department shall prepare a Trust Statement (“the Statement”) for the financial year ended 31 March 2022 for the revenue and other income, as directed by the Treasury, collected by the department as an agent for others, in compliance with the accounting principles and disclosure requirements of the edition of FReM 2021 to 2022.
-
The Statement shall be prepared, as prescribed in Appendix 1, so as to give a true and fair view of (a) the state of affairs relating to the collection and allocation of taxes, licence fees, fines and penalties and other income by the Department as agent and of the expenses incurred in the collection of those taxes, licence fees, fines and penalties insofar as they can properly be met from that revenue and other income; (b) the revenue and expenditure; and (c) the cash flows for the year then ended.
-
The Statement shall also be prepared so as to provide disclosure of any material expenditure or income that has not been applied to the purposes intended by Parliament or material transactions that have not conformed to the authorities which govern them.
-
When preparing the Statement, the Department shall comply with the guidance given in the FReM (Chapter 11). The Department shall also agree with HM Treasury the format of the Principal Accounting Officer’s Foreword to the Statement, and the supporting notes, and the accounting policies to be adopted, particularly in relation to revenue recognition. Regard shall also be given to all relevant accounting and disclosure requirements in Managing Public Money and other guidance issued by HM Treasury, and to the principles underlying International Financial Reporting Standards.
-
Compliance with the requirements of the FReM will, in all but exceptional circumstances, be necessary for the accounts to give a true and fair view. If, in these exceptional circumstances, compliance with the requirements of the FReM is inconsistent with the requirement to give a true and fair view, the requirements of the FReM should be departed from only to the extent necessary to give a true and fair view. In such cases, informed and unbiased judgement should be used to devise an appropriate alternative treatment which should be consistent with both the economic characteristics of the circumstances concerned and the spirit of the FReM. Any material departure from the FReM should be discussed in the first instance with HM Treasury.
-
The Statement shall be transmitted to the Comptroller and Auditor General for the purpose of his examination and report by a date agreed with the Comptroller and Auditor General and HM Treasury to enable compliance with the administrative deadline for laying the audited accounts before Parliament.
-
The Trust Statement, together with this direction (but with the exception of the related appendices) and the Report produced by the Comptroller and Auditor General under section 2 of the Exchequer and Audit Departments Act 1921 shall be laid before Parliament at the same time as the Department’s Resource Accounts for the year unless the Treasury have agreed that the Trust Statement may be laid at a later date.
Michael Sunderland
Deputy Director
Government Financial Reporting Her Majesty’s Treasury
16 December 2021
Resource Accounts
Consolidated Statement of Comprehensive Net Expenditure for the year ended 31 March 2022
This statement summarises the expenditure incurred and income generated on an accruals basis. Other comprehensive expenditure and income includes changes to the values of non-current assets that cannot yet be recognised as income or expenditure.
Consolidated Statement of Comprehensive Net Expenditure
| Note | Core department and agency (2021-22 £m) | Departmental group (2021-22 £m) | Core department and agency (2020-21 £m) | Departmental group (2020-21 £m) | |
|---|---|---|---|---|---|
| Cash items: | |||||
| COVID-19 support schemes | 4 | 17,262.7 | 17,262.7 | 81,233.3 | 81,233.3 |
| Personal tax credits | 5.1.1 | 10,605.5 | 10,605.5 | 15,063.2 | 15,063.2 |
| Corporation tax reliefs | 5.1.4 | 11,692.8 | 11,692.8 | 10,696.1 | 10,696.1 |
| Child Benefit | 11,423.8 | 11,423.8 | 11,476.3 | 11,476.3 | |
| Tax-Free Childcare | 428.4 | 428.4 | 253.0 | 253.0 | |
| Lifetime ISA | 418.9 | 418.9 | 346.1 | 346.1 | |
| Help to Save | 20.4 | 20.4 | 67.9 | 67.9 | |
| Staff and related costs | 2,950.4 | 2,981.9 | 2,745.3 | 2,778.3 | |
| Goods and services | 1,417.4 | 1,380.9 | 1,143.2 | 1,105.0 | |
| Service charges | 184.0 | 184.0 | 326.3 | 326.3 | |
| Payments in lieu of tax relief and rates | 212.5 | 212.5 | 220.3 | 220.3 | |
| Other cash expenditure | 479.8 | 480.4 | 424.2 | 424.9 | |
| Non-cash items: | |||||
| Transfer of personal tax credit receivables to DWP | 676.0 | 676.0 | 325.6 | 325.6 | |
| Amortisation | 7 | 114.4 | 114.4 | 266.4 | 266.4 |
| Provisions | 12 | (2.7) | (2.7) | 48.1 | 48.1 |
| Depreciation | 6 | 74.2 | 74.4 | 58.6 | 58.7 |
| Other | 90.1 | 90.1 | 21.3 | 21.3 | |
| Total operating expenditure | 58,048.6 | 58,044.4 | 124,715.2 | 124,710.8 | |
| Total operating income | (387.2) | (383.0) | (417.7) | (413.3) | |
| Net operating expenditure | 57,661.4 | 57,661.4 | 124,297.5 | 124,297.5 | |
| Other comprehensive net expenditure | |||||
| Items that will not be reclassified to net operating costs: | |||||
| Net loss/(gain) on: | |||||
| – revaluation of property, plant and equipment | 1.8 | 1.8 | 1.4 | 1.4 | |
| – revaluation of intangible assets | (64.0) | (64.0) | (47.3) | (47.3) | |
| – actuarial revaluation of pension scheme | 1.5 | 1.5 | 0.9 | 0.9 | |
| Total comprehensive expenditure for the year | 57,600.7 | 57,600.7 | 124,252.5 | 124,252.5 |
The Notes to the departmental Resource Accounts form part of these accounts.
Consolidated Statement of Financial Position as at 31 March 2022
This statement presents the financial position of the department. It comprises three main components: assets owned or controlled; liabilities owed to other bodies; and equity, the remaining value of the entity.
Consolidated Statement of Financial Position
| Note | Core department and agency (2021-22 £m) | Departmental group (2021-22 £m) | Core department and agency (2020-21 £m) | Departmental group (2020-21 £m) | |
|---|---|---|---|---|---|
| Non-current assets: | |||||
| Property, plant and equipment | 6 | 669.5 | 670.0 | 744.4 | 745.1 |
| Intangible assets | 7 | 2,077.8 | 2,077.8 | 1,606.5 | 1,606.5 |
| Receivables | 9 | 1,201.0 | 1,194.0 | 1,372.0 | 1,365.0 |
| Pension asset | 13 | 4.3 | 4.4 | 5.9 | 5.9 |
| Total non-current assets | 3,952.6 | 3,946.2 | 3,728.8 | 3,722.5 | |
| Current assets: | |||||
| Inventories | 2.2 | 2.2 | 1.6 | 1.6 | |
| Trade and other receivables | 9 | 991.0 | 991.8 | 1,091.6 | 1,090.8 |
| Cash and cash equivalents | 10 | 4,701.5 | 4,706.2 | 9,910.2 | 9,914.4 |
| Total current assets | 5,694.7 | 5,700.2 | 11,003.4 | 11,006.8 | |
| Total assets | 9,647.3 | 9,646.4 | 14,732.2 | 14,729.3 | |
| Current liabilities: | |||||
| Trade and other payables | 11 | (14,865.4) | (14,864.5) | (21,795.4) | (21,792.5) |
| Provisions | 12 | (15.6) | (15.6) | (1.5) | (1.5) |
| Total current liabilities | (14,881.0) | (14,880.1) | (21,796.9) | (21,794.0) | |
| Total assets less current liabilities | (5,233.7) | (5,233.7) | (7,064.7) | (7,064.7) | |
| Non-current liabilities: | |||||
| Payables | 11 | (1,823.0) | (1,823.0) | (1,887.4) | (1,887.4) |
| Provisions | 12 | (142.3) | (142.3) | (190.6) | (190.6) |
| Total non-current liabilities | (1,965.3) | (1,965.3) | (2,078.0) | (2,078.0) | |
| Total assets less total liabilities | (7,199.0) | (7,199.0) | (9,142.7) | (9,142.7) | |
| Taxpayers’ equity and other reserves: | |||||
| General fund | 7,317.2 | 7,317.2 | 9,245.8 | 9,245.8 | |
| Revaluation reserve | (118.2) | (118.2) | (103.1) | (103.1) | |
| Total equity | 7,199.0 | 7,199.0 | 9,142.7 | 9,142.7 |
The Notes to the departmental Resource Accounts form part of these accounts.
Jim Harra
Accounting Officer
6 July 2022
Consolidated Statement of Cash Flows for the year ended 31 March 2022
This statement shows the changes to the department’s cash and cash equivalents during the reporting period. It shows how the department generates and uses these by classifying cash flows as operating, investing and financing activities. Cash flows arising from financing activities include Parliamentary Supply.
Consolidated Statement of Cash Flows
| Note | Core department and agency (2021-22 £m) | Departmental group (2021-22 £m) | Core department and agency (2020-21 £m) | Departmental group (2020-21 £m) | |
|---|---|---|---|---|---|
| Cash flows from operating activities | |||||
| Net operating expenditure | (57,661.4) | (57,661.4) | (124,297.5) | (124,297.5) | |
| Adjustments for non-cash transactions | 2 | 952.0 | 952.2 | 720.0 | 720.1 |
| (Increase)/decrease in trade and other receivables (note 1) | 276.2 | 274.6 | 103.7 | 103.7 | |
| Personal tax credits receivables, adjusted for impairment, transferred to DWP | 5.1.2 | (676.0) | (676.0) | (325.6) | (325.6) |
| (Increase)/decrease in inventories | (0.6) | (0.6) | 0.2 | 0.2 | |
| (Increase)/decrease in trade and other payables (note 1) | (1,598.0) | (1,596.1) | 3,174.8 | 3,174.2 | |
| Use of provisions | 12 | (31.5) | (31.5) | (96.2) | (96.2) |
| Net cash outflow from operating activities | (58,739.3) | (58,738.8) | (120,720.6) | (120,721.1) | |
| Cash flows from investing activities | |||||
| Additions to property, plant and equipment | 6 | (232.0) | (232.0) | (245.0) | (245.4) |
| Less additions to leased property, plant and equipment | 3.0 | 3.0 | 10.0 | 10.0 | |
| Additions to intangible assets | 7 | (546.5) | (546.5) | (442.4) | (442.4) |
| Less additions to leased intangible assets | – | – | 3.6 | 3.6 | |
| Proceeds of disposal of property, plant and equipment | 0.8 | 0.8 | 0.3 | 0.3 | |
| Net cash outflow from investing activities | (774.7) | (774.7) | (673.5) | (673.9) | |
| Cash flows from financing activities | |||||
| From the Consolidated Fund (Supply) – current year | 32,149.5 | 32,149.5 | 105,994.4 | 105,994.4 | |
| From the Consolidated Fund (Supply) – prior year | – | – | 726.0 | 726.0 | |
| Repayment to the Consolidated Fund | – | – | (806.3) | (806.3) | |
| From the Trust Statement | 21,929.6 | 21,929.6 | 25,088.2 | 25,088.2 | |
| From the National Insurance Fund | 240.3 | 240.3 | 251.5 | 251.5 | |
| Capital element of payments in respect of finance leases and on-SoFP PFI contracts | (12.0) | (12.0) | (29.6) | (29.6) | |
| Net financing | 54,307.4 | 54,307.4 | 131,224.2 | 131,224.2 | |
| Net increase/(decrease) in cash and cash equivalents in the period before adjustment for receipts and payments to the Consolidated Fund | (5,206.6) | (5,206.1) | 9,830.1 | 9,829.2 | |
| Payments of amounts due to the Consolidated Fund | (2.1) | (2.1) | (0.3) | (0.3) | |
| Net increase/(decrease) in cash and cash equivalents in the period after adjustment for receipts and payments to the Consolidated Fund | (5,208.7) | (5,208.2) | 9,829.8 | 9,828.9 | |
| Cash and cash equivalents at the beginning of the period | 10 | 9,910.2 | 9,914.4 | 80.4 | 85.5 |
| Cash and cash equivalents at the end of the period | 10 | 4,701.5 | 4,706.2 | 9,910.2 | 9,914.4 |
Note 1: Figures are net of items not passing through the CSoCNE.
The Notes to the departmental Resource Accounts form part of these accounts.
Consolidated Statement of Changes in Taxpayers’ Equity (CSoCTE) for the year ended 31 March 2022
This statement shows the movement in the year on the different reserves held by the department, analysed into General Fund and revaluation reserve. The General Fund represents the total assets less liabilities of the department, to the extent that it is not represented by other reserves and financing items. The revaluation reserve reflects the change in asset values that have not been recognised as income or expenditure. Core department and agency figures are the same as departmental group, therefore core department and agency are not shown.
Consolidated Statement of Changes in Taxpayers’ Equity
| Note | 2021-22 General fund £m | 2021-22 Revaluation reserve (note 1) £m | 2021-22 Departmental group Taxpayers’ equity £m | 2020-21 General fund £m | 2020-21 Revaluation reserve (note 1) £m | 2020-21 Departmental group Taxpayers’ equity £m | |
|---|---|---|---|---|---|---|---|
| Balance at 1 April | (9,245.8) | 103.1 | (9,142.7) | (7,111.7) | 94.9 | (7,016.8) | |
| Net Parliamentary funding – drawn down | 32,149.5 | – | 32,149.5 | 105,994.4 | – | 105,994.4 | |
| Net Parliamentary funding – deemed (note 2) | 9,908.6 | – | 9,908.6 | – | – | – | |
| Funding from Trust Statement (note 3) | 21,929.6 | – | 21,929.6 | 25,088.2 | – | 25,088.2 | |
| National Insurance Fund | 255.2 | – | 255.2 | 225.1 | – | 225.1 | |
| Supply (payable)/receivable adjustment | (4,694.5) | – | (4,694.5) | (9,908.6) | – | (9,908.6) | |
| Excess Vote – Prior Year | – | – | – | 726.0 | – | 726.0 | |
| Income payable to the Consolidated Fund | (7.5) | – | (7.5) | (1.8) | – | (1.8) | |
| Net expenditure for the year | (57,661.4) | – | (57,661.4) | (124,297.5) | – | (124,297.5) | |
| Other net comprehensive expenditure: | |||||||
| Revaluation of property, plant and equipment | – | (1.8) | (1.8) | – | (1.4) | (1.4) | |
| Revaluation of intangible assets | – | 64.0 | 64.0 | – | 47.3 | 47.3 | |
| Transfer between reserves | 47.1 | (47.1) | – | 37.7 | (37.7) | – | |
| Pension reserve actuarial (losses)/gains | (1.5) | – | (1.5) | (0.9) | – | (0.9) | |
| Contributions to LGPS pension fund by DWP | – | 1.5 | 1.3 | – | 1.3 | ||
| Non-cash charges – auditor’s remuneration | 2 | 2.0 | – | 2.0 | 2.0 | – | 2.0 |
| Balance at 31 March | (7,317.2) | 118.2 | (7,199.0) | (9,245.8) | 103.1 | (9,142.7) |
Note 1: The 31 March 2022 balance comprised £10.4 million in relation to property, plant and equipment assets (31 March 2021 £28.1 million, 1 April 2020 £38.4 million) and £107.8 million in relation to intangible assets (31 March 2021 £75.0 million, 1 April 2020 £56.5 million).
Note 2: This is any Supply drawn down in the previous year but not spent at that year-end and, therefore, is available to be spent in subsequent financial year.
Note 3: Personal tax credits and corporation tax reliefs are funded out of tax receipts from the Trust Statement. Please see the Statement of Revenue, Other Income and Expenditure in the Trust Statement.
The Notes to the departmental Resource Accounts form part of these accounts.
Notes to the departmental Resource Accounts
Notes to the financial statements provide additional information required by statute and accounting standards to explain a particular feature of the financial statements. The notes which follow will also provide explanations and additional disclosure to assist readers’ understanding and interpretation of the financial statements.
1. Statement of accounting policies
These financial statements have been prepared in accordance with the FReM for the financial year 2021 to 2022 issued by HM Treasury. The accounting policies contained in the FReM apply International Financial Reporting Standards (IFRS) as adapted or interpreted for the public sector context. Net liabilities shown on the SoFP are expected to be met by future funding from the Trust Statement, in respect of the corporation tax reliefs which are the primary element, or voted by Parliament annually through Supply and Appropriation Acts. Given there is no reason to believe the resources required to settle these liabilities will not be forthcoming, the Resource Account has been prepared on a Going Concern basis.
Where the FReM permits a choice of accounting policy, HMRC has applied the most appropriate to give a true and fair view.
1.2 Accounting convention
These accounts have been prepared on an accruals basis under the historical cost convention modified to account for the revaluation of property, plant and equipment and intangible assets.
1.3 Basis of consolidation
This account consolidates the results of the bodies falling within the departmental boundary as defined by the FReM. For HMRC these are; core department, VOA and RCDTS Ltd.
1.4 COVID-19 support schemes
HMRC is empowered with the authority to make payments under the respective COVID-19 support schemes (or extensions) at the point an HM Treasury direction is issued, following the Coronavirus Act 2020.
Expenditure on claims for the CJRS and EOHO is recognised on an accruals basis in the financial year in which the economic activity being subsidised has, or would have but for the pandemic, taken place.
CJRS claims for the period 1 March 2020 to 31 March 2020 could only be made following the HM Treasury direction on 15 April 2020. Expenditure for these claims was recognised in the financial year 2020 to 2021.
Expenditure on claims for SEISS is recognised in the financial year when the claimant has fulfilled the performance obligations associated with the grant. The first three tranches were recognised in 2020 to 2021 and the fourth and fifth tranches were recognised in 2021 to 2022.
Expenditure for the one-off £500 payment for Working Households Receiving Tax Credits (WHRTC) has been recognised in the financial year 2021 to 2022.
CJRS, SEISS, WHRTC and EOHO expenditure is net of repayments received. Amounts recovered through tax charges for CJRS, SEISS and EOHO are accounted for in the Trust Statement.
1.5 Tax credits
1.5.1 Personal tax credits
Where overpayments of personal tax credits arise these are not by arrangement and are not credit assessed or loan agreements. Customers are given a certain time to settle the overpayment, or enter into an arrangement to pay debt. The debt is considered to be overdue after 30 days. The HMRC business model for managing personal tax credit overpayment debt is to collect the contractual cash flows only, with no intention to sell the debt asset.
Personal tax credit debt is being transferred to the DWP as part of the transition to UC, this is a transfer between government bodies and not a sale of the debt.
As per the FReM, the IFRS 9 simplified approach to impairing assets is used to impair tax credit overpayment debt over the lifetime of the debt. The contractual cash flows are solely repayments of principal debt and therefore the debt is measured at amortised cost.
For personal tax credits, there is not a definition of default due to the nature of the legislation surrounding the recovery of overpayments. Personal tax credits receivables are reported net of losses which are defined and detailed in the Losses Statement which is reported in the Parliamentary accountability section.
1.5.2 Corporation tax reliefs
In the absence of a specific applicable accounting standard, management have determined the following accounting policy for recognising and measuring expenditure on corporation tax reliefs in line with the principles of IFRS.
Expenditure is recognised as companies engaged in qualifying activities incur their qualifying expenditure, not when subsequent claims are received. This provides a consistent recognition point for expenditure and income between these accounts and the HMRC Trust Statement, where the related CT income is recognised as the taxable events occur and not when returns are filed.
Expenditure and related accrual profiles are estimated by the department’s statisticians using analysis of historic relief claims and applying forecast growth and uplift assumptions and adjustments made for planned changes in relevant policy and rates. This estimation is required due to the time-lag between the end of companies’ accounting periods and the submission of their tax returns. The filing requirements are such that these returns are not due until 12 months after their accounting period end. Additionally, amended claims can be received up to 24 months after their accounting period end.
In subsequent accounting periods the department evaluates any new information available and determines whether previous estimates of expenditure need to be adjusted. A final estimate is made five years after initial recognition with the resulting amount considered to be a reasonable proxy for final outturn in the absence of readily available actual outturn values.
All reliefs expenditure is funded by the Trust Statement, this funding being recognised in reserves.
1.6 Child Benefit
Child Benefit expenditure is recognised in the month payment becomes due.
Child Benefit expenditure includes amounts paid to taxpayers earning greater than £50,000 per annum and recovered via future Income Tax charges. These Income Tax charges are accounted for in the Trust Statement.
Where under or overpayments are identified, adjustments are made to expenditure, with receivables and payables recognised appropriately. Overpayments are treated as receivables and the department seeks to recover these from future benefit entitlement or through direct repayment.
Child Benefit receivables are reported net of losses which are detailed in the Losses Statement which is reported in the Parliamentary accountability section. Losses are made up of remissions and write-offs.
1.7 Non-current assets
1.7.1 General
Furniture, vehicles, IT hardware, software licences and website development costs reported by the core department are capitalised (excluding certain low value assets). Accommodation refurbishments are capitalised if costs exceed £150,000 (VOA: £15,000). For other assets a £5,000 capitalisation threshold applies.
Assets capitalised under finance leases are recorded at the lower of fair value and the present value of the minimum lease payments, at the inception of the contract.
Fair value is defined as the price that would be received to sell an asset or paid to transfer a liability in an orderly transaction between market participants at the measurement date.
Assets under construction are recorded at cost. Non-property assets are valued on a depreciated historical cost basis as a proxy for fair value as they are of low value with short lives.
Assets are stated at cost less accumulated depreciation/amortisation and impairment losses. These are depreciated/amortised at rates calculated to write them down to estimated residual values on a straight-line basis over their useful lives. All intangible assets are assessed to have a finite useful life over which they are amortised. Asset useful lives are normally in the following ranges:
| Asset category – property, plant and equipment | Useful life |
|---|---|
| Land | Not depreciated |
| Freehold buildings | 50 years |
| Leased serviced accommodation | Period of the lease |
| Leased IT assets | Period of the lease |
| Accommodation refurbishments | Remainder of the lease to which they relate |
| Office equipment | 5 to 20 years |
| Computer equipment | 4 to 7 years |
| Vehicles | 5 to 8 years |
| Furniture and fittings | 10 to 15 years |
| Scientific aids | 3 to 10 years |
| Developed computer software | 10 years unless known to be otherwise |
| Software licences | Period of the licence |
| Website development costs | 10 years unless known to be otherwise |
The useful life of all assets is considered on an annual basis and changed if required.
A formal impairment review is undertaken on an annual basis for buildings, accommodation refurbishments and developed computer software assets.
The impact of COVID-19 is not thought to have had a short-term effect on HMRC asset values, although there may be a more obvious impact in the medium to long term which will be addressed in future revaluation and impairment exercises.
1.7.2 Property Plant and Equipment
Property
Where substantially all risks and rewards of ownership of a leased asset are borne by the department, at the inception of the contract, the asset is recognised and recorded at the lower of fair value and the present value of the minimum lease payments. The interest element of the finance lease payment is charged to expenditure over the period of the lease at a constant rate in relation to the balance outstanding.
For PFI transactions where the department has control within a contract and a material residual interest, property is recognised as a non-current asset and the liability to pay for it is accounted for as a finance lease. Contract payments are apportioned between CSoCNE, financing and service charges and a Consolidated Statement of Financial Position (CSoFP) finance lease liability.
The department has also capitalised other PFI property interests as finance leases being service concession arrangements. Land reported in these Accounts represents the HMRC ownership of land.
Buildings to which we are contracted under HMRC Locations Programme are operating leases. Further such leases will be reviewed on a case-by-case basis to ensure they are classified correctly.
Property assets have been stated at current value in existing use using professional valuation on a rolling five year programme, all assets will be professionally revalued within this time period. Each year 20% of the estate is physically revalued with the remainder undergoing a desktop revaluation exercise to identify material changes. The basis of the valuation is in accordance with the professional standards of the Royal Institute of Surveyors: RICS Valuation. Compliance with the RICS professional standards and valuation practice statements gives assurance also of compliance with the International Valuers Standards.
Information Technology
Where applicable, the IT non-current assets recognised by our IT partners and used in providing the IT service to the department have been capitalised as finance leases and are disclosed at the lower of fair value and the present value of the minimum lease payments, at the inception of the contract.
Assets under construction
Assets under construction are separately reported in note 6. In respect of the HMRC Locations Programme, this includes accommodation refurbishment and furniture assets. Costs are accumulated until the asset is available for use whereupon it is transferred to the relevant asset class and depreciation commences.
1.7.3 Intangible
Developed computer software
Computer software that has been developed by the department and its IT service partners, and for which the department has ownership rights has been capitalised. This capitalisation includes the staff costs for developing, integrating and testing IT software.
Excluding additions in the financial year, and any software formally valued during the year, software assets are revalued annually by applying an index. As the major cost of developing computer software is IT labour costs, the index used is “Office of National Statistics – ‘AWE: Information and Communication Index: Non Seasonally Adjusted Total Pay Including Arrears’. This index focuses on tracking changes in pay within the Information and Communications Industries.
Software licenses
Software licences are capitalised where their useful life is greater than 12 months and value is over £5,000.
Assets under construction
Intangible assets under construction relate to software development by the department, our IT Partners and RCDTS Ltd. Intangible assets under construction are separately reported in note 7. Costs are accumulated until the asset is available for use whereupon it is transferred to the relevant asset class and amortisation commences.
1.8 Pensions
1.8.1 Civil Service Pension Schemes
The PCSPS and the Civil Servants and Others Pension Scheme (CSOPS) known as Alpha, are unfunded and contributory defined benefit schemes. The departmental group recognises the expected cost of these elements. This is determined systematically and rationally over the period during which we benefit from employees’ services by payment to the PCSPS and CSOPS of amounts calculated on an accruing basis. Liability for payment of future benefits is a charge on the PCSPS and CSOPS. Further information can be found within the accounts of Civil Service Pensions.
1.8.2 Local Government Pension Scheme
A number of the VOA employees are members of the LGPS. The LGPS is one of the largest public sector pension schemes in the UK. It is a nationwide defined benefit pension scheme designed for people working in local government or for individuals employed by other organisations who have chosen to participate in it.
Further information can be found within the Valuation Office Agency accounts on GOV.UK.
1.8.3 Partnership pensions
The partnership pension account is a stakeholder pension arrangement with employees able to choose a stakeholder pension product from a panel of providers. The partnership pension account is a defined contribution scheme, provided as an alternative option for members who do not wish to join one of our defined benefit arrangements (classic, classic plus, premium, nuvos and alpha).
1.8.4 Aviva Friends Life plc
A number of RCDTS Ltd employees are members of the Aviva Friends Life plc pension scheme, a contract-based defined contribution pension scheme which is administered by Aviva plc and overseen by the RCDTS Ltd Board.
Further information can be found within the RCDTS Ltd accounts available at Companies House by 31 December 2022.
1.9 Provisions and Contingent liabilities
The department discloses provisions and contingent liabilities in excess of the de minimis limit for reporting of £0.1 million.
We recognise provisions in accordance with IAS 37 (Provisions, Contingent Liabilities and Contingent Assets). The expenditure required to settle the obligation is calculated based on the best available information.
Where the time value of money is significant, provisions and contingent liabilities are stated at discounted amounts, as directed by Revised PES (2021) 10.
1.9.1 Early departure costs
The department is required to meet the additional cost of benefits beyond the normal PCSPS benefits in respect of employees who have taken early departure or retirement under the Civil Service Compensation Scheme. The department has made provision in full for early retirement costs. The estimated risk-adjusted cash flows are discounted at (1.30)% as set by HM Treasury (2020 to 2021: (0.95)%).
1.9.2 Remote Contingent liabilities
For Parliamentary reporting and accountability purposes certain statutory and non-statutory contingent liabilities where the likelihood of a transfer of economic benefit is remote, are disclosed separately, in accordance with the requirements of Managing Public Money. Remote contingent liabilities are reported in the Parliamentary accountability Section.
1.10 Value Added Tax (VAT)
Most of the activities of the department are outside the scope of VAT. A proportion of the activities of the department will attract VAT, and output VAT will apply in these circumstances. The department also has recoverable and non-recoverable elements for input VAT on purchases. Some purchase VAT on a restricted number of services is recovered under Section 41 of the VAT Act 1994 and in accordance with the HM Treasury ‘Contracting-out Direction’. Section 41 is intended to remove any disincentive to government departments of contracting-out activities performed ‘in-house’ where there is a sound basis for doing so. Non-recoverable VAT is charged to the relevant expenditure category or included in the capitalised purchase cost of non-current assets. Income and expenditure is otherwise shown net of VAT.
1.11 Critical accounting judgements and key sources of estimation
The preparation of financial statements in accordance with IFRS requires the use of certain accounting estimates. It also requires management to exercise judgement in the process of applying the department’s accounting policies.
The areas that involve a higher degree of judgement or complexity, or where the assumptions and estimates are significant to the Resource Accounts, are as follows:
COVID-19 support schemes expenditure
On 25 March 2020, the Coronavirus Act 2020 received Royal Assent. Section 76 of the Act referred to HMRC functions stating; “Her Majesty’s Revenue and Customs are to have such functions as the Treasury may direct in relation to coronavirus or coronavirus disease.” Subsequently, for each of the COVID-19 support schemes for which HMRC has had budget and delivery responsibility, HM Treasury have issued specific Treasury direction(s).
HMRC deems the issue of such directions to represent the establishment of a present obligation on the department to transfer the grant.
The HM Treasury direction for the fourth grant of the SEISS had not been issued as at 31 March 2021. Since government could have reversed or amended their policy announcements, HMRC had no present obligation under IAS 37 and related HM Treasury guidance at that date. Accordingly no provision or accrual for the grant was included in the Resource Accounts for 2020 to 2021.
Personal tax credits expenditure
Personal tax credits, reported at note 5.1.1, consist of Child Tax Credit and Working Tax Credit. Receivable and payable balances are based on data from tax credits systems and are used to inform the appropriation of revenue from the Trust Statement, where a cash-based disbursements figure is recorded, to these accounts on an accruals accounting basis. See Note 3.2 Appropriation of revenue to the Resource Accounts for more information.
A range for the estimate of the results of the current year finalisation exercise is also provided. The estimate produced for financial year 2021 to 2022 considers the impact of claimants migrating to DWP under UC throughout 2022 to 2023 using the best available information, the extent to which policies impact on the estimate and utilises the latest compliance information. It is therefore subject to uncertainty.
The accrual for personal tax credits is calculated using the actual split of Working Tax Credit and Child Tax Credit payments made in the current year.
Corporation tax reliefs expenditure
The accounting policy for corporation tax reliefs is a judgement in the context of these accounts because management has determined an appropriate policy for recognition and measurement in the absence of a specific accounting standard. In adopting the current policy, we have selected a recognition point that maintains consistency between relief expenditure recognised in these accounts and the related CT income recognised in the Trust Statement.
Expenditure is recognised for corporation tax reliefs in advance of claims being received because of the timing difference between when qualifying expenditure is incurred by companies and when they make claims. Estimation uncertainty results from this timing difference because assumptions about qualifying expenditure need to be made based on historic experience and the expected amounts need to be adjusted to reflect forecast growth rates policy and rates.
The key assumptions in the estimates for corporation tax reliefs are:
- the forecast growth rate
- the proportion of company tax returns for the latest year’s outturn data used in the estimate that have not been received or processed at the time the data extract is taken for the estimate (referred to as the “uplift factor”)
Note 5.1.4 Corporation tax reliefs provides further detail on the estimation uncertainty relating to corporation tax reliefs.
Impairment of receivables
Receivables in the SoFP are reported after impairment, which is estimated based on our analysis of existing receivables and historical trends in debt recovery, losses, discharges, amendments and cancellations.
The following receivables balances have been impaired: personal tax credits, Child Benefit, law costs, and other receivables. See Note 9 Trade receivables, financial and other assets for more information.
To calculate the impairment for personal tax credits receivables we use an Expected Credit Losses (ECL) model that estimates future debt recoverability of personal tax credits debt based on historic debt recovery rates.
The main judgements that we have made when producing the ECL model are:
- a value for new debts is given by the yearly evolution of the debt stock less remissions, transfers and recoveries
- recent debt recovery experience is a reasonable proxy for recovery rates that inform our scenario analysis
- the migration of claimants to UC affects debt movements and it is therefore necessary to assess the effect of HMRC debt recovery efficiency in isolation from the effect of the rate of transition to Universal Credit
- external future economic developments will not significantly affect recovery rates
- the discount rate applied to future recoveries is 1.9%, in accordance with Public Expenditure System papers published for government by HM Treasury
- the consideration of the following three debt scenarios: the upper scenario considers the past 3 years debt recovery rates, takes the highest recovery rate and applies that rate to future recoveries; the middle (base) scenario takes the last complete year’s debt recovery rate and applies that to future recoveries and the lower scenario considers the past 3 years debt recovery rates, takes the lowest recovery rate and applies that rate to future recoveries
The model assumes the upper and lower recovery scenarios will occur with a 10% likelihood and the base scenario with an 80% likelihood.
Provisions and contingent liabilities
The department undertakes a quarterly review of provisions and contingent liabilities. These are estimated by appropriate business areas based on the likelihood of a liability materialising.
1.12 Impending application of newly issued accounting standards not yet effective
New and revised standards and interpretations have been issued but are not yet effective and have not therefore been adopted in this account.
IFRS 16 Leases
Due to the impact of COVID-19 on government departments, the implementation date for IFRS 16 Leases was deferred to 1 April 2022, although departments could elect to early adopt. The department has agreed with HM Treasury that we will adopt IFRS 16 from 1 April 2022.
IFRS 16 Leases replaces IAS 17 Leases and fundamentally changes the accounting treatment of leases for lessees. The current IAS 17 model, which requires entities to distinguish between finance leases (on SoFP) and operating leases (off SoFP) will be replaced by a ‘right-of-use’ model that requires lessees to recognise on SoFP their right-of-use of assets and associated liabilities.
At the date of initial application, HM Treasury mandate that as a practical expedient, an entity is not required to reassess whether a contract is, or contains, a lease. Therefore, HMRC will apply this Standard to all contracts previously identified as leases applying IAS 17 and IFRIC 4 Determining Whether an Arrangement Contains a Lease, and not apply this Standard to contracts that were not previously identified as containing a lease applying IAS 17 and IFRIC 4.
On transition, HMRC will recognise right-of-use assets and liabilities for leases with a term of more than 12 months remaining at 1 April 2022, unless the underlying asset is of low value.
HMRC will use a discount rate provided by HM Treasury when they cannot readily obtain the rate implicit in the lease contract. The PES discount rate provided by HM Treasury to use where entities cannot readily determine the interest rate implicit in a lease on transition to IFRS 16 on 1 April 2022 is 0.95%.
HM Treasury mandate that IFRS 16 in the public sector will be implemented using the cumulative catch-up method, therefore comparatives for 2021 to 2022 will not be restated and the cumulative effect of initially applying the Standard at 1 April 2022 will be recognised as an adjustment to taxpayers’ equity.
HMRC will apply the recognition and measurement exemption for short-term leases, recognising the lease payments associated with those leases as an expense on a straight-line basis over the lease term (or another systemic basis if more representative of the pattern of HMRC’s benefit) in the CSoCNE.
The impact of implementation of IFRS 16 is currently considered to increase the value of assets by approximately £1.1 billion and the value of lease liabilities by approximately £1.4 billion at 1 April 2022.
The total liabilities and total right-of-use assets recognised on initial application of IFRS 16 will be lower than the value of the minimum lease commitments under IAS 17 in Note 8.1: Commitments under leases. This main reasons for this are; lease commitments were recognised under IAS 17 on an irrecoverable VAT basis whereas lease liabilities under IFRS 16 exclude VAT, the discounting of leases under IFRS 16 not previously discounted under IAS 17, and the inclusion in note 8.1 of an Agreement for Lease for one property for which the lease has not yet commenced.
IFRS 17 Insurance Contracts
IFRS 17 is the new accounting standard for Insurance Contracts and aims to make risk transfer contracts more comparable between entities. While the standard, which will replace IFRS 4: Insurance Contracts, will be effective for annual reporting periods beginning on or after 1 January 2023, an implementation date for government is still subject to confirmation. HMRC will be engaging in the cross-government consultation process to assess the impacts of the new standard.
2. Expenditure
| Note | Core department and agency (2021-22 £m) | Departmental group (2021-22 £m) | Core department and agency (2020-21 £m) | Departmental group (2020-21 £m) | |
|---|---|---|---|---|---|
| COVID-19 support schemes | |||||
| Coronavirus Job Retention Scheme | 4 | 8,200.9 | 8,200.9 | 60,677.4 | 60,677.4 |
| Self-Employment Income Support Scheme | 4 | 8,343.4 | 8,343.4 | 19,716.1 | 19,716.1 |
| Eat Out to Help Out | 4 | (0.7) | (0.7) | 839.8 | 839.8 |
| Working Households Receiving Tax Credits | 4 | 719.1 | 719.1 | – | – |
| 17,262.7 | 17,262.7 | 81,233.3 | 81,233.3 | ||
| Personal tax credits | 5.1.1 | 10,605.5 | 10,605.5 | 15,063.2 | 15,063.2 |
| Corporation tax reliefs | 5.1.4 | 11,692.8 | 11,692.8 | 10,696.1 | 10,696.1 |
| Child Benefit | |||||
| Child Benefit (note 1) | 11,420.0 | 11,420.0 | 11,473.8 | 11,473.8 | |
| Guardian’s Allowance (funded from National Insurance Fund) | 3.8 | 3.8 | 2.5 | 2.5 | |
| 11,423.8 | 11,423.8 | 11,476.3 | 11,476.3 | ||
| Tax-Free Childcare | 428.4 | 428.4 | 253.0 | 253.0 | |
| Lifetime ISA | 418.9 | 418.9 | 346.1 | 346.1 | |
| Help to Save | 20.4 | 20.4 | 67.9 | 67.9 | |
| Staff and related costs | Staff costs | ||||
| Wages and salaries | 2,176.0 | 2,202.2 | 2,037.3 | 2,064.9 | |
| Other pension costs | 559.9 | 562.1 | 509.0 | 511.2 | |
| Less capitalised costs | (51.6) | (51.6) | (38.8) | (38.8) | |
| Social security costs | 219.1 | 222.2 | 196.7 | 199.8 | |
| Travel, subsistence and hospitality | 16.5 | 16.5 | 13.3 | 13.3 | |
| Recruitment and training | 26.5 | 26.5 | 23.0 | 23.1 | |
| Early severance schemes | 4.0 | 4.0 | 4.8 | 4.8 | |
| 2,950.4 | 2,981.9 | 2,745.3 | 2,778.3 | ||
| Service charges | |||||
| IT Public Private Partnership contract (PPP) payments | 136.2 | 136.2 | 152.2 | 152.2 | |
| Accommodation PFI and non-PFI contract payments | 36.7 | 36.7 | 151.3 | 151.3 | |
| Accommodation interest charges | 8.8 | 8.8 | 19.7 | 19.7 | |
| Indexation of liability on PFI deals | 0.8 | 0.8 | 1.7 | 1.7 | |
| IT Public Private Partnership interest charges | 1.5 | 1.5 | 1.4 | 1.4 | |
| 184.0 | 184.0 | 326.3 | 326.3 | ||
| Goods and services | |||||
| IT services and consumables | 933.0 | 896.5 | 731.5 | 692.0 | |
| Contracted out services | 301.9 | 301.9 | 218.6 | 218.6 | |
| Printing, postage, stationery and office supplies | 51.8 | 51.8 | 47.4 | 47.4 | |
| Legal and investigation | 35.1 | 35.1 | 36.9 | 36.9 | |
| Telephone expenses | 38.7 | 38.7 | 46.4 | 47.7 | |
| Enforcement costs | 37.5 | 37.5 | 38.8 | 38.8 | |
| Other goods and services | 17.6 | 17.6 | 15.0 | 15.0 | |
| Consultancy | 1.8 | 1.8 | 8.6 | 8.6 | |
| 1,417.4 | 1,380.9 | 1,143.2 | 1,105.0 | ||
| Payments in lieu of tax relief and rates | 212.5 | 212.5 | 220.3 | 220.3 | |
| Other cash expenditure | |||||
| Accommodation expenses | 252.9 | 252.9 | 219.5 | 219.5 | |
| Other operating leases | 157.4 | 157.4 | 90.8 | 90.8 | |
| National Insurance Fund other government department collection service | 52.0 | 52.0 | 50.4 | 50.4 | |
| Losses and special payments (excluding Child Benefit, tax credits and COVID-19 support schemes) | 4.7 | 4.7 | 4.9 | 4.9 | |
| Auditors remuneration and expenses (note 2) | 0.1 | 0.1 | – | 0.1 | |
| Other | 12.7 | 13.3 | 58.6 | 59.2 | |
| 479.8 | 480.4 | 424.2 | 424.9 | ||
| Non-cash items: | |||||
| Amortisation, depreciation and impairments | |||||
| Amortisation | 7 | 114.4 | 114.4 | 266.4 | 266.4 |
| Depreciation | 6 | 74.2 | 74.4 | 58.6 | 58.7 |
| Loss on impairment of non-current assets | 19.3 | 19.3 | 3.8 | 3.8 | |
| 207.9 | 208.1 | 328.8 | 328.9 | ||
| Provisions for liabilities and charges | 12 | (2.7) | (2.7) | 48.1 | 48.1 |
| Other non-cash | |||||
| Transfer of personal tax credits receivables to DWP | 676.0 | 676.0 | 325.6 | 325.6 | |
| Auditors remuneration and expenses (note 2) | 2.0 | 2.0 | 2.0 | 2.0 | |
| Other | 68.8 | 68.8 | 15.5 | 15.5 | |
| 746.8 | 746.8 | 343.1 | 343.1 | ||
| Total non-cash items | 952.0 | 952.2 | 720.0 | 720.1 | |
| Total operating expenditure | 58,048.6 | 58,044.4 | 124,715.2 | 124,710.8 |
Note 1: Child Benefit expenditure includes amounts paid to higher rate taxpayers earning greater than £50,000 per annum. It is estimated that £465 million (2020 to 2021: £444 million) will be recovered via future Income Tax charges arising from payments of Child Benefit to those earning over £50,000 in 2021 to 2022. These Income Tax charges are accounted for in the Trust Statement. The comparative has been restated.
Note 2: The NAO did not undertake any work of a non-audit nature during the period.
3. Statement of operating expenditure by operating segment
This note shows how resource expenditure is apportioned against the main areas of core business activity.
Each segment relates to a core business activity reported to the Chief Executive and the Board. This management information covers expenditure and income and is used by the Board to inform decisions.
A revised approach to determining segment values has resulted in the restatement of comparatives.
3.1 Expenditure and income by reportable segment
| Gross expenditure (2021-22 £m) | Income (2021-22 £m) | Net expenditure (2021-22 £m) | Gross expenditure (2020-21 £m) | Income (2020-21 £m) | Net expenditure (2020-21 £m) | |
|---|---|---|---|---|---|---|
| Reportable segment | ||||||
| Customer Services | 868.0 | 33.1 | 834.9 | 853.8 | 26.5 | 827.3 |
| Customer Strategy and Tax Design | 208.7 | 17.1 | 191.6 | 187.3 | 15.1 | 172.2 |
| Customer Compliance | 1,391.8 | 84.9 | 1,306.9 | 1,242.1 | 75.6 | 1,166.5 |
| Solicitors Office and Legal Services | 100.7 | 7.5 | 93.2 | 118.4 | 6.5 | 111.9 |
| Borders and Trade | 485.0 | 5.1 | 479.9 | 404.1 | 6.9 | 397.2 |
| Chief Digital and Information Officer Group | 959.2 | 47.1 | 912.1 | 897.0 | 40.8 | 856.2 |
| Chief Finance Officer Group | 645.9 | 170.1 | 475.8 | 663.8 | 217.7 | 446.1 |
| Chief People Officer Group | 115.8 | 8.8 | 107.0 | 108.8 | 7.8 | 101.0 |
| Chief Executive Office | 2.2 | – | 2.2 | 2.8 | 0.1 | 2.7 |
| Transformation group | 133.9 | 0.5 | 133.4 | 48.2 | 1.7 | 46.5 |
| Communications | 20.9 | 0.1 | 20.8 | 19.4 | 0.1 | 19.3 |
| Valuation Office Agency | 207.3 | 42.5 | 164.8 | 194.9 | 40.2 | 154.7 |
| Total | 5,139.4 | 416.8 | 4,722.6 | 4,740.6 | 439.0 | 4,301.6 |
3.2 Reconciliation between operating segments and Consolidated Statement of Comprehensive Net Expenditure
Information on all other net expenditure is included in the table below. This information is reported to the Board, however as it is centrally managed it is reported in a different format than the reportable segments in the management accounts which compares budgeted spend to full year forecast spend at the segment level.
Reconciliation between operating segments and Consolidated Statement of Comprehensive Net Expenditure
| 2021-22 £m | 2020-21 £m | |
|---|---|---|
| Total net expenditure reported for operating segments | 4,722.6 | 4,301.6 |
| COVID-19 schemes | 17,262.7 | 81,233.3 |
| Personal tax credits | 10,605.5 | 15,063.2 |
| Child Benefit and Child Trust Fund | 11,423.8 | 11,476.3 |
| Corporation tax reliefs | 11,692.8 | 10,696.1 |
| Lifetime ISA | 418.9 | 346.1 |
| Depreciation/Amortisation/Impairment | 202.2 | 318.6 |
| Transfer of personal tax credits receivables to DWP | 676.0 | 325.6 |
| Tax-Free Childcare | 428.4 | 253.0 |
| Help to Save | 20.4 | 67.9 |
| Payments in lieu of tax relief | 130.0 | 140.1 |
| Payments of Local Authority Rates | 78.1 | 75.6 |
| Net Operating Expenditure in Statement of Comprehensive Net Expenditure | 57,661.4 | 124,297.5 |
4. COVID-19 support schemes
The COVID-19 support schemes have been created as part of the government’s response to the coronavirus pandemic. In the financial year 2021 to 2022, HMRC had delivery responsibility and funding from HM Treasury for the CJRS, SEISS, Working Households Receiving Tax Credits (WHRTC) and continued to manage transactions relating to EOHO.
We have also administered the SSPR on behalf of the DWP since the launch in May 2020. DWP has both policy responsibility and the associated Annually Managed Expenditure funding for SSPR. Payments made by HMRC in respect of SSPR claims are therefore on behalf of DWP and the expenditure on SSPR claims is recognised in DWP’s CSoCNE. At 31 March 2022, we recognised a receivable on the CSoFP in respect of amounts due from DWP for SSPR claims.
4.1 COVID-19 support schemes expenditure
The expenditure for CJRS for the financial year 2021 to 2022 includes claims for employees furloughed during the period 1 April 2021 to closure on 30 September 2021. Accrued expenditure relates to claims for this period approved for payment after 31 March 2022.
The SEISS expenditure for financial year 2021 to 2022 includes the fourth and fifth tranches of these grants.
For the financial year 2021 to 2022, repayments of EOHO grants exceeded payments.
Note 1.11 explains the accounting judgements in respect of the CJRS, SEISS, WHRTC and EOHO expenditure.
Analysis of COVID-19 support scheme expenditure
| Claims approved (2021-22 £m) | Repayments (2021-22 £m) | Accrual (2021-22 £m) | Expenditure (2021-22 £m) | Claims approved (2020-21 £m) | Repayments (2020-21 £m) | Accrual (2020-21 £m) | Expenditure (2020-21 £m) | |
|---|---|---|---|---|---|---|---|---|
| Coronavirus Job Retention Scheme (note 1 ) | 8,725.2 | (525.6) | 1.3 | 8,200.9 | 59,098.9 | (829.2) | 2,407.7 | 60,677.4 |
| Self-Employment Income Support Scheme | 8,371.7 | (28.4) | 0.1 | 8,343.4 | 19,745.1 | (29.3) | 0.3 | 19,716.1 |
| Working Households Receiving Tax Credits | 718.9 | – | 0.2 | 719.1 | – | – | – | – |
| Eat Out to Help Out | – | (0.7) | – | (0.7) | 841.9 | (2.1) | – | 839.8 |
| Total | 17,815.8 | (554.7) | 1.6 | 17,262.7 | 79,685.9 | (860.6) | 2,408.0 | 81,233.3 |
Note 1: Repayments consist of £447.8 million repaid and overpayments of £77.8 million deducted from subsequent payments in 2021 to 2022 (£542.0 million repaid and overpayments of £287.2 million deducted from subsequent payments in 2020 to 2021).
Repayments
Repayments occur when customers entitled to a grant choose to repay it, or when customers repay following a prompt from HMRC or an unprompted disclosure. Amounts recovered through tax returns and tax charges are not included in these Resource Accounts and are recorded in the Statement of Revenue, Other Income and Expenditure in the Trust Statement.
Losses
The COVID-19 support schemes expenditure for financial year 2021 to 2022 includes £2.6 million in respect of losses; CJRS £0.8 million, SEISS £0.3 million, WHRTC £1.5 million and EOHO £0.0 million (2020 to 2021 includes £22.8 million in respect of losses – CJRS £8.7 million, SEISS £14.1 million and EOHO £0.0 million). These losses can be remissions or write-offs and relate to a very small proportion of claimants. Remission is the process used to identify and separate money owed to HMRC which we have decided not to pursue – for example, on the grounds of value for money. Write-offs is the term used to describe money owed to HMRC that was considered to be irrecoverable – for example, because there were no practical means for pursuing it. The Losses Statement reported in the Parliamentary accountability section provides further detail on the number of losses cases.
4.2 COVID-19 support schemes error and fraud
HMRC analysts have prepared provisional estimates for CJRS and SEISS for the 2021 to 2022 financial year, and provided updated provisional estimates for error and fraud for CJRS and SEISS for the 2020 to 2021 financial year. These estimates of error and fraud are calculated before HMRC’s post-payment compliance activity.
For CJRS, there is now a stronger evidence base than for the estimate included in the 2020 to 2021 Annual Report and Accounts, which relied on assembling evidence from a variety of internal HMRC and external evidence sources. Figures for 2020 to 2021 have therefore been revised.
These latest provisional estimates for CJRS uses results from a Random Enquiry Programme (REP) for claim periods from March 2020 to 30 June 2020 and from 1 July 2020 to 31 October 2020, but still include some necessary assumptions. For example, the findings from the REP have been extrapolated to the end of the scheme, and we also use evidence from internal HMRC sources and third-party survey data to estimate and correct for non-detection of risks by the REP.
For SEISS, more recent compliance data and Income Tax Self Assessment data for 2020 to 2021 means that we have been able to carry out more sophisticated statistical modelling, using data more representative of the scheme, rather than relying on assumptions from wider HMRC data sources.
There is still some uncertainty in the estimates and there is a medium probability that the figures will be revised in future, upon receipt of further information. The estimates presented in the table are the most likely estimates for CJRS and SEISS, together with simulated 95% confidence intervals, based on each phase of the schemes.
The WHRTC error and fraud estimate is calculated following HMRC’s sample testing of the tax credits finalised awards for 2020 to 2021, undertaken to produce the personal tax credits error and fraud estimate for 2020 to 2021. We then identify those customers whose claims were found to be fraudulent in the personal tax credits testing who were also in receipt of WHRTC. The results for fraud are then weighted, and instances of error added, to give a full population estimate of WHRTC error and fraud.
See COVID-19 support schemes error and fraud for further information on the error and fraud rates in the COVID-19 support schemes, the actions we have taken and ongoing post-payment compliance activity.
Provisional assessment of the value of COVID-19 support schemes error and fraud
| Lower bound (2021-22 £m) | Most likely (2021-22 £m) | Upper bound (2021-22 £m) | Lower bound (2020-21 £m) | Most likely (2020-21 £m) | Upper bound (2020-21 £m) | |
|---|---|---|---|---|---|---|
| Coronavirus Job Retention Scheme (note 1) | 172 (2.0%) | 241 (2.8%) | 319 (3.7%) | 2,246 (3.7%) | 3,218 (5.3%) | 4,614 (7.6%) |
| Self-Employment Income Support Scheme (note 2) | 292 (3.5%) | 376 (4.5%) | 526 (6.3%) | 473 (2.4%) | 631 (3.2%) | 808 (4.1%) |
| Working Households Receiving Tax Credits | 3 (0.4%) | 3 (0.5%) | 4 (0.6%) | – | – | – |
| Eat Out to Help Out | – | – | – | 43 (5.1%) | 71 (8.5%) | 99 (11.8%) |
| COVID-19 support schemes | 467 | 620 | 849 | 2,762 | 3,920 | 5,521 |
Note 1: Revised figures from 2020 to 2021 (CJRS: Lower bound £4,065 million, 6.7%; Most likely £5,279 million, 8.7%; Upper bound £7,281 million, 12.0%).
Note 2: Revised figures from 2020 to 2021 (SEISS: Lower bound £355 million, 1.8%; Most likely £493 million, 2.5%; Upper bound £631 million, 3.2%).
5. Tax credits and Child Benefit
5.1 Tax credits
Since the 2011 to 2012 financial year, personal tax credits expenditure and certain corporation tax reliefs have been reported in these Accounts. Tax credits can comprise of both an element that is treated as negative taxation, being the extent to which the relief is less than or equal to the recipient’s tax liability, and an element that is in excess of the tax liability, being a payment of entitlement. Only those credits that include a payment of entitlement are reported in these accounts.
5.1.1 Analysis of personal tax credits expenditure
Personal tax credits consist of Child Tax Credit and Working Tax Credit. The apportionment of expenditure between Child Tax Credit and Working Tax Credit shown in the table below is estimated. See Note 1.11 for the estimation techniques used.
Awards are assessed and paid throughout the financial year on a provisional basis, based on claimants’ assessments of their personal circumstances.
Claims are adjusted after the end of each award year, once claimants’ actual circumstances are known, this is called Finalisation. Finalisation may give rise to under or overpayments which are accounted for as soon as identified. Finalisation is not complete until after the Resource Account has been published, consequently there is uncertainty around the level of adjustments likely to arise.
To support customers during the COVID-19 pandemic, the basic element for Working Tax Credit was temporarily increased by £1,045 for the year from 6 April 2020 until 5 April 2021 and is reflected in personal tax credits expenditure.
Total personal tax credits expenditure has decreased by £4.5 billion from 31 March 2021 to 31 March 2022 due to the continued migration of customers to UC.
Analysis of personal tax credits expenditure
| Child Tax Credit (2021-22 £m) | Working Tax Credit (2021-22 £m) | Total tax credits (2021-22 £m) | Child Tax Credit (2020-21 £m) | Working Tax Credit (2020-21 £m) | Total tax credits (2020-21 £m) | |
|---|---|---|---|---|---|---|
| Tax credits | 8,379.3 | 2,069.0 | 10,448.3 | 11,776.7 | 3,179.1 | 14,955.8 |
| Movement in impairments of receivables | 104.8 | 22.6 | 127.4 | 41.9 | 12.4 | 54.3 |
| Remissions/write-offs | 21.2 | 8.6 | 29.8 | 36.7 | 16.4 | 53.1 |
| Total personal tax credits | 8,505.3 | 2,100.2 | 10,605.5 | 11,855.3 | 3,207.9 | 15,063.2 |
For further information on the operation of personal tax credits visit the HMRC page on GOV.UK.
5.1.2 Personal tax credits receivables
Where under or overpayments are identified, either during the award year or subsequently, adjustments are made to expenditure. Overpayments are treated as receivables and the department seeks to recover these from future personal tax credits awards or through direct repayment.
The DWP has responsibility for recovering personal tax credits debt for customers who have made a claim to UC. DWP is also responsible for taking on the debt of customers who have fallen out of the tax credits regime and for whom a direct earnings attachment can be used to recover the debt. HMRC started to transfer this debt in 2019 to 2020. In line with the FReM, debt transfers are treated as capital grants in kind in the Financial Statements. The debt stock is impaired under IFRS 9 (Financial Instruments) and in line with HMRC policy.
Personal tax credits receivables
| Note | 2021-22 £m | 2020-21 £m | |
|---|---|---|---|
| Receivables as at 1 April | 4,302.2 | 4,843.2 | |
| Adjustment to prior year finalisation estimate | (1.2) | 171.4 | |
| Estimated overpayment of awards prior to finalisation (note 1) | 247.0 | 413.0 | |
| Overpayments identified from change of circumstances in year | 824.0 | 434.4 | |
| Transferred to DWP (note 2) | (1,440.7) | (706.2) | |
| Recoveries made | (574.7) | (800.5) | |
| Remissions/write-offs | (29.8) | (53.1) | |
| Receivables as at 31 March | 3,326.8 | 4,302.2 | |
| Impairment as at 1 April | 2,283.7 | 2,610.0 | |
| – Transferred to DWP (note 3) | (764.7) | (380.6) | |
| – Movement in impairment | 127.4 | 54.3 | |
| Impairment at 31 March | 1,646.4 | 2,283.7 | |
| Net receivables at 31 March | 1,680.4 | 2,018.5 | |
| Of which: | |||
| Amounts expected to be recovered within one year | 9 | 486.4 | 653.5 |
| Amounts expected to be recovered in more than one year | 9 | 1,194.0 | 1,365.0 |
| Total | 1,680.4 | 2,018.5 |
Note 1: The range of the estimate is £130 million to £360 million (2020 to 2021: £195 million to £540 million).
Note 2 and Note 3: Summary of Receivables transferred to DWP
| Gross receivables | 1,440.7 | 706.2 | |
| Impairments | (764.7) | (380.6) | |
| Net receivables transferred to DWP | 676.0 | 325.6 |
Personal tax credits Expected Credit Loss (ECL)
HMRC routinely assess likely recovery of debts, accepting that the individual credit risk associated with these debts increases as they age. However, the credit risk itself is not routinely assessed because the debts relate to overpayments made to benefit claimants, and not to lending through formal arrangements.
As simple financial instruments, the debts are impaired over their lifetime as required under the FReM (Chapter 8.2, Table 2, Interpretation 6).
The credit loss we recognise is the difference between the cash flows that are due to HMRC, in accordance with our contractual relationship with our customers, and the cash flows that we expect to receive.
The main data inputs to the model are historic monthly stocks and flows of debt (including recoveries, remissions and transfers to DWP), tax credit expenditure forecasts, the finalisation estimate, and the claimant migration profile to UC.
The key assumptions/judgements included in the ECL model are included in Note 1.11.
HMRC have explored possible correlations between the unemployment rate and live recovery of personal tax credits debt; and between the Average Earnings Index and Consumer Price Index and direct recovery of personal tax credits debt. After testing, no robust relationships were found between these economic determinants and debt recovery, therefore forecasts of future economic conditions are not included in our ECL model. We therefore consider historic recovery experience to be a suitable proxy for future debt recovery.
The impairment is calculated in yearly bandings with historic recovery rates for each year being applied to cover the entire aged debt balance. The table below provides a summary of the impairment information:
| Gross receivable £m | Impairment £m | Net receivable £m | |
|---|---|---|---|
| Total HMRC debt | 3,326.8 | 1,646.4 | 1,680.4 |
| of which debt less than 1 year old | 434.4 | 99.1 | 335.3 |
| of which debt more than 1 but less than 5 years old | 1,113.0 | 349.4 | 763.6 |
| of which debt more than 5 but less than 10 years old | 1,077.9 | 593.5 | 484.4 |
| of which debt more than 10 years old | 701.5 | 604.4 | 97.1 |
Sensitivity analysis
There is a significant degree of uncertainty around the assumptions that underpin the ECL model. The sensitivity analysis below provides an indication of the impact on the estimate if key assumptions were to change.
| Scenario | Change to impairment as a percentage of gross receivables | Change to impairment £m |
|---|---|---|
| The upper recovery scenario was applied to 100% of the debt stock (as opposed to 10%). | -2% | (75.0) |
| The lower recovery scenario was applied to 100% of the debt stock (as opposed to 10%). | 7% | 243.0 |
Personal tax credits finalisation
HMRC analysts provide an estimated range for the results of the current year finalisation exercise and the estimate disclosed represents the most-likely point within the range. The range is obtained by assessing the level of overpayment created in current and previous years and then considering the impact of other factors. The lower end of the range is £130 million and the upper end is £360 million.
The estimate produced for 2021 to 2022 considers the impact of claimants migrating to UC in the next financial year using the best available information. The impacts of COVID-19 are not considered to be material to these calculations.
5.1.3 Personal tax credits error and fraud
HMRC measures the overall level of error and fraud by investigating a random sample of finalised awards, although because of the design of the tax credits scheme this cannot be completed until after claimants have finalised their awards for the preceding year. Some claimants, such as those taxpayers included within Self Assessment, may not finalise their awards for the preceding year until 31 January. HMRC used a tried and tested estimation methodology for the calculation of the finalisation estimate supported by annual review.
In arriving at our personal tax credits estimates we consider two types of uncertainty – variance, which is a consequence of the sample size, and bias. In particular, we seek to manage the risk of potential bias through customer non-response in several ways including; ensuring that compliance officers are in a position to make a valid decision without customer response, completion of extensive quality checks of error and fraud cases, and monitoring of the outcome of non-response cases against those where customers do respond.
For error and fraud in the claimant’s favour, the difference in the proportion of cases that are incorrect is not statistically significant. Consequently, HMRC have no concerns about non-response causing bias in the statistics for error and fraud favouring the claimant. For error in HMRC’s favour, the difference in the proportions is statistically significant, but for HMRC to consider making an adjustment we would need a high level of certainty that we would find more errors on these cases if the customer did respond, and no evidence is held to suggest this. Consequently, no adjustment is made to the estimate of error and fraud favouring the claimant or HMRC to account for non-response.
HMRC completed its testing on finalised awards for 2020 to 2021, based on a random sample of 3,000 enquiries. As shown in the table below, the central estimate of error and fraud overpayment rate has decreased by 0.3% to 5.0% and the central estimate of error and fraud underpayment rate has decreased by 0.1% to 0.8%, from the 2019 to 2020 estimates.
Please see the Tax credits error and fraud section for more detail.
Estimated value of personal tax credits error and fraud and as a percentage of final award value
| Lower bound (2020-21 £m) | Central estimate (2020-21 £m) | Upper bound (2020-21 £m) | Lower bound (2019-20 £m) | Central estimate (2019-20 £m) | Upper bound (2019-20 £m) | |
|---|---|---|---|---|---|---|
| Overpayments to claimants | 690 (4.4%) | 780 (5%) | 880 (5.7%) | 850 (4.8%) | 940 (5.3%) | 1,040 (5.9%) |
| Underpayments to claimants | 100 (0.6%) | 120 (0.8%) | 140 (0.9%) | 140 (0.8%) | 170 (0.9%) | 200 (1.1%) |
5.1.4 Corporation tax reliefs
In certain circumstances, companies are permitted to reduce their tax liability by making a claim for corporation tax reliefs. To be entitled to these reliefs, a company must be undertaking specific activities and meet the criteria set out for that relief. The corporation tax reliefs reported in these Resource Accounts are reliefs where there is or could be, by their design, a payable element that is in excess of any negative taxation. Other corporation tax reliefs are included in the Trust Statement.
Corporation tax reliefs
| 2021-22 £m | 2020-21 £m | |
|---|---|---|
| Research and development: | ||
| Small and Medium Enterprises (SME) scheme | 5,895.6 | 5,485.8 |
| Research and development expenditure credits (RDEC) | 3,620.4 | 3,839.3 |
| Creative industries: | ||
| High-end Television Tax Relief | 867.1 | 583.0 |
| Film Tax Relief | 829.0 | 424.7 |
| Video Games Tax Relief | 246.3 | 224.0 |
| Theatre Tax Relief | 104.0 | 41.7 |
| Animation Tax Relief | 23.5 | 20.4 |
| Children’s Television Tax Relief | 23.4 | 13.9 |
| Orchestra Tax Relief | 21.8 | 12.8 |
| Museums and Galleries Tax Relief | 15.1 | 9.2 |
| Land Remediation Relief | 46.8 | 40.9 |
| Enhanced Capital Allowance | 0.2 | 0.2 |
| Vaccine Research Relief (note 1) | (0.4) | 0.2 |
| Total | 11,692.8 | 10,696.1 |
Note 1: Relief ceased in 2016 to 2017.
In accordance with our accounting policy set out in note 1.5.2 Corporation tax reliefs, of the expenditure reported in 2021 to 2022 above, £2,049.2 million relates to our final estimate for 2016 to 2017:
Expenditure relating to 2016 to 2017:
| Estimate reported in 2016-17 (£m) | Final estimate (£m) | Included in value reported in these Accounts (£m) | |
|---|---|---|---|
| Research and development SME | 1,358.0 | 2,263.3 | 905.3 |
| Research and development RDEC | 1,379.2 | 2,224.0 | 844.8 |
| Creative industries | 611.8 | 907.0 | 295.2 |
| Land Remediation | 28.5 | 32.8 | 4.3 |
| Vaccine Research | 2.2 | 1.8 | (0.4) |
| Total | 3,379.7 | 5,428.9 | 2,049.2 |
Corporation tax reliefs expenditure and related accruals are estimated using analysis of historic relief claims and applying forecast growth and uplift assumptions, and adjustments made for planned changes in relevant policy and rates, by the department’s statisticians. An estimate is required due to the time-lag between the end of companies’ accounting periods and the submission of their company tax returns, as explained in note 1.5.2 Corporation tax reliefs. The settled values for 2016 to 2017 are reported in 2021 to 2022.
Research and development tax relief
The cut-off date for data used in the research and development tax relief estimate for the financial year 2021 to 2022 was claims for the 2020 to 2021 financial year processed by 31 January 2022. The cut-off date for data used in the financial year 2020 to 2021 was claims for the 2019 to 2020 financial year processed by 30 April 2021. The percentage uplift factor applied for claims not received at the cut-off date has increased due to the comparatively earlier cut-off date used for the estimate for the financial year 2021 to 2022:
- uplift applied to R&D SME claims: for negative taxation element 61% (2020 to 2021 33%); for payment element 25% (2020 to 2021 15%)
- uplift applied to R&D Expenditure Credit (RDEC) claims: 41% (2020 to 2021 24%)
The forecast growth assumption used for the 2021 to 2022 R&D reliefs estimates are:
- R&D expenditure, on which RDEC is claimed, will grow at 8.7% in 2021 to 2022 (calculated as the OBR ICC determinant which includes effect of COVID-19)
- R&D expenditure, on which R&D SME relief is claimed, will grow by 18.2% in 2021 to 2022 (calculated as the OBR ICC determinant plus an additional expenditure growth rate of 9.5% to reflect the fact that R&D SME growth has exceeded the OBR ICC determinant in recent years)
In 2020 to 2021 R&D tax reliefs, the forecast growth rate assumption for RDEC and R&D SME was calculated as the average growth rate from the last three years weighted by sector plus a COVID-19 adjustment based on an estimate of the proportion of past R&D claimants who have accessed CJRS and the proportion of their employees that were furloughed. For 2021 to 2022 estimate, we have returned to using the OBR ICC determinant in the forecast growth assumption.
Sensitivity analysis has been applied to understand the degree of uncertainty in the estimates if the key assumptions underpinning them were to change. The range estimates set out in the table below are based on judgments of the levels of uncertainty, and it is possible that actual values may exceed them. At time of publication the full impact of COVID-19 on corporation tax reliefs is unknown and this increases the level of uncertainty for these estimates.
| Change to key assumption: | Change in assumption | Variation £m | Change in assumption | Variation £m |
|---|---|---|---|---|
| R&D SME uplift for 2020 to 2021 vary by up to 5% (note 1) | Increase by 5% | 153 | Decrease by 5% | (153) |
| RDEC uplift for 2020 to 2021 varies by up to 12% (note 1) | Increase by 12% | 214 | Decrease by 12% | (214) |
| R&D SME expenditure growth in 2021 to 2022 varies by up to +11%/-10% (note 2) | Increase by 11% | 465 | Decrease by 10% | (403) |
| RDEC expenditure growth in 2021 to 2022 varies by up to +12%/-7% (note 3) | Increase by 12% | 315 | Decrease by 7% | (262) |
Note 1: For the R&D SME and RDEC uplift factors, the change to the key assumption is based on maximum variations seen in recent years scaled for the January 2022 cut-off date for data.
Note 2: For the R&D SME expenditure growth, the increase is based on the upper-end of the range being the highest growth in last 3 years and the decrease is based on the lower-end of the range being OBR ICC determinant with no additional growth rate.
Note 3: For the RDEC expenditure growth, the increase is based on the upper end of the range being the expenditure returns to 2019 to 2020 levels for 2021 to 2022, and the decrease is based on the lower end of the range being the average expenditure growth in the last 3 years.
Creative industries reliefs
The key assumptions underpinning the creatives industries reliefs are similar to those used for R&D relief.
For Film Tax Relief and High-End Television Tax Relief, the two largest creative industries reliefs, the cut-off date for data used in the estimate for the financial year 2021 to 2022 was claims processed for the financial year 2020 to 2021 by 8 March 2022. The forecast growth rate assumption used for financial year 2021 to 2022 for Film Tax Relief and High-End Television Relief is 87.9% and 147.7% respectively. These rates are calculated using the British Film Institute’s (BFI’s) research statistics. ‘Film and high-end television production in the UK; January-March (Q1) 2022’, published in April 2022. The BFI statistics allocate all the expenditure to the year in which the film/programme starts its principal photography. Tax relief claims are typically spread over the start year and the following years. We have therefore applied lag profiles based on the timings of relief claims in previous years when calculating these forecast growth rates.
For the other creative industries reliefs, which are much smaller, we have continued to use the outturn data for the 2019 to 2020 financial year processed by 6 May 2021, which was also used for the estimate for 2020 to 2021 financial year. For Video Games Tax Relief and Theatre Tax Relief the forecast growth rate is based upon the mid-point between 2020 to 2021 outturn and OBR forecast level in 2022 to 2023. For the other creative industries relief, the forecast growth rate for 2020 to 2021 and 2021 to 2022 is based on the OBR nominal GDP determinant.
For Film Tax Relief and High-end Television Tax Relief, the two largest creative industries reliefs, sensitivity analysis has been applied to understand the degree of uncertainty in the estimates if the key assumptions underpinning them were to change. The range estimates set out in the table below are based on judgements of the levels of uncertainty, and it is possible that actual values may exceed them. Sensitivity analysis is not included for other creative industries reliefs – these have a smaller estimate and their range is expected to be immaterial. At time of publication the full impact of COVID-19 on corporation tax reliefs is unknown and this increases the level of uncertainty for these estimates.
| Change to key assumption: | Change in assumption | Variation £m | Change in assumption | Variation £m |
|---|---|---|---|---|
| Film Tax Relief expenditure growth in 2021 to 2022 varies by up to +22%/-18% (note 1) | Increase by 22% | 80 | Decrease by 18% | (66) |
| High-end Television Tax Relief expenditure growth in 2021 to 2022 varies by up to +54%/-87% (note 2) | Increase by 54% | 176 | Decrease by 87% | (285) |
Note 1: For Film Tax Relief, the upper end is based on growth being one-and-a-quarter times as much as shown in the BFI report (lagged) and the lower-end of the range is based on return to 2019 to 2020 expenditure.
Note 2: For High-end Television Tax Relief, the upper-end of the range is based on growth being as shown in the BFI report (lagged) but with a larger 25% adjustment for COVID-19 and the lower end being based on growth rate as shown in the BFI report (lagged) excluding the 25% adjustment for COVID-19.
5.1.5 Corporation tax reliefs – R&D error and fraud
An estimate of error and fraud has been included in these accounts since 2019 to 2020 in response to the increasing take up of these reliefs over recent years.
HMRC estimates R&D error and fraud by combining data for the population reviewed through our compliance processes and an estimate for the remaining population using comparable error rates from Tax Gaps. HMRC analysts have used 2020 to 2021 compliance data from our Large Business team and 2021 to 2022 compliance data from our Wealthy and Mid-sized Business team, to estimate the error and fraud within the R&D tax relief expenditure for 2021 to 2022 reported at Note 5.1.4 Corporation tax reliefs.
This is similar to the approach used to calculate R&D error and fraud in 2020 to 2021, except the percentage for the financial year 2020 to 2021 was based on claims received by Large Business in 2019 to 2020 and by Wealthy and Mid-sized Business in 2020 to 2021.
The movement in the rate from 2020 to 2021 is explained in the Tax credits error and fraud section.
Estimated value of R&D error and fraud and as a percentage of the estimated R&D tax relief expenditure
| Estimate of the rate of error and fraud (2021-22) | Implied monetary value of error and fraud (2021-22 £m) | Estimate of the rate of error and fraud (2020-21) | Implied monetary value of error and fraud (2020-21 £m) | |
|---|---|---|---|---|
| Error and Fraud – SME Scheme | 7.3% | 430 | 5.5% | 303 |
| Error and Fraud – RDEC | 1.1% | 39 | 0.9% | 33 |
| Error and Fraud – Total R&D tax relief expenditure | 4.9% | 469 | 3.6% | 336 |
There is significant uncertainty with the estimate as:
- the estimated rate of error and fraud is extrapolated from the results of historic compliance activity based on the error and fraud risks understood to exist at that time
- it assumes the error rate in the non-reviewed population is consistent for R&D with more general error rates identified in the Tax Gaps
- the estimate does not anticipate any changes to our compliance approach in the future that may serve to reduce error and fraud in claims relating to 2021 to 2022
- the value of R&D expenditure is itself an estimate based on expected claims which are yet to be received, increasing the uncertainty in the derived monetary value of error and fraud presented. The value shown in the table are therefore implied from the estimate
Given these uncertainties inherent in the estimate, we are unable to produce a meaningful range of outcomes for a sensitivity analysis based on the currently available information.
5.2 Child Benefit
The Child Benefit Error and Fraud Analytical Programme (EFAP) exercise took a stratified random sample of 2,700 cases which were selected to be representative of the Child Benefit population. Claims will be deemed non-compliant by HMRC compliance officers in the following circumstances:
- Group 1. The claimant replies and the information provided proves ineligibility to Child Benefit
- Group 2. The claimant does not reply to requests for information during the estimation exercise and is deemed non-compliant based upon the desk-based analysis
In 2021 to 2022, 80% of non-respondents (Group 2) are assessed as likely to be eligible, 20% ineligible. For 2021 to 2022 error and fraud in Group 1 is estimated at 0.6% (£75 million) and Group 2 is estimated at 0.3% (£30 million). For cases where error and fraud was determined from the reply (Group 1), several themes are apparent. In particular, there are error and fraud risks due to violation of Full Time Non-Advanced Education. These estimates are based on a relatively small sample size and are therefore subject to a high degree of uncertainty.
Estimated value of Child Benefit error and fraud and as a percentage of estimated Child Benefit expenditure
| Lower bound (2021-22 £m) | Central estimate (2021-22 £m) | Upper bound (2021-22 £m) | Lower bound (2020-21 £m) | Central estimate (2020-21 £m) | Upper bound (2020-21 £m) | |
|---|---|---|---|---|---|---|
| Child Benefit error and fraud | 75 (0.6%) | 105 (0.9%) | 135 (1.2%) | 65 (0.6%) | 90 (0.8%) | 115 (1.0%) |
6. Property, plant and equipment
| Land £m | Buildings £m | Accommodation refurbishments £m | Office and computer equipment £m | Vehicles £m | Furniture and fittings £m | Assets under construction £m | Scientific ads £m | Total £m | |
|---|---|---|---|---|---|---|---|---|---|
| Cost or valuation | |||||||||
| At 1 April 2021 | 58.4 | 459.5 | 335.8 | 316.4 | 17.1 | 66.7 | 159.3 | 3.1 | 1,416.3 |
| Additions | – | – | 4.0 | 72.7 | 1.8 | 0.3 | 153.1 | 0.1 | 232.0 |
| Disposals | (51.8) | (349.0) | (108.2) | (100.5) | (3.1) | (23.6) | – | (0.3) | (636.5) |
| Impairments | – | – | – | – | – | – | – | – | – |
| Reclassifications | – | 3.8 | 118.7 | 6.3 | – | 19.7 | (153.2) | 0.1 | (4.6) |
| Revaluations (note 2) | – | (8.2) | – | – | – | – | – | – | (8.2) |
| At 31 March 2022 | 6.6 | 106.1 | 350.3 | 294.9 | 15.8 | 63.1 | 159.2 | 3.0 | 999.0 |
| Depreciation | |||||||||
| At 1 April 2021 | – | (274.1) | (117.7) | (244.3) | (13.1) | (19.3) | – | (2.7) | (671.2) |
| Charged in year | – | (5.2) | (35.4) | (26.6) | (0.7) | (6.1) | – | (0.4) | (74.4) |
| Disposals | – | 198.6 | 99.9 | 96.2 | 2.7 | 13.4 | – | 0.3 | 411.1 |
| Impairments | – | – | – | – | – | – | – | – | – |
| Reclassifications | – | (0.1) | 0.1 | 1.6 | – | – | – | – | 1.6 |
| Revaluations (note 2) | – | 3.9 | – | – | – | – | – | – | 3.9 |
| At 31 March 2022 | – | (76.9) | (53.1) | (173.1) | (11.1) | (12.0) | – | (2.8) | (329.0) |
| Carrying amount at 31 March 2021 | 58.4 | 185.4 | 218.1 | 72.1 | 4.0 | 47.4 | 159.3 | 0.4 | 745.1 |
| Carrying amount at 31 March 2022 | 6.6 | 29.2 | 297.2 | 121.8 | 4.7 | 51.1 | 159.2 | 0.2 | 670.0 |
| The assets are financed as follows: | |||||||||
| Owned | 6.6 | – | 297.2 | 113.0 | 4.7 | 51.1 | 159.2 | 0.2 | 632.0 |
| Finance leased | – | 1.3 | – | – | – | – | – | – | 1.3 |
| PFI contracts | – | 27.9 | – | 8.8 | – | – | – | – | 36.7 |
| Carrying amount at 31 March 2022 | 6.6 | 29.2 | 297.2 | 121.8 | 4.7 | 51.1 | 159.2 | 0.2 | 670.0 |
| Of the total: | |||||||||
| Core department | 6.6 | 29.2 | 294.5 | 121.3 | 4.7 | 49.3 | 156.6 | 0.2 | 662.4 |
| Valuation Office Agency | – | – | 2.7 | – | – | 1.8 | 2.6 | – | 7.1 |
| Revenue and Customs Digital Technology Services Limited | – | – | – | 0.5 | – | – | – | – | 0.5 |
| Carrying amount at 31 March 2022 | 6.6 | 29.2 | 297.2 | 121.8 | 4.7 | 51.1 | 159.2 | 0.2 | 670.0 |
| Cost or valuation | |||||||||
| At 1 April 2020 | 52.4 | 505.4 | 199.9 | 304.3 | 17.8 | 55.9 | 167.0 | 3.7 | 1,306.4 |
| Additions | 6.7 | – | 0.1 | 36.4 | 0.8 | 0.4 | 201.0 | – | 245.4 |
| Disposals | – | (11.1) | (49.3) | (28.0) | (1.5) | (7.1) | – | (0.6) | (97.6) |
| Impairments | – | – | – | – | – | – | – | – | – |
| Reclassifications | – | – | 185.1 | 3.7 | – | 17.5 | (208.7) | – | (2.4) |
| Revaluations (note 2) | (0.7) | (34.8) | – | – | – | – | – | – | (35.5) |
| At 31 March 2021 | 58.4 | 459.5 | 335.8 | 316.4 | 17.1 | 66.7 | 159.3 | 3.1 | 1,416.3 |
| Depreciation | |||||||||
| At 1 April 2020 | – | (301.0) | (153.2) | (250.1) | (13.5) | (20.3) | – | (2.5) | (740.6) |
| Charged in year | – | (17.3) | (13.6) | (22.0) | (0.9) | (4.1) | – | (0.8) | (58.7) |
| Disposals | – | 10.9 | 49.1 | 27.2 | 1.3 | 5.7 | – | 0.6 | 94.8 |
| Impairments | – | – | – | – | – | – | – | – | – |
| Reclassifications | – | – | – | 0.6 | – | (0.6) | – | – | – |
| Revaluations (note 2) | – | 33.3 | – | – | – | – | – | – | 33.3 |
| At 31 March 2021 | – | (274.1) | (117.7) | (244.3) | (13.1) | (19.3) | – | (2.7) | (671.2) |
| Carrying amount at 31 March 2020 | 52.4 | 204.4 | 46.7 | 54.2 | 4.3 | 35.6 | 167.0 | 1.2 | 565.8 |
| Carrying amount at 31 March 2021 | 58.4 | 185.4 | 218.1 | 72.1 | 4.0 | 47.4 | 159.3 | 0.4 | 745.1 |
| The assets are financed as follows: | |||||||||
| Owned | 58.4 | – | 218.1 | 60.8 | 4.0 | 47.4 | 159.3 | 0.4 | 548.4 |
| Finance leased | – | – | – | – | – | – | – | – | – |
| PFI contracts | – | 185.4 | – | 11.3 | – | – | – | – | 196.7 |
| Carrying amount at 31 March 2021 | 58.4 | 185.4 | 218.1 | 72.1 | 4.0 | 47.4 | 159.3 | 0.4 | 745.1 |
| Of the total: | |||||||||
| Core department | 58.4 | 185.4 | 217.8 | 70.8 | 4.0 | 45.4 | 155.0 | 0.4 | 737.2 |
| Valuation Office Agency | – | – | 0.3 | 0.6 | – | 2.0 | 4.3 | – | 7.2 |
| Revenue and Customs Digital Technology Services Limited | – | – | – | 0.7 | – | – | – | – | 0.7 |
| Carrying amount at 31 March 2021 | 58.4 | 185.4 | 218.1 | 72.1 | 4.0 | 47.4 | 159.3 | 0.4 | 745.1 |
Note 1: See Note 1.7.2 Property Plant and Equipment for the accounting policy for property assets.
Note 2: See Note 1.2 Accounting convention and Note 1.7.2 Property Plant and Equipment for the accounting policy regarding revaluation of property, plant and equipment.
100 Parliament Street
Disposals in 2021 to 2022 include the 1 October 2021 transfer of land, building and associated assets relating to 100 Parliament Street to the Government Property Agency. The Net Book Values at the time of transfer were Land £51.8 million, Building £150.4 million and Other Assets £5.4 million.
Property revaluation
Valuations were performed by the VOA, an executive agency of HMRC, whose services include providing valuation and estate surveying services to government departments.
7. Intangible assets
| Licences £m | Software £m | Website development £m | Assets under construction £m | Total £m | |
|---|---|---|---|---|---|
| Cost or valuation | |||||
| At 1 April 2021 | 103.6 | 3,858.7 | 19.9 | 612.1 | 4,594.3 |
| Additions | 20.0 | – | – | 526.5 | 546.5 |
| Disposals | (38.9) | (301.7) | (5.5) | – | (346.1) |
| Impairments | – | (19.3) | – | – | (19.3) |
| Reclassifications | 2.7 | 354.5 | – | (352.5) | 4.7 |
| Revaluation (note 1) | – | 246.8 | – | – | 246.8 |
| At 31 March 2022 | 87.4 | 4,139.0 | 14.4 | 786.1 | 5,026.9 |
| Amortisation | |||||
| At 1 April 2021 | (60.5) | (2,912.9) | (14.4) | – | (2,987.8) |
| Charged in year | (24.6) | (88.2) | (1.6) | – | (114.4) |
| Disposals | 37.4 | 294.7 | 5.4 | – | 337.5 |
| Impairments | – | – | – | – | – |
| Reclassifications | – | (1.6) | – | – | (1.6) |
| Revaluation (note 1) | – | (182.8) | – | – | (182.8) |
| At 31 March 2022 | (47.7) | (2,890.8) | (10.6) | – | (2,949.1) |
| Carrying amount at 31 March 2021 | 43.1 | 945.8 | 5.5 | 612.1 | 1,606.5 |
| Carrying amount at 31 March 2022 | 39.7 | 1,248.2 | 3.8 | 786.1 | 2,077.8 |
| The assets are financed as follows: | |||||
| Owned | 39.7 | 1,248.2 | 3.8 | 786.1 | 2,077.8 |
| Finance leased | – | – | – | – | – |
| PFI contracts | – | – | – | – | – |
| Carrying amount at 31 March 2022 | 39.7 | 1,248.2 | 3.8 | 786.1 | 2,077.8 |
| Of the total: | |||||
| Core department | 39.7 | 1,241.6 | 3.8 | 763.8 | 2,048.9 |
| Valuation Office Agency | – | 6.6 | – | 22.3 | 28.9 |
| Revenue and Customs Digital Technology Services Limited | – | – | – | – | – |
| Carrying amount at 31 March 2022 | 39.7 | 1,248.2 | 3.8 | 786.1 | 2,077.8 |
| Cost or valuation | |||||
| At 1 April 2020 | 77.9 | 3,760.3 | 19.9 | 443.2 | 4,301.3 |
| Additions | 31.3 | – | – | 411.1 | 442.4 |
| Disposals | (10.9) | (316.0) | – | – | (326.9) |
| Impairments | – | (3.8) | – | – | (3.8) |
| Reclassifications | 5.3 | 239.3 | – | (242.2) | 2.4 |
| Revaluation (note 1) | – | 178.9 | – | – | 178.9 |
| At 31 March 2021 | 103.6 | 3,858.7 | 19.9 | 612.1 | 4,594.3 |
| Amortisation | |||||
| At 1 April 2020 | (43.0) | (2,849.3) | (12.6) | – | (2,904.9) |
| Charged in year | (28.2) | (236.4) | (1.8) | – | (266.4) |
| Disposals | 10.7 | 304.4 | – | – | 315.1 |
| Impairments | – | – | – | – | – |
| Reclassifications | – | – | – | – | – |
| Revaluation (note 1) | – | (131.6) | – | – | (131.6) |
| At 31 March 2021 | (60.5) | (2,912.9) | (14.4) | – | (2,987.8) |
| Carrying amount at 31 March 2020 | 34.9 | 911.0 | 7.3 | 443.2 | 1,396.4 |
| Carrying amount at 31 March 2021 | 43.1 | 945.8 | 5.5 | 612.1 | 1,606.5 |
| The assets are financed as follows: | |||||
| Owned | 40.9 | 945.8 | 5.5 | 612.1 | 1,604.3 |
| Finance leased | 2.2 | – | – | – | 2.2 |
| PFI contracts | – | – | – | – | – |
| Carrying amount at 31 March 2021 | 43.1 | 945.8 | 5.5 | 612.1 | 1,606.5 |
| Of the total: | |||||
| Core department | 43.1 | 936.4 | 5.5 | 606.2 | 1,591.2 |
| Valuation Office Agency | – | 9.4 | – | 5.9 | 15.3 |
| Revenue and Customs Digital Technology Services Limited | – | – | – | – | – |
| Carrying amount at 31 March 2021 | 43.1 | 945.8 | 5.5 | 612.1 | 1,606.5 |
Note 1: See Note 1.2 Accounting convention and Note 1.7.3 Intangible for the accounting policy regarding revaluation of intangible assets.
8. Capital and other commitments
8.1 Commitments under leases
Leases are categorised as either operating or finance leases. A lease is classified as a finance lease if it transfers substantially all risks and rewards incidental to ownership, whereas an operating lease does not. The property leases vary in length and the department has no right of purchase at the end of the contract but would re-negotiate leases where continued occupation is desired.
8.1.1 Operating leases
HMRC’s buildings commitments for financial year 2021 to 2022 relates to our operational regional centres and specialist sites, or where Agreements for Leases are held, and to our other leased properties that are operating leases (including the minor occupation of other government department buildings).
The table below shows the total minimum value of future lease payments under operating leases.
Obligations under operating leases
| Core department and agency (2021-22 £m) | Departmental group (2021-22 £m) | Core department and agency (2020-21 £m) | Departmental group (2020-21 £m) | |
|---|---|---|---|---|
| Land and buildings | ||||
| Due within one year | 121.8 | 121.8 | 145.0 | 145.0 |
| Due between one year and five years | 397.8 | 397.8 | 434.5 | 434.5 |
| Due later than five years | 1,581.8 | 1,581.8 | 1,297.2 | 1,297.2 |
| 2,101.4 | 2,101.4 | 1,876.7 | 1,876.7 | |
| Other | ||||
| Due within one year | 4.1 | 4.1 | 15.3 | 15.3 |
| Due between one year and five years | 3.0 | 3.0 | 15.2 | 15.2 |
| Due later than five years | – | – | – | – |
| 7.1 | 7.1 | 30.5 | 30.5 |
8.1.2 Finance leases
The following commitments are in respect of charges for assets that have been brought onto the department’s CSoFP as Finance Leases under IAS 17.
Obligations under finance leases
| Core department and agency (2021-22 £m) | Departmental group (2021-22 £m) | Core department and agency (2020-21 £m) | Departmental group (2020-21 £m) | |
|---|---|---|---|---|
| Buildings | ||||
| Due within one year | – | – | – | – |
| Due between one year and five years | – | – | – | – |
| Due later than five years | – | – | – | – |
| – | – | – | – | |
| Other | ||||
| Due within one year | 0.6 | 0.6 | 1.8 | 1.8 |
| Due between one year and five years | – | – | 0.4 | 0.4 |
| Due later than five years | – | – | – | – |
| 0.6 | 0.6 | 2.2 | 2.2 |
8.2 Commitments under PFI and other service concession arrangements
8.2.1 Off-Statement of Financial Position
The department has no off-SoFP PFI contracts.
8.2.2 On-Statement of Financial Position
The following commitments are in respect of assets that have been brought onto the department’s SoFP under IAS 17 and IFRIC 12 Service Concession Arrangements. They comprise commitments relating to Newcastle Estates Partnership (NEP) held with DWP, St. John’s House, Bootle and also commitments in relation to IT infrastructure.
The total amount charged in the CSoCNE in respect of on-SoFP PFI and other service concession arrangement transactions (there were no off-SoFP transactions) was £114.6 million (2020 to 2021: £235.8 million). This amount is included within the figures reported in Note 2 as PPP and PFI service charges.
The substance of each contract is that the department has a finance lease and that payments comprise two elements – finance lease charges and service charges.
Details of the obligations for lease payments (note 1)
| Core department and agency (2021-22 £m) | Departmental group (2021-22 £m) | Core department and agency (2020-21 £m) | Departmental group (2020-21 £m) | |
|---|---|---|---|---|
| Minimum lease payments: | ||||
| Due within one year | 12.0 | 12.0 | 28.1 | 28.1 |
| Due between one year and five years | 32.0 | 32.0 | 105.3 | 105.3 |
| Due later than five years | 13.4 | 13.4 | 231.8 | 231.8 |
| Total minimum lease payments due in future periods | 57.4 | 57.4 | 365.2 | 365.2 |
Details of the obligations for service elements (note 1)
| Core department and agency (2021-22 £m) | Departmental group (2021-22 £m) | Core department and agency (2020-21 £m) | Departmental group (2020-21 £m) | |
|---|---|---|---|---|
| Service elements due in future periods: | ||||
| Due within one year | 31.9 | 31.9 | 40.8 | 40.8 |
| Due between one year and five years | 70.4 | 70.4 | 112.9 | 112.9 |
| Due later than five years | 18.6 | 18.6 | 94.1 | 94.1 |
| Total service elements due in future periods | 120.9 | 120.9 | 247.8 | 247.8 |
| Total Commitments | 178.3 | 178.3 | 613.0 | 613.0 |
Note 1: The Mapeley contract finished on 1 April 2021 and therefore the commitment at 31 March 2021 was negligible. The commitment for the building known as 100 Parliament Street, accounted for as an on-SoFP PFI in 2020 to 2021, was valued at £382 million. The building was transferred to the Government Property Agency on 30 September 2021. Our commitment at 31 March 2022 is now reported as an Operating Lease at Note 8.1.1.
8.3 Capital commitments
The capital commitments reported relate to the future cost of development of the estate and IT infrastructure.
Contracted capital commitments at 31 March not otherwise included in these financial statements
| Core department and agency (2021-22 £m) | Departmental group (2021-22 £m) | Core department and agency (2020-21 £m) | Departmental group (2020-21 £m) | |
|---|---|---|---|---|
| Property, plant and equipment | 1.6 | 1.6 | 93.9 | 93.9 |
| Intangible assets | 17.1 | 17.1 | 29.2 | 29.2 |
| 18.7 | 18.7 | 123.1 | 123.1 |
8.4 Other financial commitments
The department has entered into non-cancellable contracts which are not a lease, PFI contract or other service concession arrangement.
The payments to which the department are committed are as follows:
| Core department and agency (2021-22 £m) | Departmental group (2021-22 £m) | Core department and agency (2020-21 £m) | Departmental group (2020-21 £m) | |
|---|---|---|---|---|
| Due within one year | 266.6 | 266.6 | 306.3 | 306.3 |
| Due between one year and five years | 234.6 | 234.6 | 414.9 | 414.9 |
| Due later than five years | 3.5 | 3.5 | 6.5 | 6.5 |
| 504.7 | 504.7 | 727.7 | 727.7 |
9. Trade receivables, financial and other assets
| Note | Core department and agency (2021-22 £m) | Departmental group (2021-22 £m) | Core department and agency (2020-21 £m) | Departmental group (2020-21 £m) | |
|---|---|---|---|---|---|
| Amounts expected to be received within one year: | |||||
| Personal tax credits | 5.1.2 | 486.4 | 486.4 | 653.5 | 653.5 |
| Child Benefit (note 1) | 33.7 | 33.7 | 26.6 | 26.6 | |
| Statutory Sick Pay Rebate – (DWP) | 6.9 | 6.9 | – | – | |
| Help to Save | 14.3 | 14.3 | 4.3 | 4.3 | |
| Trade receivables | 4.4 | 4.4 | 4.4 | 4.4 | |
| Other receivables (note 2) | 45.4 | 45.5 | 42.7 | 42.7 | |
| Deposits and advances | 119.9 | 119.9 | 93.8 | 93.8 | |
| Value Added Tax | 54.8 | 53.5 | 45.5 | 44.4 | |
| Prepayments – Child Benefit | 55.6 | 55.6 | 75.0 | 75.0 | |
| Accrued income, other prepayments | 169.6 | 171.6 | 145.8 | 146.1 | |
| 991.0 | 991.8 | 1,091.6 | 1,090.8 | ||
| Amounts expected to be received in more than one year: | |||||
| Personal tax credits | 5.1.2 | 1,194.0 | 1,194.0 | 1,365.0 | 1,365.0 |
| RCDTS Ltd Funding (note 3) | 7.0 | – | 7.0 | – | |
| 1,201.0 | 1,194.0 | 1,372.0 | 1,365.0 |
Note 1: This figure is net of provision for impairment amounting to £28.2 million (2020 to 2021: £38.1 million).
Note 2: This figure is net of provision for impairment amounting to departmental group: £21.7 million (2020 to 2021 departmental group: £20.9 million).
Note 3: HMRC has funded RCDTS Ltd for general working capital and investment purposes. This has been accounted for as a long-term loan arrangement.
10. Cash and cash equivalents
Cash and bank balances relate to the administering of the department and programme expenditure, but exclude all tax and duty revenues collected. The latter are included in the department’s Trust Statement. Cash and cash equivalents comprise cash in hand and current balances, which are readily convertible to known amounts of cash and which are subject to insignificant changes in value. Bank accounts are part of the Exchequer pyramid whereby balances are effectively held overnight with the Bank of England.
| Core department and agency (2021-22 £m) | Departmental group (2021-22 £m) | Core department and agency (2020-21 £m) | Departmental group (2020-21 £m) | |
|---|---|---|---|---|
| Balance at 1 April | 9,910.2 | 9,914.4 | 80.4 | 85.5 |
| Net change in cash and cash equivalent balances | (5,208.7) | (5,208.2) | 9,829.8 | 9,828.9 |
| Balance at 31 March | 4,701.5 | 4,706.2 | 9,910.2 | 9,914.4 |
| Of which balances were held at: | ||||
| Government Banking Service | 4,698.7 | 4,703.4 | 9,845.0 | 9,849.2 |
| Commercial banks and cash in hand (note 1) | 2.8 | 2.8 | 65.2 | 65.2 |
| Balance at 31 March | 4,701.5 | 4,706.2 | 9,910.2 | 9,914.4 |
Note 1: Includes money held at the Bank of England (via the Trust Statement).
11. Trade payables and other liabilities
| Core department and agency (2021-22 £m) | Departmental group (2021-22 £m) | Core department and agency (2020-21 £m) | Departmental group (2020-21 £m) | |
|---|---|---|---|---|
| Amounts expected to be paid within one year: | ||||
| Statutory Sick Pay Rebate – advance repayable to DWP | – | – | 41.3 | 41.3 |
| Personal tax credits | 392.4 | 392.4 | 379.6 | 379.6 |
| Child Benefit and Tax-Free Childcare | 171.3 | 171.3 | 54.8 | 54.8 |
| Trade payables | 65.6 | 65.6 | 69.2 | 69.6 |
| Taxation and social security excluding VAT | 57.4 | 58.5 | 68.0 | 69.1 |
| Other payables | 8.7 | 9.2 | 16.2 | 16.3 |
| Accruals – COVID-19 support schemes | 1.4 | 1.4 | 2,408.0 | 2,408.0 |
| Accruals – corporation tax reliefs | 8,722.8 | 8,722.8 | 8,135.2 | 8,135.2 |
| Other accruals | 723.7 | 721.2 | 674.6 | 670.1 |
| Deferred Income | 20.6 | 20.6 | 38.3 | 38.3 |
| Amounts issued from the Consolidated Fund for Supply but not spent at year end | 4,694.5 | 4,694.5 | 9,908.6 | 9,908.6 |
| Consolidated Fund Extra Receipts due to be paid to the Consolidated Fund | ||||
| received | 7.0 | 7.0 | 1.6 | 1.6 |
| 14,865.4 | 14,864.5 | 21,795.4 | 21,792.5 | |
| Amounts expected to be paid in more than one year: | ||||
| Accruals – corporation tax reliefs | 1,782.8 | 1,782.8 | 1,676.8 | 1,676.8 |
| IT Public Private Partnership | 7.1 | 7.1 | 8.8 | 8.8 |
| Accommodation PFI | 29.6 | 29.6 | 197.6 | 197.6 |
| Accommodation non-PFI | 3.5 | 3.5 | 4.2 | 4.2 |
| 1,823.0 | 1,823.0 | 1,887.4 | 1,887.4 |
11.1 Reconciliation of liabilities arising from financing activities
| Balance at 1 April 2021 (£m) | Financing cash flows (£m) | Net Cash Requirement (£m) | Non-Cash Changes: Acquisition (£m) | Non-Cash Changes: Forex movements (£m) | Non-Cash Changes: Fair value changes (£m) | Non-Cash Changes: Disposal (£m) | Balance at 31 March 2022 (£m) | |
|---|---|---|---|---|---|---|---|---|
| Supply – current year | 9,908.6 | 32,149.5 | (37,363.6) | – | – | – | – | 4,694.5 |
| From the Trust Statement | – | 21,929.6 | (21,929.6) | – | – | – | – | – |
| From the National Insurance Fund | 10.7 | 240.3 | (255.2) | – | – | – | – | (4.2) |
| Lease liabilities | 221.8 | (12.0) | – | 3.0 | – | 0.8 | (168.1) | 45.5 |
| Total liabilities from financing activities | 10,141.1 | 54,307.4 | (59,548.4) | 3.0 | – | 0.8 | (168.1) | 4,735.8 |
| Balance at 1 April 2020 (£m) | Financing cash flows (note 1) (£m) | Net Cash Requirement (£m) | Non-Cash Changes: Acquisition (£m) | Non-Cash Changes: Forex movements (£m) | Non-Cash Changes: Fair value changes (£m) | Non-Cash Changes: Disposal (£m) | Balance at 31 March 2021 (£m) | |
|---|---|---|---|---|---|---|---|---|
| Supply – current year | – | 105,994.4 | (96,085.8) | – | – | – | – | 9,908.6 |
| Supply – prior year | – | 726.0 | (726.0) | – | – | – | – | – |
| Parliamentary funding – balance to surrender | 806.3 | (806.3) | – | – | – | – | – | – |
| From the Trust Statement | – | 25,088.2 | (25,088.2) | – | – | – | – | – |
| From the National Insurance Fund | (15.7) | 251.5 | (225.1) | – | – | – | – | 10.7 |
| Lease Liabilities | 237.1 | (29.6) | – | 13.6 | – | 1.6 | (0.9) | 221.8 |
| Total liabilities from financing activities | 1,027.7 | 131,224.2 | (122,125.1) | 13.6 | – | 1.6 | (0.9) | 10,141.1 |
12. Provisions for liabilities and charges
Provisions are recognised when HMRC has a present legal or constructive obligation as a result of a past event, it is probable that HMRC will be required to settle that obligation and an amount has been reliably estimated.
Provisions for liabilities and charges
| Core department and agency (2021-22 £m) | Departmental group (2021-22 £m) | Core department and agency (2020-21 £m) | Departmental group (2020-21 £m) | |
|---|---|---|---|---|
| Balance at 1 April | 192.1 | 192.1 | 240.2 | 240.2 |
| Provided in the year | 48.5 | 48.5 | 104.5 | 104.5 |
| Provisions not required written back | (51.2) | (51.2) | (56.4) | (56.4) |
| Net expenditure | (2.7) | (2.7) | 48.1 | 48.1 |
| Provisions utilised in the year | (31.5) | (31.5) | (96.2) | (96.2) |
| Balance at 31 March | 157.9 | 157.9 | 192.1 | 192.1 |
12.1 Analysis of expected timing of discounted flows
| Core department and agency (2021-22 £m) | Departmental group (2021-22 £m) | Core department and agency (2020-21 £m) | Departmental group (2020-21 £m) | |
|---|---|---|---|---|
| Not later than one year | 15.6 | 15.6 | 1.5 | 1.5 |
| Later than one year and not later than five years | 92.4 | 92.4 | 145.6 | 145.6 |
| Later than five years | 49.9 | 49.9 | 45.0 | 45.0 |
| Balance at 31 March | 157.9 | 157.9 | 192.1 | 192.1 |
| Child Trust Fund (£m) | Legal claims (£m) | Accommodation costs (£m) | Other (£m) | Total (£m) | |
|---|---|---|---|---|---|
| Not later than one year | 0.1 | 1.2 | 0.1 | 14.2 | 15.6 |
| Later than one year and not later than five years | 0.3 | 78.7 | 4.4 | 9.0 | 92.4 |
| Later than five years | – | 41.7 | 8.1 | 0.1 | 49.9 |
| Balance at 31 March | 0.4 | 121.6 | 12.6 | 23.3 | 157.9 |
12.2 Child Trust Fund
Child Trust Fund (CTF) endowments; eligibility to which ceased on 3 January 2011, provided assistance with the funding on long-term individual savings and investment accounts provided by approved financial institutions. A provision of £0.4 million was retained for general CTF payments amounts forecast to become payable in respect of children qualifying for CTF endowments.
12.3 Legal claims
A provision of £121.6 million (2020 to 2021: £128.4 million) has been made for costs relating to various legal claims against the department. The provision reflects all known claims, where legal advice indicates that it is probable that the claim will be successful.
12.4 Accommodation costs
A provision of £12.6 million has been made (2020 to 2021: £15.8 million) for buildings related claims giving rise to probable liabilities under tenancy agreements.
12.5 Other
Provisions relating to various other claims against the department amount to £23.3 million (2020 to 2021: £47.5 million).
13. Pension asset/liability
The VOA merged with The Rent Service on 1 April 2009, taking on staff who are members of the LGPS. The pension assets part of the LGPS are reflected in the Consolidated Statement of Financial Position.
Further information can be found within the VOA accounts at the Valuation Office Agency page on GOV.UK.
14. Contingent liabilities
Contingent liabilities are possible obligations that arise from past events and for which existence will be confirmed only by the occurrence of one or more uncertain future events not wholly within HMRC’s control. An example is legal action where the department may need to pay legal costs if it loses the case. These are not disclosed where disclosure could seriously prejudice the outcome of legal claims against the department.
The department has the following quantifiable contingent liabilities:
- Legal claims – a contingent liability of £131.0 million (2020 to 2021: £119.2 million) exists for costs that may be awarded should various legal cases in which HMRC is involved be determined against the department. The contingent liability covers all such cases where the outcome is unknown or cannot be estimated reliably
- Guaranteed costs – possible liability where appointed liquidators have been guaranteed payment of their costs with a view to recovery of outstanding tax liabilities £0.9 million, 65 cases (2020 to 2021: £0.7 million, 59 cases)
- Other – the department has a further number of contingent liabilities amounting to £75.0 million (2020 to 2021: £64.0 million)
15. Related-party transactions
The department is the parent of the VOA as well as RCDTS Ltd. These bodies are both regarded as a related-party with which the department has had various material transactions during the year.
The VOA has had a significant number of material transactions with other government departments. Most of these transactions have been with the Ministry for Housing, Communities and Local Government, the DWP and the Welsh Government.
RCDTS Ltd provides a managed IT service to HMRC, funding is provided from HMRC to RCDTS Ltd.
In addition, the department has had a small number of transactions with other government departments and other central government bodies.
The current Financial Secretary to the Treasury, Lucy Frazer KC MP, appointed on 16 September 2021, is married to the Chief Executive of Alexander Mann Solutions Ltd (AMS). The Financial Secretary to the Treasury is the departmental minister responsible for HMRC and the VOA. AMS are contracted under a Crown Commercial Service framework arrangement to source contractors and temporary workers and was a supplier to HMRC prior to the Financial Secretary’s appointment. In the financial year 2021 to 2022, HMRC Group paid £177 million to AMS. The majority of this cost relates to payments to agency staff but an element covers the services provided by AMS to source these temporary workers. The Financial Secretary has no role in the decisions relating to this expenditure.
No Board member, key manager or other related party has undertaken any material transactions with the department during the year. Details of compensation for key management personnel can be found in the remuneration report within the accountability section.
16. Entities within the departmental boundary
The VOA is a supply-financed agency. Its Annual Report and Accounts are published at the Valuation Office Agency page on GOV.UK.
RCDTS Ltd is an Arms Length Body. Its Annual Report and Accounts are published at the Companies House page on GOV.UK.
17. Investments and loans in other public sector bodies
The department holds no loans, public dividend capital or other interests in public bodies outside the departmental boundary.
18. Events after the reporting period date
We recognise as material non-adjusting events after the reporting date:
Qualifying low income households in England, Wales, Scotland and Northern Ireland will receive a cost of living payment of £650. This will be paid in two instalments. The initial automatic instalment will be £326, paid from 14 July 2022, the second instalment of £324 will be sent in the Autumn. The payments are designed to be unequal to minimise fraud risks from those who may seek to exploit this system.
These accounts have been authorised for issue by the Accounting Officer on the same date as the Comptroller and Auditor General’s Audit Certificate.
Glossary to the financial statements
Accrued Revenue Payable (ARP)
There are 3 distinct types of ARP. These comprise:
- firstly, amounts due to traders that have an established revenue repayment claim relating to the financial year, but the date the claim is received is after the end of the reporting period
- secondly, amounts of receivables and accrued revenue receivable that will, when received, be passed to a third-party, for example national insurance contributions due to the National Insurance Funds and NHS
- thirdly, amounts in respect of CT and Income Tax likely to be repayable by HMRC pending finalisation of tax payer liabilities
Accrued Revenue Receivable (ARR)
ARR represents taxes and duties relating to the financial year that are not yet due or received from taxpayers, where these have not been included in receivables.
Administration costs
These relate to the internal administration costs of running the department, for example, human resources, finance, estates management and includes both costs and associated operating income.
Amortisation
This is the method of spreading the cost of a non-current intangible asset over its useful life.
Annually Managed Expenditure (AME)
Departments are allocated a separate annually managed spending limit called AME which has a shorter term view than the DEL limit. AME is more volatile than DEL expenditure and therefore is more difficult to explain or control as it is spent on programmes which are demand-led – such as tax credits or Child Benefit.
Appropriation (to Resource Accounts)
These are amounts transferred to the Resource Accounts for the purposes of financing tax reliefs.
Consolidate Fund Extra Receipts (CFER)
This is income which the department is not entitled to retain and is passed over to HM Treasury.
Consolidated Fund
The Consolidated Fund is the government’s general bank account at the Bank of England. Payments from this account must be authorised in advance by the House of Commons.
Consolidated Statement of Cash Flows (CSoCF)
A statement that reports the cash flows during the financial year from operating, investing and financing activities.
Consolidated Statement of Changes in Taxpayers’ Equity (CSoCTE)
A statement which explains the movements in the department and departmental group’s net assets between the start and end of a financial year.
Consolidated Statement of Comprehensive Net Expenditure (CSoCNE)
This is the performance statement, the equivalent of the ‘Profit and Loss’ Account and Statement of Total Recognised Gains and Losses. It reports a summary of the departmental group’s expenditure and income for the financial year, along with its gains and losses.
Consolidated Statement of Financial Position (CSoFP)
Previously known as the Balance Sheet, it provides a snapshot of the assets and liabilities of the group as at the end of the reporting period.
Contingent liabilities
Contingent liabilities are possible obligations that arise from past events and whose existence will be confirmed only by the occurrence of one or more uncertain future events not wholly within HMRC’s control. An example is legal action where the department may need to pay legal costs if it loses the case. These are not disclosed where disclosure could seriously prejudice the outcome of legal claims against the department.
Current assets
A current asset is cash and any other entity asset that will be turning to cash within one year from the department’s reporting date.
Current liabilities
A current liability is an obligation that is due within one year of the department’s reporting date.
Deferred revenue
This includes duties and taxes paid in the current year that relate to future accounting periods.
Departmental Expenditure Limits (DEL)
This is the spending budget that is allocated to and spent by Government departments. This amount, and how it is split between Government departments, is set at Spending Reviews on a 3 yearly basis. It is normally categorised as Capital DEL and Resource DEL. Departmental expenditure includes the running of the services and the everyday cost of resources such as staff. The DEL limit is tightly controlled by HM Treasury. A department’s expenditure is deemed to be DEL unless HM Treasury has specified otherwise.
Depreciation
This is the method of spreading the cost of a non-current tangible asset over its useful life.
Disbursement (to Resource Accounts)
This is the transfer of amounts relating to tax reliefs to the Resource Accounts.
Excess Vote
If a department breached either the total resource-based estimates or the cash limits this will result in an Excess Vote.
Finalisation (personal tax credits)
This is the process, occurring after the financial year end, by which claimants confirm their actual income and other circumstances for the previous award year. The award is finalised for the award year that has ended and appropriate adjustments for under or overpayments of tax credits are made.
Financial Reporting Manual (FReM)
This is the HM Treasury technical accounting guide to the preparation of financial statements for government.
IAS
International Accounting Standards.
IASB
International Accounting Standards Board.
IFRIC
The IFRIC develop guidance on appropriate accounting treatment of particular issues. They are approved by the IASB.
IFRS
International Financial Reporting Standards. The Financial Statements of Government adopted IFRS from 2009 to 2010 as the basis for preparation of their accounts which were previously prepared under UK based Generally Accepted Accounting Practice (UK GAAP).
Impairment of accrued revenue receivables
The process of reducing accrued revenue receivables to a fair value that is likely to be collected.
Impairment of receivables
The process of reducing receivables to a fair value that is likely to be collected.
Indemnities
Will be ordered by the court, on behalf of the insolvency practitioner or solicitors, in case the department has incorrectly wound up a viable business. These indemnities are unlimited, although we calculate a likely value for reporting purposes. The calculation is based on the likely amount that a business could be awarded in proceedings and the likelihood of a successful claim for that amount being made. The indemnity will be in place until the case is settled and the liquidation confirmed.
Intangible assets
These are non-physical assets, for example, developed computer software and website development costs.
Losses
Losses are made up of remissions and write-offs. Remission is the process used to identify and separate receivables which the department has decided not to pursue, for example on the grounds of value for money. Write-offs are receivables that are considered to be irrecoverable, for example because there is no practical means for pursuing them.
Managing Public Money
This is a HM Treasury publication giving guidance on how to handle public funds.
Negative tax
This occurs where the amount of the tax credit is less than or equal to the recipient’s tax liability.
Net Cash Requirement
The amount of funding that the department is entitled to draw down from the Consolidated Fund.
Non-current assets
An asset that is not likely to turn to cash or cash equivalent within one year of the department’s reporting date.
Non-current liabilities
A liability not due to be paid within one year of the department’s reporting date.
Non-voted expenditure
Expenditure which is not subject to annual Parliamentary approval and mainly relates to tax credits and costs in respect of the National Insurance Fund.
Payables
Amounts recognised as owed by the department at the end of the reporting period for which payment has not yet been made.
Payments of entitlement
This is the element of a relief which is in excess of the recipient’s tax liability.
Private Finance Initiative (PFI)
Is a way of creating public-private partnerships (PPPs) by funding public infrastructure projects with private capital.
Programme costs
These relate to the costs incurred in the delivery of front line services such as the parts of the department which interact directly with our external customers. In addition it includes the payments made for tax credits, Child Benefit and other disbursements by the department. All expenditure and associated operating income for the VOA is treated as Programme.
Provisions for liabilities
These are recognised when HMRC has a present legal or constructive obligation as a result of a past event, it is probable that HMRC will be required to settle that obligation and an amount has been reliably estimated.
Receivables
These represent all amounts recognised as owing to the department at the end of the reporting period but payment has not been received. A proportion of the receivable balance relates to revenue that is not yet overdue for payment.
Resource Accounts
The financial statements which report the cost of running the department and include payments of tax credits, Child Benefit and certain reliefs.
Statement of Parliamentary Supply (SoPS)
This is the primary Parliamentary accountability statement and is unique to central government financial reporting. It reports the total outturn (how much has been spent) for the departmental group compared with the amounts approved by Parliament in the Estimate, in the various categories of expenditure.
Supply Estimates process
This is the means by which a government department seeks funds from Parliament and authority is given for departmental expenditure each year.
Suspended debt
An indirect tax, penalty or surcharge that is under challenge, dispute or appeal. The value is currently included in the receivables but excluded from the debt balance as currently no recovery action can be taken.
Tax debt
The amount of revenue that is overdue and legally enforceable to be collected. Tax debt is included within the receivables balance. ‘Receivables’ is defined earlier in this glossary.
Trust Statement
The financial statement which reports the revenues, expenditure, assets and liabilities related to taxes and duties collected by the department.
UK GAAP
The generally accepted accounting principles in the UK which are the body of accounting standards and guidance published by the Financial Reporting Council.
Voted expenditure
Monies voted to the department by Parliament to cover our expenditure, following the submission of our Estimates. Parliament votes annually on each government department’s future expenditure.
Annex 1: Arm’s-length bodies
Information on arm’s length bodies is shown in the Accountability relationships with arm’s length bodies section of the Principal Accounting Officer’s report. The following bodies are those within our accounting boundary for 2021 to 2022 that contribute to the departmental group.
| Total operating income (note 1) (£000) | Total operating expenditure (£000) | Net expenditure for the year (including financing) (£000) | Permanently Employed Staff: Number of employees | Permanently Employed Staff: Staff costs (£000) | Other Staff: Number of employees | Other Staff: Staff costs (note 2) (£000) | |
|---|---|---|---|---|---|---|---|
| HMRC | (343,089) | 57,704,073 | 57,360,984 | 59,201 | 2,774,990 | 194 | 9,960 |
| RCDTS Ltd | – | 81,148 | 81,148 | 767 | 31,436 | 146 | – |
| VOA | (39,927) | 259,194 | 219,268 | 3,242 | 156,467 | 302 | 10,885 |
Note 1: As 100% of the income generated by RCDTS Limited is from HMRC, the RCDTS income is offset against HMRC’s expenditure upon consolidation. This explains the reason for the nil figure under the RCDTS Limited income column.
Note 2: The RCDTS Limited ‘Other staff’ relates to contingent labour and the expenditure is reported under goods and services.
Annex 2: Statistical tables
This table provides further detail by category on HMRC spending.
Table 1: Total departmental spending (£000)
| 2017-18 Outturn | 2018-19 Outturn | 2019-20 Outturn | 2020-21 Outturn | 2021-22 Outturn | 2022-23 Plans | 2023-24 Plans | 2024-25 Plans | |
|---|---|---|---|---|---|---|---|---|
| Resource DEL (note 1) | ||||||||
| HMRC administration | 3,450,380 | 3,483,718 | 3,813,617 | 4,335,323 | 4,566,139 | 5,171,634 | 4,826,422 | 4,600,146 |
| VOA administration | 143,476 | 142,738 | 164,797 | 141,100 | 143,995 | 186,075 | 195,458 | 198,542 |
| Utilised provisions | 31,631 | 42,918 | 54,597 | 96,219 | 21,502 | 30,000 | 24,729 | 23,630 |
| National Insurance Fund | 320,306 | 282,548 | 254,332 | 222,649 | 719,062 | 256,575 | – | 202,099 |
| Cost of living | – | – | – | – | – | 734,479 | 211,499 | – |
| COVID-19 | 719,062 | – | – | – | ||||
| Total Resource DEL | 3,945,793 | 3,951,922 | 4,287,343 | 4,795,291 | 5,712,042 | 6,378,763 | 5,258,109 | 5,024,417 |
| Of which: | ||||||||
| Staff costs | 2,401,849 | 2,360,289 | 2,602,310 | 2,778,298 | 2,858,291 | 2,938,041 | 2,421,871 | 2,314,233 |
| Purchase of goods and services | 1,145,766 | 1,199,928 | 1,207,607 | 1,765,257 | 1,842,658 | 2,223,624 | 1,888,152 | 1,789,402 |
| Income from sales of goods and services | -202,750 | -201,710 | -204,751 | -288,573 | -269,435 | -259,272 | -213,722 | -204,223 |
| Current grants to persons and non-profit bodies (net) | 2,327 | 1,714 | 6,277 | 52,638 | 743,791 | 736,949 | 607,478 | 580,479 |
| Current grants abroad (net) | 1,054 | 1,418 | 1,287 | 840 | 1,025 | 450 | 371 | 354 |
| Subsidies to private sector companies | – | 387 | – | – | – | – | – | – |
| Rentals | 195,611 | 208,542 | 296,210 | 326,652 | 277,172 | 193,967 | 159,890 | 152,784 |
| Depreciation (note 2) | 296,974 | 288,680 | 296,137 | 310,833 | 174,352 | 471,810 | 333,735 | 333,735 |
| Change in pension scheme liabilities | 1,847 | 1,324 | -210 | – | – | – | – | – |
| Other resource | 103,115 | 91,350 | 82,476 | 82,814 | 84,188 | 73,194 | 60,334 | 57,653 |
| 3,945,793 | 3,951,922 | 4,287,343 | 4,795,291 | 5,712,042 | 6,378,763 | 5,258,109 | 5,024,417 | |
| Resource AME (note 1) | ||||||||
| Child Benefit | 11,689,654 | 11,475,319 | 11,487,105 | 11,541,713 | 11,419,639 | 11,880,922 | 12,177,954 | 12,482,403 |
| Tax-Free Childcare | 28,783 | 115,730 | 245,524 | 253,047 | 428,406 | 524,796 | 537,916 | 551,364 |
| Providing payments in lieu of tax relief to certain bodies | 85,027 | 97,388 | 116,035 | 140,071 | 130,003 | 148,688 | 152,405 | 156,215 |
| Lifetime ISA | – | 251,019 | 225,808 | 346,120 | 418,943 | 567,850 | 582,046 | 596,597 |
| Help to save | 20,361 | 50,932 | 52,206 | 53,511 | ||||
| HMRC administration | 37,975 | 93,672 | 82,016 | 52,212 | 8,072 | 30,000 | 30,000 | 30,000 |
| VOA – Payments of rates to LAs on behalf of certain bodies | 76,085 | 66,785 | 83,886 | 75,646 | 78,061 | 86,000 | 86,000 | 86,000 |
| VOA administration | 5,690 | 7,094 | 1,523 | 1,184 | 1,017 | 2,000 | 2,000 | 2,000 |
| Utilised provisions | -31,633 | -42,920 | -54,607 | -96,223 | -31,510 | -31,510 | -31,510 | -31,510 |
| Personal tax credit | 26,362,989 | 22,288,296 | 18,331,274 | 15,063,222 | 10,605,481 | 8,154,766 | 8,358,635 | 8,567,601 |
| Other reliefs and allowances | 3,705,182 | 5,879,196 | 10,103,140 | 10,698,573 | 11,696,601 | 14,694,816 | 15,062,186 | 15,438,741 |
| COVID-19 | – | – | – | 81,233,264 | 16,543,682 | 18,700 | – | – |
| Total Resource AME | 41,959,753 | 40,231,579 | 40,621,704 | 119,308,829 | 51,318,756 | 36,127,959 | 37,009,838 | 37,932,922 |
| Of which: | ||||||||
| Purchase of goods and services | 91,916 | 71,679 | 89,110 | 95,721 | 83,492 | 92,500 | 92,500 | 92,500 |
| Income from sales of goods and services | -4,725 | -4,894 | -5,224 | -4,535 | -4,412 | -4,500 | -4,500 | -4,500 |
| Current grants to persons and non-profit bodies (net) | 39,665,624 | 34,231,898 | 30,418,746 | 26,770,567 | 39,076,044 | 21,349,056 | 21,861,162 | 22,407,691 |
| Subsidies to private sector companies | 2,204,456 | 5,876,916 | 10,100,691 | 88,673,903 | 12,186,849 | 14,692,413 | 15,062,186 | 15,438,741 |
| Depreciation (note 2) | 1,854 | 477 | 1,290 | 1,785 | 9,514 | – | – | – |
| Take up of provisions | 41,811 | 100,289 | 82,249 | 50,315 | -2,215 | 30,000 | 30,000 | 30,000 |
| Release of provision | -31,633 | -42,920 | -54,607 | -102,416 | -31,299 | -31,510 | -31,510 | -31,510 |
| Change in pension scheme liabilities | – | – | – | – | – | – | – | – |
| Other resource | -9,550 | -1,866 | -10,551 | 3,823,489 | 783 | – | – | – |
| 41,959,753 | 40,231,579 | 40,621,704 | 119,308,829 | 51,318,756 | 36,127,959 | 37,009,838 | 37,932,922 | |
| Resource budget (note 1) | ||||||||
| Total Resource DEL | 3,945,793 | 3,951,922 | 4,287,343 | 4,795,291 | 5,712,042 | 6,378,763 | 5,258,109 | 5,024,417 |
| Total Resource AME | 41,959,753 | 40,231,579 | 40,621,704 | 119,308,829 | 51,318,756 | 36,127,959 | 37,009,838 | 37,932,922 |
| Total Resource Budget | 45,905,546 | 44,183,501 | 44,909,047 | 124,104,120 | 57,030,798 | 42,506,722 | 42,267,947 | 42,957,339 |
| Of which: | ||||||||
| Depreciation (note 2) | 298,828 | 289,157 | 297,427 | 308,484 | 183,866 | 471,810 | 333,735 | 333,735 |
| Capital DEL (note 1) | ||||||||
| HMRC administration | 273,268 | 353,476 | 328,666 | 529,830 | 643,880 | 645,851 | 553,447 | 448,243 |
| VOA administration | 7,517 | 8,742 | 6,362 | 6,746 | 20,650 | 29,660 | 25,416 | 20,585 |
| Total Capital DEL | 280,785 | 362,218 | 335,028 | 536,576 | 664,530 | 675,511 | 578,863 | 468,828 |
| Of which: | ||||||||
| Purchase of assets | 308,339 | 387,376 | 420,306 | 677,700 | 982,938 | 689,005 | 590,427 | 478,194 |
| Income from sales of assets | -27,554 | -25,158 | -85,278 | -141,124 | -318,408 | -13,494 | -11,564 | -9,366 |
| 280,785 | 362,218 | 335,028 | 536,576 | 664,530 | 675,511 | 578,863 | 468,828 | |
| Capital AME (note 1) | ||||||||
| Child Benefit (note 1) | 2 | 2 | 10 | 4 | 7 | 10 | – | – |
| HMRC administration (note 2) | – | – | – | – | – | 100 | 99 | – |
| Total Capital AME | 2 | 2 | 10 | 4 | 7 | 110 | 99 | 0 |
| Of which: | ||||||||
| Capital grants to persons and non-profit bodies (net) | 2 | 2 | 10 | 4 | 7 | 10 | 99 | – |
| Depreciation | 100 | 99 | – | – | ||||
| 2 | 2 | 10 | 4 | 7 | 110 | 99 | – | |
| Capital budget (note 1) | ||||||||
| Total Capital DEL | 280,785 | 362,218 | 335,028 | 664,530 | 664,530 | 675,511 | 578,863 | 468,828 |
| Total Capital AME | 2 | 2 | 10 | 7 | 7 | 110 | 99 | – |
| Total Capital Budget | 280,787 | 362,220 | 335,038 | 542,158 | 644,537 | 675,621 | 578,972 | 468,828 |
Note 1: AME figures are using set at Main Estimate annually. Future years budget not yet available.
Note 2: HMRC administration included Capital AME due to the introduction of IFRS 16.
Note: The totals may differ to the information in the Statement of Parliamentary Supply due to rounding.
This table shows HMRC administration expenditure, utilised provisions and the administration element of the National. Insurance Fund. This table does not include programme expenditure.
| 2017-18 Outturn | 2018-19 Outturn | 2019-20 Outturn | 2020-21 Outturn | 2021-22 Outturn | 2022-23 Plans | 2023-24 Plans | 2024-25 Plans | |
|---|---|---|---|---|---|---|---|---|
| Resource DEL | ||||||||
| HMRC administration | 754,343 | 773,467 | 767,280 | 896,424 | 828,681 | 998,038 | 1,054,813 | 1,018,934 |
| Utilised provisions | 8,596 | 7,057 | 2,208 | – | – | 14,000 | 14,796 | 14,293 |
| National Insurance Fund | 78,597 | 59,264 | 51,552 | 50,536 | 56,030 | 54,706 | 57,818 | 55,851 |
| Total administration budget | 841,536 | 839,788 | 821,040 | 946,960 | 884,711 | 1,066,744 | 1,127,427 | 1,089,079 |
| Of which: | ||||||||
| Staff costs | 329,804 | 335,364 | 401,196 | 467,299 | 437,580 | 467,810 | 494,422 | 477,604 |
| Purchase of goods and services | 350,347 | 341,999 | 245,209 | 338,798 | 374,643 | 385,447 | 449,021 | 430,081 |
| Income from sales of goods and services | -40,483 | -35,670 | -34,256 | -94,044 | -94,887 | -5,964 | -6,303 | -6,088 |
| Current grants to persons and non-profit bodies (net) | 1,687 | 1,671 | 1,660 | 1,661 | 1,642 | 1,670 | 1,765 | 1,705 |
| Rentals | 103,038 | 94,795 | 132,956 | 149,860 | 110,563 | 61,496 | 64,994 | 62,783 |
| Depreciation | 88,050 | 76,452 | 63,784 | 52,274 | 30,933 | 141,411 | 107,808 | 107,808 |
| Other resource | 9,093 | 25,177 | 10,491 | 31,112 | 24,237 | 14,874 | 15,720 | 15,185 |
| 841,536 | 839,788 | 821,040 | 946,960 | 884,711 | 1,066,744 | 1,127,427 | 1,089,079 |
Note: The totals may differ to the information in the Statement of Parliamentary Supply due to rounding.
Annex 3: Sustainability data tables
Greenhouse gas emissions
Non-financial indicators (tCO2e, 000s)
| 2019-20 | 2020-21 | 2021-22 | |
|---|---|---|---|
| Total gross emissions | 62.12 | 50.65 | 38.87 |
| Total net emissions | 58.97 | 29.23 | 24.65 |
| Gross emissions Scope 1 and 2 | 51.97 | 50.04 | 37.03 |
| Gross emissions Scope 3 (business travel) | 10.16 | 0.61 | 1.84 |
Energy consumption (kWh, 000s)
| 2019-20 | 2020-21 | 2021-22 | |
|---|---|---|---|
| Electricity: non-renewable | 83,190 | 3,991 | 3,762 |
| Electricity: renewable | 11,369 | 84,586 | 61,537 |
| Gas | 102,281 | 123,598 | 89,768 |
| Oil | 12,138 | 9,222 | 8,709 |
| Whitehall District Heating | 3,259 | 3,003 | 3,373 |
| Enviroenergy District Heating | 4,418 | 3,973 | 4,207 |
| Stratford District Heating | N/A | 4,132 | 5,289 |
| Sheffield District Heating | 501 | 538 | N/A [1] |
- Site now closed
Travel breakdown (tCO2e, 000s)
| 2019-20 | 2020-21 | 2021-22 | |
|---|---|---|---|
| Road | 5.1 | 0.88 | 1.89 |
| Rail | 3.9 | 0.07 | 0.37 |
| Air (domestic and overseas) | 3.6 | 0.22 | 0.61 |
Financial indicators (£000)
| 2019-20 | 2020-21 | 2021-22 | |
|---|---|---|---|
| Expenditure on energy | 21,594 | 22,061 | 20,358 |
| Expenditure on official business travel | 36,502 | 1,735 | 6,098 |
| Expenditure on accredited offset purchases | – | – | – |
Waste
Non-financial indicators Tonnes (000s)
| 2019-20 | 2020-21 | 2021-22 | |
|---|---|---|---|
| Total waste | 8.80 | 4.93 | 4.80 |
| Landfill | 0.06 | 0.03 | 0.01 |
| Reused/recycled | 7.03 | 4.19 | 3.64 |
| Incinerated/energy from waste | 1.71 | 0.72 | 1.15 |
Financial indicators (£000s)
| 2019-20 | 2020-21 | 2021-22 | |
|---|---|---|---|
| Total waste | 499 | 279 | 270 |
| Landfill | 9 | 4 | 1 |
| Reused/recycled | 394 | 235 | 204 |
| Incinerated/energy from waste | 96 | 40 | 65 |
Finite resource consumption – water
Non-financial indicators (m3 000s)
| 2019-20 | 2020-21 | 2021-22 | |
|---|---|---|---|
| Water consumption Supplied | 524 | 283 | 239 |
Non-financial indicators (m3/FTE)
| 2019-20 | 2020-21 | 2021-22 | |
|---|---|---|---|
| Water consumption Supplied | 6.7 | 3.69 | 3.80 |
Financial indicators (£000s)
| 2019-20 | 2020-21 | 2021-22 | |
|---|---|---|---|
| Water consumption Supplied | 2,575 | 1,517 | 1,027 |
Copier paper purchased
Non-financial indicators (A4 reams equivalent 000s)
| 2019-20 | 2020-21 | 2021-22 | |
|---|---|---|---|
| Copier paper purchased | 142 | 23 | 23 |
Financial indicators (£000s)
| 2019-20 | 2020-21 | 2021-22 | |
|---|---|---|---|
| Copier paper purchased | 382 | 67 | 69 |
Domestic flights
Non-financial indicators (number of flights)
| 2019-20 | 2020-21 | 2021-22 | |
|---|---|---|---|
| Total number of domestic flights | 27,665 | 782 | 3,335 |
| Total number of international flights | 4,142 | 282 | 636 |
| Total number of audio conferences | 1,371,545 | 5,663,712 | 6,799,672 |
Annex 4: Reporting of Injuries, Diseases and Dangerous Occurrences Regulations 2013 (Northern Ireland 1997): reports to the Health and Safety Executive
RIDDOR incidents
| 2021-22 | 2020-21 | |
|---|---|---|
| Specified injuries to workers | 7 | 0 |
| Occupational diseases | 1 | 2 |
| Fatal injuries | 0 | 0 |
| Dangerous occurrences | 0 | 0 |
| Over three-day incapacitation of worker (Northern Ireland) | 0 | 2 |
| Non-fatal accidents to non-workers | 0 | 0 |
| Over seven-day incapacitation of worker | 10 | 21 |
| Total | 18 | 25 |
Non-RIDDOR incidents
| 2021-22 | 2020-21 | |
|---|---|---|
| Stress | 471 | 498 |
| Slips/trips/falls | 49 | 31 |
| Violence and verbal abuse | 126 | 134 |
| Environmental | 22 | 20 |
| Road traffic accident | 54 | 22 |
| Bite (animal/insect) | 1 | 3 |
| Burns | 10 | 6 |
| Collision with a moving/fixed object | 48 | 37 |
| Cut | 6 | 11 |
| Manual handling | 4 | 3 |
| Exposure to hazardous substances | 4 | 0 |
| Asbestos, lead, ionising radiation | 0 | 12 |
| Noise | 8 | 11 |
| Electrical | 9 | 13 |
| Musculoskeletal | 46 | 131 |
| Other (note 1) | 32 | 32 |
| Total | 890 | 964 |
Annex 5: Independent reports
The Trust Statement Audit Report of C&AG to the House of Commons
The Resource Accounts Certificate and Report of C&AG to the House of Commons