Pensioners’ Incomes Series: Background information and methodology financial year 2019 to 2020
Published 25 March 2021

© Crown copyright 2021
This publication is licensed under the terms of the Open Government Licence v3.0 except where otherwise stated. To view this licence, visit nationalarchives.gov.uk/doc/open-government-licence/version/3 or write to the Information Policy Team, The National Archives, Kew, London TW9 4DU, or email: psi@nationalarchives.gov.uk.
Where we have identified any third party copyright information you will need to obtain permission from the copyright holders concerned.
This publication is available at https://www.gov.uk/government/statistics/pensioners-incomes-series-financial-year-2019-to-2020/pensioners-incomes-series-background-information-and-methodology-financial-year-2019-to-2020
1. Background information
A. Purpose of the statistics
The Pensioners’ Incomes (PI) Series contains estimates of the levels, sources and distribution of pensioners’ incomes. It also examines the position of single pensioners and pensioner couples, including any dependent children, within the income distribution of the population as a whole. This is different from Households Below Average Income (HBAI), where analysis is on a household basis and includes the income of adults living in the same household but not in the pensioner unit.
This is a key source of information that is used to inform Government thinking on relevant policies, as well as related programmes and projects. Researchers and analysts outside government use the statistics and data to examine topics such as ageing, distributional impacts of fiscal policies and the income profiles of pensioner groups. Estimates in PI (as well as in HBAI) are based on data from the Family Resources Survey (FRS).
Read more about Pensioners’ Incomes online.
Versions of the dataset are available from the UK Data Service.
UK-level PI data is available on the Stat-Xplore online tool which allows users to create their own PI analysis. The PI information is available at family (benefit unit) level.
B. Context of the statistics
Pensioners are an increasingly large and diverse group in the population. There are a number of recent reforms affecting current and future pensioners, including:
-
Private pension reforms including automatic enrolment
This publication illustrates changes in pensioners’ incomes over time and puts the results in the context of both economic and policy changes.
Pensioner demographics
The Office for National Statistics (ONS) population estimates for mid-2020 found that people aged 65 and over represented nearly one in five people. While a pensioner cannot simply be defined as a person over the age of 65, is a reasonable approximation for the purpose of giving context. The proportion of people aged 16 to 64 years has remained relatively stable over the last 40 years.
However, over the past 10 years this proportion has started to decline and is projected to decline further in the future. This is a result of the growth in the population aged 65 and over.
According to the ONS, between 1999 and 2019 the proportion of people aged 65 and above has been increasing. This increase is projected to continue, with the proportion growing to nearly a quarter of the population by 2039. The ageing of the population of the United Kingdom (UK) is influenced by many factors including mortality, fertility, healthcare and lifestyles.
Home ownership continues to be higher for pensioners compared to those of working age. Around three-quarters of pensioners live in homes that are owned outright (compared to roughly one in five of the working-age population), so therefore face minimal housing costs.
Differences by age
PI finds that there are differences in average incomes between age groups. There are a number of reasons for this which should be noted when interpreting these results:
- The ‘age’ effect
- The ‘cohort’ effect
- The length of time since retirement
The ‘age’ effect
Older pensioners are less likely to be in work and hence receive a smaller amount from earnings. Furthermore, they are less likely to have a partner who is in work. Any pension(s) they may be in receipt of are related to their earnings, years of scheme membership, and pension contributions (including national insurance in the case of the State Pension) they made previously in their working lives;
The ‘cohort’ effect
The rapid rise in occupational pension coverage in the 1950s and 1960s will have been more beneficial to later cohorts. Therefore, each successive cohort of pensioners has, in general, had a higher income than the older cohort it effectively replaces, and this has pushed up the average income of the pensioner group as a whole. The introduction of the new State Pension also contributes to this effect. This increase in coverage is becoming less relevant but increases in occupational pension income is still expected as later cohorts will contribute more due to higher earnings;
The length of time since retirement
Pensions generally increase by less generous uprating measures after retirement. In addition, most annuities purchased with occupational or personal pensions are level annuities, which do not increase over time. Income in real terms is therefore decreasing for these annuities once inflation is taken into account.
Policy changes
Council Tax
In England, the Ministry of Housing, Communities and Local Government estimated that the average Band D council tax set by local authorities in Financial year ending (FYE) 2020 represented an increase of 4.7 per cent on FYE 2019 levels.
In Wales, the average Band D council tax in FYE 2020 represented an increase of 6.6 per cent on FYE 2019 levels.
In Scotland, the average Band D council tax in FYE 2020 represented an increase of 3.6 per cent on FYE 2019 levels.
In Northern Ireland, the Regional Rate for the FYE 2020 tax year increased by 4.8 per cent on FYE 2019 levels.
Housing benefit
In FYE 2020, most Local Housing Allowance (LHA) rates remained frozen at FYE 2016 cash values. Rates in the least affordable areas were given Targeted Affordability Fund (TAF), which amounts to a three per cent increase.
The majority of Housing Benefit rates for FYE 2020 remained unchanged.
Income tax
In FYE 2020, the income tax personal allowance increased by £650 to £12,500.
National Living Wage
In April 2019, the National Living Wage was increased to £8.21 per hour for employees aged 25 years and over. Employees under the age of 25 continue to get the National Minimum Wage, which increased from April 2019 to £7.70 per hour for those aged 21 to 24 years and £6.15 per hour for those aged 18 to 20 years.
Pension Participation
Automatic enrolment completed its roll-out in 2018.
From April 2019, the minimum contribution increased by three percentage points to eight per cent with at least three per cent from the employer.
Personal Independence Payment (PIP)
PIP was introduced from April 2013 for new claimants and from October 2013 DWP began inviting claimants in receipt of Disability Living Allowance who were aged between 16 and 64 on 8 April 2013, or reached age 16 after that date to claim PIP.
State Pension
The new single-tier State Pension launched on 6 April 2016 for people who reach pension age on or after April 2016. This consolidated the basic State Pension and additional State Pension into one single amount. The amount paid to individuals depends on recipients’ National Insurance contributions.
In FYE 2020, the increase was 2.6% in line with the Consumer Prices Index (CPI).
The basic State Pension rate was £129.20 per week in FYE 2020, and the new State Pension full rate was £168.60.
State Pension Age
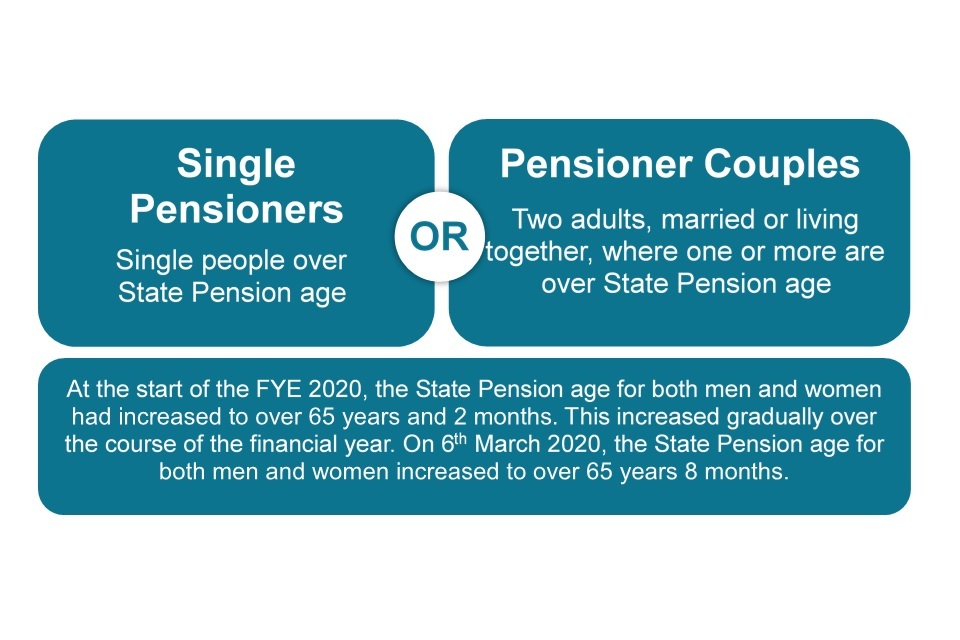
From 6 April 2010, the State Pension age has been increasing gradually for both men and women. The data in this report were collected throughout the financial year FYE 2020, during which the State Pension age for both men and women increased from over 65 years 2 months to over 65 years 8 months.
Support for Mortgage Interest
In April 2018 Support for Mortgage Interest Loans (SMIL) were introduced to provide support for mortgage interest through a loan instead of benefits. In tandem with this change, Mortgage Payment Protection Insurance (MPPI) payments are fully disregarded in all means-tested benefits if the claimants would be entitled to a SMIL and all MPPI is disregarded in the calculation of Universal Credit.
Triple Lock
The basic State Pension and the new State Pension increases every year by whichever is the highest of the following:
-
Earnings: the average percentage growth in wages (in Great Britain)
-
Prices: the percentage growth in prices in the UK as measured by the Consumer Prices Index (CPI)
-
2.5%
In FYE 2020, the increase was 2.6% in line with CPI.
Universal Credit
Since April 2013, Universal Credit has been replacing income-based Jobseeker’s Allowance, income-related Employment and Support Allowance, Income Support, Working Tax Credit, Child Tax Credit and Housing Benefit.
National roll-out of Universal Credit, for all new relevant claims, completed in December 2018. Existing exceptions within the two child policy for kinship carers and adopters were extended to apply to any eligible children in a household from November 2018.
Existing claimants on legacy benefits without a change in circumstance can currently remain on their legacy benefit(s) until there is a change in circumstance.
In July 2019, The Universal Credit (Managed Migration Pilot and Miscellaneous Amendments) Regulations 2019 were introduced. These provided for the removal of the Severe Disability Premium (SDP) Gateway from 27 January 2021, meaning that from this date, SDP recipients will be able to make a new claim to Universal Credit.
The regulations also introduced the SDP transitional payments to those claimants who were previously entitled to the SDP as part of their legacy benefit and had moved to Universal Credit before the SDP Gateway came into effect on 16 January 2019.
The SDP transitional payments consisted of:
-
An ongoing monthly amount of either £120, £285 or £405 depending on a person’s circumstances
-
An additional lump sum payment to cover the period since they moved onto Universal Credit
Up-rating
From FYE 2017 to 2020 certain working-age benefits were frozen at FYE 2016 cash values:
-
Working-age benefits, including the main rates of Jobseeker’s Allowance, Income Support, Universal Credit, Employment Support Allowance and Housing Benefit remained frozen at FYE 2016 cash values
-
Child Benefit, along with some elements of tax credits, was frozen at FYE 2016 cash values. Family and childcare elements of tax credit were frozen in cash terms
Benefits excluded from the freeze included:
-
Disability Living Allowance
-
Personal Independence Payment
-
Employment and Support Allowance Support Group component
-
UC Limited Capability for Work and Work-Related Activity Element
-
Premiums paid to disabled people receiving working-age benefits, where they, their partner or their children are disabled
-
Carer benefits
-
Pension benefits
-
Attendance Allowance
-
Maternity Allowance
-
Statutory Sick Pay
-
Statutory Maternity Pay
-
Statutory Paternity Pay
-
Statutory Shared Parental Pay
-
Statutory Adoption Pay
In April 2019:
The State Pension was up-rated by 2.6 per cent (CPI) in line with the triple lock, which ensures that it increases by the highest of the increase in earnings, price inflation (as measured by the CPI) or 2.5 per cent:
-
In FYE 2020, the Standard Minimum Guarantee in Pension Credit was increased by earnings resulting in a 2.6 per cent increase for a single person from £163.00 a week to £167.25, a cash increase of £4.25. For couples, the Standard Minimum Guarantee in Pension Credit was increased by earnings resulting in a 2.6 per cent increase from £248.80 a week to £255.25, a cash increase of £6.45
-
Universal Credit work allowances were increased by £1,000 per year
COVID-19
There were some policy changes implemented from March 2020 as a result of COVID-19. These will not be reflected in the data collected during the survey year FYE 2020 as interviews were suspended with the announcement of the first national lockdown in March 2020.
C. Source of the statistics
The Family Resources Survey (FRS) is the main underlying data source for PI. It is one of the largest cross-sectional household surveys in the United Kingdom. The focus of the FRS is on capturing information on household incomes so it provides more detail on different income sources than other household surveys, making it the foremost source of income data. The FRS also captures contextual information on the household and individual circumstances, such as employment, education level and disability. Overall, it is a comprehensive data source that allows for a range of different analysis.
The PI publication is also based on the Households Below Average Income (HBAI) dataset, which is derived from the FRS. HBAI makes an adjustment for households with very high incomes, as the FRS under-records information about these households. The HBAI Quality and Methodology Information Report provides further details on this and other topics.
The FRS is an annual survey based on financial years. Data are available for every year since FYE 1995.
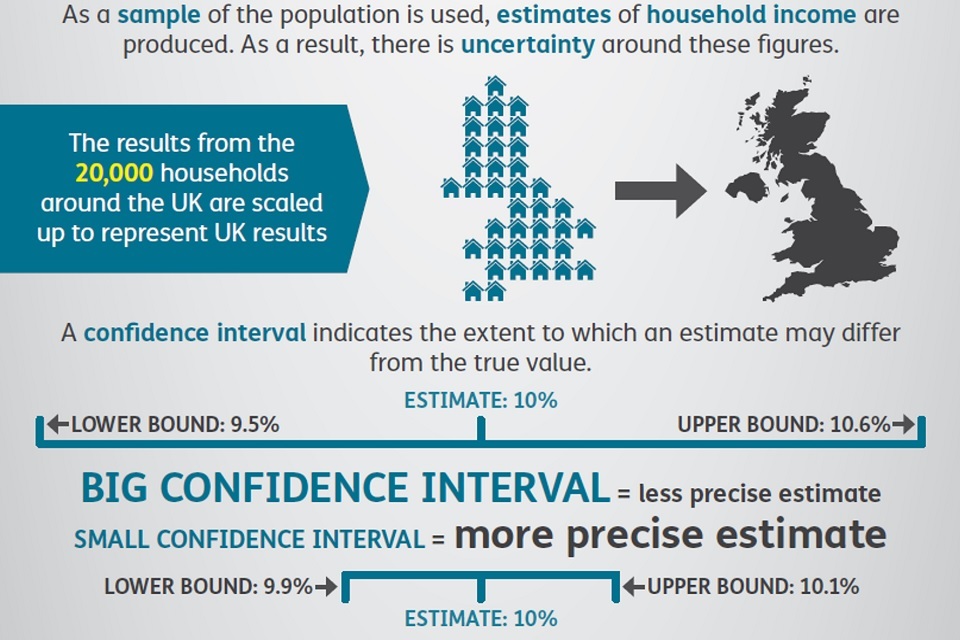
Sample size: From April 2011, the target achieved GB sample size for the FRS was reduced by 5,000 households. From FYE 2012 onwards, the overall achieved sample size for the UK is around 20,000 households. A published assessment concluded that this reduced sample still allows the core outputs from the FRS, such as the individual measure of income in PI, to be produced.
Coverage: Until FYE 2002, the FRS covered Great Britain. Since FYE 2003, Northern Ireland has been included, meaning the whole of the United Kingdom is included in PI. Therefore, caution should be taken when comparing results across these years.
D. Limitations of the statistics
This publication is based on survey data. Therefore, it is subject to potential limitations inherent in all surveys, including:
- Sampling error
- non-response error
- survey coverage
- survey design
- sample size
Sampling error
This will vary to a greater or lesser extent depending on the level of disaggregation at which results are presented
Non-response error
Systematic bias due to non-response by households selected for interview in the FRS. The response rate for the FRS in the FYE 2020 was 49%. In an attempt to correct for differential non-response, estimates are weighted using population totals
Survey coverage
The FRS covers private households in the UK. Therefore, individuals in nursing or retirement homes, for example, will not be included. This means that figures relating to the most elderly individuals may not be representative of the UK population, as some individuals in this age group will have moved into homes where they can receive more frequent help
Survey design
The FRS uses a clustered sample design to produce robust regional estimates. Therefore, the FRS is not suitable for analysis below region level
Sample size
Although the FRS has a relatively large sample size for a household survey, small sample sizes may require several years of data to be combined for some analysis
Furthermore, relative to administrative records, the FRS is known to under-report benefit receipt. However, the FRS is considered to be the best source for looking at benefit and tax credit receipt by characteristics not captured on administrative sources, and for looking at total benefit receipt on a benefit unit or household basis. It is often inappropriate to look at benefit receipt on an individual basis because means-tested benefits are paid on behalf of the benefit unit. For further information on the under-reporting of benefit receipt, see the FRS Background note and methodology report.
Please note: A minor methodological revision has been made in the FYE 2020 HBAI publication to capture all income from child maintenance in HBAI. This will result in more income from child maintenance being included, which in turn will slightly increase some household incomes and so tend to lower Pensioner Unit positions in the overall income distribution. This means that tables 4.6 and 4.7 from the publication of these statistics will be very slightly different to those published previously.
E. Strengths of the statistics
-
The FRS captures more detail on different income sources compared to other household surveys; this allows the PI series to analyse and report on the different income sources for pensioners
-
the FRS provides information on components of income and housing costs which are unavailable in administrative data
-
the relatively long time series available means that trends can be assessed going back to FYE 1995, allowing an analysis of the effects of policies and events on the incomes of pensioners over time
-
the range of demographic breakdowns allow comparisons between the incomes of groups of pensioners based on age, gender, ethnicity and marital status
-
confidence intervals are calculated for a wide range of estimates using a bootstrapping approach (see ‘Measuring the size of sampling error’ below). These measures of uncertainty indicate whether differences between demographic groups and changes between years are likely to be real differences or caused by sampling error
F. Alternative data sources
There are other data sources that can provide information on areas of interest similar to those in the PI publication. These are listed below:
-
Households Below Average Income (HBAI) presents the number and percentage of pensioners living in low income households and material deprivation
-
The Family Resources Survey (FRS) publication includes pension participation for working-age individuals. This shows those who are saving for retirement and the type of pension they are saving in (occupational or personal)
-
Income Dynamics (ID) looks at changes in household income including a measure of persistent low income, based on Understanding Society data
-
The DWP Stat-Xplore Tool is a tool which provides users with access to administrative data, as well as data from HBAI and PI which allows users to conduct their own analysis. Users can download and analyse statistics on a range of different benefits, programmes, and other administrative information collected and stored by the department
-
The English Longitudinal Study of Ageing (ELSA) is a biennial longitudinal study of the health, social and economic circumstances of a sample of approximately 8,500 people aged over 50 in England. ELSA started in the early 2000s, with nine waves of data currently published. It provides longitudinal data on pensions, savings, and labour market participation, as well as information on employment, retirement interactions, and transitions over the life courses of respondents as they grow older. ELSA also provides information on health trajectories, disability, and healthy life expectancy
-
The Wealth and Assets Survey (WAS) is a large scale longitudinal survey with six rounds currently published. Round 6 (2016 to 18) had a sample of around 18,000 private households in Great Britain. It is conducted by the Office for National Statistics (ONS). The WAS dataset holds information about the economic status of households and individuals including their physical and financial assets, debts, and pension provision. WAS data are also used to understand how wealth is distributed and the factors which may affect financial planning, as well as a respondents’ attitudes and behaviours towards saving. The Pension Wealth chapter in WAS provides estimates of the types of private (non-state) pension wealth, split by a wide range of socio-demographic and economic breakdowns
-
The Occupational Pension Scheme Survey (OPSS) was an annual survey, conducted by ONS. It covered occupational pension schemes from the public and private sector and samples at the level of the scheme. The OPSS provided the UK’s longest consistent time series for estimates of pension scheme membership, with data from 1953 to 2018, and it provided estimates of the number of schemes, scheme members, and their level of contributions
-
The Annual Survey of Hours and Earnings (ASHE) is published by the ONS. It has been in place since 1997, and can be used to provide information on earnings for individuals close to or over SPa. It also collects significant information on employee pension membership and contributions. Due to the large sample size (180,000 employees) and the fact it is completed by the employer, rather than the employee, it is generally thought to provide the most robust indicator of employee pension membership. They also provide a summary dataset of pensioner results
-
The Labour Force Survey (LFS) is a continuous, large scale sample survey conducted by the ONS, in which 40,000 UK households are interviewed each quarter. The survey provides information on the labour market, including employment, unemployment, and economic activity rates. This source can be used to provide information on individuals close to or over SPa in the labour market
-
The Benefit expenditure and caseload tables produced by DWP contain historic and forecast benefit expenditure and caseload data. These tables include long-term projections of pensioner benefit expenditure, as well as State Pension expenditure by country of residence
-
DWP benefit statistics provide a high-level summary of National and Official statistics available through Stat-Xplore on a range of benefits, including the State Pension and Pension Credit. The main statistical release document is published on a six-monthly basis, with some data also released quarterly via Stat-Xplore and data tables
-
Personal incomes statistics: Her Majesty’s Revenue and Customs (HMRC) publishes summary information about individuals who are UK taxpayers, their income, and the income tax to which they are liable. The data comes from the annual Survey of Personal Incomes, which samples administrative data held by HMRC on people who could be liable to UK income tax for the income tax year. This source includes information on income and tax for taxpayers of pension age
-
A guide to sources of data on income and earnings: The ONS has produced a guide for users of official statistics on earnings and income. This guide compares the main sources of data available and outlines which sources will best meet user needs
-
Explaining income and earnings provides regularly updated information on income and earnings statistics published by government departments, including DWP. Contains information on gender, occupations, the number of people living below the minimum wage
G. Definitions and terminology
More information can be found in the glossary
Pensioner Units
The PI series provides analysis on pensioner benefit units (known as pensioner units), which include the following:
Age of pensioner units
For analysis of pensioner units by age, pensioner couples are categorised by the age of the Head. The head of the pensioner unit is the Household Reference Person (HRP, see below) if they belong to the pensioner unit. In households with multiple benefit units, if the HRP is not part of the pensioner unit, the head of the pensioner unit is the first person from the pensioner unit named in the interview. In households where there is one person under SPa and one person over SPa, the younger person may be the HRP and therefore the head of a pensioner unit need not be over SPa.
The Household Reference Person (HRP) is the householder with the highest income, regardless of gender.
-
in a single adult household, the HRP is the sole householder (i.e. the person in whose name the accommodation is owned or rented)
-
if there are two or more householders, the HRP is the householder with the highest personal income from all sources
-
if there are two or more householders who have the same income, the HRP is the eldest householder
In the PI series, pensioner units are classified as having recently reached State Pension age (SPa) if the head was within five years of SPa at the time of interview. See “recently reached State Pension age” in the glossary. Pensioner units who recently reached State Pension age are also included in the ‘Under 75’ age group.
It should be noted that due to the rising SPa, this definition classifies some pensioners as having “recently reached State Pension age” even if they reached their SPa more than five years ago.
For example, a woman born on 6 April 1951 will have reached SPa on 6 May 2012, aged 61 years 1 month. When interviewed on 6 July 2019, she is 68 years 3 months old and reached her SPa 8 years 2 months ago. However, because the SPa has risen to 65 years 4 months by the date of interview, she is still classed as having “recently reached State Pension age” because she is within five years of the current SPa.
Income
PI estimates do not reflect income from other adults and their dependent children in a household. For example, if a pensioner lives with their adult children, the younger adults’ incomes are not included in this analysis. While the benefit income of dependent children is included in estimates, this was only relevant for less than half a per cent of pensioner units in FYE 2020.
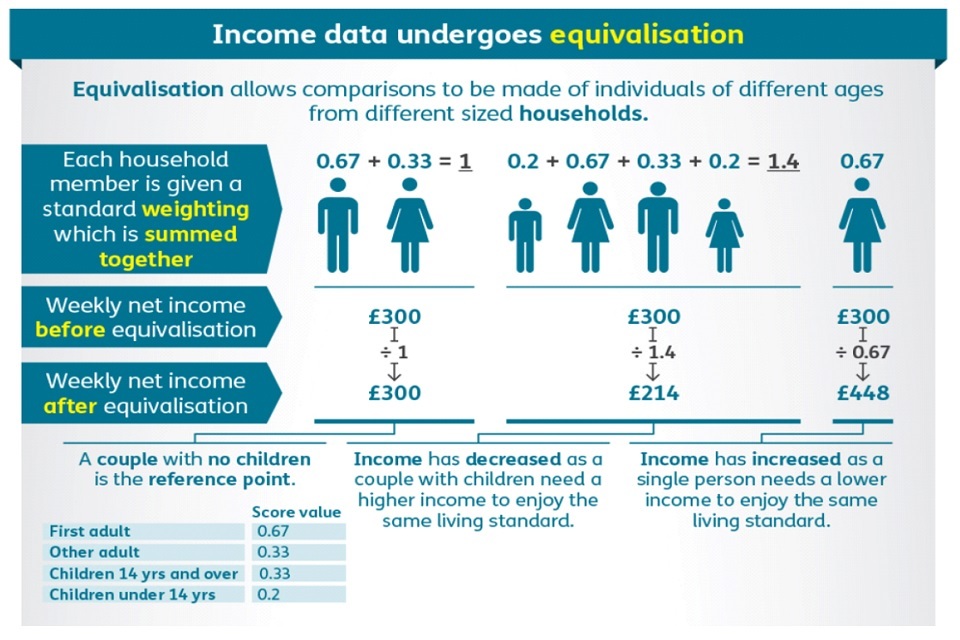
Estimates are based on unequivalised income, except when comparing to the overall population distribution in section 7 of the main publication and in tables 4.6 and 4.7 of the table pack. Equivalisation makes an adjustment to income to reflect household size and composition in order to compare income across households as a measure of living standards, and is used in the HBAI publication. In most cases in the PI series, income is shown for single pensioners and pensioner couples separately.
Income measures
Gross income: In the PI Series, gross income is generally separated into six components:
-
Income from benefits: including tax credits. In some tables this is further divided into:
-
State Pension: Basic and Additional State Pensions, New State Pension, Bereavement Allowance (previously Widow’s Pension), and Widowed Parent’s Allowance
-
Income-related benefits: Pension Credit, Housing Benefit, Council Tax Reduction, Social Fund Payments and Universal Credit (for working-age partners of pensioners included within the Pensioners’ Incomes dataset)
-
Disability benefits: Disability Living Allowance, Personal Independence Payments, Armed Forces Compensation Scheme, Attendance Allowance, Industrial Injuries Disablement Benefit and any remaining Severe Disablement Allowance cases
-
These three benefit types are not exhaustive: there are benefits, such as Winter Fuel Payments and Carers’ Allowance, which do not fit into any of these categories but are included in total benefit income.
-
Income from occupational pensions: employee pensions associated with an employer and workplace
-
Income from personal pensions: personal pensions, annuities bought with lump sums from personal pensions, trade union and friendly society pensions
Income from private pensions is the sum of income from occupational pensions and personal pensions.
-
Income from investments: including interest from Individual Savings Accounts (ISAs) and other savings accounts, unit trusts, bonds, stocks and shares
-
Income from earnings: including employee earnings and profit and loss from self-employment
-
Other income: benefits from friendly societies, income received for dependent children, maintenance payments and, from November 2000, free TV licences for those aged 75 and over.
More information about the different income sources can be found in the glossary
Net income Before Housing Costs (BHC) is gross income less:
-
Income tax payments
-
National Insurance contributions
-
Contributions to pension schemes
-
Local taxes (i.e. council tax or domestic rates)
-
Maintenance and child support payments
-
Student loan repayments
-
Parental contributions to students living away from home
Net income After Housing Costs (AHC) is derived by deducting a measure of housing costs from the above income measure and is also net of:
-
Rent (gross of housing benefits)
-
Water rates, community water charges and council water charges
-
Structural insurance premiums (for owner occupiers)
-
Mortgage interest payments (net of any tax relief)
-
Ground rent and service charges
Income from Housing Benefit is included within gross income as an income-related benefit. Capital mortgage repayments are not deducted as a Housing Cost, as this is regarded as an asset being accrued and not a cost.
We use AHC figures throughout the PI publication unless otherwise stated, as this is a better reflection of pensioners’ disposable incomes.
H. National Statistics Status
National Statistics status means that our statistics meet the highest standards of trustworthiness, quality and public value, and it is our responsibility to maintain compliance with these standards.
The statistics underwent a full assessment against the Code of Practice for Statistics in 2011 and were confirmed as National Statistics in November 2012 by the Office for Statistics Regulation.
Since the latest review by the Office for Statistics Regulation, we have continued to comply with the Code of Practice for Statistics, and have made a number of improvements including:
-
Value has been added as, in line with DWP Statistics reporting practices, publications have been made significantly shorter to enable a focus on commentary and analysis that aids interpretation to increase clarity and insight
-
The timeliness of the publication has been improved so that reports are released within 12 months of the completion of the FRS, made possible by improvements to the suite of codes that are used to conduct analysis
-
By making our data available on Stat-Xplore and the UK Data Service, our statistics are more accessible and support new analysis for users not included in the publications themselves
-
The quality of statistics has improved as variants of the Consumer Price Index (CPI) have replaced the use of Retail Prices Index (RPI) when adjusting for inflation, in line with guidance from the UK Statistics Authority and National Statistician
-
Introduced an improved methodology for measuring and reporting uncertainty around key PI estimates
It is DWP’s responsibility to maintain compliance with the standards expected of National Statistics. If DWP becomes concerned about whether these statistics are still meeting the appropriate standards, we will discuss any concerns with the Office for Statistics Regulation. National Statistics status can be removed at any point when the highest standards are not maintained, and reinstated when standards are restored.
Read further information about National Statistics on the UK Statistics Authority website.
DWP considers that all PI Series statistics in this publication are “Fully Comparable at level A*” of the UK Countries Comparability Scale across countries.
I. Quality Statement
The PI Series is based on the HBAI dataset. This dataset undergoes substantial checking and verification both internally within DWP, and externally by the Institute for Fiscal Studies (IFS). When producing charts and tables for the publication, all content is independently quality assured by different members of the PI team to ensure methodology is robust. All commentary in the PI report is reviewed by the PI team and analysts from the relevant policy areas within DWP to ensure the information presented is accurate and meets user needs.
J. Feedback
If you have any comments or questions, please contact:
Joanne Burrage,
Pensioners’ Incomes Series Team Leader, Surveys Branch,
Department for Work and Pensions,
Benton Park View,
Benton Park Road,
Newcastle Upon Tyne,
NE98 1YX
Email: pensioners incomes@dwp.gov.uk
Direct line: 0191 216 8950
DWP Press Office: 0203 267 5144
K. Acknowledgements
Publication Lead: Jack Andrews
2. Methodology
Points to note
| Use… | If… |
|---|---|
| Gross | Interested in how much income pensioners receive before any taxes are applied; Or interested in different sources of income. |
| Net | Interested in income available for pensioners to spend (excluding the income of other household members), either Before or After housing costs. |
| Mean | Interested in all income available to pensioner units in a particular group; Do not consider the influence of the highest incomes to be a major problem; Or interested in breaking down income by source. |
| Median | Interested in the income of the ‘typical’ pensioner unit; Do not want the average distorted by a small number of high incomes; Or are looking at distributions of incomes. |
| Average (mean or median) for all | Interested in all income available to pensioner units; Or want to include those with no income from a particular source. |
| Average (mean or median) for those in receipt | Interested in the average ‘rate’ at which people receive income from a particular source; Or are interested in an individual source of income. |
| All pensioner units | Interested in broad trends in cash amounts for pensioners (both in couples and singles) as a whole. |
| Singles and couples separately | Comparing subgroups that contain different proportions of singles and couples; Or looking at distributions of income. |
| After housing costs | Interested in the income available for pensioners to spend after their housing costs have been met; Considering changes in this net income over time; Or for comparing pensioners’ incomes with working-age incomes. |
| Before housing costs | Interested in total net income. |
A. Rounding and Accuracy
In the tables and publication, the following conventions have been used:
| Notation | Definition |
| 0 | Nil (none recorded in the sample) |
| - | Negligible (less than 0.5 per cent or 50p) |
| .. | Not available due to small sample size (fewer than 50 for averages, fewer than 100 for percentages) or as a result of less than three years of comparable data in three-year average tables. |
Figures have been rounded to the nearest pound or percentage point. Population sizes have been rounded to the nearest 0.1 million. Individual figures have been rounded independently, so the sum of component items do not necessarily equal the totals shown.
B. Measuring living standards
Incomes are often used as a measure of the ‘standard of living’ achieved by different groups. However, there are many other factors that can affect living standards, such as wealth, physical health and expenditure. These factors are not considered in this report. Furthermore, estimates of incomes in the PI Series only take into account the income of the pensioner benefit unit.
Pensioners’ standards of living may also be affected by the income of other adult members of the household or their dependents. Also, no adjustment (equivalisation) is made for single pensioners compared to couples. Income estimates should therefore only be regarded as broadly indicative of pensioners’ overall living standards.
Material deprivation for pensioners, an additional indicator for measuring living standards, has been included in the HBAI publication since FYE 2010 and is derived from a suite of questions in the FRS. A final score is calculated from the set of questions and compared with a threshold score to determine whether a pensioner is in material deprivation.
For details of the material deprivation indicator, see: Department for Work and Pensions Working Paper Number 54. For the latest results on the percentage of pensioners in low-income households and material deprivation, see the HBAI publication for FYE 2020.
Detailed information on the production of the FRS dataset can be found in this year’s FRS Background note and methodology report. This includes information on the survey design, sampling, collection, and quality assurance processes.
C. Grossing
Grossing-up is the term usually given to the process of applying factors to sample data so that they yield estimates of the overall population. Estimates in the PI publication incorporate the 2011 Census based mid-year population estimates into the grossing regime from FYE 2013 onwards. A consistent back series has been produced from FYE 2003 to FYE 2012.
In addition to the use of 2011 Census data, a number of minor methodological changes have also been implemented in the FRS dataset. These methodological changes were made on the recommendation of the ONS Methodological Advisory Service during an Initial Review of the FRS weighting scheme. A report of the changes made to the grossing regime is available.
A software package called CALMAR, provided by the French National Statistics Institute, is used to reconcile control variables at different levels and estimate their joint population. This software makes the final weighted sample distributions match the population distributions through a process known as calibration weighting. It should be noted that if a few cases are associated with very small or very large grossing factors, grossed estimates will have relatively wide confidence intervals.
D. Adjusting for inflation
The PI Series uses uprating factors to adjust for inflation, by bringing values from previous years into current price terms for the most recent year of the publication. As advised in a Statistical Notice published in May 2016, from FYE 2015 PI made a methodological change to use variants of the Consumer Prices Index (CPI) when adjusting for inflation. Prior to the FYE 2015 PI publication, variants of the Retail Prices Index (RPI) were used to adjust for inflation.
Read more information in the FYE 2015 PI publication’s background information and methodology.
Since the PI FYE 2018 publication, the Office for National Statistics (ONS) have made some very minor revisions to the bespoke Consumer Price Index (CPI) series we use to make real-terms income comparisons within and between survey years. However, because the effect of these revisions on pensioners’ incomes is negligible no revisions have been made to the deflators used in PI. See the following ONS update for more details.
E. Adjustment for individuals with very high incomes
An adjustment is made to sample cases at the top of the income distribution to correct for volatility in the highest incomes captured in the survey. This adjustment uses data from HM Revenue and Customs Survey of Personal Incomes (SPI) to control the numbers and income levels of the ‘very rich’ while retaining the FRS data on the characteristics of the households. For FYE 2020, pensioners in Great Britain are subject to the SPI adjustment if their gross income exceeded £88,000 per year (£70,900 in Northern Ireland). Working-age adults (including the working-age partners of pensioners) are subject to the SPI adjustment if their gross income exceeded £308,300 per year (£167,000 per year in Northern Ireland). For more details on the SPI adjustment see the HBAI Quality and Methodology Information Report.
F. Negative incomes
Negative incomes are not thought to be indicative of standards of living. Pensioner units with negative net income Before Housing Costs have the gross income components of income, and their net income Before Housing Costs, set to zero. Net income After Housing Costs is set to zero minus housing costs, and so for a small number of cases will be negative. See the PI methodological paper number two for more information on negative incomes.
G. Output standards for ethnic groups
The PI FYE 2020 publication has adopted the latest harmonised output standards for ethnic groups for the UK, however, ‘mixed’ and ‘other’ ethnic groups have been merged together due to small sample sizes. The latest harmonised standards were published in August 2011 and cover the ethnic group question in England, Wales, Scotland, and Northern Ireland. They also cover harmonised data presentation for ethnic group outputs. The standards were updated in February 2013 detailing how Gypsy, Traveller, and Irish Traveller should be recorded in the outputs, due to differences across the UK.
For further details please see the ONS harmonised concept for ethnic groups.
H. Further information
A collection of methodological papers on the PI series are available which include papers on negative incomes, personal pension income, and definitions of pensioner units.
3. Reliability of estimates
The figures in this publication come from the FRS. Like all surveys, it gathers information from a sample rather than from the whole population. The size of the sample and the way in which the sample is selected is carefully designed to ensure that it is representative of the UK as whole, whilst bearing in mind practical considerations like time and cost constraints. Survey results are always estimates, not precise figures. This means that they are subject to a level of uncertainty which can affect how changes, especially over the short term, should be interpreted.
A. Estimating and reporting uncertainty
Two different random samples from one population, for example the UK, are unlikely to give exactly the same survey results, which are likely to differ again from the results that would be obtained if the whole population was surveyed. This level of uncertainty around a survey estimate can be calculated and is commonly referred to as sampling error.
In addition to sampling error, the PI estimates can also be affected by other non-sampling errors. Some of these are:
-
Reporting errors: Imperfect recall and respondents choosing to deliberately give incorrect answers are examples of reporting error. If these errors are systematic, they may lead to bias in the survey estimates
-
Under-reporting: The FRS information on benefits relies on the respondent being able to accurately report the amount of benefit they receive. This reliance leads to under-reporting in receipt for many benefits. The discrepancies between FRS and administrative data are particularly pronounced for Employment and Support Allowance, State Pension, Income Support and Pension Credit. It is also thought that household surveys underestimate income from both self-employment and investments so these figures should be treated with caution. The under-reporting of income from investments is particularly likely to affect the estimates for pensioners
-
Misreporting: The type of income received is self-reported by survey respondents, and can consequently be misreported. For example, some survey respondents may not be able to distinguish between the State Pension and Pension Credit because these benefits can be paid jointly
-
Systematic bias: This arises in the sample if certain groups are less likely to respond to a survey than others. This is corrected to some extent in the FRS by weighting to match subgroups of the population by age, sex, family status, tenure, council tax band, and broad geographic region. Nevertheless, it is difficult to account for all possible bias, so some results may still be affected
We can calculate the level of uncertainty around a survey estimate by exploring how that estimate would change if we were to draw many survey samples for the same time period, instead of just one. This allows us to define a range around the estimate (known as a “confidence interval”) and to state how likely it is that the real value that the survey is trying to measure lies within that range. Confidence intervals are typically set up so that we can be 95% sure that the true value lies within the range, in which case this range is referred to as a “95% confidence interval”.
B. Measuring the size of sampling error
Accuracy of the statistics: Confidence intervals are used as a guide to the size of sampling error. A confidence interval is a range around an estimate which states how likely it is that the real value the survey is trying to measure lies within that range. A wider confidence interval indicates a greater uncertainty around the estimate. Generally, a smaller sample size will lead to estimates that have a wider confidence interval. This is because a smaller sample is less likely than a larger sample to reflect the characteristics of the total population and therefore there will be more uncertainty around the estimate derived from the sample.
Statistical significance: Some changes in estimates between years will be the result of different samples being chosen, whilst other changes will reflect underlying changes in income across the population. Confidence intervals can be used to identify changes in the data that are statistically significant; that is, they are unlikely to have occurred by chance due to a particular sample being chosen. Confidence intervals can give a range around the difference in a result from one year to the next. If the range does not include zero it indicates this change is unlikely to be the result of chance.
Working with uncertain estimates: Some changes between years will be small in relation to sampling variation and other sources of error and may not be statistically significant. This is relevant for particular sub-groups, as these will have smaller sample sizes than the overall survey sample size. For these sub-groups it is important to look at long-term trends.
4. Estimating and interpreting uncertainty in the PI report
A. Calculating uncertainty in the PI report
Since the FYE 2014 publication, confidence intervals have been calculated using a bootstrapping approach, using the statistical package SAS. This has allowed confidence intervals to be calculated for a wider range of estimates.
Bootstrapping takes into account the design of the sample. It replicates the sampling design of the survey and takes re-samples with replacement from the dataset, creating 500 new samples of the dataset. Each new sample is different and contains multiple copies of some survey observations and none of some others. Exploring the range of results in these samples allows us to generate confidence intervals around the result obtained in the original sample.
From the FYE 2016 publication and onwards, new bootstrapping methodology has provided an improved measure of uncertainty around key PI estimates by creating resamples of the HBAI dataset by simulating stratified, cluster sampling for GB and stratified sampling for NI. It also creates a unique set of grossing factors for each resample using the HBAI grossing process to gross the GB and NI resamples to the UK population. For a more technical guide to the approach used to generate confidence intervals in this report, please see the statistical notice or the HBAI Quality and Methodology Information Report.
B. Interpreting estimates of uncertainty in PI
Table M1.1 provides confidence intervals for key estimates of pensioners’ incomes in FYE 2020. For example, in FYE 2020, weekly gross income for all pensioner units is estimated to be £554. We can be 95% confident that the true value of gross income per week, if we were to take a census of the population, would lie between £538 and £568.
The table shows that, while there is a degree of uncertainty about the estimates, it does not affect the broad conclusions drawn, such as the relative importance of different types of income, or the fact that single men on average had higher incomes than single women.
When comparing two or more estimates, we must factor in the uncertainty surrounding each of the estimates. Table M1.2 shows the growth in sources of income between FYE 2010 and FYE 2020, and FYE 2019 and FYE 2020.
Statistically significant results (at the 95% confidence level) are marked with an asterisk (*). As can be seen, the confidence intervals around the estimates of various different growth rates between FYE 2019 and FYE 2020 often include zero. This is particularly true for smaller components of income. This means that we cannot be confident that the growth rate is different from zero, and hence the change is not statistically significant.
Over short time periods, it is unlikely that an income measure will change dramatically, so the uncertainty is likely to be large compared with the change itself.
Users are advised to draw conclusions from long term trends rather than year on year changes.
Even some longer-term changes need to be interpreted with care. For income sources where the amount received per week varies greatly between pensioner units, such as investment income, even long-term comparisons may not be statistically significant. For example, income from investments has increased by 13% for single pensioners from FYE 2010 to FYE 2020, but this increase is not statistically significant (see Table M1.2).
For more information about uncertainty around FRS derived estimates see the 2014 uncertainty in FRS based analysis report. There is also the 2017 statistical notice for the change implemented from FYE 2016 data onwards.
Table M1.1: Uncertainty surrounding estimates in the Pensioners’ Incomes Series FYE 2020
| Measure | Estimate | 95% confidence interval | ||
|---|---|---|---|---|
| £ p/w | Interval width | Relative width | Interval range | |
| All pensioner units | ||||
| Gross income | 554 | 30 | 5% | 538 to 568 |
| of which | ||||
| Benefit income | 245 | 9 | 3% | 240 to 249 |
| Occupational pension income | 168 | 21 | 13% | 157 to 179 |
| Personal pension income | 17 | 7 | 39% | 13 to 20 |
| Investment income | 47 | 7 | 16% | 43 to 50 |
| Earnings income | 73 | 19 | 27% | 63 to 83 |
| Other income | 4 | 1 | 33% | 3 to 4 |
| Net income BHC | ||||
| Mean | 466 | 24 | 5% | 454 to 477 |
| Median | 367 | 23 | 6% | 354 to 377 |
| Net income AHC | ||||
| Mean | 431 | 24 | 6% | 418 to 442 |
| Median | 331 | 24 | 7% | 318 to 342 |
| Pensioner couples | ||||
| Median net income BHC | 507 | 37 | 7% | 489 to 526 |
| Median net income AHC | 482 | 36 | 7% | 463 to 499 |
| Single pensioners | ||||
| Median net income BHC | 272 | 19 | 7% | 261 to 279 |
| Median net income AHC | 231 | 23 | 10% | 220 to 243 |
| Single male pensioners | ||||
| Median net income BHC | 291 | 34 | 12% | 273 to 306 |
| Median net income AHC | 243 | 35 | 15% | 222 to 258 |
| Single female pensioners | ||||
| Median net income BHC | 264 | 21 | 8% | 253 to 274 |
| Median net income AHC | 221 | 32 | 14% | 206 to 237 |
| Recently reached SPa pensioner units | ||||
| Median net income BHC | 403 | 58 | 14% | 367 to 424 |
| Median net income AHC | 370 | 60 | 16% | 337 to 397 |
| Not recently reached SPa pensioner units | ||||
| Median net income BHC | 357 | 25 | 7% | 345 to 370 |
| Median net income AHC | 323 | 26 | 8% | 311 to 336 |
| Pensioner units where the head is under 75 | ||||
| Median net income BHC | 405 | 41 | 10% | 379 to 420 |
| Median net income AHC | 370 | 40 | 11% | 347 to 387 |
| Pensioner units where the head is 75 or over | ||||
| Median net income BHC | 335 | 28 | 8% | 321 to 349 |
| Median net income AHC | 302 | 27 | 9% | 288 to 315 |
- The interval widths are calculated on unrounded numbers and therefore may not match the interval range.
Table M1.2 Growth in average incomes of pensioner units, FYE 2010 to FYE 2020, and FYE 2019 to FYE 2020
| Measure | FYE 2010 | FYE 2019 | FYE 2020 | % growth FYE 2010 to FYE 2020 | % growth FYE 2019 to FYE 2020 | 95% confidence interval FYE 2010 to FYE 2020 | 95% confidence interval FYE 2019 to FYE 2020 |
| All pensioner units | |||||||
| Gross income | 548 | 560 | 554 | 1% | -1% | -5% to 6% | -5% to 3% |
| of which | |||||||
| Benefit income | 233 | 242 | 245 | 5%* | 1% | 2% to 8% | -2% to 4% |
| Occupational pension income | 137 | 170 | 168 | 23%* | -1% | 11% to 32% | -9% to 8% |
| Personal pension income | 20 | 19 | 17 | -17% | -9% | -44% to 1% | -39% to 12% |
| Investment income | 42 | 47 | 47 | 12% | 0% | -5% to 24% | -15% to 13% |
| Earnings income | 112 | 79 | 73 | -35%* | -7% | -52% to -19% | -25% to 9% |
| Other income | 4 | 4 | 4 | -13% | -9% | -36% to 4% | -41% to 19% |
| Net income BHC | |||||||
|---|---|---|---|---|---|---|---|
| Mean | 455 | 470 | 466 | 2% | -1% | -2% to 7% | -4% to 3% |
| Median | 357 | 363 | 367 | 3% | 1% | -2% to 7% | -2% to 6% |
| Net income AHC | |||||||
| Mean | 420 | 432 | 431 | 3% | 0% | -3% to 7% | -4% to 4% |
| Median | 319 | 326 | 331 | 4% | 2% | -2% to 8% | -4% to 6% |
| Pensioner couples | |||||||
| Gross income | 745 | 769 | 760 | 2% | -1% | -6% to 10% | -7% to 4% |
| of which | |||||||
| Benefit income | 253 | 277 | 282 | 11%* | 2% | 7% to 15% | -2% to 5% |
| Occupational pension income | 196 | 250 | 246 | 26%* | -1% | 12% to 38% | -12% to 11% |
| Personal pension income | 32 | 29 | 26 | -18% | -10% | -53% to 1% | -46% to 16% |
| Investment income | 63 | 71 | 73 | 16% | 3% | -9% to 38% | -21% to 23% |
| Earnings income | 197 | 138 | 129 | -34%* | -7% | -54% to -18% | -27% to 11% |
| Other income | 5 | 5 | 5 | 2% | 0% | -36% to 30% | -42% to 34% |
| Net income BHC | |||||||
| Mean | 603 | 634 | 629 | 4% | -1% | -2% to 11% | -6% to 4% |
| Median | 479 | 507 | 507 | 6%* | 0% | 0% to 11% | -5% to 5% |
| Net income AHC | |||||||
| Mean | 574 | 604 | 601 | 5% | 0% | -2% to 11% | -6% to 5% |
| Median | 451 | 483 | 482 | 7%* | 0% | 1% to 13% | -6% to 5% |
| Single pensioners | |||||||
| Gross income | 350 | 365 | 368 | 5% | 1% | -3% to 13% | -8% to 9% |
| of which | |||||||
| Benefit income | 212 | 209 | 211 | 0% | 1% | -4% to 3% | -3% to 5% |
| Occupational pension income | 78 | 96 | 98 | 26%* | 2% | 6% to 45% | -16% to 18% |
| Personal pension income | 9 | 9 | 9 | -1% | -5% | -56% to 45% | -71% to 35% |
| Investment income | 21 | 24 | 24 | 13% | -3% | -48% to 55% | -63% to 34% |
| Earnings income | 27 | 23 | 24 | -12% | 2% | -58% to 21% | -62% to 41% |
| Other income | 4 | 4 | 3 | -28%* | -20% | -66% to -5% | -91% to 19% |
| Net income BHC | |||||||
| Mean | 304 | 317 | 319 | 5% | 1% | -2% to 11% | -7% to 7% |
| Median | 268 | 270 | 272 | 1% | 1% | -3% to 5% | -4% to 5% |
| Net income AHC | |||||||
| Mean | 264 | 272 | 279 | 6% | 3% | -3% to 13% | -7% to 11% |
| Median | 221 | 220 | 231 | 4% | 5% | -2% to 11% | -2% to 13% |
- Results that are statistically significant are denoted with an asterisk (*).
- Confidence intervals are calculated on unrounded numbers. Changes are indicated as statistically significant if the confidence interval before rounding does not include zero.
- The percentage changes are calculated on unrounded numbers and therefore may not match those calculated for the rounded numbers shown in the table.
5. Households Below Average Income (HBAI) and the Pensioners’ Incomes (PI) Series
Two of the tables in the PI publication table pack (Tables 4.6 and 4.7) provide information on the position of pensioners within the overall income distribution. These tables define pensioners as adults in families where at least one member is over SPa, consistent with the rest of the PI publication. This is different to the definition used in HBAI which defines pensioners as those over SPa.
Results from HBAI should not be directly compared to those from PI. The main differences between HBAI and PI methods of analysis are:
Income components: The PI results include analysis of the components of pensioner unit income (benefit income, occupational pension income, etc.). HBAI, with its broader span of interests, does not present detailed analysis of this sort.
Household or pensioner unit: The PI series is generally concerned with cash incomes directly received by pensioners. It measures the income of pensioner benefit units only (plus income for any dependent children within the pensioner unit), ignoring income received by any other members of the household. HBAI attempts to measure material living standards, so it includes all the income for the household in which the pensioner lives; the underlying HBAI assumption being that the total household income is shared amongst all household members.
Equivalisation: To allow comparison of living standards of different households, the HBAI ‘equivalises’ household income; that is, adjusts it to take account of household size and composition. One of the main functions of the PI series is to provide information on the income of pensioner units in monetary terms, split by sources of income. This can only be done using unequivalised income. Equivalisation is not necessary for most results, which are presented separately for pensioner couples and single pensioners. To avoid unnecessary complexity, the main PI results are presented in monetary terms, at constant FYE 2020 prices, rather than equivalised income at FYE 2020 prices. PI does however use equivalised income to analyse pensioners’ position in the overall population income distribution.
Equivalisation Scales: HBAI historically used the McClements equivalisation scale. Following user consultation, the FYE 2006 edition of HBAI and subsequent HBAI publications have used Modified OECD equivalisation scales. The same change has been made to the relevant data in PI since the FYE 2006 edition of the PI series. Information on the effect of the change can be found in Appendix B of the FYE 2007 edition of the PI series.
6. Glossary
This glossary gives a brief explanation for each of the key terms used in the PI Series. Further details on these definitions, including full derivations of variables, are available on request from the DWP PI Series Team at pensioners-incomes@dwp.gov.uk
A glossary of income and earnings terms produced by the ONS is also available.
Adult
All individuals who are aged 16 and over are classified as an adult, unless the individual is defined as a dependent child (see Child). All adults in the household are interviewed as part of the FRS.
Age
Respondent’s age at last birthday (at the time of the interview).
Automatic Enrolment
Automatic enrolment requires all employers to enrol their eligible workers into a workplace pension scheme if they are not already in one. The staged timetable began in October 2012 for larger firms, and completed for all employers in 2018. To preserve individual responsibility for the decision to save, workers can opt out of the scheme. To be eligible for automatic enrolment, the jobholder must be at least 22 years old, under SPa, earn above the earnings trigger for automatic enrolment, and work or usually work in the UK. Read more information see on automatic enrolment.
Benefit Unit or Family
A benefit unit may consist of: a single adult, or a married or cohabiting couple, plus any dependent children. Same-sex partners have been included in the same benefit unit since January 2006. Where a total for a benefit unit is presented (such as total benefit unit income) this includes both income from adults plus any income from dependent children. There are various types of benefit unit:
-
Pensioner couple: Benefit units where either adult in the couple is over SPa
-
Pensioner couple, married or civil partnered: Benefit units headed by a couple in which at least one partner is over SPa and the couple are either married or in a civil partnership
-
Pensioner couple, cohabiting: Benefit units headed by a couple in which at least one partner is over SPa and the couple are neither married nor in a civil partnership
-
Single male pensioner: Benefit units headed by a single male adult over SPa
-
Single female pensioner: Benefit units headed by a single female adult over SPa
It should be noted that ‘benefit unit’ is used throughout the report as a description of groups of individuals regardless of whether they are in receipt of any state support.
Benefits
Financial support from the Government. Most of these benefits are administered by DWP. The major exceptions are Housing Benefit and Council Tax Reduction, which are administered by local authorities. Child Benefit is administered by HMRC, who also administer Tax Credits. These are not treated as benefits, but both Tax Credits and benefits are included in the term State Support. Tax Credits will ultimately be replaced by Universal Credit.
Benefits are often divided into income-related benefits and non-income-related benefits. In assessing entitlement to the former, the claimant’s income and savings will be checked against the rules of the benefit. In contrast, eligibility for non-income-related benefits is instead dependent on the claimant’s circumstances (a recent bereavement, for example), rather than their income and savings. A list of the main state benefits divided into these two categories is below.
Disability-related benefits is the term used to describe all benefits paid on grounds of disability. These are: Disability Living Allowance, Personal Independence Payments, Armed Forces Compensation Scheme, Attendance Allowance, Industrial Injuries Disablement Benefit and any remaining Severe Disablement Allowance cases. Before FYE 2009, Incapacity Benefit was also in this group. Numbers on Incapacity Benefit and Severe Disablement Allowance benefits have decreased over time, as both were replaced by Employment and Support Allowance from October 2008.
| Income-related benefits | Non-income-related benefits |
|---|---|
| Council Tax Reduction | Armed Forces Compensation Scheme |
| Employment and Support Allowance (income-related element) | Attendance Allowance |
| Extended Payments (Council Tax Reduction and Housing Benefit) | Bereavement or Widowed Parent’s Allowance |
| Housing Benefit | Bereavement Support Payment |
| Income Support | Carer’s Allowance |
| Jobseeker’s Allowance (income-based element) | Child Benefit |
| Northern Ireland Other Rate Rebate | Disability Living Allowance (both mobility and care components) |
| Northern Ireland Rate Rebate through energy efficient homes | Employment and Support Allowance (contributory element) |
| Northern Ireland Rate Relief | Guardian’s Allowance |
| Pension Credit | Incapacity Benefit |
| Rates Rebate | Industrial Injuries Disablement Benefit |
| Social Fund – Community Care Grant | Jobseeker’s Allowance (contributory element) |
| Social Fund – Funeral Grant | Maternity Allowance |
| Universal Credit | Northern Ireland Disability Rate Rebate |
| Northern Ireland Lone Pensioner Rate Rebate | |
| Personal Independence Payment (Daily Living and Mobility components) | |
| Severe Disablement Allowance | |
| State Pension | |
| Statutory Maternity/Paternity/Adoption Pay | |
| Statutory Sick Pay | |
| Winter Fuel Payments |
Child
A dependent child is defined as an individual aged under 16. A person is also defined as a child if they are 16 to 19 years old and they are:
-
Not married nor in a civil partnership nor living with a partner
-
Living with parents or a responsible adult
-
In full-time non-advanced education or in unwaged Government training
Confidence interval
A measure of sampling error. A confidence interval is a range around an estimate which states how likely it is that the real value that the survey is trying to measure lies within that range. A wider confidence interval indicates a greater uncertainty around the estimate. Generally, a smaller sample size will lead to estimates that have a wider confidence interval than estimates from larger sample sizes. This is because a smaller sample is less likely than a larger sample to reflect the characteristics of the total population and therefore there will be more uncertainty around the estimate derived from the sample. Note that a confidence interval ignores any systematic errors which may be present in the survey and analysis processes.
Council Tax
The tax is based on which, of a set of bands, a property’s value falls into. Its headline rate is based on two adults per household.
Read more information on council tax.
Equivalisation
Income measures used in HBAI take into account variations in the size and composition of the households in which people live. This process is called equivalisation. Equivalisation reflects the fact that a family of several people needs a higher income than a single individual in order for them to enjoy a comparable standard of living. Equivalence scales conventionally take a couple with no children as the reference point. The process then increases relatively the income of single person households (since their incomes are divided by a value less than one) and reduced relatively the incomes of households with three or more persons, which have an equivalence value of greater than one.
We do not use equivalisation in PI, except in section 7 of the main publication and when comparing to the overall distribution in Tables 4.6 and 4.7 of the table pack.
Ethnic group
The ethnic group to which respondents consider that they belong. The FRS questions are in line with National Statistics’ harmonisation guidance. The categories are:
-
White
-
Mixed or Multiple ethnic groups
-
Asian or Asian British
-
Black or African or Caribbean or Black British
-
Other ethnic group
For Northern Ireland, ‘Irish Traveller’ is included in ‘Other ethnic group’. For England, Wales and Scotland, ‘Gypsy or Irish Traveller’ is included in ‘White’.
‘Arab’ has been included in ‘Other ethnic group’ due to small sample sizes.
Family Resources Survey (FRS)
The FRS is one of the largest cross-sectional household surveys in the country surveying around 20,000 private households across all ages. Prior to FYE 2003 the survey covered Great Britain; from FYE 2003 the survey was extended to cover the UK.
Gross income
Total income a pensioner receives from all sources before any outgoings, tax or housing costs.
Head of benefit unit
If the Household Reference Person does not belong to the benefit unit, then the Head of benefit unit is simply the first person from that benefit unit, in the order they were named in the interview. If the Household Reference Person does belong to the benefit unit, they are also the Head of that benefit unit.
Household
One person living alone or a group of people (not necessarily related) living at the same address who share cooking facilities and share a living room or sitting room or dining area. A household consists of one or more benefit units.
Household Reference Person (HRP)
The highest income person in a household.
-
In a single-adult household, the HRP is simply the sole householder (i.e. the person in whose name the accommodation is owned or rented)
-
If there are two or more householders, the HRP is the householder with the highest personal income, taking all sources of income into account
-
If there are two or more householders who have the same income, the HRP is the elder
Before April 2001, the Household Reference Person (HRP) was known as the Head of Household. Where we refer to ‘Head’ in tables relating to households, this is the HRP. The Head of benefit unit will not necessarily be the HRP (see Head of benefit unit).
Housing costs
Housing costs are made up of: rent (gross of housing benefit), water rates, community water charges and council water charges, mortgage interest payments (net of tax relief), structural insurance premiums (for owner occupiers); and ground rent and service charges.
Net incomes in the PI report are presented either on a BHC or AHC basis, the definitions of which are:
-
Before Housing Costs (BHC): Net income before the housing cost aspects listed above are taken away
-
After Housing Costs (AHC): Net income after the housing cost aspects listed above are taken away
Capital mortgage repayments are not deducted as a Housing Cost as this is regarded as an asset being accrued and not a cost.
In a multi-benefit unit household, housing costs are attributed to the first benefit unit (the benefit unit with the Household Reference Person). This means that for a minority of pensioner units, housing costs will not be attributed to them.
Income distribution
The spread of incomes across the population.
Marital status
This is the person’s marital status:
-
Married or Civil partnership: currently married or in a civil partnership, and not separated from spouse (excludes temporary absences)
-
Cohabiting: not married nor in a civil partnership, but living as a couple
-
Single: is not currently cohabiting and is not married nor in a civil partnership
Mixed-age pensioner couples
A couple where one member is above SPa and the other is below. Used in comparison with couples where both members are over SPa.
Net income
Net income is gross income with direct taxes including Council Tax payments deducted. Net income may be presented on a Before Housing Costs or After Housing Costs basis. See ‘Housing costs’ for more detail.
Occupational pension
An occupational pension scheme is an arrangement an employer makes to give their employees a pension when they retire. Employees may become a member of an employer’s pension scheme on a voluntary basis. Until 6 April 2016, Defined Benefit occupational pension schemes could be contracted into or out of the Additional State Pension. This was abolished with the introduction of the New State Pension. The contracting out of Defined Contribution occupational pension schemes was abolished in 2012.
Pensioner benefit unit
Benefit units who are a pensioner couple, single male pensioner, or single female pensioner. Pensioner benefit units may also include any dependent children, but this is uncommon. In FYE 2020, less than half a per cent of pensioner units included dependent children.
Pension Credit
An income-related benefit made up of Guarantee Credit and Savings Credit. Guarantee credit tops up the claimant’s income to a guaranteed level. Savings Credit is an extra amount for people who have made provision for their retirement above a certain threshold. Savings Credit was abolished for new claimants on 6 April 2016, so most people who reached SPa after 6 April 2016 are not eligible for Savings Credit.
Personal pension
A pension provided through a contract between an individual and the pension provider. The pension which is produced will be based upon the level of contributions, investment returns and annuity rates. A personal pension can be either employer provided or privately purchased. Different forms of personal pension include:
-
Group Personal Pension: Before automatic enrolment, some employers who did not offer an occupational pension scheme may have arranged for a pension provider to offer their employees a personal pension instead. The employer may have negotiated special terms with the provider that means the administration charges are lower than those for individual personal pensions. Although they are sometimes referred to as company pensions, they are not run by employers and should not be confused with occupational pensions, which have different tax, benefit, and contribution rules. Note that some companies may still offer Group Personal Pensions in addition to their occupational pensions
-
Group Stakeholder Pension: As with Group Personal Pensions, an employer can make an arrangement with a pension provider and offer their employees a Group Stakeholder Pension (see Stakeholder Pension)
-
Stakeholder Pension: Enable those without earnings, such as non-earning partners, carers, pensioners and students, to pay into a pension scheme. Almost anybody up to the age of 75 may take out a stakeholder pension and it is not necessary to make regular contributions
Read more information on personal pensions.
Private pension
Private pensions include occupational pensions (also known as Employer-Sponsored pensions) and Personal pensions (including Stakeholder pensions). People can have several different private pensions at once. In previous years only one of these pensions could be contracted out. The contracting out of Defined Benefit occupational schemes was abolished in April 2016 with the introduction of the New State Pension. The contracting out of Defined Contribution pension schemes was abolished in 2012.
Recently reached State Pension age
A pensioner is classed as having recently reached State Pension age (SPa) if the head of the household is less than five years older than SPa at the time they are interviewed. As SPa is rising (see State Pension age below), the age a pensioner must be to be considered having recently reached SPa has also risen. At the start of the financial year, female pensioners were included in the ‘recently reached SPa’ category if they were over 65 years 2 months old and less than 70 years 3 months old. This has increased gradually such that those interviewed at the end of the financial year had ‘recently reached SPa’ if they were over 65 years 8 months old and less than 70 years 9 months old.
It should be noted that due to the rising SPa, this definition classifies pensioners as having “recently reached State Pension age” even if they reached their SPa more than five years ago.
For example, a woman born on 6 April 1951 will have reached SPa on 6 May 2012, aged 61 years 1 month. When interviewed on 6 July 2019, she is 68 years 3 months old and reached her SPa 8 years 2 months ago. However, because the SPa has risen to 65 years 4 months by the date of interview, she is still classed as having “recently reached State Pension age” because she is within five years of the current SPa.
Pensioner units who recently reached State Pension age are included in the ‘Under 75’ age group.
Before FYE 2019, this category was called “recently retired”. The name was amended to better reflect that the category is defined by State Pension age rather than retirement status.
Region
Regional classifications are based on the standard statistical geography of UK Regions, as defined by ONS: nine in England, and a single region for each of Wales, Scotland and Northern Ireland. Tables will also show statistics for the United Kingdom, Great Britain, and England as a whole.
Read more information on geographical terms used in official statistics.
Disaggregation by geographical regions is presented as three-year averages. This presentation has been used as single-year regional estimates are considered too volatile. Estimates for the UK, however, are shown as single-year estimates for the latest available year. Although the FRS sample is large enough to allow some analysis to be performed at a regional level, it should be noted that no adjustment has been made for regional differences in the cost of living, as the necessary data are not available.
Sampling error
The uncertainty in the estimates which arises from taking a random sample of the household population. The likely size of this error for a particular statistic can be identified and expressed as a confidence interval.
Sources of income
-
Benefit income: including State Pension, Income-related benefits and Disability-related benefits, as well as other types of benefits such as Winter Fuel Payments and Carers’ Allowance
-
Occupational pension income: including employee pensions associated with an employer and workplace
-
Personal pension income: including personal pensions, annuities bought with lump sums from personal pensions, trade union and friendly society pensions
-
Investment income: including interest from Individual Savings Accounts (ISAs) and other savings accounts, unit trusts, bonds, stocks and shares
-
Earnings income, including:
-
Wages and salaries: for a respondent currently working as an employee, income from wages and salaries is equal to: gross pay before any deductions, less any refunds of income tax, any motoring and mileage expenses, any refunds for items of household expenditure and any Statutory Sick Pay or Statutory Maternity Pay, plus bonuses received over the last 12 months (converted to a weekly amount) and any children’s earnings from part-time jobs
-
Self-employed income: the total amount of income received from self-employment gross of tax and national insurance payments, based on profits (where the individual considers themselves as running a business) or on estimated earnings or drawings otherwise. Excludes any profits due to partners in the business. Any losses are recorded as such
-
-
Other income: benefits from friendly societies, income received for or dependent children, maintenance payments and free TV licences for those aged 75 and over
State Pension
The state pension is a payment made to qualifying individuals who have reached the State Pension age (SPa). A new single-tier State Pension launched on 6 April 2016 for people who reach SPa on or after April 2016, to replace the previous system. This consolidated the basic State Pension and Additional State Pension into one single amount.
People who reached SPa before 6 April 2016 continue to receive the basic State Pension and Additional State Pension if eligible. Read more information on the State Pension.
State Pension age (SPa)
SPa is the earliest age you can start receiving your State Pension. For FYE 2020 data, individuals are defined to be of SPa based on their date of birth and the date of interview. Since 6 April 2010, the SPa has been gradually increasing. The FRS data contained in this report were collected throughout the FYE 2020, during which the SPa for pensioners increased from over 65 years and 2 months to over 65 years and 8 months at the end of FYE 2020.
A breakdown of the increases can be seen in the State Pension age timetables and details of planned changes to SPa can be found online. Read further guidance on calculating State Pension eligibility age.
State support
An individual is in receipt of state support if they receive one or more Benefits, or are being paid Tax Credits.
Tax Credits
Working Tax Credits and Child Tax Credits are paid by HMRC. Tax Credits are being phased out, as they are replaced by Universal Credit.
Read more information on tax credits.
Triple Lock
The basic State Pension and the new State Pension increases every year by whichever is the highest of the following:
-
earnings – the average percentage growth in wages (in GB)
-
prices – the percentage growth in prices in the UK as measured by the Consumer Prices Index (CPI)
-
2.5%
In FYE 2020, the increase was 2.6% in line with CPI
Working-Age
Adults (see “Adult” and “Child”) under State Pension age.