Weekly statistics for NHS Test and Trace (England) and coronavirus testing (UK): 24 September to 30 September
Published 8 October 2020

© Crown copyright 2020
This publication is licensed under the terms of the Open Government Licence v3.0 except where otherwise stated. To view this licence, visit nationalarchives.gov.uk/doc/open-government-licence/version/3 or write to the Information Policy Team, The National Archives, Kew, London TW9 4DU, or email: psi@nationalarchives.gov.uk.
Where we have identified any third party copyright information you will need to obtain permission from the copyright holders concerned.
This publication is available at https://www.gov.uk/government/publications/nhs-test-and-trace-england-and-coronavirus-testing-uk-statistics-24-september-to-30-september-2020/weekly-statistics-for-nhs-test-and-trace-england-and-coronavirus-testing-uk-24-september-to-30-september
Main points
Since NHS Test and Trace launched (28 May to 30 September):
51,475 people tested positive for coronavirus (COVID-19) for the first time[footnote 1] in England between 24 September and 30 September, a 56% increase compared to the previous week. Positive cases have been rising steeply over the past 5 weeks with over 7 times as many positive cases identified in the most recent week compared to the end of August.
588,895 people were tested for the first time, consistent with the previous 3 weeks but an increase of 27% compared to the end of August. A total of 7,654,018 people have been tested for COVID-19 at least once since test and trace began.
Turnaround times for pillar 2 (swab testing for the wide population) have become longer for all in-person testing routes[footnote 2] compared to the previous week. In the most recent week, 60.8% of in-person tests results were received the next day after the test was taken compared to 70.6% in the previous week. Turnaround times for satellite/home tests have become notably shorter over the past 3 weeks.
The median distance to in-person testing sites (pillar 2) for booked tests between 24 September and 30 September has decreased to 3.7 miles from 4.3 miles in the previous week.
34,494 people were transferred to the contact tracing system between 24 September and 30 September, an increase of 19% compared to the previous week. The number of people transferred has been notably increasing since the beginning of August with almost 7 times as many people being transferred in the most recent week compared to the beginning of August.
Of those transferred to the contact tracing system between 24 September and 30 September, 74% were reached and asked to provide information about their contacts. This has declined slightly from 74.6% in the previous week and the percentage of people reached has returned to similar proportions seen when Test and Trace launched.
101,782 people were identified as coming into close contact with someone who had tested positive between 24 September and 30 September. The number of contacts identified increased by 11% compared to the previous week and is more than 3 times higher than the end of August. For those where communication details were available, 82.2% were reached and asked to self-isolate. Taking into account all contacts identified, 68.6% were reached.
For coronavirus (COVID-19) testing in the UK:
Testing capacity in the UK across all pillars between 24 September and 30 September was at 2,863,247 tests, an 8% increase on the previous week. Testing capacity for all swab testing[footnote 3] was at 2,015,547 tests, a 40% increase since mid-August.
1,242,785 tests were sent out across the UK within pillars 2 and 4 in the latest week, continuing the upward trend since mid-August.
1,839,872 tests were processed in the UK, across all pillars, in the latest week, continuing the upward trend since mid-August but remains broadly similar to the previous week. 1,788,295 swab tests were processed which is over 3 times higher than in mid-June.
Introduction
The Department for Health and Social Care publishes weekly statistics on NHS Test and Trace (England) and coronavirus (COVID-19) testing in the UK, across all 4 testing pillars. The purpose of this publication is to provide a weekly update on the implementation and performance of NHS Test and Trace in England and Testing in the UK.
For NHS Test and Trace (England), this includes:
Testing
- people tested for coronavirus (COVID-19), England
- people testing positive for coronavirus (COVID-19), England
- time taken for test results to become available, England
- distance travelled to take a test in-person, England
Contact tracing
- people transferred to the contact tracing system, and the time taken for them to be reached, England
- close contacts identified for complex and non-complex cases, and the time taken for them to be reached, England
For coronavirus (COVID-19) testing in the UK, this includes:
- lab testing capacity, UK
- number of tests sent out, UK
- number of tests processed, UK
Data collected for NHS Test and Trace is primarily for operational purposes and was not designed to track the spread of the virus. Studies into the spread of the virus in the UK are carried out by the Office for National Statistics (ONS). Further guidance can be found in comparing methods used in the COVID-19 Infection Survey and NHS Test and Trace, England.
A list of data sources relating to the coronavirus pandemic in the UK can be found at coronavirus (COVID-19) statistics and analysis. A breakdown of all available testing and contact tracing data in the UK can be found at testing and contact tracing in the UK: summary of data.
A full explanation of the data sources and methods used to produce these statistics can be found in the additional methodology document for NHS Test and Trace statistics.
Revisions to figures previously published
Figures given in previous releases are routinely revised for people tested for coronavirus, people testing positive for coronavirus, pillar 2 testing turnaround times, distance to in-person test sites, contact tracing and cumulative figures for coronavirus testing in the UK. Figures for pillar 1 testing turnaround times are not routinely revised as only minor changes occur to past weeks post publication. Figures are only revised when substantial changes occur. More detail on routine revisions is given in the quality section.
Note that these routine revisions to data includes the local authority level contact tracing data that is made available on the weekly collection page. As past data is revised, subtracting figures given in the previous week from figures given in the current week will not give the total number of cases for that week.
In the current week, in addition to routine revisions:
Figures for people testing positive have been revised as a result of a technical issue identified by Public Health England (PHE) that caused a delay in the reporting of COVID-19 cases. The majority of these cases fall into the current reporting period and are reported for the first time this week; however, a small number should have been reported in last weeks report and figures have been revised to account for this. More information is given in the testing in England section and also in the PHE statement on delayed reporting of COVID-19 cases.
NHS Test and Trace
NHS Test and Trace was launched in England on 28 May and ensures that anyone who develops symptoms of coronavirus (COVID-19) can quickly be tested to find out if they have the virus. It then helps trace recent close contacts of anyone who tests positives for coronavirus and, if necessary, notifies them that they must self -isolate at home to help stop the spread of the virus. The flow of how people move through the NHS Test and Trace service is shown in Figure 1. More information about NHS Test and Trace can be found at NHS Test and Trace: how it works.
Testing in England
NHS Test and Trace starts with an individual taking a swab test, either in pillar 1 (testing in hospitals and outbreak locations), pillar 2 (national swab testing) or pillar 4 (prevalence studies). Those who go on to test positive will have their case transferred to NHS Test and Trace for contact tracing.
NHS Test and Trace is for England only, therefore the figures in this section are given for England. Figures for UK testing are given in the coronavirus (COVID-19) testing in the UK section and information on contact tracing in Scotland, Wales and Northern Ireland can be found directly from Public Health Scotland, the Welsh government and the Northern Ireland Public Health Agency.
A technical issue was identified overnight on Friday 2 October in the data load process that transfers COVID-19 positive lab results into reporting dashboards. After rapid investigation, 15,841 cases were identified between 25 September and 2 October that were not included in the reported daily COVID-19 cases as published on the coronavirus (COVID-19) in the UK dashboard. More information can be found in the PHE statement on delayed reporting of COVID-19 cases.
In this publication, positive cases are presented by date of swab, rather than date reported. The majority of these cases fall into the current reporting period and are reported for the first time this week. A small number[footnote 4] apply to tests taken in previous reporting periods (tests taken on or before 23 September) and figures have been revised to account for this.
Figure 1: flowchart showing how people move through NHS Test and Trace
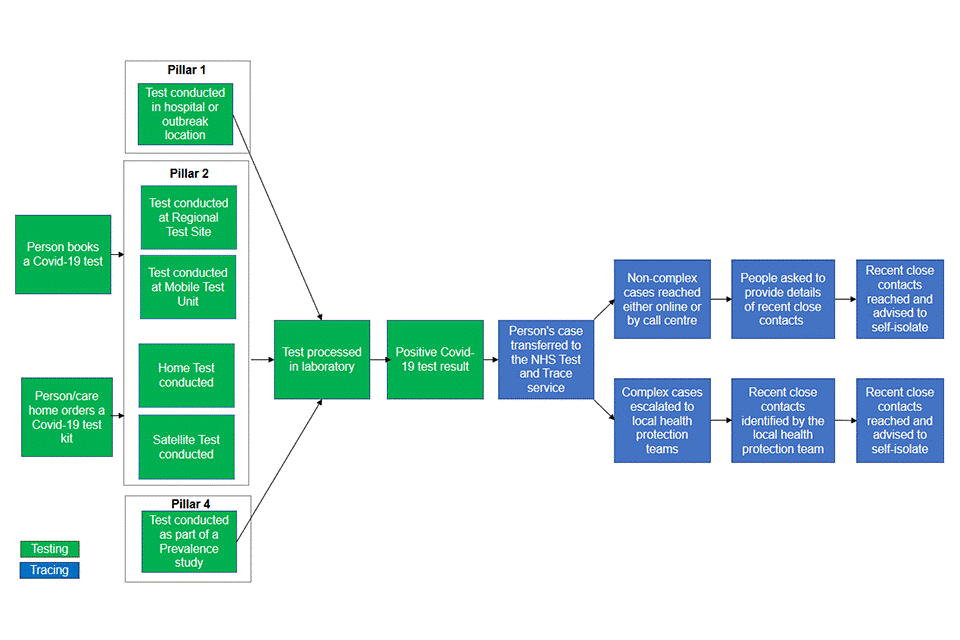
The diagram shows the journey a person can take through NHS Test and Trace. For pillar 1, this starts with a person having a coronavirus test in hospital. For pillar 2, this starts with a person booking or ordering a coronavirus test. Pillar 2 tests can be either be conducted at a regional test site or mobile test unit; or a satellite or home test can be conducted. For pillar 4, this starts with a person having a coronavirus test as part of a prevalence study (those who are tested as part of anonymous studies do not get passed on to contact tracing). After tests have been taken, they are sent to a laboratory for processing. Once processed, a person will be emailed or texted their result.
If a person has a positive COVID-19 test result, then their case is transferred to NHS Test and Trace and can be managed in one of 2 ways. First, non-complex cases are reached either online or by a call centre. They are then asked to provide details of recent close contacts. These recent close contacts are then reached by NHS Test and Trace and advised to self-isolate. In regions with additional local contact-tracing teams, if the national team cannot make contact with a resident within a set period of time, then local public health officials can use the data provided by NHS Test and Trace to follow up.
Second, complex cases are escalated to local health protection teams who work to identify and reach recent close contacts and advise them to self-isolate.
People tested, England
Between 24 September to 30 September, 588,895 people were tested for coronavirus (COVID-19) for the first time, similar to the previous 3 weeks. Since Test and Trace launched 7,654,018 people have been tested at least once[footnote 1].
The number of people tested for the first time has increased by 27% since the end of August but has remained similar for the past 4 weeks. Since the end of August there has been a 25% increase in the number of people newly tested under pillar 1 and a 28% increase under pillar 2. The number of people newly tested gradually increased from mid-June to the beginning of August but then leveled off until the end of August. There were over twice as many people tested for the first time in the most recent week compared to mid-June.
The number of people newly tested reports on the number of people who tested positive or negative for the first time in each week. It does not count people who have previously been tested. More information can be found in NHS Test and Trace statistics methodology.
Since Test and Trace launched at the end of May, 7,654,018 people have been tested at least once, of which 68.1% were tested under pillar 2 (national swab testing) and 31.9% under pillar 1 (testing in hospitals and outbreak locations).
A breakdown of the number of people newly tested by age and gender is also available in the weekly collection page.
Figure 2: number of people newly tested for COVID-19 by pillar, England
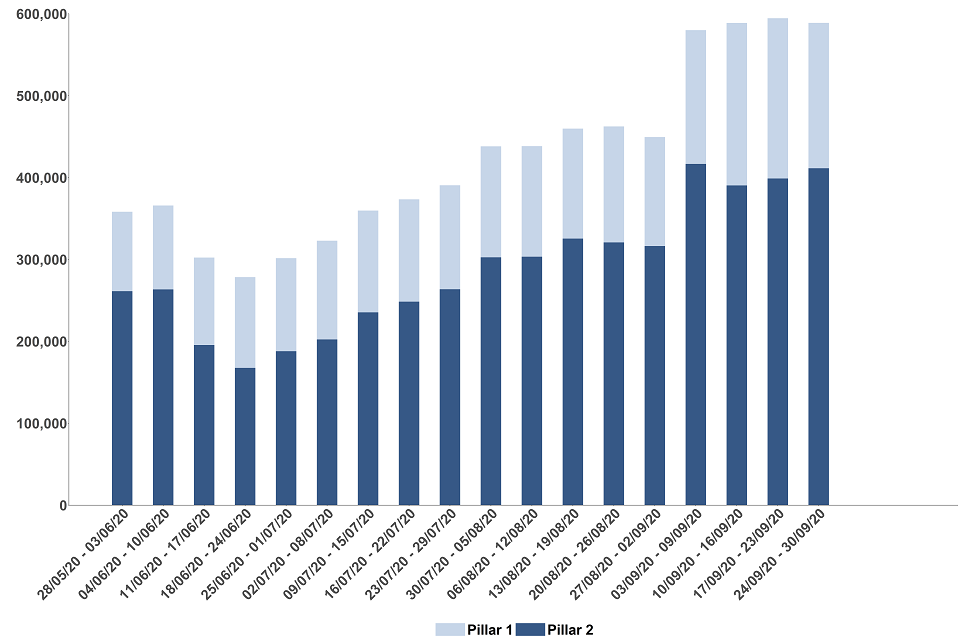
The data for the most recent weeks can be found in the annex, table 1.
Between 24 September and 30 September, 51,475 people tested positive for the first time, continuing the steep upward trend in positive cases seen in recent weeks. There were 7 times as many positive cases identified in the most recent week compared to the end of August.
The number of new positive cases between 24 September and 30 September saw a notable increase of 56% compared to the previous week. This increase continues the substantial upward trend in positive cases first seen from the end of August.
The number of positive cases declined each week between the end of May and the start of July before starting to continuously increase up to the latest week. The number of positive cases in the most recent week is over 5 times higher than the 8,825 cases recorded at the end of May when Test and Trace launched.
Since Test and Trace launched, 206,817 people have tested positive for COVID-19[footnote 5] at least once; 84.4% of these positive cases were tested under pillar 2 in comparison to 15.6% under pillar 1[footnote 6]. Between 24 September and 30 September, the number of positive cases under pillar 1 is over 7 times higher compared to the end of August.
A breakdown of the number of people newly testing positive by age and gender is also available in the weekly collection page.
The figures for people testing positive for the first time cannot be compared with the number of people newly tested to calculate positivity rates due to the way in which the data is deduplicated. Weekly estimates of the number of coronavirus infections are published in the ONS Infection Survey results and positivity rates for pillars 1 and 2 are published in the PHE surveillance report.
Figure 3: number of people newly testing positive for COVID-19 by pillar, England
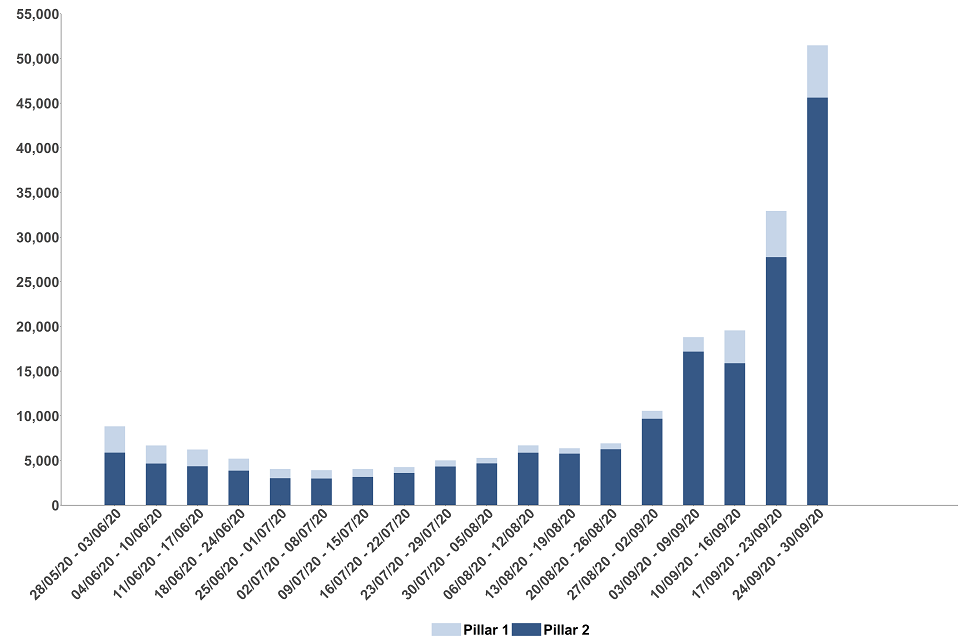
The data for the most recent weeks can be found in the annex, table 1.
Pillar 1 testing turnaround times, England
Some pillar 1 tests are conducted in a hospital setting, and it is therefore not practical for those administering the tests to record the exact time that a test was taken. Therefore, the time taken to receive a coronavirus (COVID-19) test result is measured from the time that a test is received by a laboratory for processing to the time when the results are published to the Laboratory Information Management System (LIMS).
The total tests given in figures for pillar 1 turnaround times is not the same as the number of tests processed in pillar 1 as study samples and tests from private laboratories do not report data on turnaround times. This data is only available from 9 July. More details can be found in the NHS Test and Trace statistics methodology.
Over 4 out of 5 pillar 1 test results were made available within 24 hours of the laboratory receiving the test. This proportion has remained similar since reporting began on 9 July.
Between 24 September and 30 September, 86.8% of pillar 1 test results were made available within 24 hours.
Figure 4: number of pillar 1 test results by whether they were made available within 24 hours of the laboratory receiving the test, England
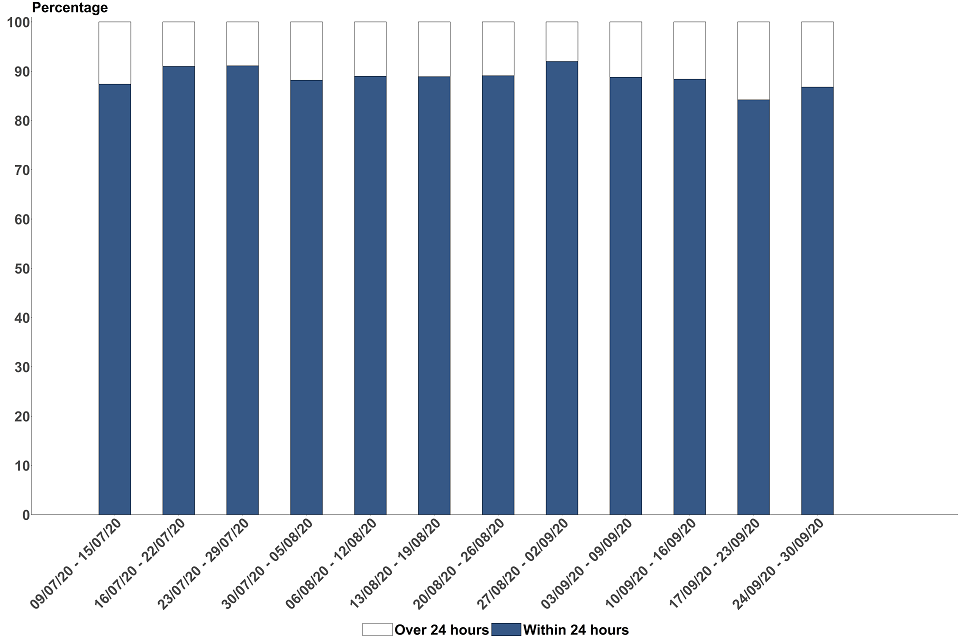
The data for the most recent weeks can be found in the annex, table 2.
Pillar 2 testing turnaround times, England
There are various routes for getting tested within pillar 2 (national swab testing). Data on the time taken to receive a COVID-19 test result for pillar 2 is split up to reflect this, as this impacts on the turnaround times[footnote 7]. These routes include:
- regional test sites, which includes drive-through testing centres
- local test sites[footnote 8], which are similar to regional test sites but specifically for walk ups
- mobile testing units, which travel around the UK to increase access to COVID-19 testing. They respond to need, travelling to test people at specific sites including care homes, police stations and prisons
- satellite test centres, which includes test kits provided directly to ‘satellite’ centres at places like hospitals or care homes that have a particularly urgent or significant need
- home test kits, which are delivered to someone’s door so they can test themselves and their family without leaving the house
Turnaround times are measured and reported in 2 ways, time taken from booking a test and from taking a test to receiving a test result. More information on these definitions is in the terminology section. Both measures are now reported as the median turnaround time, in addition to the usual turnaround time windows, such as within 24 hours. All these measures are available in full in the accompanying data tables, however only time from taking a test is discussed below.
The total tests reported for pillar 2 turnaround times is not the same as the number of tests processed in pillar 2 as test processed is available for the UK (rather than for England only). In addition, they are reporting on the number of tests at different stages in the process. Further detail is given in the NHS Test and Trace statistics methodology.
After someone takes a test, it is transported to a laboratory for processing. There are normal fluctuations in this operational process which can sometimes cause the time taken to receive a test result to go over 24 hours, but still be turned around the next day. Where appropriate therefore we also provide the number of tests turned around the day after a test was taken.
Satellite tests are predominantly used by care homes who need greater control and flexibility over when test kits are collected. For example, tests may be conducted over multiple days with a collection scheduled a few days later. Home test kits take time to be posted to a person and be couriered back to the lab. Consequently, a low proportion of home and satellite test results will be available within 24 hours of the test being taken.
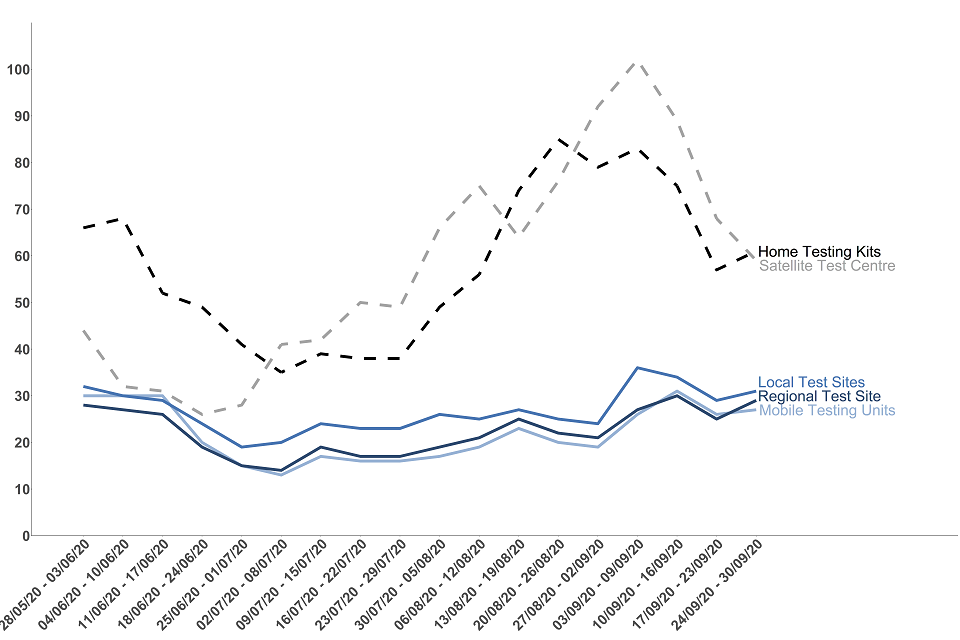
The median time to receive a test result after taking a test in-person has increased in the latest week.
In the first month of Test and Trace, there was an initial reduction in the median time taken to receive a test result for in-person tests (regional test sites, local test sites and mobile testing units). This began to gradually trend back up from the start of July until the middle of September.
Between 24 September and 30 September, the median time taken to receive a test result at regional test sites increased to 29 hours from 25 hours in the previous week. Similarly, local test sites increased to 31 hours from 29 hours, whilst mobile testing units increased slightly to 27 hours from 26 hours during the same period.
Since the start of September, the median time taken to receive a test result after taking a test has notably decreased for both home testing kits/satellite test centres but are still longer than the beginning of July.
In the first month of Test and Trace, home testing kits and satellite test centres saw an initial reduction in the median time taken to receive a test result followed by a notable increase from the end of July until the beginning of September.
Since the beginning of September, the median time taken to receive a test result from satellite test centres has decreased from 102 hours to 59 hours. The median time for home testing kits has also decreased from 83 hours to 61 hours over the same 3-week period.
Figure 5: median time (hours) from taking a test to receiving test results by route, England
The data for the most recent weeks can be found in the annex, table 3.
The percentage of test results received within 24 hours for in-person tests has decreased in the latest week. The percentage received within 48 hours has also decreased for home testing kits whereas it has increased for satellite test centres, compared to the previous week.
In the most recent week, for in-person tests (local test sites, mobile testing units and regional test sites), 25.7% were received within 24 hours compared to 38% in the previous week. 23.1% of test results were received within 48 hours for home test kits and satellite test centres, compared to 19% in the previous week.
For all routes combined, 11.9% of tests from all test sites were received within 24 hours of a test being taken compared to 17% in the previous week. If we consider the day the test was taken, 60.8% of in-person tests results were received the next day after the test was taken and 30.6% for all routes combined.
Table 1: percentage of results received within 24 hours (in-person tests) or within 48 hours (home/satellite tests), by route, England
| 17 Sept to 23 Sept: number of tests (percentage) | 24 Sept to 30 Sept: number of tests (percentage) | 28 May to 30 Sept: number of tests (percentage) | |
|---|---|---|---|
| Regional test sites within 24 hours | 46.5% | 26.8% | 59.5% |
| Local test sites within 24 hours | 29.6% | 19.2% | 29.3% |
| Mobile testing units within 24 hours | 42.8% | 33.6% | 56.5% |
| Satellite test centres within 48 hours | 15.8% | 22.1% | 24.4% |
| Home testing kits within 48 hours | 30.4% | 26.4% | 34.3% |
The data for the total number of tests across the most recent weeks can be found in the annex, table 4.
Distance to in-person testing sites for booked tests, pillar 2, England
The distance to testing sites for booked tests at is calculated as the direct distance between the approximate centre of a person’s postal district and their chosen test location in straight line. This is reported as the median and associated percentiles for those who successfully booked a test at regional test sites, local test sites and mobile testing units in the latest week. More information is available in the NHS Test and Trace statistics methodology.
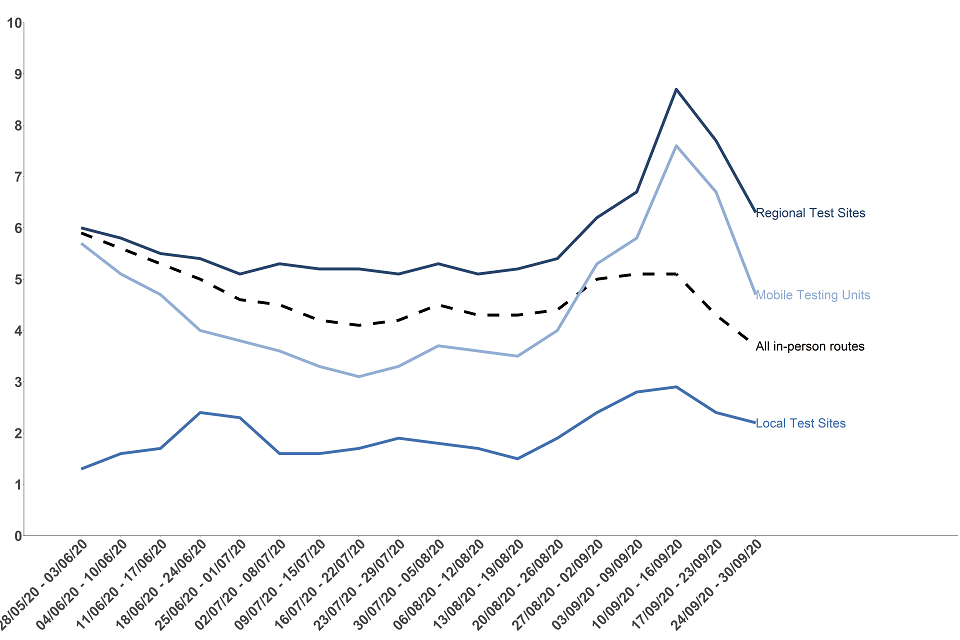
The median distance to in-person testing sites for booked tests has increased overall since mid-August but has decreased over the past 2 weeks.
Since mid-August the distance to testing sites for booked tests had been increasing across in-person routes but has decreased over the last two weeks. Between 24 September and 30 September, the median distance travelled for an in-person test decreased to 3.7 miles from 4.3 miles in the previous week. 90% of people who booked a test at a test centre lived 16.5 miles or less away.
Considering each route individually, in the latest week, the median distance to testing sites for booked tests at regional test sites has decreased to 6.3 miles from 7.7 miles, for local test sites this decreased to 2.2 miles from 2.4 miles and for mobile testing units the median decreased to 4.7 from 6.7 compared to the previous week.
The median distance travelled for a test at a local test site has remained lower than the distance travelled for tests at regional test sites and mobile testing units since Test and Trace began.
Figure 6: median distance (miles) to testing sites for tests booked at an in-person test site by route, England
The data for the most recent weeks can be found in the annex, table 5.
Contact tracing in England
Once a person has a confirmed positive test result for coronavirus[footnote 9], this person is transferred to NHS Test and Trace and a case is opened for them. The number of positive cases transferred to the contact tracing system may not always align with the number of people testing positive for COVID-19. There are several reasons for this which are outlined in the information for users document.
Positive cases transferred to NHS Test and Trace are handled in different ways depending on their complexity. Positive cases linked to potential outbreaks in specific settings are handled by PHE Local Health Protection Teams, these are termed complex cases, whereas those managed more generally by online and call centre capacity are termed non-complex cases. Further information is available in the NHS Test and Trace statistics methodology.
A technical issue was identified overnight on Friday 2 October in the automated process that transfers pillar 2 COVID-19 positive lab results into reporting dashboards and contact tracing. After rapid investigation, 15,841 cases were identified between 25 September and 2 October that were not included in the reported daily COVID-19 cases as published on the coronavirus (COVID-19) in the UK dashboard. More information can be found in the PHE statement on delayed reporting of COVID-19 cases. All affected cases were immediately transferred to contact tracing on 3 October and a thorough public health risk assessment was undertaken to ensure outstanding cases were prioritised for contact tracing effectively. As a result, there were approximately 11,000 positive test results that would normally have entered the contact tracing system during the course of this reporting period that did not do so until the following week. Contact tracing in relation to those results will be covered in next week’s publication.
Positive cases transferred to NHS Test and Trace
The number of people transferred to the contact tracing system increased by 19% compared to the previous week, a continuation of the sharp upward trend seen from the beginning of August.
Between 24 September and 30 September, 34,494 people were transferred to the contact tracing system. The number of people transferred has been notably increasing over the last 7 weeks and in the latest week the number is 4 times higher than the end of August and 4 times higher compared to when Test and Trace launched at the end of May.
Between 24 September and 30 September, more than 7 in every 10 people transferred to the contact tracing system were reached and asked to provide information about their contacts.
Out of the 34,494 people transferred to the contact tracing system in the latest week, 25,531 (74%) were reached, 8,173 (23.7%) were not reached and 790 (2.3%) had no communication details. The proportion of people reached has decreased over the past 3 weeks and is now at a similar proportion seen in the first week of Test and Trace when 73.4% of people were reached.
In the latest week, 867 people, who were reached and asked to provide details of close contacts, were classified as complex cases whereas 24,664 people were classified as non-complex. For more information on the different categories of cases and the outcomes of contact tracing see the terminology section.
Figure 7: number of people transferred to the contact tracing system and number of people transferred who were reached and asked to provide details of recent close contacts (includes complex and non-complex cases), England
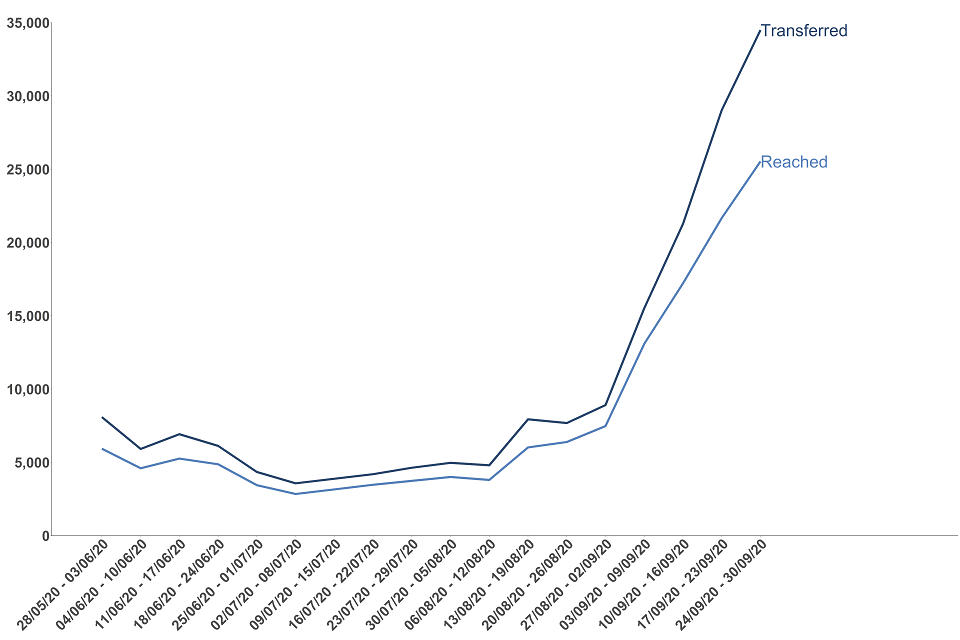
Table 2: people transferred to the contact tracing system (includes complex and non-complex cases) by whether they were reached and asked to provide contact details, England[footnote 10]
| 17 Sept to 23 Sept: number of people (percentage) | 24 Sept to 30 Sept: number of people (percentage) | Since Test and Trace launched. 28 May to 30 Sept: number of people (percentage) | |
|---|---|---|---|
| People who were reached and asked to provide details of recent close contacts | 21,675 (74.6%) | 25,531 (74%) | 142,559 (78.2%) |
| People classified as non-complex | 20,908 | 24,664 | 131,230 |
| People classified as complex | 767 | 867 | 11,329 |
| People who were not reached | 6,049 (20.8%) | 8,173 (23.7%) | 34,921 (19.2%) |
| People whose communication details were not provided | 1,313 (4.5%) | 790 (2.3%) | 4,834 (2.7%) |
| Total | 29,037 | 34,494 | 182,314 |
Proportion of people transferred to the contact tracing system who were reached by upper tier local authority (UTLA)
Figure 8: percentage of cases reached and asked to provide details of recent close contacts by UTLA since Test and Trace began
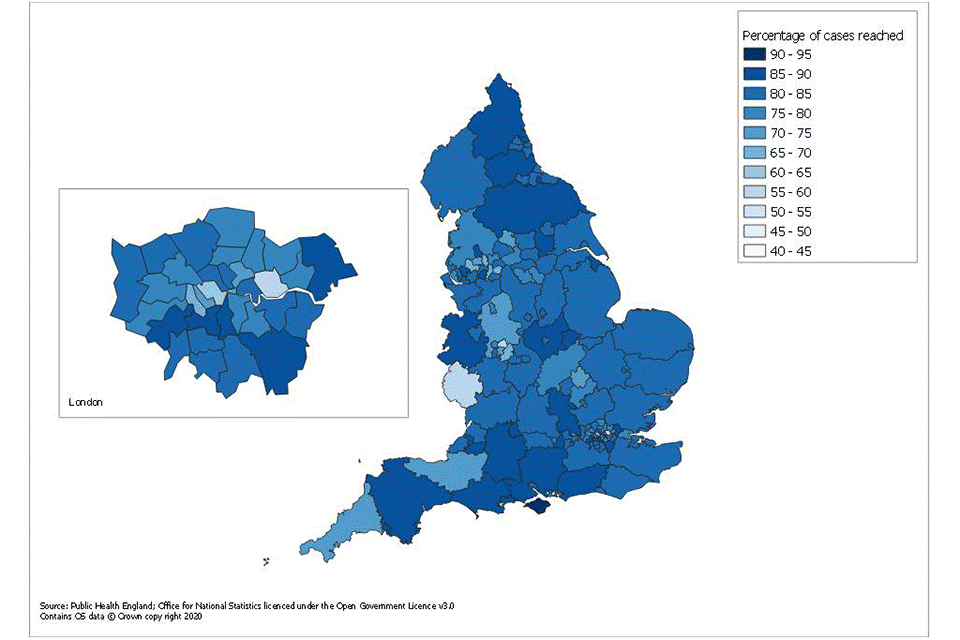
This data is available to download as a csv on the weekly publication collection page[footnote 11].
In the latest week more than 4 in every 5 people who were reached and asked to provide information about their contacts, provided one or more close contacts.
Out of the 25,531 people reached between 24 September and 30 September, 21,403 (83.8%) provided details of one or more close contacts. There has been an upward trend in the proportion of people providing one or more contact since mid-August but the latest week remains broadly consistent with the previous week.
The number who were not able to give any recent close contacts refers to people who were successfully reached by NHS Test and Trace, but either had no recent close contacts or could not provide details of close recent contacts to pass on for further contact tracing (for example, recent close contact with strangers on the bus).
In the most recent week, the median number of complex contacts provided per case has decreased to 5 compared to 6 in the previous week. For non-complex cases the median was 3 and this has been approximately constant since the start of Test and Trace.
Figure 9: proportion of people transferred to the contact tracing system (includes complex and non-complex cases) who were reached and asked to provide details of recent close contacts by whether they provided details for contacts or not, England
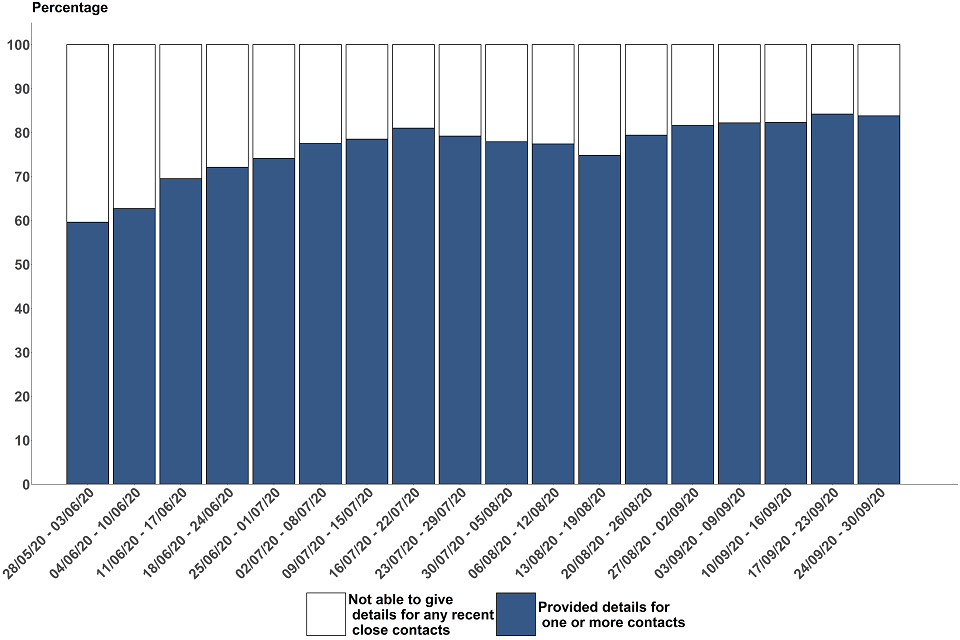
The data for the most recent weeks can be found in the annex, table 6.
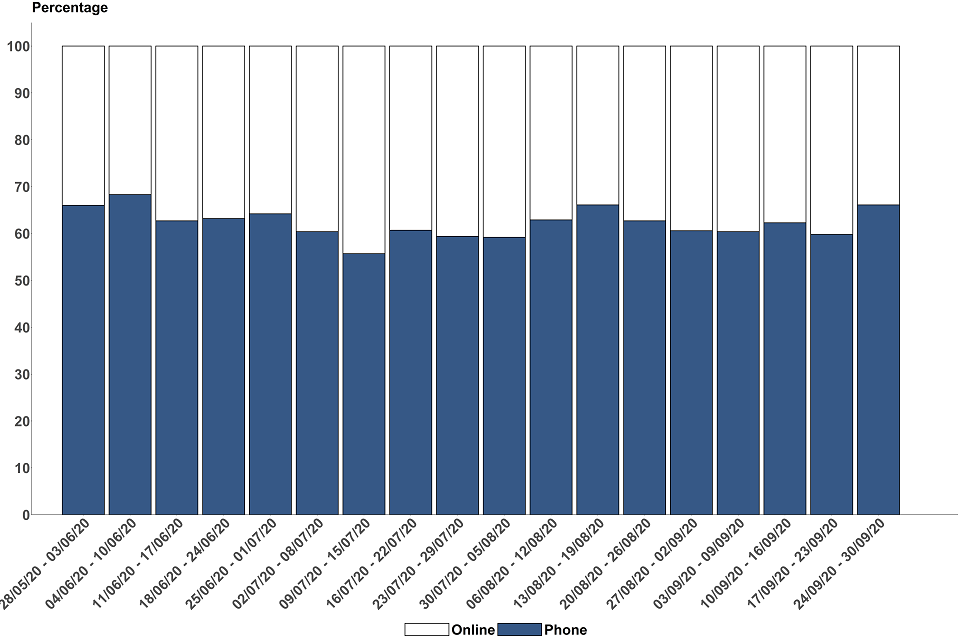
The proportion of cases who were reached by the phone or online has remained broadly consistent since test and trace began.
Of the non-complex cases reached between 24 September and 30 September 16,283 (33.9%) were reached online and 24,639 (66.1%) were reached via the phone. This has remained broadly consistent over the past 4 months with 37.5% reached online and 66.1% reached by phone since Test and Trace began.
Most cases are offered the online route initially and are followed up with phone call if they have not been reached online. For more information on how cases are contacted see NHS Test and Trace statistics methodology page.
Figure 10: proportion of non-complex cases who were reached, by whether they were reached online or by phone
The back series of figures for non-complex contacts by phone and online can be found in annex B, table 12.
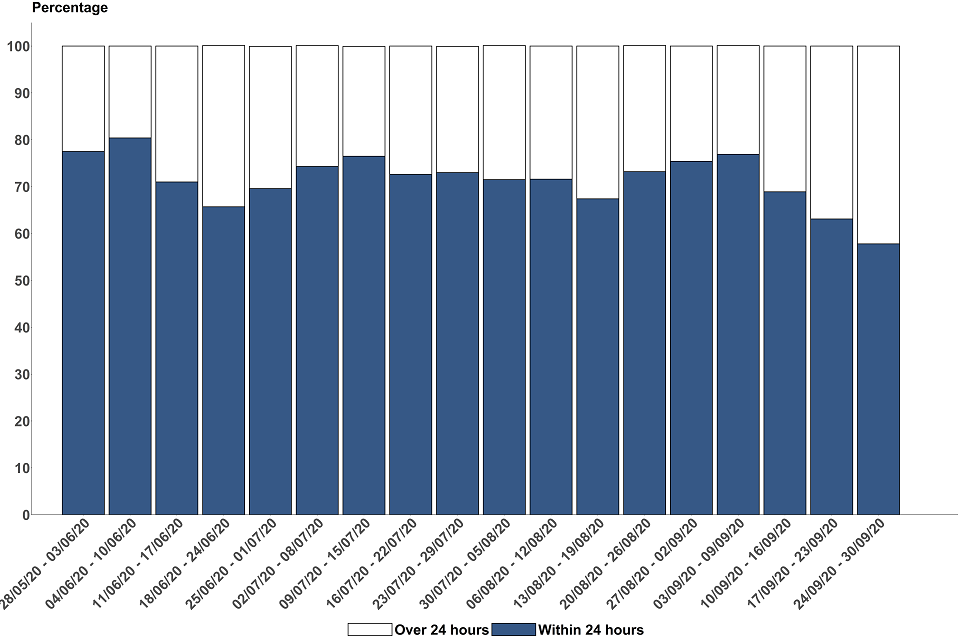
For non-complex cases, over half were reached and asked to provide details about recent close contacts within 24 hours of their case being transferred to contact tracing.
Between 24 September and 30 September, 57.8% of people (14,265) were reached within 24 hours. The proportion of people reached within 24 hours has been declining over the past 4 weeks. Since Test and Trace launched on 28 May, 68.3% of people (89,640) have been reached within 24 hours.
Note that because these timing statistics are from when a case was transferred to the contact tracing system, delays in transferring cases to contact tracing will not be captured in these figures.
Figure 11: proportion of people who were reached and asked to provide details about recent close contacts by time taken to reach them, England (excludes complex cases)
The data for the most recent weeks can be found in the annex, table 7.
Close contacts identified by NHS Test and Trace
The number of recent close contacts identified has steeply increased over the past 5 weeks, with more than 3 times as many contacts identified in the most recent week compared to the end of August. The number of contacts identified in the latest week is 11% higher in the most recent week compared to the previous week.
Between 24 September and 30 September, 101,782 people were identified as recent close contacts, of which 83,517 (82.1%) were non-complex and 18,265 (17.9%) were complex. The number of non-complex contacts identified in the most recent week is nearly 4 times higher compared to the end-August. This is in comparison to complex contacts identified which has more than doubled over the same time period, but the most recent week saw a 22% decrease compared to the previous week.
The total number of complex close contacts identified had a steep decline between the start of contact tracing and the end of June in comparison to the number of non-complex contacts which remained broadly consistent over the same time period. At the beginning of June complex contacts were 81.7% of contacts identified compared to only 17.9% in the most recent week.
As non-complex cases have a higher proportion of contacts who are unable to be reached, this has contributed to the reduction in the overall percentage of contacts who were reached and asked to self-isolate since Test and Trace launched, from 91.1% to 68.6% in the latest week.
Considering only the contacts where communication details were provided, 82.2% were reached and asked to self-isolate in the most recent week. Since Test and Trace launched, this is 85.7%.
Figure 12: number of people identified as recent close contacts, England
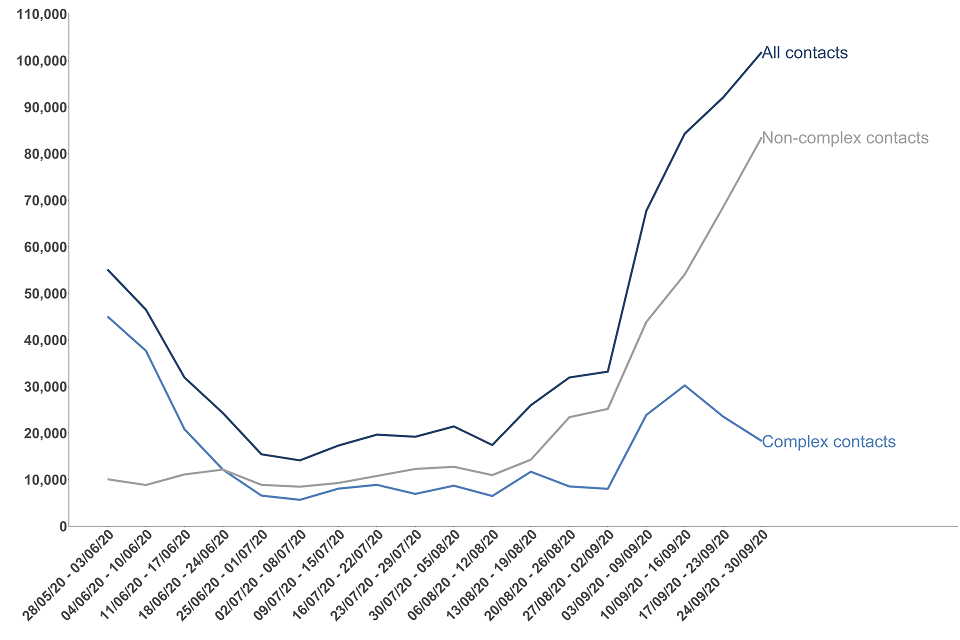
The data for the most recent weeks can be found in the annex, table 8.
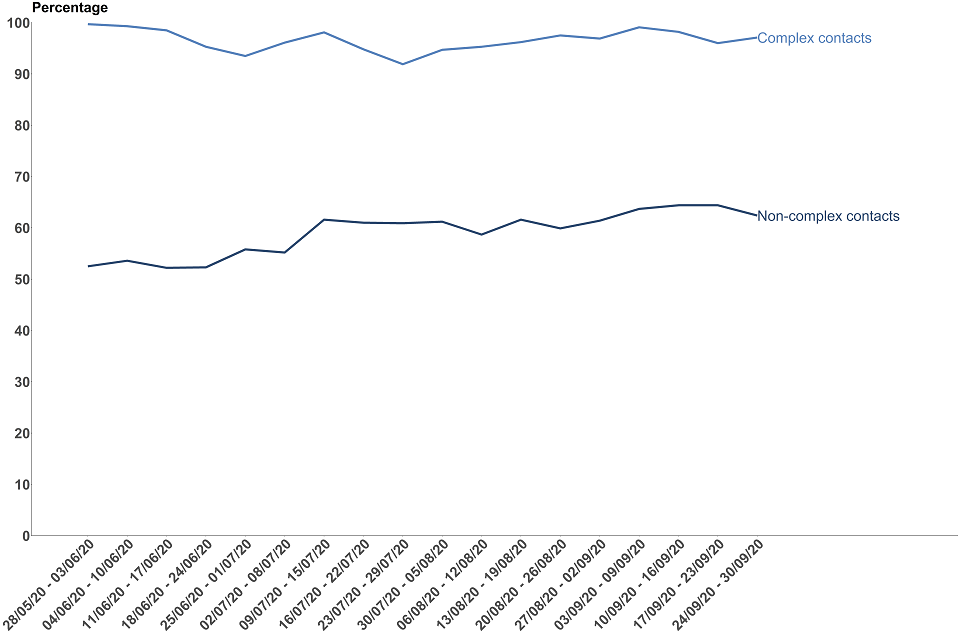
The percentage of non-complex contacts who were reached and asked to self-isolate has increased from 52.5% to 62.4% since the start of Test and Trace.
Between 24 September and 30 September, 83,517 non-complex close contacts were identified of which 52,084 (62.4%) were reached and asked to self-isolate. This percentage increased between the end of August and mid-September but has declined slightly in the most recent week compared to the previous week.
In the latest week, 14,548 (17.4%) non-complex contacts were not reached and 16,885 (20.2%) people had no communication details. For more information on the different outcomes of contact tracing see the terminology section.
Almost all complex contacts continue to be reached and asked to self-isolate.
Between 24 September and 30 September, 18,265 complex close contacts were identified of which 17,731 (97.1%) were reached and asked to self-isolate and 534 (2.9%) were not reached. The proportion of complex close contacts successfully reached decreased gradually since the beginning of September but has inclined slightly in the latest week. Since Test and Trace launched 97.6% of all complex contacts have been successfully reached.
Figure 13: proportion of contacts reached and asked to self-isolate, England
The data for the most recent weeks can be found in the annex, table 8.
Proportion of non-complex close contacts identified who were reached and asked to self-isolate by upper tier local authority
Figure 14: percentage of non-complex contacts reached and asked to provide details of recent close contacts by UTLA since Test and Trace began
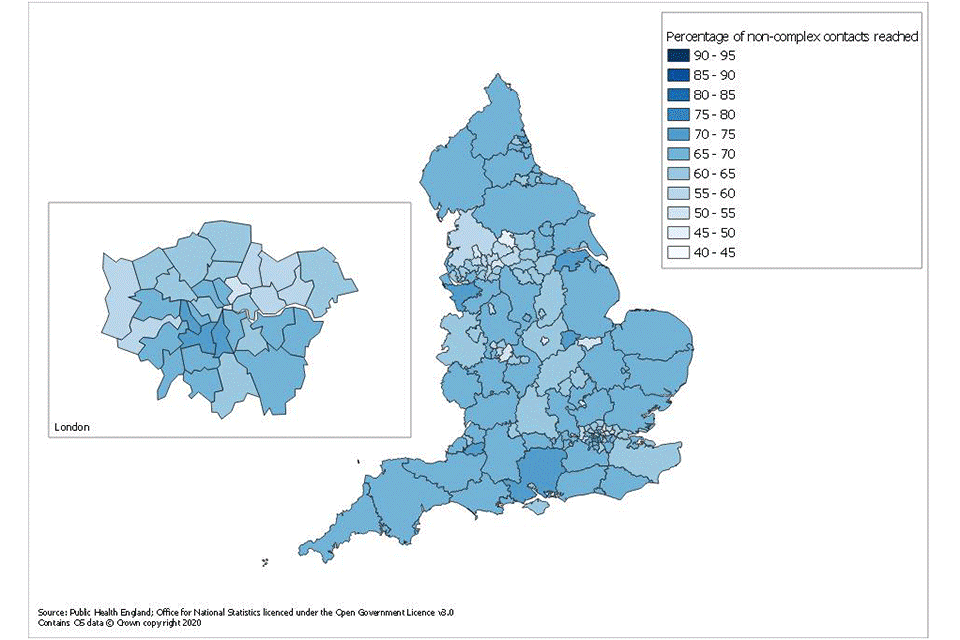
This data is available to download as a csv on the weekly publication collection page[footnote 11].
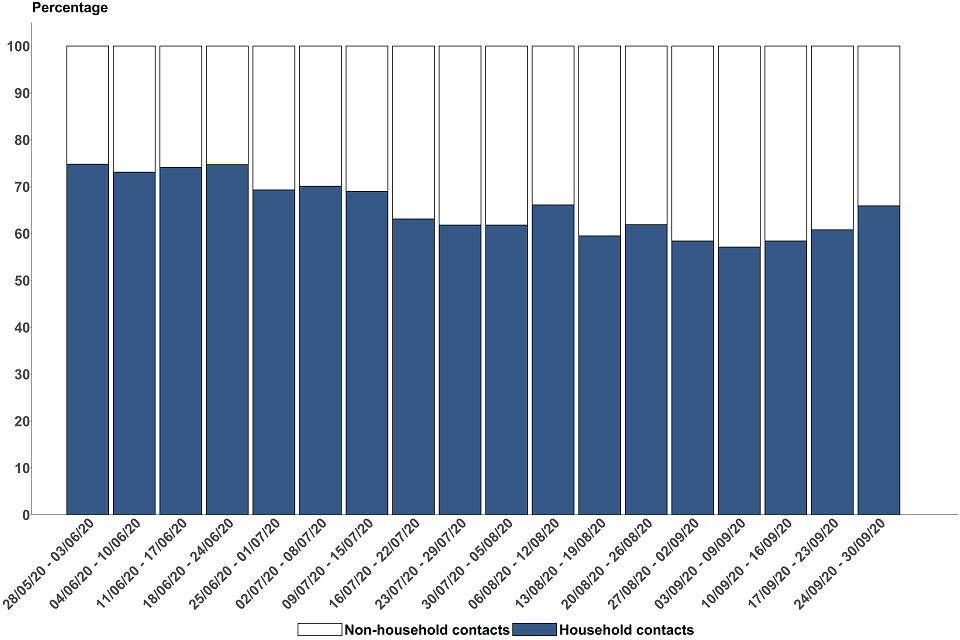
In the most recent week, around 2 out of 3 non-complex contacts were from the same household as the case they were identified from.
The proportion of non-complex close contacts from the same household as the case they were identified from steadily declined between the end of May, when Test and Trace launched, and the beginning of September. Between 24 September and 30 September, 65.9% of non-complex contacts were household contacts compared to 74.8% at the start of Test and Trace.
In the latest week, 60% of these household contacts were successfully reached and asked to self-isolate. This is in comparison to 67% for non-complex contacts who were from a different household to the case from which they were identified.
It is likely that cases often advise their household members to self-isolate in advance of these contacts being directly contacted by contact tracers. Therefore, even where household contacts are recorded as not reached and advised to self-isolate, they may already be aware of their exposure and isolating appropriately. This may be a contributing factor to a lower proportion of household contacts being reached in comparison to non-household contacts.
Figure 15: proportion of recent close non-complex contacts by whether they were from the same household as the case that they were identified from, England
The data for the most recent weeks can be found in the annex, table 9.
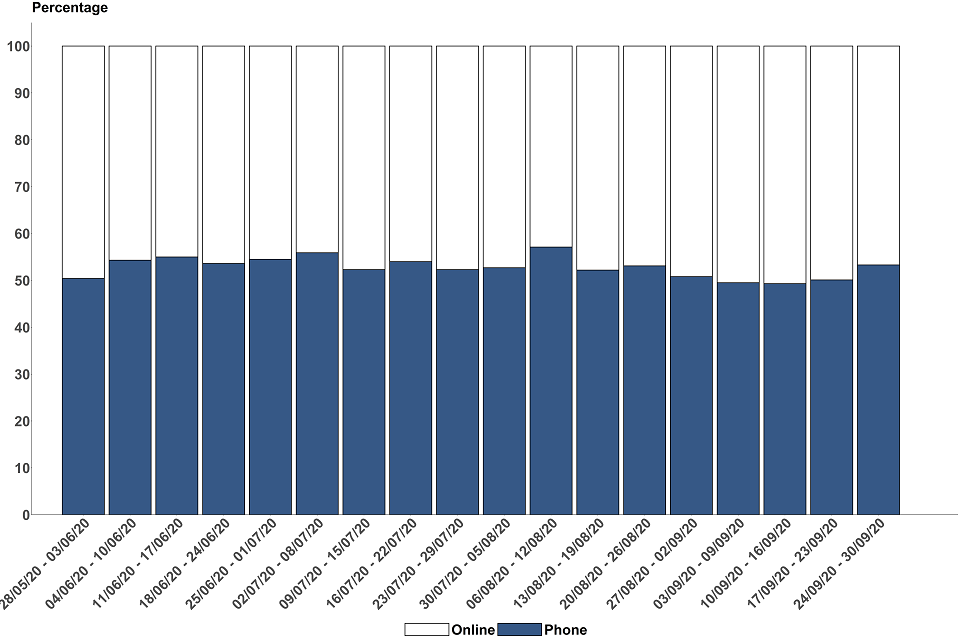
The proportion of contacts who were reached by the phone or online has remained broadly consistent since test and trace began.
Of the non-complex contacts reached between 24 September and 30 September 24,317 (46.7%) were reached online and 27,764 (53.3%) were reached via the phone. This has remained broadly consistent over the past 4 months with 48.2% reached online and 51.8% reached by phone since test and trace began.
Most contacts are offered the online route initially and are followed up with phone call if they have not been reached online. For more information on how cases are contacted see NHS Test and Trace statistics methodology page.
Figure 16: proportion of non-complex contacts who were reached, by whether they were reached online or by phone
The back series of figures for non-complex contacts by phone and online can be found in annex B, table 13.
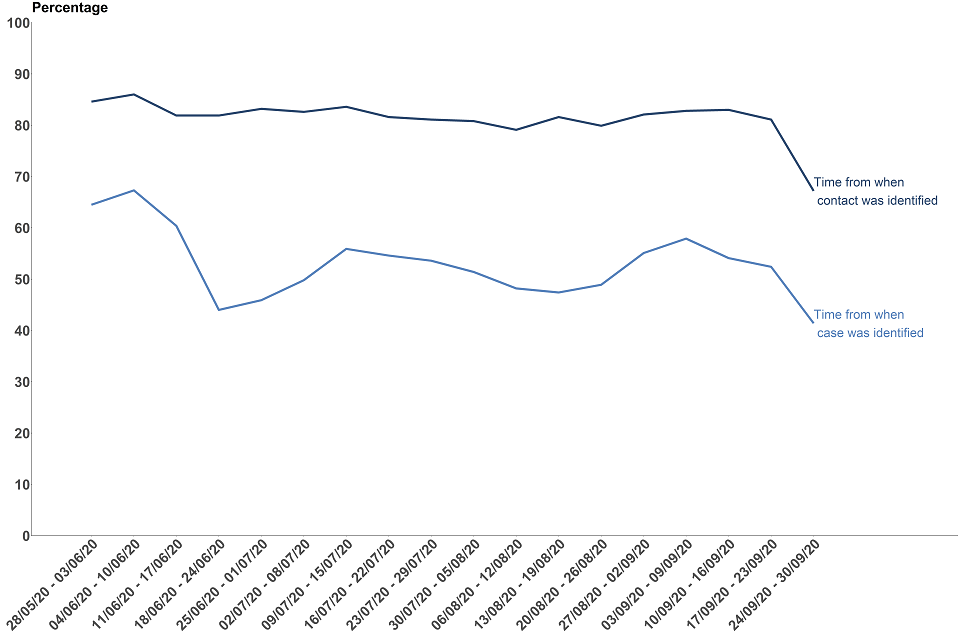
For non-complex contacts who were advised to self-isolate, more than 2 out of 3 were reached within 24 hours of being identified[footnote 12].
Between 24 September and 30 September, 67.2% of non-complex contacts that were advised to self-isolate were reached within 24 hours of being identified. This proportion has remained similar since Test and Trace launched but has decreased in the latest week. Overall, since Test and Trace launched, 79% of all non-complex contacts have been reached and advised to self-isolate within 24 hours.
For non-complex contacts who were advised to self-isolate, over 40% were reached within 24 hours of the case that reported them being transferred to the contact tracing system. This percentage has declined over the past 3 weeks.
Between 24 September and 30 September, 21,455 (41.4%) non-complex contacts were reached and advised to self-isolate within 24 hours of the case that reported them being transferred to the contact tracing system. This has seen an overall decline from a peak of 67.3% at the beginning of June and a downward trend in the past 3 weeks.
This measure gives a sense of the end-to-end journey time through the Test and Trace system from when an individual testing positive was reported to Test and Trace, to when their close contacts were reached and advised to self-isolate.
Note that because these timing statistics are from when a case was transferred to the contact tracing system, delays in transferring cases to contact tracing will not be captured in these figures.
Figure 17: proportion of recent close contacts who were advised to self-isolate within 24 hours, England
The data for the most recent weeks can be found in the annex, table 10 and table 11.
Coronavirus (COVID-19) testing in the UK
Statistics on coronavirus testing in the UK, across all 4 testing pillars are also included in this release. This includes details on laboratory testing capacity (lab capacity), number of tests sent out and number of tests processed since the start of testing in the UK. Definitions of the testing pillars and swab and antibody tests can be found in the terminology section.
This data was previously published on daily statistics on coronavirus cases in the UK until Thursday 20 August. Although this page is no longer be updated the historic UK testing statistics and the accompanying COVID-19 testing data methodology note are still available. Statistics on tests processed and testing capacity are published weekly in this publication and daily figures are also available on the coronavirus in the UK dashboard. Statistics on positive cases will continue to be published daily on the dashboard and weekly in the NHS Test and Trace publication. A historic time series of weekly lab capacity, tests sent out and tests processed is available on the collection page for this release.
Testing capacity in the UK, pillars 1 to 4
Coronavirus tests are processed in several separate labs. Projected lab capacity is an estimate of each lab’s constrained capacity each day based on the staff, chemical reagents and other resources it has available. These estimates are made locally by the labs themselves. Actual capacity is calculated retrospectively after knowing what the exact conditions were on the day and how many tests could have theoretically been processed. The figures in this bulletin refer to projected capacity. Further information on the methods for determining capacity is available in the NHS Test and Trace statistics methodology.
Testing capacity between 24 September to 30 September was 2,863,247 tests, an 8% increase on the previous week primarily driven by a 10% increase in pillar 2 testing capacity. Testing capacity gradually increased from around 45,000 tests at the end of March to over 2,400,000 in mid-July when capacity levelled off until mid-August.
Swab testing capacity is at 2,015,547 tests which is a 40% increase since mid-August. In comparison, antibody testing (serology) capacity has remained consistent over the same time period.
Table 3a: weekly lab testing capacity, pillars 1-4, UK[footnote 13]
| 17 Sept to 23 Sept: number of tests | 24 Sept to 30 Sept: number of tests | |
|---|---|---|
| Pillar 1 | 575,294 | 576,958 |
| Pillar 2 | 1,222,600 | 1,344,400 |
| Pillar 3 | 840,000 | 840,000 |
| Pillar 4 | 22,377 | 101,889 |
| UK total | 2,660,271 | 2,863,247 |
Table 3b: Weekly lab testing capacity, swab and antibody tests, UK
| 17 Sept to 23 Sept: number of tests | 24 Sept to 30 Sept: number of tests | |
|---|---|---|
| Swab tests | 1,812,571 | 2,015,547 |
| Antibody tests | 847,700 | 847,700 |
| UK total | 2,660,271 | 2,863,247 |
A breakdown of the daily lab capacity for swab and antibody tests, up to the 22 September is available on the NHS Test and Trace collection page. Further information is available in the NHS Test and Trace statistics methodology.
Number of tests sent out in the UK, pillar 2 and pillar 4
Tests can be administered in different ways:
- tests taken at a hospital
- mobile testing unit
- regional testing sites
- tests sent out to individuals at home or satellite locations
Tests sent out are only available as part of pillar 2 (swab testing) and pillar 4 (swab and antibody testing). Not all tests sent out will be returned.
It is not currently possible to compare the total number of tests sent out with the total number of tests processed in pillar 2 and pillar 4, as given in table 5a. This is because tests sent out includes only tests sent to individuals at home or to satellite testing locations, while tests processed includes all tests that have remained within the control of the programme (and were counted at the time at which processed in labs) and those that have been sent out and subsequently returned to be processed in a lab. Further information is available in the NHS Test and Trace statistics methodology.
1,242,785 tests were sent out across the UK within pillars 2 and 4 between 24 September and 30 September, a slight increase since the previous week and continuing the upward trend since mid-August. The number of tests sent out has overall seen an upward trend since mid-April when there were less than 1,000 tests sent out compared to over 1.2 million in the latest week.
Table 4: number of tests sent out, pillars 2 and 4, UK
| 17 Sept to 23 Sept: number of tests | 24 Sept to 30 Sept: number of tests | Total since data collection began: number of tests | |
|---|---|---|---|
| Pillar 2 | 1,003,245 | 1,199,327 | 13,988,542 |
| Pillar 4 | 204,887 | 43,458 | 1,711,724 |
| UK total | 1,208,132 | 1,242,785 | 15,700,266 |
Number of tests processed in the UK, pillars 1 to 4
The number of tests processed counts all tests that have remained within the control of the programme (and were counted at the time at which processed in labs) and those that have been sent out and subsequently returned to be processed in a laboratory. They are counted at the time at which they were processed. This measure shows how many tests have been processed, including both swab testing (pillar 1, pillar 2 and partial pillar 4) and antibody testing (pillars 3 and 4). Further details are available in the NHS Test and Trace statistics methodology.
For pillars 1 and 2, the number of tests processed in a laboratory is different to the number of test results processed which is reported as part of the Test and Trace testing turnaround times for England. This is because they are reporting on the number of tests at different stages in the process as well as reporting different geographies (UK and England) and because some tests are excluded from the turnaround time counts.
Between 24 September and 30 September, 1,839,872 tests were processed in total across pillars 1 to 4, continuing the upward trend since mid-August. The number of tests processed has gradually increased from around 13,000 at the end of March to over 1.8 million in the most recent week.
The number of swab tests processed has been increasing steadily since the end of March. In the current week this is 7% higher than the previous week and over 3 times higher than mid-June. The number of antibody (serology) tests processed have remained at relatively low levels with a peak in mid-June, however there was a 64% decrease in the latest week compared with the previous week.
Table 5a: number of tests processed, pillars 1 to 4, UK[footnote 13]
| 17 Sept to 23 Sept: number of tests | 24 Sept to 30 Sept: number of tests | Total since data collection began: number of tests | |
|---|---|---|---|
| Pillar 1 | 489,282 | 475,552 | 7,834,371 |
| Pillar 2 | 1,099,478 | 1,131,017 | 12,893 466 |
| Pillar 3 | 34,202 | 31,336 | 1,681,735 |
| Pillar 4 | 196,753 | 201,967 | 2,097,435 |
| UK total | 1,819,715 | 1,839,872 | 24,507,007 |
Table 5b: number of tests processed, swab and antibody, UK
| 17 Sept to 23 Sept: number of tests | 24 Sept to 30 Sept: number of tests | |
|---|---|---|
| Swab tests | 1,676,120 | 1,788,295 |
| Antibody tests | 143,595 | 51,577 |
| UK total | 1,819,715 | 1,839,872 |
A breakdown of the daily lab capacity for swab and antibody tests, up to the 22 September is available on the NHS Test and Trace collection page. Further information is available in the NHS Test and Trace statistics methodology.
Terminology
Testing
Pillar 1 testing: swab testing in Public Health England (PHE) labs, NHS hospitals for those with a clinical need, and health and care workers.
Pillar 2 testing: swab testing for the wider population, through commercial partnerships[footnote 14], carried out through several different routes:
- regional test sites, which includes drive-through testing centres
- local test sites[footnote 8], which are similar to regional test sites but specifically for walk ups
- mobile testing units, which travel around the UK to increase access to COVID-19 testing. They respond to need, travelling to test people at specific sites including care homes, police stations and prisons
- satellite test centres, which includes test kits provided directly to ‘satellite’ centres at places like hospitals or care homes that have a particularly urgent or significant need
- home test kits, which are delivered to someone’s door so they can test themselves and their family without leaving the house
Pillar 3 testing: serology testing to show if people have antibodies from having had coronavirus.
Pillar 4 testing: blood and swab testing for national surveillance support by PHE, ONS and research, academic and scientific partners to learn more about the prevalence and spread of the virus and for other testing research purposes.
Swab testing: testing using polymerase chain reaction (PCR) assay within pillars 1, 2 and pillar 4 to show if someone currently has COVID-19.
Antibody testing: testing of a blood sample within pillar 3 and pillar 4 to show if people have antibodies from having had COVID-19.
People tested: refers to people who have newly been tested for COVID-19 and does not re-count people who have been tested more than once in either pillar 1 or pillar 2.
People testing positive: refers only to people who have newly tested positive for COVID-19 and does not include people who have had more than one positive test.
For pillar 2, there are two measures of the time taken to receive a coronavirus (COVID-19) test result:
- the time taken to receive a COVID-19 test result from time of booking is measured from the time that a person books an appointment on the website to the time when the person receives a notification of their test result via an email or an SMS. This data is only available for regional test sites, local test sites and mobile testing units, as test booking and registration processes for home testing and satellite test centres are currently undertaken on different systems
- the time taken to receive a COVID-19 test result from time of test is measured from the time a person completes a test registration (or the time a person indicates their test was taken for home testing kits) until the time that they receive a notification of the result of their test via an email or an SMS
Tracing
NHS Test and Trace has two ways of handling cases depending on their complexity:
Complex cases and contacts
PHE local health protection teams manage cases linked to outbreaks, examples include someone who works or has recently visited:
- a health or care setting, such as a hospital or care home
- a prison or other secure setting
- a school for people with special needs
- critical national infrastructure or areas vital for national security
Non-complex cases and contacts
Wider online and other call centre capacity for less complex cases.
When a case is transferred to NHS Test and Trace contact tracers will attempt to contact the individual which results in one the following 3 outcomes:
- Reached and provided information about recent close contacts: contact tracers successfully reached the individual and asked them to provide details for recent close contacts
- No communication details provided: people who had no communication details provided are those who were transferred to NHS Test and Trace but did not have any associated contact details (for example, phone number or email address).
- Not reached: The number of people who were not reached includes those people who the service has been unable to reach because there has been no response to text, email and call reminders. It also includes people who were reached but declined to give details of close contacts. There may also be a small number of people who have not been reached but where contact tracers are still in the process of trying to make contact.
Measuring the data
How the data was collected
UK level testing data is collated centrally by DHSC from multiple sources across the different nations and pillars. Further details can be found in the NHS Test and Trace statistics methodology.
Testing data for pillars 1 and 2 for England are provided by PHE, NHS and commercial partners. Contact tracing data are collected from management information from the NHS Test and Trace service. Details about the data sources used can be found in the NHS Test and Trace statistics methodology document.
Future development
We have integrated this data with those from other parts of NHS Test and Trace, particularly testing, to provide an end-to-end view of the service that follows the user journey. So far, UK level testing data, testing data for pillars 1 and 2 in England and their turnaround times have been added. Further breakdowns for contact tracing continue to be incorporated, including complex and non-complex breakdowns, geographical breakdowns and household information.
To support user needs and data transparency, additional releases have been published alongside the weekly Test and Trace publication including:
- care home statistics up to 8 July
- people tested for coronavirus (COVID-19) between 30 January and 27 May
- weekly UK testing statistics since the start of testing
- demographic data for coronavirus testing in England between 28 May and 26 August
NHS Test and Trace continues to provide information for local authorities and their partners so that they have the information they need to help contain any outbreaks. In time, NHS Test and Trace intends to publish detailed data from across the program to support secondary analysis, for example in academic institutions. Over the coming months, we intend to make the following available:
Expected Autumn 2020
- details of close contacts who go on to test positive
- high-level UK Test and Trace figures
- additional demographic information for people tested
- details on testing in care homes
The UK Statistical Authority has published a rapid review of the Test and Trace statistics. This includes recommendations on how the publication should develop it order to adhere fully to the Code of Practice. These recommendations continue to influence the development of the publication in the coming weeks and months.
Strengths and limitations
Given the importance of this service and the commitment of NHS Test and Trace to be open and transparent with the public it serves, this data are being released at the earliest possible opportunity. However, new IT systems and statistical outputs often take a period of time to bed in. This data should therefore be treated with caution as the system and understanding of the data develops.
More information on data limitations and how the figures in this publication can and can’t be used is outlined in the NHS Test and Trace methodology.
Quality
These statistics have been put together by NHS Test and Trace and DHSC with advice from the Office for National Statistics. As part of the quality assurance process, DHSC ensures that all published figures are replicable and any issues impacting on the quality of the data are clearly stated within the publication. Furthermore, the figures are often triangulated with other published sources to verify trends in the data.
Revisions to figures previous published
Figures for people tested and people testing positive for coronavirus (COVID-19) in previous releases have been revised. These revisions are because:
- there are sometimes delays in laboratories submitting data to PHE
- quality checks are conducted on the data to refine figures over time
Figures for pillar 2 testing turnaround times in previous releases have been revised. These revisions are because:
- there has been a change in methodology for how the location of home tests and satellite tests is assigned. The new methodology uses the individuals home address instead of the address of the laboratory. This has resulted in an increase in the number of tests in England as a large number of tests from England were being processed in laboratories outside of England
- the figures presented are based on a data-cut several days after the end of the reporting period. Some tests may continue to be being processed after this period and therefore data may need to be revised over time
Figures for contact tracing in previous releases have been revised. These revisions are because:
- the figures presented are based on a data cut several days after the end of the reporting period, to give time for cases reported towards the end of the 7-day period to have an outcome. Some cases may continue to be in progress after this period, and therefore data may need to be revised over time
- typically, one week after initial publication the number of cases reached and consequently the number of contacts identified is expected to increase. Similarly, the number of cases and contacts reached within 72 hours is likely to increase
Cumulative figures for coronavirus (COVID-19) testing in the UK have been revised. These revisions are because:
- for tests processed and tests sent out, weekly totals reflect the sum of actual daily counts reported for the previous week. Each week there may be corrections to previously reported figures, for example, where labs (or studies under pillar 4) returned the results late or duplicates were identified and removed. These corrections are reflected in the cumulative figures. This means that previously published weekly counts will not necessarily sum to the latest cumulative figure. It also means that the latest cumulative count may not match the previous week’s cumulative count plus this week’s weekly count
More information on quality and how this publication adheres to the Code of Practice for statistics is available in the statement of compliance.
Feedback
For questions about the release please refer to the Information for Users document initially. For feedback and any further questions, please contact statistics@dhsc.gov.uk.
Annex A: tables
Annex table 1: people newly tested for COVID-19 under pillars 1 and 2, England
| 17 Sept to 23 Sept: number of people | 24 Sept to 30 Sept: number of people | Since Test and Trace launched. 28 May to 30 Sept: number of people | |
|---|---|---|---|
| Pillar 1 | 195,704 | 177,505 | 2,442,321 |
| Tested positive | 5,171 | 5,855 | 32,329 |
| Pillar 2 | 398,913 | 411,390 | 5,211,697 |
| Tested positive | 27,761 | 45,620 | 174,488 |
| Total | 594,617 | 588,895 | 7,654,018 |
| Tested positive | 32,932 | 51,475 | 206,817 |
Annex table 2: time taken from receipt of the test by a laboratory to the time the result is published, pillar 1, England
| 17 Sept to 23 Sept: number of tests (percentage) | 24 Sept to 30 Sept: number of tests (percentage) | Since Test and Trace launched. 9 July to 30 Sept: number of tests (percentage) | |
|---|---|---|---|
| Total tests conducted in pillar 1 | 405,644 | 393,028 | 3,807,463 |
| Number of tests completed within 24 hours turnaround | 341,540 (84.2%) | 340,993 (86.8%) | 3,370,724 (88.5%) |
| Number of tests exceeding 24 hours turnaround | 64,104 (15.8%) | 52,035 (13.2%) | 436,739 (11.5%) |
Annex table 3: median time from taking a test to receiving test results, pillar 2 by route, England
| 17 Sept to 23 Sept: median time (hours) | 24 Sept to 30 Sept: median time (hours) | Since Test and Trace launched. 28 May to 30 Sept: median time (hours) | |
|---|---|---|---|
| Regional test sites | 25 | 29 | 22 |
| Local test sites | 29 | 31 | 29 |
| Mobile testing units | 26 | 27 | 22 |
| Satellite test centres | 68 | 59 | 66 |
| Home testing kits | 57 | 61 | 57 |
Annex table 4: total number of tests results processed in pillar 2[footnote 15], by route, England
| 17 Sept to 23 Sept: number of tests | 24 Sept to 30 Sept: number of tests | 28 May to 30 Sept: number of tests | |
|---|---|---|---|
| Regional test sites | 90,521 | 98,416 | 1,963,078 |
| Local test sites | 159,802 | 176,724 | 769,630 |
| Mobile testing units | 121,085 | 130,620 | 1,591,484 |
| Satellite test centres | 409,963 | 429,969 | 3,548,263 |
| Home testing kits | 115,293 | 137,697 | 1,870,562 |
| All routes | 896,664 | 973,426 | 9,743,017 |
Annex table 5: median distance travelled to take a test in-person, pillar 2 by route, England
| 17 Sept to 23 Sept: median distance (miles) | 24 Sept to 30 Sept: median distance (miles) | Since Test and Trace launched. 28 May to 30 Sept: median distance (miles) | |
|---|---|---|---|
| Regional test sites | 7.7 | 6.3 | 5.6 |
| Local test sites | 2.4 | 2.2 | 2.4 |
| Mobile testing units | 6.7 | 4.7 | 4.4 |
| All in-person routes | 4.3 | 3.7 | 4.5 |
Annex table 6: people transferred to the contact tracing system who were reached and asked to provide details of recent close contacts, by whether they provided details for contacts or not, England (includes both complex and non-complex cases)
| 17 Sept to 23 Sept: number of people (percentage) | 24 Sept to 30 Sept: number of people (percentage) | Since Test and Trace launched. 28 May to 30 Sept: number of people (percentage) | |
|---|---|---|---|
| People who provided details of one or more close contacts | 18,249 (84.2%) | 21,403 (83.8%) | 112,942 (79.2%) |
| People who were not able to give any recent close contacts | 3,426 (15.8%) | 4,128 (16.2%) | 29,617 (20.8%) |
| Total | 21,675 | 25,531 | 142,559 |
Annex table 7: people who were reached and asked to provide details about recent close contacts by time taken from case being transferred, England (excludes complex cases)
| 17 Sept to 23 Sept: number of people (percentage) | 24 Sept to 30 Sept: number of people (percentage) | Since Test and Trace launched. 28 May to 30 Sept: number of people (percentage) | |
|---|---|---|---|
| Within 24 hours | 13,186 (63.1%) | 14,265 (57.8%) | 89,640 (68.3%) |
| Between 24 and 48 hours | 3,964 (19.0%) | 6,137 (24.9%) | 25,669 (19.6%) |
| Between 48 and 72 hours | 529 (2.5%) | 1,657 (6.7%) | 5,239 (4.0%) |
| After 72 hours | 3,229 (15.4%) | 2,605 (10.6%) | 10,682 (8.1%) |
| Total | 20,908 | 24,664 | 131,230 |
Annex table 8: number of people identified as recent close contacts by whether they were reached and asked to self-isolate, England (includes both complex and non-complex contacts)
| 17 Sept to 23 Sept: number of people (percentage) | 24 Sept to 30 Sept: number of people (percentage) | Since Test and Trace launched. 28 May to 30 Sept: number of people (percentage) | |
|---|---|---|---|
| Total number of close contacts identified | 92,068 | 101,782 | 719,082 |
| Close contacts reached and asked to self-isolate | 66,726 (72.5%) | 69,815 (68.6%) | 546,806 (76.0%) |
| Close contacts not reached | 25,342 (27.5%) | 31,967 (31.4%) | 172,276 (24.0%) |
| Total number of close contacts identified from non-complex cases | 68,573 | 83,517 | 428,261 |
| Close contacts reached and asked to self-isolate | 44,177 (64.4%) | 52,084 (62.4%) | 262,968 (61.4%) |
| Close contacts not reached | 11,678 (17.0%) | 14,548 (17.4%) | 84,024 (19.6%) |
| Communication details not provided | 12,718 (18.5%) | 16,885 (20.2%) | 81,269 (19.0%) |
| Total number of complex close contacts | 23,495 | 18,265 | 290,821 |
| Close contacts reached and asked to self-isolate | 22,549 (96.0%) | 17,731 (97.1%) | 283,838 (97.6%) |
| Close contacts not reached | 946 (4.0%) | 534 (2.9%) | 6,983 (2.4%) |
Annex table 9: number of recent close non-complex contacts by whether they were from the same household as the case that they were identified from, England
| 17 Sept to 23 Sept: number of people (percentage) | 24 Sept to 30 Sept: number of people (percentage) | Since Test and Trace launched. 28 May to 30 Sept: number of people (percentage) | |
|---|---|---|---|
| Total number non-complex household contacts | 41,707 | 55,038 | 270,298 |
| Close contacts reached and asked to self-isolate | 25,388 (60.9%) | 33,013 (60.0%) | 156,895 (58.0%) |
| Close contacts not reached | 16,319 (39.1%) | 22,025 (40.0%) | 113,403 (42.0%) |
| Total number non-complex not household contacts | 26,866 | 28,479 | 157,963 |
| Close contacts reached and asked to self-isolate | 18,789 (69.9%) | 19,071 (67.0%) | 106,073 (67.2%) |
| Close contacts not reached | 8,077 (30.1%) | 9,408 (33.0%) | 51,890 (32.8%) |
Annex table 10: number of close contacts who were advised to self-isolate by time taken to reach them, England (excludes complex contacts)
| 17 Sept to 23 Sept: number of people (percentage) | 24 Sept to 30 Sept: number of people (percentage) | Since Test and Trace launched. 28 May to 30 Sept: number of people (percentage) | |
|---|---|---|---|
| Within 24 hours | 35,833 (81.1%) | 34,980 (67.2%) | 207,807 (79.0%) |
| Between 24 and 48 hours | 7,102 (16.1%) | 13,445 (25.8%) | 44,337 (16.9%) |
| Between 48 and 72 hours | 883 (2.0%) | 2,800 (5.4%) | 7,823 (3.0%) |
| After 72 hours | 359 (0.8%) | 859 (1.6%) | 2,923 (1.1%) |
| Total | 44,177 | 52,084 | 262,890 |
Annex table 11: number of close contacts who were advised to self-isolate by time taken from the case that reports them being transferred to the contact tracing system, England (excludes complex contacts)
| 17 Sept to 23 Sept: number of people (percentage) | 24 Sept to 30 Sept: number of people (percentage) | Since Test and Trace launched. 28 May to 30 Sept: number of people (percentage) | |
|---|---|---|---|
| Within 24 hours | 23,058 (52.4%) | 21,455 (41.4%) | 133,821 (51.2%) |
| Between 24 and 48 hours | 13,433 (30.5%) | 14,915 (28.8%) | 76,321 (29.2%) |
| Between 48 and 72 hours | 3,708 (8.4%) | 7,501 (14.5%) | 27,272 (10.4%) |
| After 72 hours | 3,774 (8.6%) | 7,899 (15.3%) | 23,910 (9.1%) |
| Total | 43,973 | 51,770 | 261,324 |
Annex B: historical back series of cases and contacts reached by phone and online
Annex table 12: number of non-complex cases reached by phone or online[footnote 16]
| Total number of non-complex cases reached | Number of non-complex cases reached by phone (percentage) | Number of non-complex cases reached online (percentage) | |
|---|---|---|---|
| 28/05/20 to 03/06/20 | 4,252 | 2,805 (66.0%) | 1,447 (34.0%) |
| 04/06/20 to 10/06/20 | 3,446 | 2,354 (68.3%) | 1,092 (31.7%) |
| 11/06/20 to 17/06/20 | 4,306 | 2,702 (62.7%) | 1,604 (37.3%) |
| 18/06/20 to 24/06/20 | 4,187 | 2,647 (63.2%) | 1,540 (36.8%) |
| 25/06/20 to 01/07/20 | 2,984 | 1,915 (64.2%) | 1,069 (35.8%) |
| 02/07/20 to 08/07/20 | 2,556 | 1,545 (60.4%) | 1,011 (39.6%) |
| 09/07/20 to 15/07/20 | 2,885 | 1,607 (55.7%) | 1,278 (44.3%) |
| 16/07/20 to 22/07/20 | 3,254 | 1,975 (60.7%) | 1,279 (39.3%) |
| 23/07/20 to 29/07/20 | 3,467 | 2,060 (59.4%) | 1,407 (40.6%) |
| 30/07/20 to 05/08/20 | 3,685 | 2,180 (59.2%) | 1,505 (40.8%) |
| 06/08/20 to 12/08/20 | 3,482 | 2,189 (62.9%) | 1,293 (37.1%) |
| 13/08/20 to 19/08/20 | 5,405 | 3,572 (66.1%) | 1,833 (33.9%) |
| 20/08/20 to 26/08/20 | 5,985 | 3,754 (62.7%) | 2,231 (37.3%) |
| 27/08/20 to 02/09/20 | 7,098 | 4,303 (60.6%) | 2,795 (39.4%) |
| 03/09/20 to 09/09/20 | 12,359 | 7,470 (60.4%) | 4,889 (39.6%) |
| 10/09/20 to 16/09/20 | 16,147 | 10,066 (62.3%) | 6,081 (37.7%) |
| 17/09/20 to 23/09/20 | 20,718 | 12,385 (59.8%) | 8,333 (40.2%) |
| 24/09/20 to 30/09/20 | 24,639 | 16,283 (66.1%) | 8,356 (33.9%) |
| Total since Test and Trace launched | 130,855 | 81,812 (62.5%) | 49,043 (37.5%) |
Annex table 13: number of non-complex contacts reached by phone or online[footnote 16]
| Total number of non-complex contacts reached | Number of non-complex contacts reached by phone (percentage) | Number of non-complex contacts reached online (percentage) | |
|---|---|---|---|
| 28/05/20 to 03/06/20 | 5,284 | 2,663 (50.4%) | 2,621 (49.6%) |
| 04/06/20 to 10/06/20 | 4,716 | 2,560 (54.3%) | 2,156 (45.7%) |
| 11/06/20 to 17/06/20 | 5,782 | 3,181 (55.0%) | 2,601 (45.0%) |
| 18/06/20 to 24/06/20 | 6,332 | 3,395 (53.6%) | 2,937 (46.4%) |
| 25/06/20 to 01/07/20 | 4,938 | 2,693 (54.5%) | 2,245 (45.5%) |
| 02/07/20 to 08/07/20 | 4,663 | 2,605 (55.9%) | 2,058 (44.1%) |
| 09/07/20 to 15/07/20 | 5,694 | 2,976 (52.3%) | 2,718 (47.7%) |
| 16/07/20 to 22/07/20 | 6,564 | 3,545 (54.0%) | 3,019 (46.0%) |
| 23/07/20 to 29/07/20 | 7,474 | 3,912 (52.3%) | 3,562 (47.7%) |
| 30/07/20 to 05/08/20 | 7,782 | 4,100 (52.7%) | 3,682 (47.3%) |
| 06/08/20 to 12/08/20 | 6,432 | 3,673 (57.1%) | 2,759 (42.9%) |
| 13/08/20 to 19/08/20 | 8,787 | 4,584 (52.2%) | 4,203 (47.8%) |
| 20/08/20 to 26/08/20 | 14,002 | 7,429 (53.1%) | 6,573 (46.9%) |
| 27/08/20 to 02/09/20 | 15,429 | 7,834 (50.8%) | 7,595 (49.2%) |
| 03/09/20 to 09/09/20 | 27,922 | 13,825 (49.5%) | 14,097 (50.5%) |
| 10/09/20 to 16/09/20 | 34,801 | 17,168 (49.3%) | 17,633 (50.7%) |
| 17/09/20 to 23/09/20 | 44,177 | 22,141 (50.1%) | 22,036 (49.9%) |
| 24/09/20 to 30/09/20 | 52,081 | 27,764 (53.3%) | 24,317 (46.7%) |
| Total since Test and Trace launched | 262,860 | 136,048 (51.8%) | 126,812 (48.2%) |
-
For information on how people newly tested and newly testing positive is measured see the NHS Test and Trace statistics methodology. ↩ ↩2
-
Based on the median turnaround time for in-person tests. ↩
-
Swab testing is testing to see if someone has COVID-19, see the terminology section for more information. ↩
-
Approximately 8% of affected cases ↩
-
Includes a small number of people who had a test under pillar 4 (serology and swab testing for national surveillance). ↩
-
Note that these figures may not always align with other published figures for people tested and people tested positive for COVID-19 under pillars 1 and 2 due to the timing of data cuts. ↩
-
For all measures of time taken to receive a COVID-19 test result, there are a number of tests that were not completed. This covers any test where the results were not communicated, which may be because communication details (for example, phone number or email address) were not provided or were incorrect, or because the test was cancelled or abandoned, or no result was available. It also includes some tests which are still being processed. ↩
-
Previously local test sites were included together with regional test sites but from 17 September have been split out as a separate group ↩ ↩2
-
All positive test results under pillar 1 and pillar 2 should be transferred. In addition, all positive swab test results as part of prevalence studies (pillar 4) are also transferred to Test and Trace. People tested under pillar 3 (serology testing to show if people have antibodies from having had COVID-19) do not have their cases transferred to NHS Test and Trace. ↩
-
If NHS Test and Trace is not able to reach an individual testing positive or if no communication details are available, then it is not always possible to know if the case is complex or non-complex. Therefore, these breakdowns are not available. ↩
-
The regional data uses a different data cut to the main publication therefore cumulative totals will not exactly match. The data is available for the cumulative figures since Test and Trace launched up to the most recent week of reporting. Due to revisions that occur each week one week’s cumulative figures cannot be subtracted from a previous week’s to obtain weekly data by UTLA. ↩ ↩2
-
Timing data does not include non-complex contacts which were subsequently escalated to complex. ↩
-
See more detail in scaling up our testing programmes. ↩
-
Please note the number of test results processed sent out is not the same as the number of people tested, because people may be tested more than once. ↩
-
The total number of non-complex cases reached will not align with the total reported elsewhere in the publication as a small number of cases where the method of contact is unknown are excluded. ↩ ↩2