Chapter 4: health of children in the early years
Published 11 September 2018

© Crown copyright 2018
This publication is licensed under the terms of the Open Government Licence v3.0 except where otherwise stated. To view this licence, visit nationalarchives.gov.uk/doc/open-government-licence/version/3 or write to the Information Policy Team, The National Archives, Kew, London TW9 4DU, or email: psi@nationalarchives.gov.uk.
Where we have identified any third party copyright information you will need to obtain permission from the copyright holders concerned.
This publication is available at https://www.gov.uk/government/publications/health-profile-for-england-2018/chapter-4-health-of-children-in-the-early-years
1. Main messages
What happens during pregnancy and the first few years of life influences physical, cognitive and emotional development in childhood and may have an effect on health and wellbeing outcomes in later life. Overall, child health in England has continued to get better, with many indicators of health and development outcomes showing sustained improvements in recent years.
The percentage of women who smoke throughout pregnancy has fallen over time to 10.8% in the financial year 2017 to 2018. Data from the new Maternity Services Dataset shows that 21% of women were classified as obese during the early stages of pregnancy in December 2017. Smoking and obesity during pregnancy increase the risk of poor outcomes such as stillbirth, low birthweight and infant death, and are important areas for public health action.
There were 3.9 infant deaths per 1,000 live births in England in the period 2014 to 2016. Among babies born at full term, 2.8% had a low birthweight in 2016. Both of these indicators have shown improvement in recent years.
Breastfeeding provides the best nutritional start in life for a baby. In England, 74.5% of all babies received breast milk for their first feed in the financial year 2016 to 2017, but by 6 to 8 weeks this fell to 44.4%.
Teenage pregnancy rates have fallen since the early 2000s, but this still carries a number of risks for both mother and child. The most recent data available showed that younger mothers (under the age of 25), were more likely to smoke during pregnancy and not to breastfeed.
By age 5 years, 22.6% of children were overweight and 23.3% had tooth decay in the academic year 2016 to 2017; both of which are preventable. In addition, 29.3% of children at this age were not ready for school, having not reached expected levels of development. However, although there have been sustained improvements in the percentage of children who had reached a good level of development at age 5 years, considerable inequalities between population groups remain.
In the academic year 2016 to 2017, 34.2% of 10 to 11 year olds in England were overweight or obese, a statistically significant increase over the last eight years, up from 32.6% in the academic year 2008 to 2009. Time series analysis suggests that this percentage is likely to continue to rise in the next few years.
Children who live in more deprived areas were more likely to be exposed to avoidable risks before birth, to get off to a less healthy start from birth and to experience poor outcomes by the time they start school, compared with children who live in less deprived areas. Health inequalities are seen across all indicators presented, including recently published evidence of a social gradient in early child development at age 2 to 2 and a half years, an emerging inequality which is especially noticeable in the development of communication skills.
2. Introduction
Ensuring that everyone gets the best start in life is important for a range of health and well-being outcomes for children and young people, the implications of which persist into adulthood [footnote 1] [footnote 2] [footnote 3]. This is influenced by background demographic factors such as the age and ethnicity of the mother, as well as socioeconomic factors including educational status and economic prosperity. A mother’s general health is also important, as are her lifestyle choices leading up to and during pregnancy.
Many factors contribute to achieving the best start in life. This chapter covers some of the factors which may be present during pregnancy and early infancy, their effect on early child health, how these are changing over time and how they are distributed among the population. It concentrates on some of the factors which can be changed from a health perspective at policy, practice and individual level. The importance of vaccination in controlling disease, including those in childhood, is not discussed here, it is discussed in Chapter 7.
3. Smoking in pregnancy
Smoking during pregnancy is associated with the foetus growing at a slower rate in the womb and can result in babies being small for gestational age (small given the number of weeks of pregnancy) and having a low birth weight at term. Smoking during pregnancy is also associated with higher rates of stillbirth and infant mortality [footnote 4] [footnote 5] [footnote 6] [footnote 7].
In England, smoking status is routinely recorded at the time of delivery and it is assumed that pregnant women smoking at this stage have smoked throughout their pregnancy. Smoking at the time of delivery has declined in recent years, with 13.6% of women smoking at the time of delivery in the financial year 2010 to 2011, falling to 10.8% in the financial year 2017 to 2018 (Figure 1). The time series analysis forecasting presented suggests that if this trend continues it will reduce to between 8.1% and 10.4% by 2022 to 2023.
This overall percentage of women smoking at time of delivery hides large variations both across the geographic areas of the country and by deprivation of the area in which the individual women live. In the financial year 2016 to 2017, across local authority areas, smoking at the time of delivery ranged from 2.3% to 28.1%, and from 7.2% in the least deprived areas to 12.2% in the most deprived areas
Figure 1: trend in smoking at time of delivery, England, financial year 2010 to 2011 up to 2016 to 2017, forecasts up to financial year 2022 to 2023
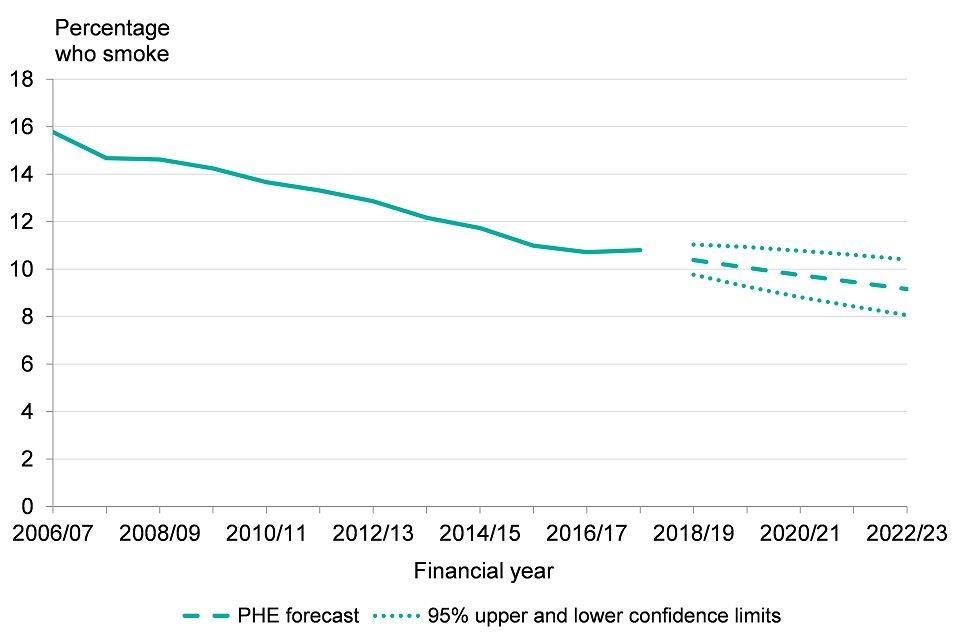
Figure 1: trend in smoking at time of delivery, England, financial year 2010 to 2011 up to 2016 to 2017, forecasts up to financial year 2022 to 2023 [Source: Public health Outcomes Framework]
See Methods, data and definitions
More recently it has also been possible to measure maternal smoking rates at the first antenatal appointment (booking appointment, usually before 13 weeks of pregnancy - see smoking at time of booking). This is reported on a monthly basis by NHS Digital from the Maternity Services Dataset (MSDS) as experimental statistics. Of the women who had their booking appointment during December 2017, 12% were recorded as current smokers.
More detailed analysis of the MSDS [footnote 8] revealed, among those who had their booking appointment during 2016, more than one in 5 women (28%) aged under 25 years smoked at the time of their booking appointment. In addition, rates of smoking at booking in the most deprived areas of England were 5 times those in the least deprived areas (20% and 4% respectively). White women and women of Mixed ethnicity were more likely to smoke than women from other ethnic groups.
This first appointment with midwifery services presents an opportunity to intervene during this early stage of pregnancy, providing carbon monoxide monitoring, information on healthy pregnancy, brief advice and a route for onward referral to smoking cessation services [footnote 9].
4. Teenage pregnancy
Early parenthood carries a number of risks for both mother and child. The baby is more likely to have a low birth weight at term and has a higher risk of infant mortality. Due to parenting responsibilities, young mothers are less likely to complete education and may be further economically disadvantaged by a failure to enter employment. Younger mothers are also more likely to smoke during pregnancy than older mothers [footnote 10],[footnote 11].
Figure 2 shows that the rate of teenage conceptions (females aged less than 18 years) has fallen from 34.2 per 1,000 in 2010 to 18.8 per 1,000 in 2016. This has been achieved through a long-term evidence-based teenage pregnancy strategy, delivered with a concerted effort by local government and their health partners [footnote 10] [footnote 11]. Time series analysis suggests that if this trend continues the rate will reduce to between 8.0 and 14.2 per 1,000 by 2023 (Figure 2).
Figure 2: trend in under 18 conception rate, England, 1998 to 2016, forecasts up to 2023
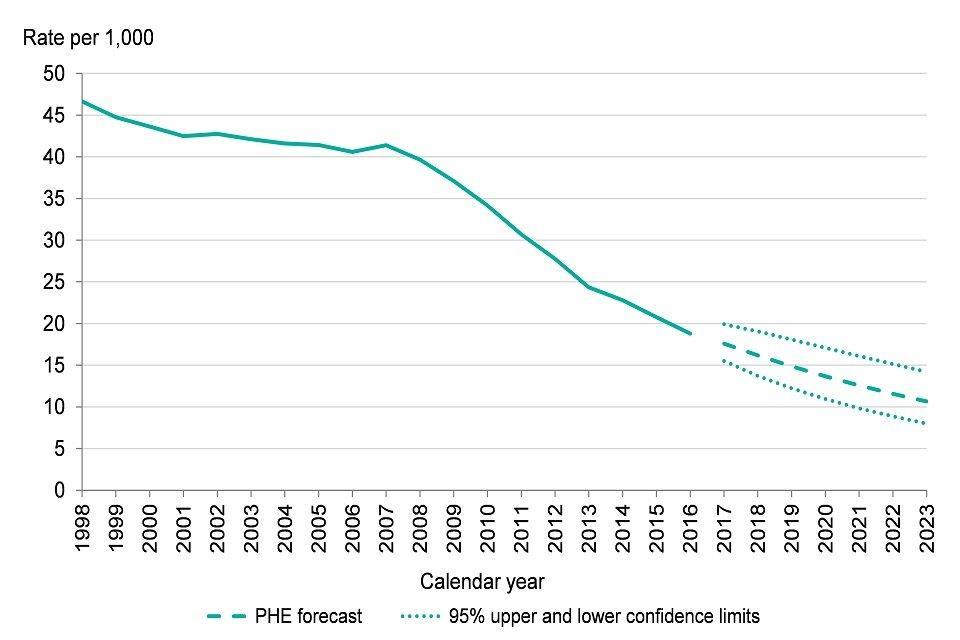
Figure 2: trend in under 18 conception rate, England, 1998 to 2016, forecasts up to 2023 [Source: Public Health Outcomes Framework]
See Methods, data and definitions
In 2016 the local authority teenage conception rates ranged from 4.6 per 1,000 to 36.5, and inequalities by deprivation level ranged from 9.2 per 1,000 in the least deprived areas to 24.9 in the most deprived areas (Figure 3). Teenage pregnancy is more prevalent in areas of higher deprivation.
Figure 3: under 18 conception rates by deprivation decile*, England, 2016
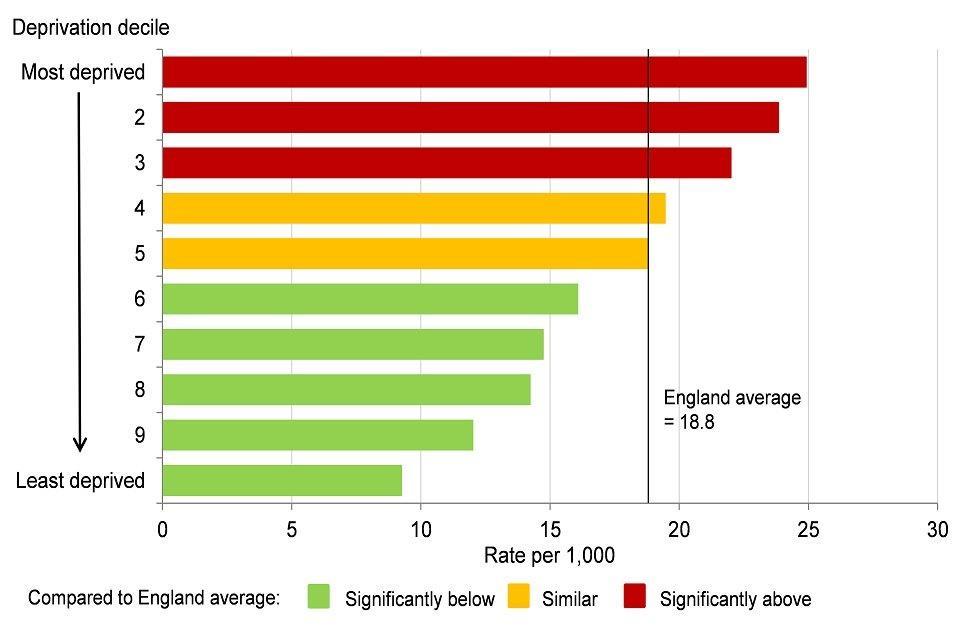
Figure 3: under 18 conception rates by deprivation decile*, England, 2016 [Source: Public Health Outcomes Framework]
*deprivation deciles based on groups of district and unitary authorities in England (Index of Multiple Deprivation 2015)
5. Low birthweight
Low birthweight at full term of pregnancy is an important public health measure as it indicates whether the baby was able to grow as expected while in the womb. Considering only those babies which reach full term enables the pregnancy outcome to be considered, irrespective of prematurity and pre-term birth, which would otherwise dominate these statistics. Low birthweight can be associated with the ethnicity of mothers, smoking during pregnancy, younger maternal age and some medical complications such as maternal diabetes or hypertension (more prevalent at older maternal ages) [footnote 2],[footnote 4],[footnote 10]. Being born at low birthweight is an important marker along the trajectory of early child development, indicating an increased risk of poor health outcomes from birth onwards [footnote 1],[footnote 2]. The percentage of low birthweight babies at term in England has fallen slightly from 3.1% in 2005 to 2.8% in 2016 (Figure 4).
Figure 4: trend in percentage of low birthweight babies at term, England, 2005 to 2016
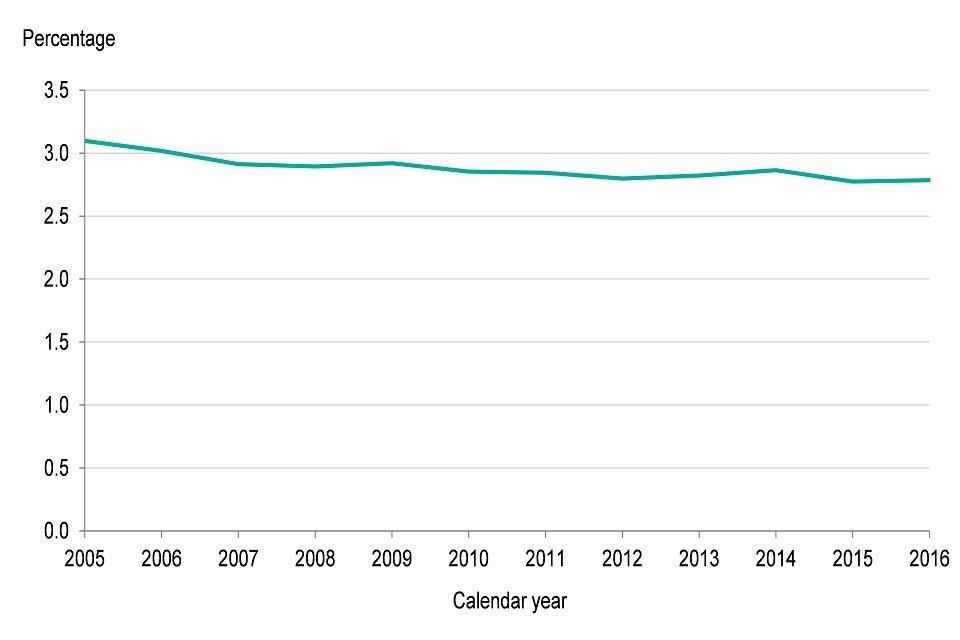
Figure 4: trend in percentage of low birthweight babies at term, England, 2005 to 2016 [Source: Public Health Outcomes Framework]
See Methods, data and definitions
At a local authority level, low birthweight at term ranged from 1.3% to 5.2% in 2016. In addition, there are wide inequalities by deprivation, the values ranged from 2.0% in the least deprived areas to 3.9% in the most deprived areas in 2014 to 2016 (see Figure 5). Chapter 5 discusses recent trends in inequalities in low birthweight.
Figure 5: percentage of low birthweight babies at term by deprivation decile*, England, 2014 to 2016
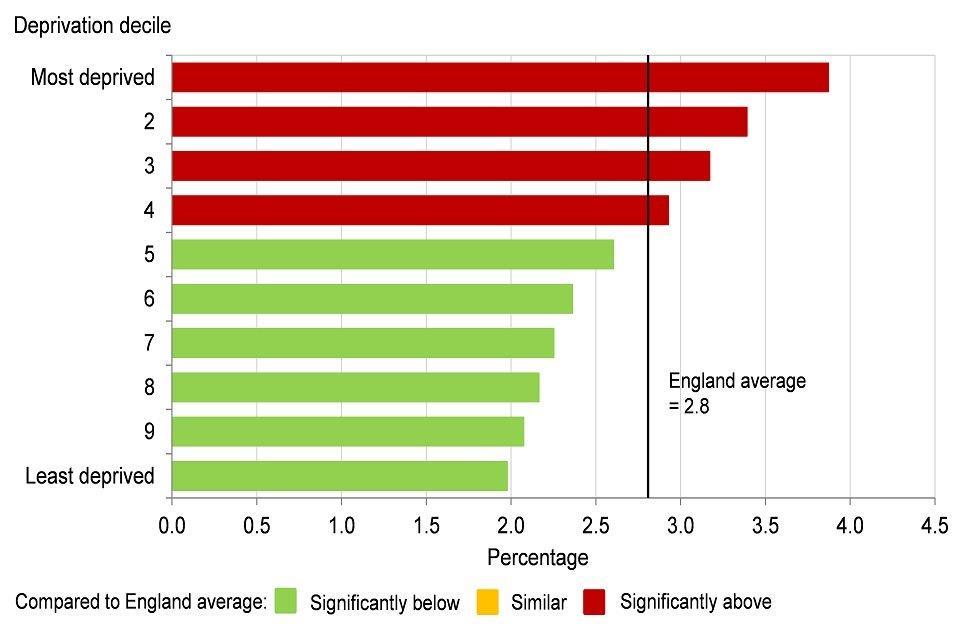
Figure 5: percentage of low birthweight babies at term by deprivation decile*, England, 2014 to 2016 [Source: Public Health England analysis based on birth and population data from ONS and the Index of Multiple Deprivation 2015 (Department for Communities and Local Government)]
*deprivation deciles based on groups of lower super output areas in England (Index of Multiple Deprivation 2015).
6. Breastfeeding
Breastfeeding provides the best possible nutritional start in life for a baby, protecting the baby from infection and offering important health benefits for the mother. The government’s advice is that infants should be exclusively breastfed, receiving only breastmilk for the first 6 months of life. Following this, other drinks and foodstuffs can be introduced [footnote 1],[footnote 2],[footnote 12],[footnote 13].
An important precursor for breastfeeding is skin-to-skin contact, which also helps to establish a nurturing bond between mother and baby [footnote 14]. Data published by NHS Digital from the MSDS for maternity services delivered in England during December 2017 shows that of women who gave birth at 37 weeks gestation or later, 80% had skin-to-skin contact with their baby within one hour of birth. It also shows that 75% of babies received maternal or donor breast milk as their first feed, which is a proxy for initiation of breastfeeding.
Many mothers find it challenging to sustain breastfeeding. Data for the financial year 2016 to 2017 show that at 6 to 8 weeks of age the prevalence of either exclusive or partial (when formula milk has also been introduced) breastfeeding of an infant was only 44.4%. When considered at local authority level a very wide variation was observed, the highest rate of breastfeeding at 6 to 8 weeks was 75.6%, almost 4 times higher than the lowest rate of 19.3%
Further information on infant feeding is available from the Infant Feeding Survey which showed that in England in 2010, younger mothers under the age of 25 years, mothers of White ethnicity and those living in deprived areas had a low incidence of breastfeeding.
7. Infant mortality
Infant mortality covers all deaths within the first year of life. The majority of these are neonatal deaths which occur during the first month and the main cause is related to prematurity and preterm birth, followed closely by congenital abnormalities [footnote 15].
In England, the number of infants who die is relatively small and subject to considerable variation from year to year. As a result, the data are often considered on a three-year rolling average basis. The infant mortality rate fell from 5.4 per 1,000 live births in 2001 to 2003 to 3.9 in 2014 to 2016 (Figure 6). However, there was no decline between the latest 2 periods.
There is also wide variation across the country, in 2014 to 2016 the highest rate of 7.9 per 1,000 live births for any local authority area was almost 5 times higher than the lowest rate of 1.6.
Figure 6: trend in infant mortality rate, England, 2001 to 2003 up to 2014 to 2016
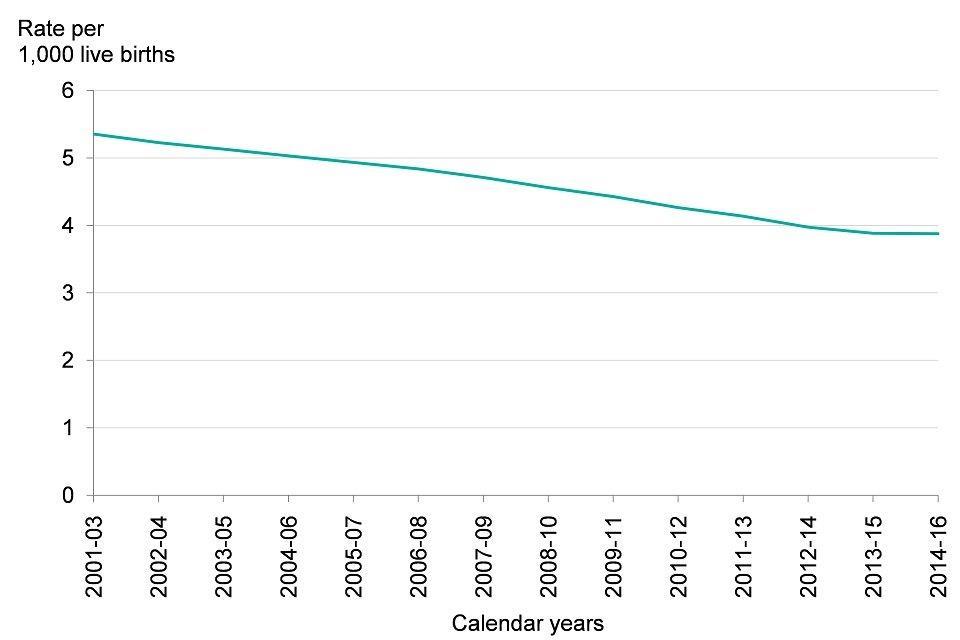
Figure 6: trend in infant mortality rate, England, 2001 to 2003 up to 2014 to 2016 [Source: Public Health Outcomes Framework]
See Methods, data and definitions
Inequalities by deprivation level are also large. The infant mortality rate ranged from 2.8 per 1,000 live births in the least deprived areas to 5.9 in the most deprived areas in 2014 to 2016 (Figure 7). Chapter 5 discusses recent trends in inequalities in infant mortality.
Figure 7: infant mortality rate by deprivation decile*, England, 2014 to 2016
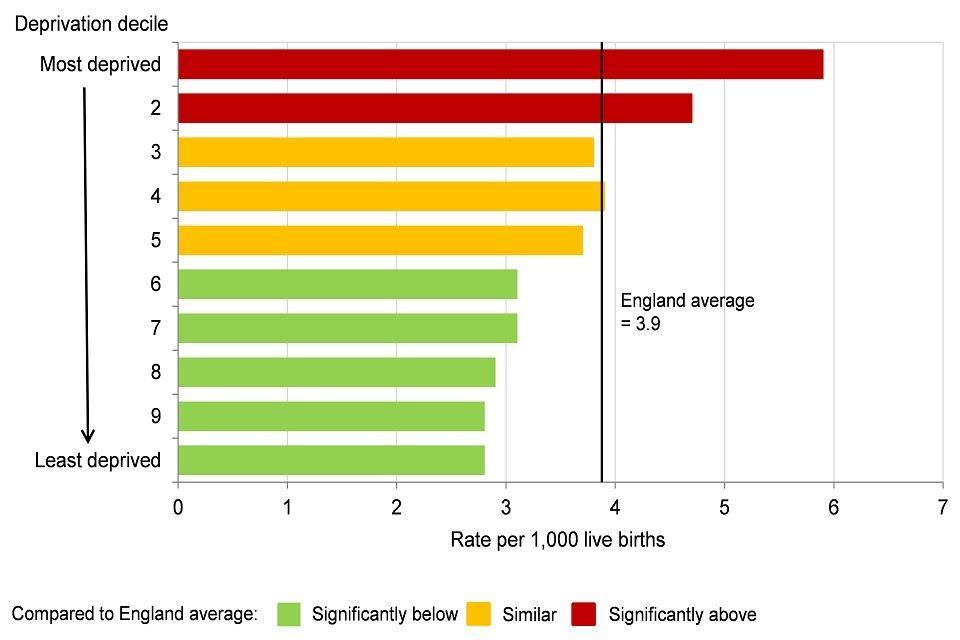
Figure 7: infant mortality rate by deprivation decile*, England, 2014 to 2016 [Source: Analysis by Public Health England based on mortality, births and population data from ONS and the Index of Multiple Deprivation 2015 (DCLG)]
*deprivation deciles based on groups of lower super output areas in England (Index of Multiple Deprivation 2015).
Infant mortality rates are higher in deprived areas. Smoking in pregnancy and adult smoking prevalence is also higher among those living in deprived areas. In addition, there is evidence that smoking in pregnancy harms foetal development, is associated with infant mortality and that smoking, alongside genetic factors, can be relevant to the causal pathway behind deaths as a result of congenital abnormalities [footnote 2],[footnote 4].
8. Child obesity
The Healthy Child Programme provides opportunities for health visitors to assess the healthy growth of infants and children. In England, the height and weight of children (Reception and Year 6) is measured in school settings (and the body mass index [BMI] calculated via the National Child Measurement Programme (NCMP).
In the academic year, 2016 to 2017, 22.6% of 4 and 5 year olds (Reception year children) were either overweight or obese. This level has not changed much in recent years and although the causes are complex not all children have a diet [footnote 16] or undertake physical activity at levels which reflect national recommendations[footnote 17].
Children are more likely to be obese if their mother was obese during the early stages of pregnancy [footnote 18]. In addition, researchers have found increased risk of poor outcomes including stillbirth and infant mortality where maternal obesity is higher [footnote 19],[footnote 20].
Maternal obesity at the first antenatal appointment (booking appointment usually before 13 weeks of pregnancy) is reported on a monthly basis by NHS Digital from the Maternity Services Dataset (MSDS) as experimental statistics. Of the women who had their booking appointment during December 2017, 21% were recorded as obese.
Excess weight (overweight or obese) in 4 to 5 year olds also varies widely between local authorities, it ranged from 15.0% to 28.2% in academic year 2016 to 2017. Like many other indicators relating to early child health, children living in more deprived areas of the country are more likely to have poor outcomes. In the academic year 2016 to 2017, excess weight in 4 to 5 year olds varied from 17.3% in the least deprived areas to 26.8% in the most deprived areas (Figure 8).
Figure 8: excess weight in 4 to 5 year olds by deprivation decile*, England, academic year 2016 to 2017
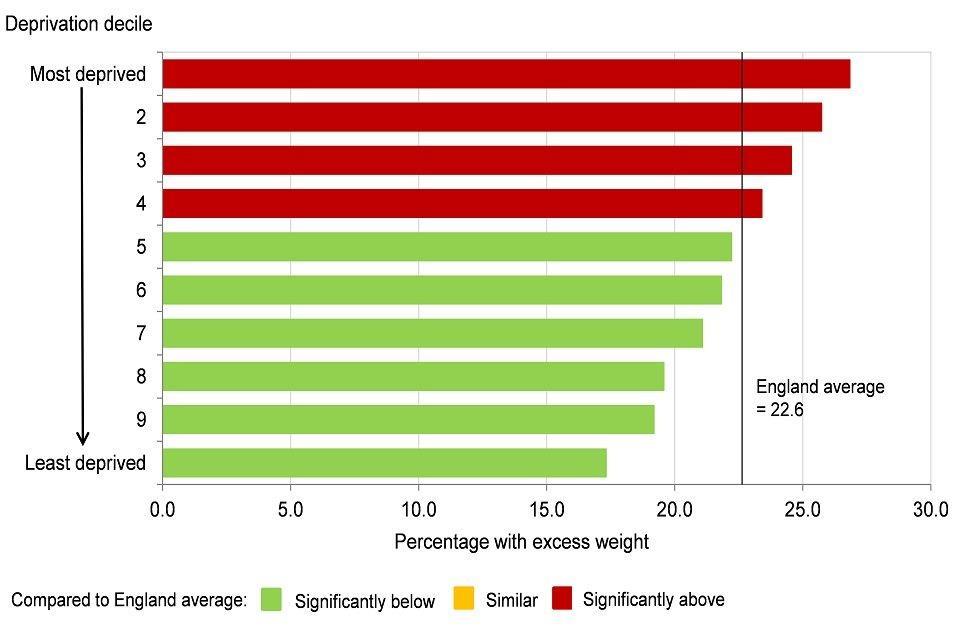
Figure 8: excess weight in 4 to 5 year olds by deprivation decile*, England, academic year 2016 to 2017 [Source: Public Health Outcomes Framework.]
*deprivation deciles based on groups of lower super output areas in England (Index of Multiple Deprivation 2015).
See Methods, data and definitions
Linked data shows that children who were overweight or obese in Reception year (aged 4 and 5 years) were also more likely to be overweight or obese in Year 6 (age 10 to 11 years) and then again more likely to go on to be overweight or obese adults [footnote 21],[footnote 22].
In the academic year 2016 to 2017, 34.2% of 10 to 11 year olds in England were overweight or obese, which was a statistically significant increase over the last 8 years, up from 32.6% in the academic year 2008 to 2009 (Figure 9). Time series analysis suggests that this percentage is likely to continue to rise in the next few years (Figure 9).
Figure 9: trend in excess weight in 10 to 11 year olds, England, academic year 2008 to 2009 up to 2016 to 2017, forecasts up to academic year 2023 to 2023
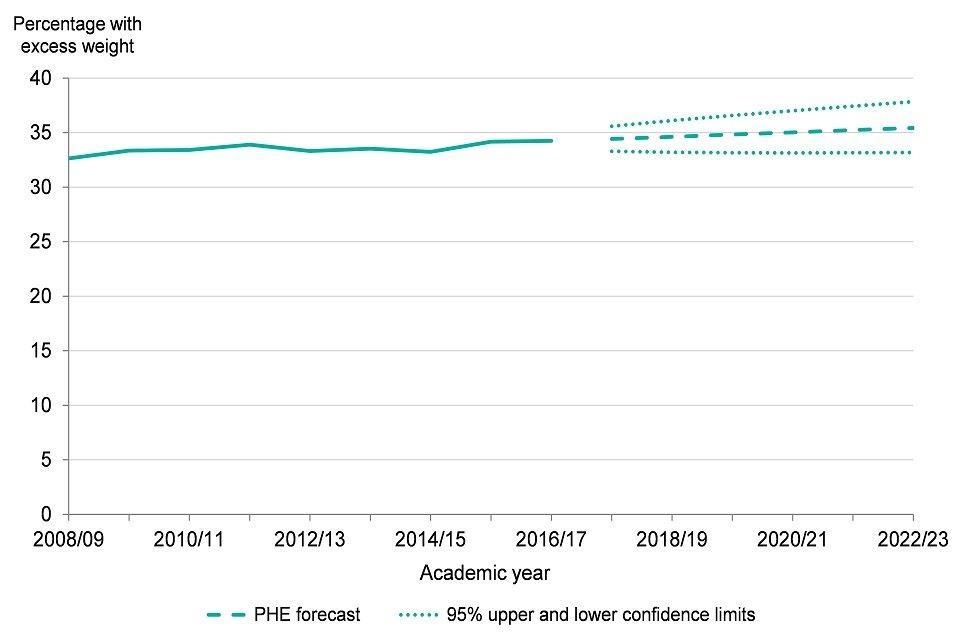
Figure 9: trend in excess weight in 10 to 11 year olds, England, academic year 2008 to 2009 up to 2016 to 2017, forecasts up to academic year 2023 to 2023 [Source: Public Health Outcomes Framework]
See Methods, data and definitions
Excess weight (overweight and obese) in 10 to 11 year olds varies widely between local authorities, it ranged from 25.3% to 43.9% in academic year 2016 to 2017, and also varied by level of deprivation. Excess weight in 10 to 11 year olds ranged from 24.2% in the least deprived areas to 40.9% in the most deprived areas (Figure 10).
See Chapter 5 for information on trends in inequalities in excess weight during childhood and inequalities by ethnic group.
Figure 10: excess weight in 10 to 11 year olds by deprivation decile*, England, academic year 2016 to 2017
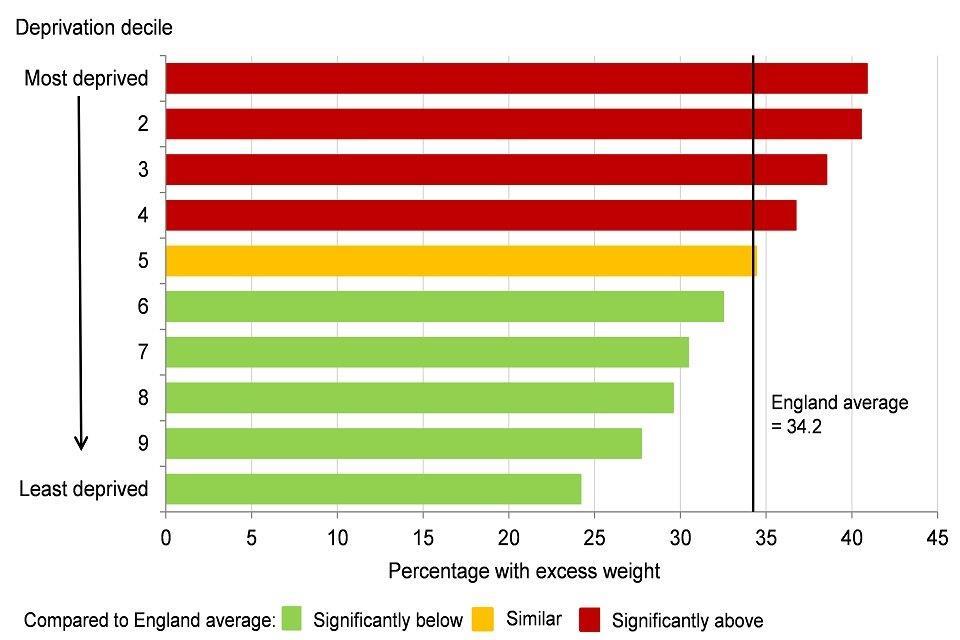
Figure 10: excess weight in 10 to 11 year olds by deprivation decile*, England, academic year 2016 to 2017 [Source: Public Health Outcomes Framework]
*deprivation deciles based on groups of lower super output areas in England (Index of Multiple Deprivation 2015).
See Methods, data and definitions
As discussed in Chapter 3, obesity throughout the life course carries implications for poor health including contributing to higher rates of diabetes, cardiovascular disease, most cancers and therefore a higher risk of premature mortality. See Chapter 3 for further information on adult obesity.
9. Oral health
Current health advice for good oral health includes tooth brushing with fluoride toothpaste twice a day, a visit to the dentist when a child’s first tooth erupts and a healthy diet with limitations on sugary snacks and drinks [footnote 23], [footnote 24]. Fluoridation of water supply which is effective in improving overall dental health and reducing inequalities is also recommended as a population level intervention.
Despite this broad approach, oral health in some groups of children can be poor with the main cause of hospital admissions in young children aged 5 to 9 years being for dental extractions under general anaesthetic [footnote 25]. Data from the oral health survey of 5 year old children for the academic year 2016 to 2017 shows that 76.7% were free from any dental decay, which means that 23.3%, or almost one in every four children, had preventable dental decay [footnote 26].
Again, a wide variation across local authority areas exists, the proportion of 5 years olds without dental decay ranged from 52.9% to 87.1% in the academic year 2016 to 2017. In some local authority areas almost half of all 5 year olds suffer from dental decay when this decay could have been prevented. In the most deprived areas of England 63.7% of 5 year olds were free from dental decay, and this increased to 87.5% in the least deprived areas (Figure 11).
Figure 11: percentage of 5 year old children free from dental decay by deprivation decile*, England, academic year 2016 to 2017

Figure 11: percentage of five year old children free from dental decay by deprivation decile*, England, academic year 2016 to 2017 [Source: Public Health Outcomes Framework]
*deprivation deciles based on groups of lower super output areas in England (Index of Multiple Deprivation 2015).
See Methods, data and definitions
10. School readiness
School readiness is an important marker on the life course trajectory. Measured by applying the early years foundation stage profile (EYFSP) to children in a school setting at the end of the Reception year (age 4 to 5 years). It generates an outcome indicator based on a rounded assessment of physical, behavioural, cognitive and social development. It tells us something about outcomes from a healthy pregnancy, infancy and early childhood, which includes the effectiveness of early years’ services and the opportunity for early intervention [footnote 27]. (See Methods, data and definitions)
Looking forward, school readiness can also be considered as a social determinant of health in that better development at this early age improves a child’s ability to make the most of his or her learning opportunities, achieving higher grades and better employment prospects. These are then associated with economic prosperity and better health outcomes in the longer term [footnote 3] [footnote 28]. Data on school readiness, including trends and inequalities, is discussed in Chapter 6 on the wider determinants of health.
Child development outcomes at the end of the Reception year vary by the sex of the child, when exactly in the school year they were born (noting that some children in Reception can be almost a whole year older than some of their peers when this assessment is undertaken) and whether or not their first language is English [footnote 29]. The trajectory of early child development is now being monitored in more detail with the introduction of an interim indicator of child development outcomes aged 2 to 2 and a half years. This uses the results from the health visitor review undertaken at this age from the Ages and Stages Questionnaire (ASQ-3 TM).
The ASQ-3 TM assessment, which covers the development of gross and fine motor skills, communication, problem solving and personal-social skills, is less sensitive to the exact age of the child as questionnaires are available at 24, 27 and 30 months. Early results and a study into the feasibility of introducing these indicators into the Public Health Outcomes Framework show the same variation with sex of the child as the EYFSP. It also shows that the development outcomes are socially distributed (vary by deprivation) and that this distribution is most noticeable in the development of communication skills [footnote 30],[footnote 31].
These measures are outcome indicators in their own right, measures of the benefits arising from early year’s services and very early intervention in child health, secure bonding between parent and child, managing transition to parenthood and encouraging a rich home learning environment. In addition, the indicators can be placed on a continuum of early child development, as a milestone, which provides a secure foundation and baseline for further development including readiness for school (using the EYFSP at the end of Reception) and ongoing educational attainment.
11. Further information
Public Health England wants to increase the proportion of children ready to learn at age 2 years and ready for school at age 5 years. The resource Health Matters: Giving every child the best start in life for health professionals and local authorities provides further information about investing in early years services from pregnancy to age 2 years.
Further information on the health of children in the early years can be found in the Child and Maternal Health Profiles Information on the wider determinants of health is presented in Chapter 6. More detailed information on trends in inequalities in child health in presented in Chapter 5.
12. References
-
Public Health England (2016) Health Matters: Giving every child the best start in life.. Accessed 15 June 2018. ↩ ↩2 ↩3
-
Department of Health (2013) Annual Report of the Chief Medical Officer 2012: Our children deserve better: prevention pays.. Accessed 18 June 2018. ↩ ↩2 ↩3 ↩4 ↩5
-
Institute of Health Equity (2010) Fair society, healthy lives: The Marmot Review.. Accessed 18 June 2018. ↩ ↩2
-
Bell R et al (2017) Evaluation of a complex healthcare intervention to increases smoking cessation in pregnant women: interrupted time series analysis with economic evaluation. Tobacco Control 0:1-9. ↩ ↩2 ↩3
-
Royal College of Physicians (2010) Passive smoking and children. Chapter 3: Effects of maternal active and passive smoking on fetal and reproductive health. Accessed 15 June 2018. ↩
-
Smoking in Pregnancy Challenge Group (2015) Communication with Women Working Group: Shared key message. Accessed 18 June 2018. ↩
-
Department of Health and Social Care (2017) Towards a smoke-free generation: tobacco control plan for England. ↩
-
Public Health England (2018) Health of women before and during pregnancy: health behaviours, risk factors and inequalities. An initial analysis of the Maternity Services Dataset antenatal booking data. Accessed 27 July 2018. ↩
-
NICE: Public Health guidance (PH26). Smoking: stopping in pregnancy and after childbirth, June 2010. Accessed 4 July 2018. ↩
-
Public Health England (2018) Teenage pregnancy prevention framework. Accessed 18 June 2018. ↩ ↩2 ↩3
-
Hadley A, Ingham R, Chandra-Mouli V (2016) Implementing the United Kingdom’s 10-year teenage pregnancy strategy for England (1999-2010): How was this done and what did it achieve? Reproductive Health 13:139. ↩ ↩2
-
Public Health England (2016) Infant feeding: commissioning services. Accessed 18 June 2018. ↩
-
The Lancet (2016): Breastfeeding series. Accessed 15 June 2018. ↩
-
NICE (2015): Postnatal care up to 8 weeks after birth. Clinical guideline [CG37], updated February 2015. Accessed 18 June 2018. ↩
-
ONS (2018) Statistical bulletin: Child mortality in England and Wales: 2016. Accessed 18 June 2018. ↩
-
Public Health England (2017) The Eatwell Guide. Accessed 21 June 2018. ↩
-
Chief Medical Officer (2011) UK physical activity guidelines. Accessed 21 June 2018. ↩
-
Cabinet Office, Department of Health and Social Care, HM Treasury, and Prime Minister’s Office (2017) Childhood obesity: a plan for action. Accessed 15 June 2018. ↩
-
Sebire NJ and others (2001) Maternal obesity and pregnancy outcome: A study of 287,213 pregnancies in London. International Journal of Obesity 25: 1175 to 1182. ↩
-
Dagfinn Anue MS and others (2014) Maternal body mass index and the risk of fetal death, stillbirth and infant mortality. Journal of American Medical Association 311(15):1536 to 1546. ↩
-
Public Health England (2017) Weight change in primary school aged children. Accessed 15 June 2018. ↩
-
Public Health England (2015) Childhood obesity: applying All Our Health. Accessed 18 June 2018. ↩
-
Public Health England (2017) Health Matters: Child dental health. Accessed 18 June 2018. ↩
-
Public Health England (2014) Delivering better oral health: an evidence-based toolkit for prevention, updated March 2017. Accessed 18 June 2018. ↩
-
Public Health England (2018) Child oral health: applying All Our Health. Accessed 25 May 2018. ↩
-
Public Health England (2018) Oral health survey of 5-year-old children 2017. Accessed 17 May 2018. ↩
-
Standards and Testing Agency (2017) Early years foundation stage profile: 2018 handbook. Accessed 15 June 2018. ↩
-
Social Mobility Commission (2017) State of the Nation 2017: Social Mobility in Great Britain. Accessed 15 June 2018. ↩
-
Department for Education (2017) Early years foundation stage profile results: 2016 to 2017. Accessed 4 July 2018. ↩
-
Public Health England (2018) Child development outcomes at 2 to 2 and a half years: 2017 to 2018. Accessed 18 June 2018. ↩
-
Public Health England (2018) Population surveillance using child development outcome indicators. Accessed 18 June 2018. ↩