Chapter 3: trends in morbidity and risk factors
Published 11 September 2018

© Crown copyright 2018
This publication is licensed under the terms of the Open Government Licence v3.0 except where otherwise stated. To view this licence, visit nationalarchives.gov.uk/doc/open-government-licence/version/3 or write to the Information Policy Team, The National Archives, Kew, London TW9 4DU, or email: psi@nationalarchives.gov.uk.
Where we have identified any third party copyright information you will need to obtain permission from the copyright holders concerned.
This publication is available at https://www.gov.uk/government/publications/health-profile-for-england-2018/chapter-3-trends-in-morbidity-and-risk-factors
1. Main messages
Overall population health in England has improved in recent decades. The age-standardised morbidity rate in England (rate of ill health), reduced by 2.1% between 1990 and 2016.
Older people experience higher rates of morbidity than younger people. In 2016, people aged in their 80s had almost twice the morbidity rate of people in their 60s, who had almost twice that of people in their 20s. However, age-specific morbidity rates decreased for all age groups between 1990 and 2016. The largest reductions were for those aged 70 to 89 years.
The population has been increasing and ageing (Chapter 1), so despite the population being healthier at every age group, the total burden of morbidity has increased between 1990 and 2016.
Musculoskeletal (MSK) conditions, mental and substance use disorders, and a group of other non-communicable diseases (skin diseases, oral disorders, hearing and sight loss) accounted for over 60% of the total morbidity burden in 2016. Low back and neck pain and skin diseases (mainly dermatitis, acne and psoriasis) remained the two leading specific causes, for both males and females.
Having any long-term health condition can reduce quality of life, and those with a long-term MSK condition or a long-term mental health condition had the lowest quality of life scores in financial year 2016 to 2017. In addition, mental and physical health conditions are closely linked, people with long-term MSK conditions were almost twice as likely to report feeling anxious or depressed on a given day than the general population (24.1% compared with 13.7%).
In 2014, it is estimated that 18.9% of adults aged 16 to 64 years in England had at least one common mental health disorder (CMD), which includes depression and anxiety. Since 1993, the prevalence of CMDs in England have increased.
As the population continues to age, the number of people with many chronic conditions is expected to increase. For example, the number of people with diabetes, is expected to increase in the next two decades from 3.9 million people in 2017 to 4.9 million in 2035. Obesity is a major risk factor for diabetes and this number will increase further if the prevalence of obesity also increases.
In 2016, obesity and smoking were the leading risk factors for morbidity. These are associated with many of the common causes of morbidity including cardiovascular disease, MSK conditions, respiratory diseases, diabetes and most cancers.
The prevalence of many risk factors among adults, including smoking, illicit drug use, high blood pressure and high cholesterol have continued to decline. The prevalence of smoking in adults has declined from 19.9% to 14.9% in the last 7 years and time series analysis suggests that, if this trend continues, it will reduce to between 8.5% and 11.7% by 2023. However, the trends in other risk factors have been less favourable; there has been a slight upward trend in obesity since 2007.
2. Introduction
Chapter 1 shows that, in England, life expectancy has generally increased in recent decades and has reached 79.6 years for males and 83.2 years for females. It also shows that, at the same time, the population has been ageing. In England in 2017, the proportion of the population aged 85 years and over was 2.7 times greater than it was in 1971.
More recently there has been little change in healthy life expectancy (the number of years spent in good health) (Chapter 1). Therefore, as people live longer, the years spent in poor health have increased. However, data on healthy life expectancy do not give an indication of the severity of poor health or the types of conditions that are prevalent in each age group.
This chapter provides an update on data included in the Health Profile for England 2017 but also examines some leading causes of morbidity, including musculoskeletal (MSK) conditions, mental health and diabetes in more detail. It draws on data from the Global Burden of Disease study 2016 (GBD) and other sources.
This chapter also reports on the leading risk factors associated with morbidity and trends in these over time.
3. Trends in the burden of morbidity
Years lived with disability (YLDs) is a measure of morbidity used in the Global Burden of Disease study (GBD) that combines the prevalence of each disease with a rating of the severity of its symptoms (excluding death itself), to give an overall measure of the loss of quality of life. Condition specific morbidity data is reported in this chapter for both broad conditions (level 2 disease groups), and more specific conditions (level 3 disease groups).
Further information on how YLDs are calculated and the disease hierarchy levels can be found in the Methods, data and definitions section.
The total burden of morbidity, measured by the total number of YLDs in the population in a given year, increased by over a sixth between 1990 and 2016, from around 6 million to over 7 million.
However, after adjusting for population size and age, the age-standardised rate of morbidity has reduced by 2.1% (Figure 1). This indicates that the increase in the total burden of morbidity is accounted for by increases in population size and population ageing.
Similar trends were seen for males and females. The age-standardised rate for males during this period decreased by 2.3% compared with 2.1% for females. In general, the overall morbidity burden for males was lower than for females (Figure 1).
Figure 1: trend in the age-standardised morbidity rate, England, 1990 to 2016
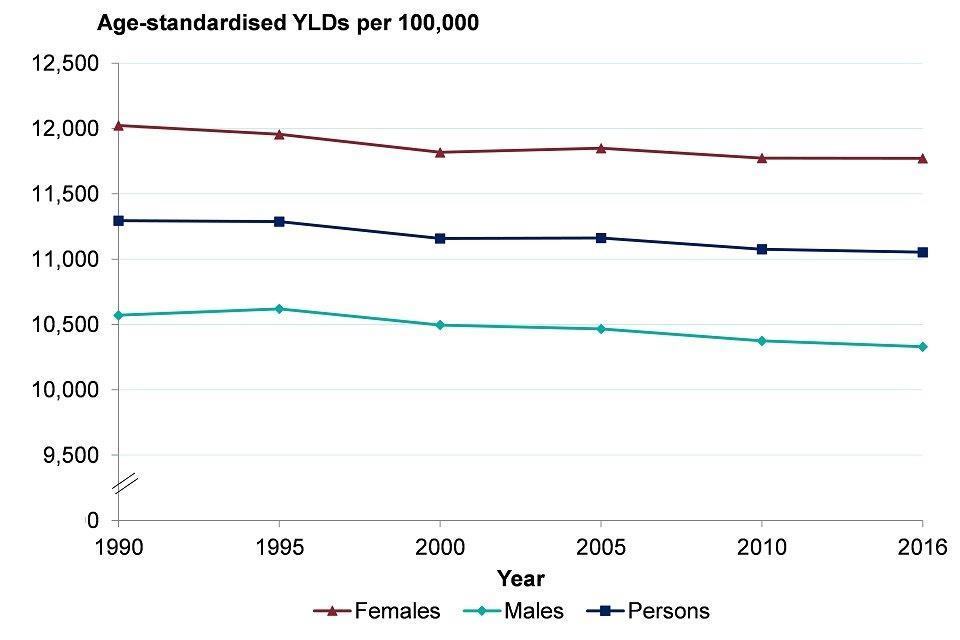
Figure 1: trend in the age-standardised morbidity rate, England, 1990 to 2016 [Source: Global Burden of Disease Study 2016 (GBD 2016) Results. Seattle, United States: Institute for Health Metrics and Evaluation (IHME), 2016]
4. Trends in morbidity by disease group
As reported in the Health Profile for England 2017, there has been little change in the leading causes of morbidity in recent years. MSK conditions, mental and substance use disorders and a group of other non-communicable diseases still make up the 3 largest broad groups (level 2) of conditions. Together, these 3 broad groups contributed over 60% of total YLD burden in 2016. This percentage contribution has been consistent since 1990.
MSK conditions include low back and neck pain, osteoarthritis and rheumatoid arthritis and by themselves, they account for 22.1% of the YLD burden. These MSK causes of morbidity are often long-term debilitating conditions that individuals live with and manage for many years. MSK conditions are discussed in further detail later in this chapter.
Mental health and substance disorders include anxiety and depression, and alcohol and drug misuse. These account for 21.3% of the YLD burden. Mental health is discussed in further detail later in this chapter.
Other non-communicable diseases include skin diseases, oral problems and sense organ diseases such as hearing and sight loss. These account for 19.7% of the YLD burden. The specific condition contributing most to this category was age-related hearing loss, which contributes 3.6% of the total YLD burden and has increased by 9.4% between 1990 and 2016.
Figure 2 shows the top 15 specific conditions (level 3) in 2016. The top 15 conditions in GBD 2013, reported in the Health Profile for England 2017, were different, for both males and females. These differences are mostly due to changes in methods used between the GBD 2013 and the GBD 2016 study, rather than real changes in the leading causes of morbidity over 3 years.
In 2016, just over 70% of all morbidity was accounted for by the top 15 specific conditions (level 3). Low back and neck pain was the leading cause of level 3 morbidity for males and females. It accounted for more than one and half times the morbidity of skin diseases, the second placed condition for both sexes (Figure 2).
Figure 2: age-standardised morbidity rate for leading causes of morbidity (level 3 disease groups), males and females, England, 1990 and 2016
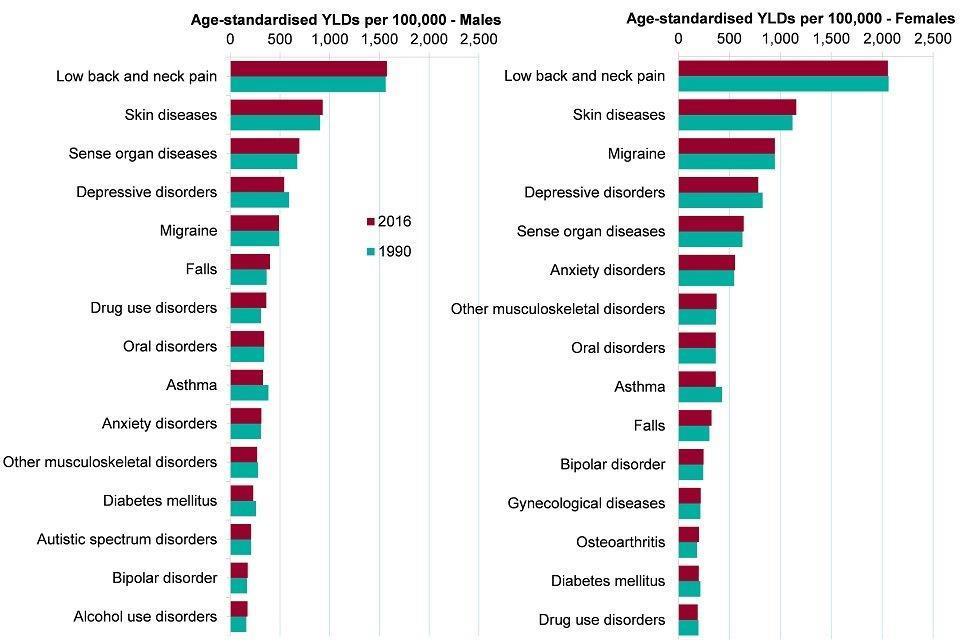
Figure 2: age-standardised morbidity rate for leading causes of morbidity (level 3 disease groups), males and females, England, 1990 and 2016 [Source: Global Burden of Disease Study 2016 (GBD 2016) Results. Seattle, United States: Institute for Health Metrics and Evaluation (IHME), 2016]
Among the leading causes of morbidity in 2016 (both sexes combined), the largest percentage increases in morbidity were seen in falls (7.2%), as well as an increase in drug use disorders (8.8%). During the same period from 1990 to 2016 the morbidity due to asthma declined by 14.5%.
Although not among the top 15 specific causes of morbidity, there were large decreases in the morbidity burden of ischaemic heart disease (over 45% reduction) and almost a 20% reduction in stroke between 1990 and 2016. This is consistent with the large decline in mortality from these causes (Chapter 2). Cardiovascular conditions accounted for 4.4% of the overall YLD burden in 2016, compared with 6.2% in 1990.
Road traffic accident morbidity burden has also decreased by 22.1% over the same time period. This decrease is related to a reduction in reported road casualties.
Although communicable diseases accounted for less than 5% of the total morbidity burden in 2016, there have been some changes over time. Morbidity from HIV has increased from 3.4 YLDs per 100,000 in 1990 to 16.9, a fourfold increase. The morbidity burden from tuberculosis has reduced by 29% from 2.6 YLDs per 100,000 to 1.8 in 2016. For more information on infectious diseases see Chapter 7.
5. Trends in morbidity by age
The population age-specific morbidity rate (YLDs per 100,000 population) increases steadily from birth through to the middle age groups, and then more rapidly into the older age groups. The morbidity rate for those in their late 80s in 2016 was almost double that of those in their early 60s (Figure 3). Age-specific morbidity rates decreased for all age groups between 1990 and 2016, but the largest reductions were for those aged 70 to 89 years.
Figure 3: age-specific morbidity rate, persons, England 1990 and 2016
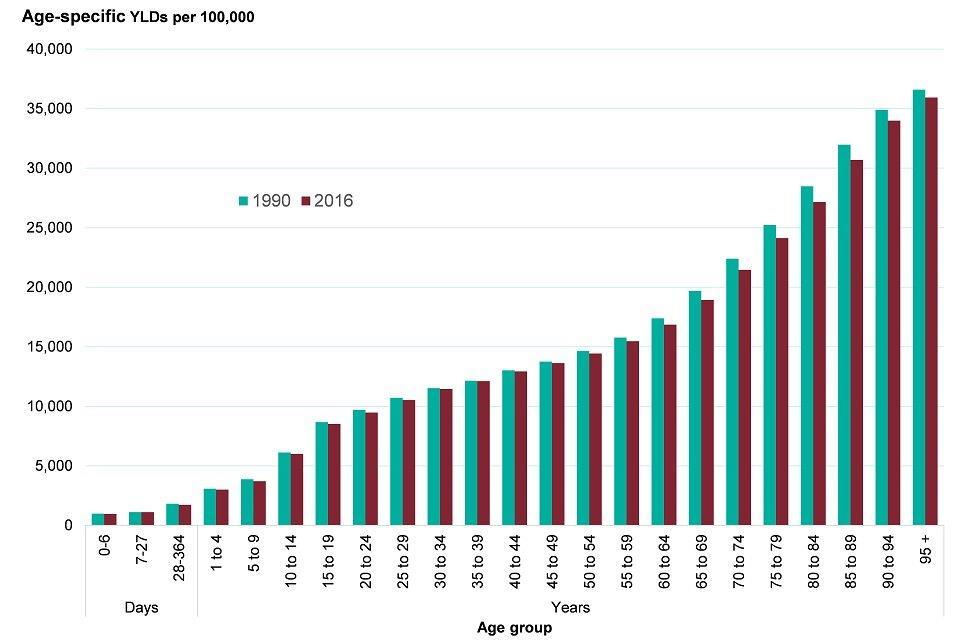
Figure 3: age-specific morbidity rate, persons, England 1990 and 2016 [Source: Global Burden of Disease Study 2016 (GBD 2016) Results. Seattle, United States: Institute for Health Metrics and Evaluation (IHME), 2016]
This age pattern reflects the fact that morbidity from many diseases increases with age, in particular, cardiovascular disease, neurological diseases (including Alzheimer’s and other dementias), and diabetes (Figure 4). The figure shows no increase in morbidity from MSK conditions after age 70 to 74 years. Some MSK conditions (level 3 - such as low back pain) increase with age, peak around age 75 to 79 years, then decline, while osteoarthritis continues to increase with age[footnote 1].
Mental health and substance use disorders have a different pattern, as the greatest burden is in the younger ages. These conditions have the largest burden of morbidity in people between the ages of 15 and 39 years. They account for more than a third of all morbidity burden in the population between the ages of 15 and 29 years (Figure 4).
Figure 4: morbidity rate by age and top 8 broad causes (level 2 disease groups), persons, England, 2016
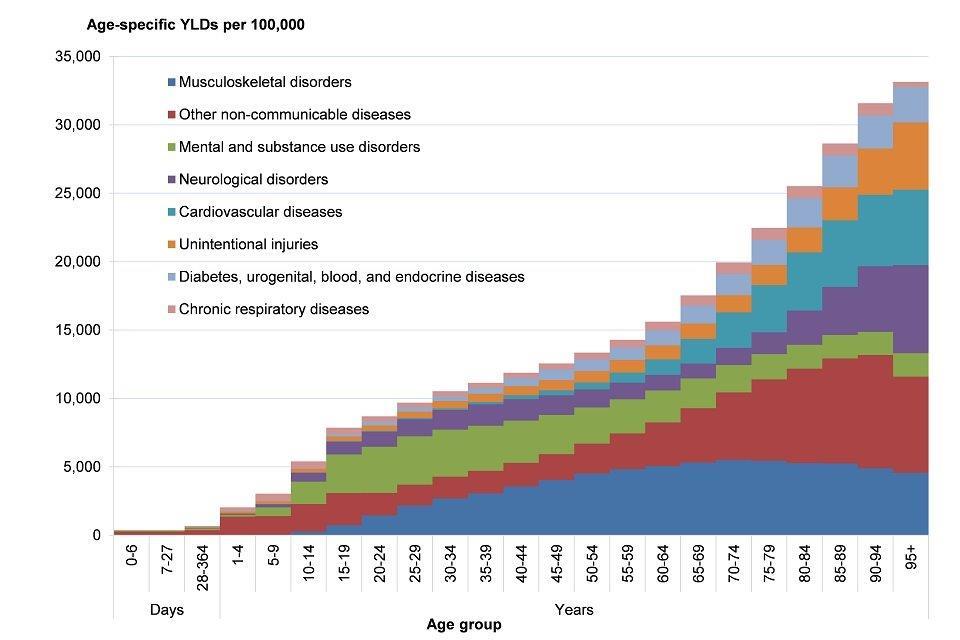
Figure 4: morbidity rate by age and top 8 broad causes (level 2 disease groups), persons, England, 2016 [Source: Global Burden of Disease Study 2016 (GBD 2016) Results. Seattle, United States: Institute for Health Metrics and Evaluation (IHME), 2016]
The leading causes of morbidity (level 3, specific conditions) at each age in 2016 are presented in Figures 5 and 6. The top 5 causes by age and sex in GBD 2013, reported in the Health Profile for England 2017 were different. These differences are mostly due to changes in methods used between the GBD 2013 and the GBD 2016 study, rather than real changes in the leading causes of morbidity over 3 years.
Low back and neck pain, and sense organ diseases (including hearing and sight loss) were ranked first or second as causes of morbidity in males and females aged 50 years and older (Figures 5 and 6).
For younger males aged 15 to 49 years, low back and neck pain was the leading cause, skin diseases were ranked second, followed by depressive disorders. For females aged 15 to 49 years, low back and neck pain was also the leading cause, followed by migraine and skin diseases.
Alzheimer’s and other dementias was ranked third in females aged 70 years or older and fifth in males (Figure 6).
Figure 5: top 5 leading causes of morbidity* (level 3 disease groups) by age, males, England, 2016
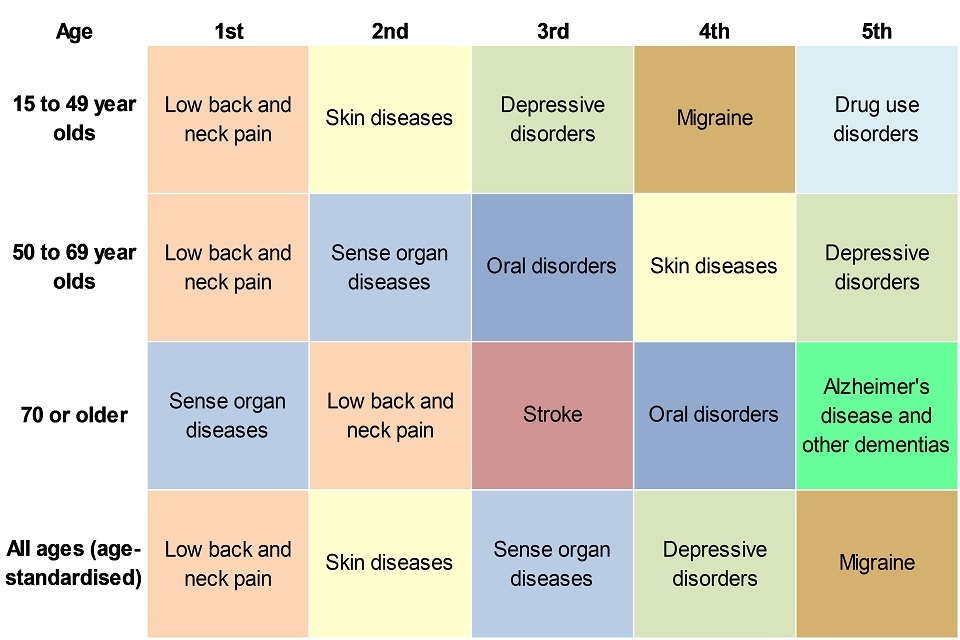
Figure 5: top 5 leading causes of morbidity* (level 3 disease groups) by age, males, England, 2016 [Source: Global Burden of Disease Study 2016 (GBD 2016) Results. Seattle, United States: Institute for Health Metrics and Evaluation (IHME), 2016.]
Figure 6: top 5 leading causes of morbidity* (level 3 disease groups) by age, females, England, 2016
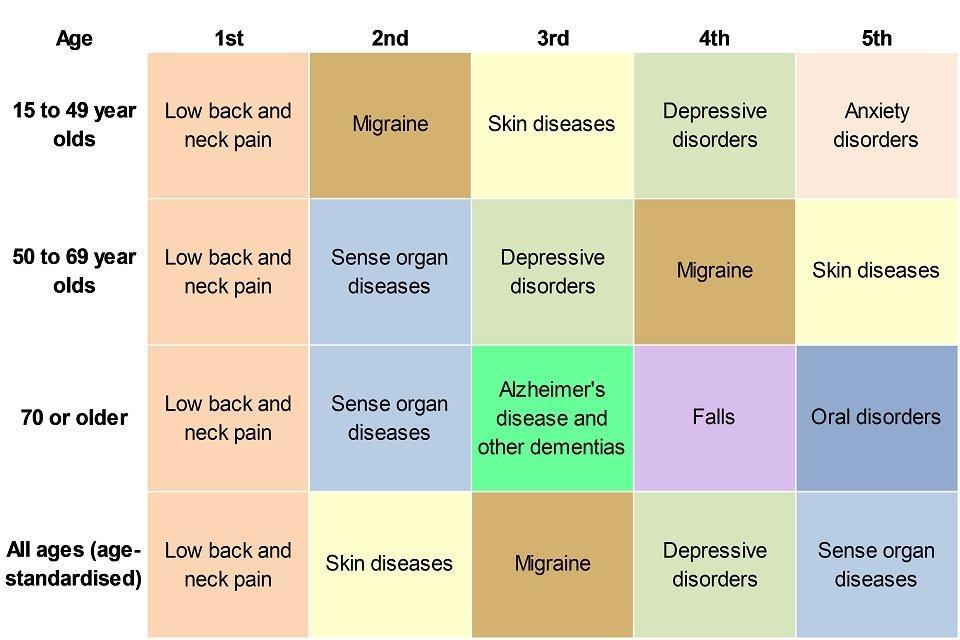
Figure 6: top 5 leading causes of morbidity* (level 3 disease groups) by age, females, England, 2016 [Source: Global Burden of Disease Study 2016 (GBD 2016) Results. Seattle, United States: Institute for Health Metrics and Evaluation (IHME), 2016]
*YLDs per 100,000 population
6. Musculoskeletal conditions
In GBD 2016, MSK conditions accounted for more than 22.1% of the total burden of morbidity in England, and low back and neck pain was the leading cause of morbidity. MSK conditions are injuries or pain that affect the joints, bones, muscles, nerves, ligaments or tendons and include several autoimmune diseases such as rheumatoid arthritis. One in 5 people (20%) consult a GP about a musculoskeletal problem every year[footnote 2].
Analysis of indicators from the GP Patient Survey presented in the PHE MSK profiles suggests that the proportion of people reporting a long-term MSK problem has decreased from 17.2% in financial year 2014 to 2015, to 16.5% in 2016 to 2017. This is the case for both long-term back pain (9.9% to 9.4%) and long-term arthritis or joint pain (12.8% to 12.2%). It is not possible to say whether this is a real reduction in prevalence or a reduction in the reporting of these conditions[footnote 3].
In the financial year 2016 to 2017, the percentage of people reporting a long-term MSK problem significantly increased with age, 3.4% of 18 to 24 year olds reported having an MSK condition compared with 42.0% of those aged 85 years and over. This pattern by age is slightly different from that presented in Section 5 using GBD data. Females reported a significantly higher prevalence of MSK conditions than males (18.5% compared with 14.4%)[footnote 4].
There are also inequalities in the prevalence of a long-term MSK condition by deprivation. People in the least deprived areas[footnote 3]. had a prevalence of 14.5% compared with 17.1% in the most deprived areas. This difference was true for long-term back pain and arthritis or a long-term joint pain[footnote 3].
Having a long-term condition can reduce quality of life, and those with a long-term MSK condition had an average EQ-5D (a standardised instrument for measuring health status) score of 0.58 compared with those without a long-term condition who had a better score of 0.92[footnote 4]. The quality of life score for people with a long-term mental health condition was the lowest. (Figure 7).
Figure 7: average quality of life score for adults who live with a self-reported long term condition, England, financial year 2016 to 2017
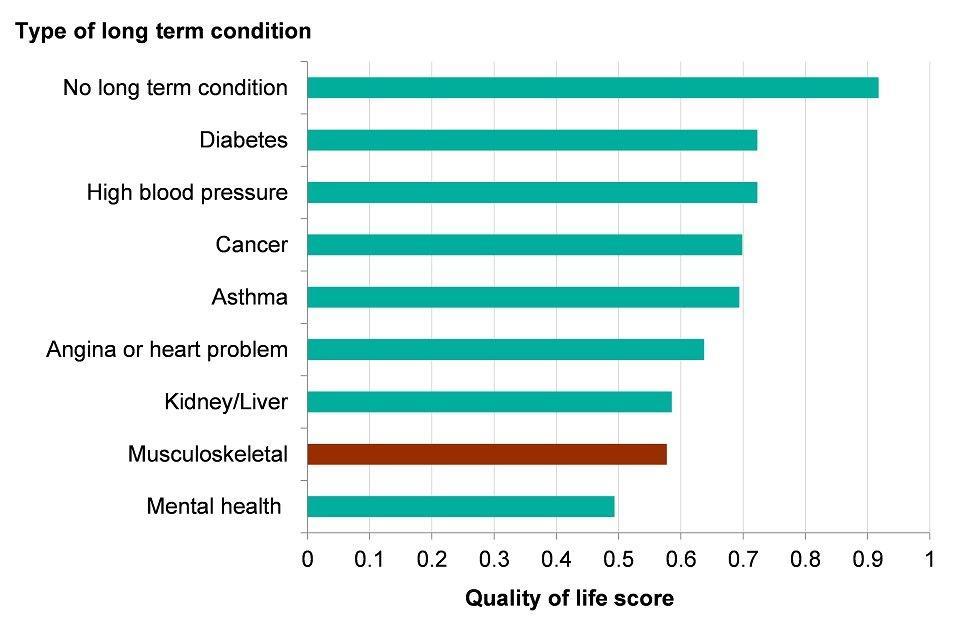
Figure 7: average quality of life score for adults who live with a self-reported long term condition, England, financial year 2016 to 2017 [Source: PHE Analysis of General Practitioner Patient Survey (GPPS)]
MSK conditions are associated with a large number of co-morbidities, including diabetes, depression and obesity[footnote 5]. The percentage of people who reported a long-term MSK condition who also reported feeling anxious or depressed was 24.1% compared to 13.7% in the general GP Patient Survey population (GPPS)[footnote 4]. The question used in the survey reflects the mood of the individual on the day the survey is completed and may not be related to their long-term condition.
There were also significant inequalities in the prevalence of these feelings among people with an MSK condition. Those in the younger age bands who had an MSK condition reported a significantly higher prevalence of depression or anxiety compared with those aged 65 years and over. In addition, the prevalence among people in more deprived areas was 30.5% compared with 17.0% in the least deprived areas[footnote 3].
7. Mental health
Data from GBD 2016 shows that all mental and substance misuse disorders grouped together account for 21.3% of the total morbidity burden in England. Taken separately, the following conditions; depression, drug use, anxiety, autistic spectrum disorders, schizophrenia and bipolar disorders were all ranked in the top 15 leading causes. It is likely that the total burden of mental health problems is an underestimate due to a number of reasons, including the overlap with neurological disorders and the grouping of self-harm as a separate category[footnote 6].
Half of all mental health problems emerge before the age of 14 and three quarters by age 25[footnote 7]. Poor social and emotional well-being in young children can lead to behaviour and developmental problems and, later in childhood, severe depression, anxiety, self-harm and other poor mental health outcomes[footnote 8]. Improving children and young peoples’ mental wellbeing will have a positive effect on their cognitive development, learning, physical health, and their mental health, social and economic prospects in adulthood[footnote 9].
The Adult Psychiatric Morbidity Survey (APMS)[footnote 10] series provides data on the prevalence of both treated and untreated mental health disorders in the English adult population. In 2014, 17.0% of adults (aged 16 and over), in England met the diagnostic criteria for at least one common mental health disorder (CMD) in the week prior to being surveyed. CMDs include depression and anxiety, which can cause marked emotional distress and interfere with daily function but do not usually affect insight or cognition.
Since 1993, the prevalence of CMDs in England for those aged between 16 and 64 increased from 15.5% to 18.9% in 2014, although the pattern and general trend varies by specific condition (Figure 8)[footnote 10].
Figure 8: trend in the prevalence of experiencing common mental health disorders (CMDs) in their past week, adults (age 16 to 64), England, 1993 to 2014

Figure 8: trend in the prevalence of common mental health disorders (CMDs) in adults (age 16-64), England, 1993 to 2014 [Source: Adult Psychiatric Morbidity Survey 2014]
*common mental health disorders **common mental health disorders not otherwise specified
Note: These profiles may use alternative data sources at a local level and may not be comparable with the data in the chart above.
There are also significant inequalities in the prevalence of CMD. In 2014, the prevalence among females was greater than males (20.7% compared with 13.2%). Overall, people of working age were most likely to have symptoms of CMD although the highest prevalence was among females aged 16 to 24 years (Figure 9). Unlike most physical health problems, prevalence was lowest among the oldest age groups
The gap in the prevalence of CMDs among males and females in the 16 to 24 age group has increased over time. Females aged 16 to 24 also had a high prevalence of self-harm, posttraumatic stress disorder (PTSD) and bipolar disorder, making them a high-risk group[footnote 10].
Figure 9: prevalence of experiencing any common mental health disorder (CMD) in the past week, by age, males and females, England, 2014
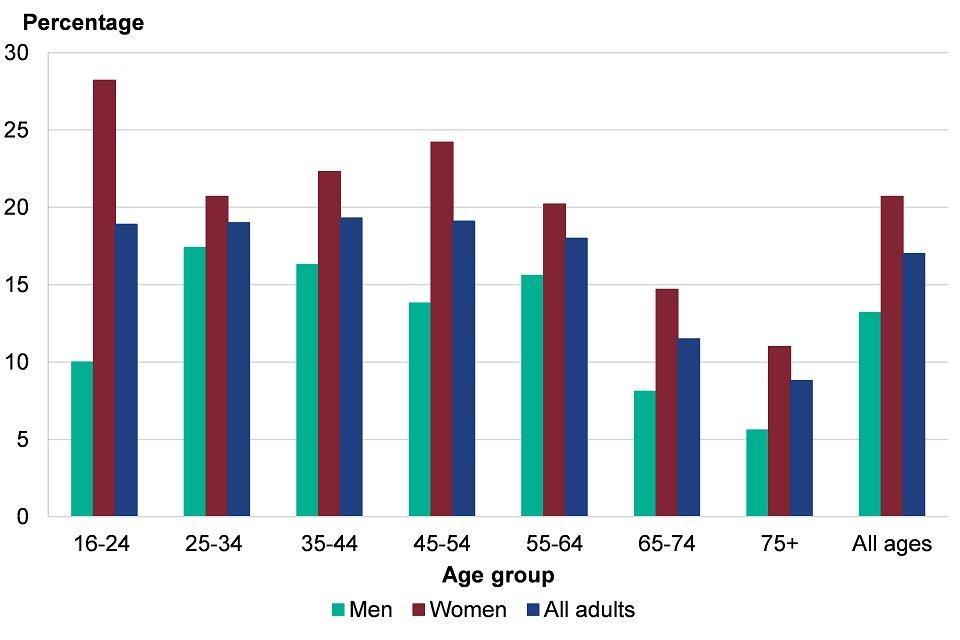
Figure 9: prevalence of any common mental health disorder (CMD) by age, males and females, England, 2014 [Source: Adult Psychiatric Morbidity Survey 2014]
Mental and physical health are closely linked, As demonstrated in the section on MSK conditions, people with physical health problems, especially long-term conditions, were at increased risk of poor mental health, particularly depression and anxiety. Around 30% of people with any long-term physical health condition also have a mental health problem[footnote 11]. Poor mental health in turn exacerbates some long-term conditions, such as chronic pain[footnote 16].
8. Diabetes
In GBD 2016, diabetes was the 12th highest specific (level 3) cause of morbidity. The World Health Organisation defines Diabetes mellitus as “a chronic disease caused by inherited and/or acquired deficiency in production of insulin by the pancreas, or by the ineffectiveness of the insulin produced. Such a deficiency results in increased concentrations of glucose in the blood, which in turn damage many of the body’s systems, in particular, the blood vessels and nerves”. Approximately 90% of diabetes cases worldwide are type 2, caused by ineffectiveness of the insulin produced and this is largely preventable or manageable by lifestyle changes.
The prevalence of diabetes in England has increased over the last 20 years. The Health Survey for England recorded an increase in the prevalence of self-reported ‘doctor diagnosed’ diabetes between 1995 and 2016, from 2.4% to 6.9%. It is also estimated that around 24% of people with type 2 diabetes in England remain undiagnosed and untreated[footnote 12].
Therefore, in 2017, 3.9 million people aged 16 years and over in England, were estimated to have diabetes (diagnosed or undiagnosed). This equates to 8.7% of the population of this age group, with prevalence higher in males (9.8%) compared with females (7.7%) (Figure 10). Prevalence was also higher in South Asian and Black ethnic groups (15.4%) compared with people from White, Mixed or Other ethnic groups (8.1%). The prevalence increased with age; 9.0% of those aged 45 to 54 years had diabetes compared with 23.8% in those aged 75 years and over.
Figure 10: diabetes prevalence (diagnosed and undiagnosed), by age, sex and ethnic group, England, 2016
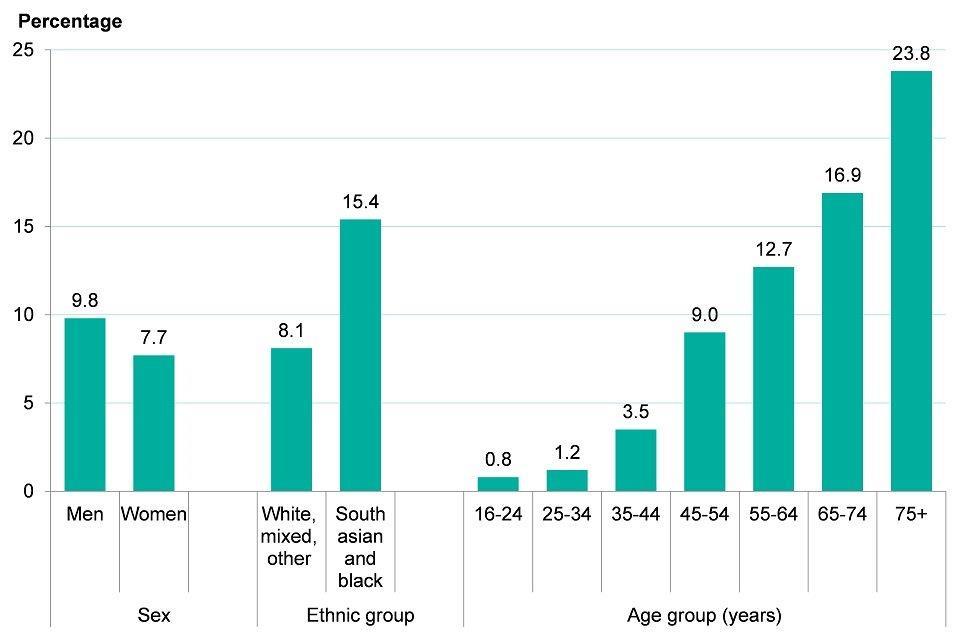
Figure 10: diabetes prevalence (diagnosed and undiagnosed), by age, sex and ethnic group, England, 2016 [Source: PHE diabetes prevalence model 2016]
If the prevalence by ethnic group, age and sex remains constant, the number of people with diabetes (diagnosed or undiagnosed) is expected to increase in the next two decades from 3.9 million people in 2017, to 4.4 million in 2025, and to 4.9 million in 2035. This equates to an overall prevalence rate of around 9.7% of the adult population (Figure 11).
These estimates assume no change in the prevalence of diabetes risk factors, such as obesity. The increase in prevalence is related to the expected ageing of the population. However, as presented in section 10, the prevalence of obesity has increased slightly since 2007, and if this continues, the figures presented here could underestimate the expansion of diabetes.
Figure 11: projected number of people with diabetes (diagnosed and undiagnosed), England, 2017 to 2035
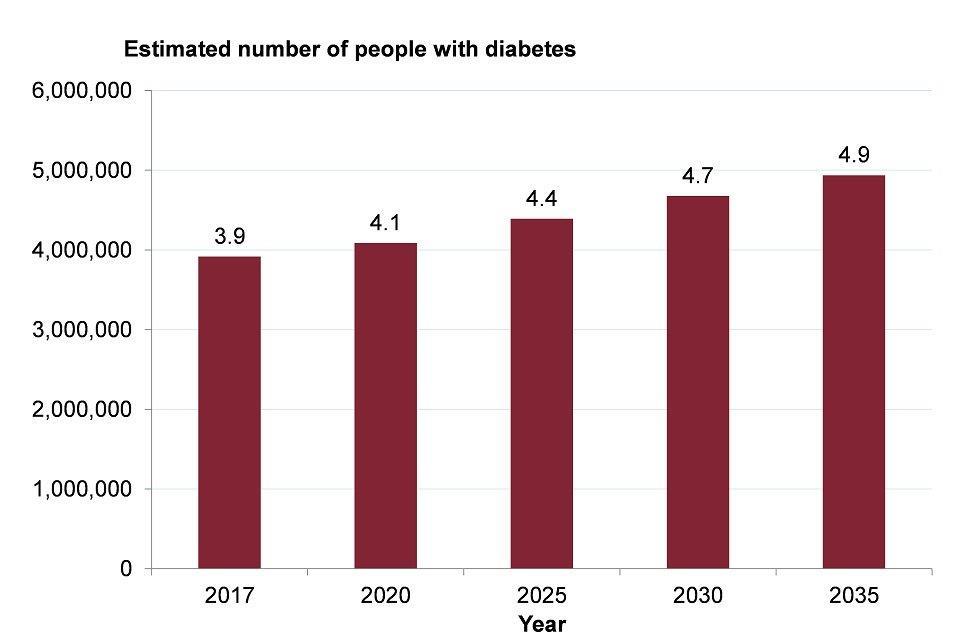
Figure 11: projected number of people with diabetes (diagnosed and undiagnosed), England, 2017 to 2035 [Source: PHE diabetes prevalence model 2016]
9. Risk factors associated with morbidity
Risk factors play an important role in determining whether a person becomes ill, at which age, and the associated effect on quality of life. The GBD divides risk factors into 3 main groups: behavioural, metabolic, and environmental and occupational. GBD does not include the broader social and economic factors that shape people’s lives[footnote 13]. such as education, income, work and social capital. Therefore it may not fully reflect the risk and protective factors associated with health, particularly mental health. These wider determinants of health are discussed in Chapter 6.
Figure 12 shows the top 20 risk factors associated with morbidity in England in GBD 2016. The presence of these risk factors in the population continues to pose a challenge to the health of the nation.
The top behavioural risk factors were smoking, drug use, alcohol use, and aspects of diet and nutrition. The top metabolic risk factors include obesity (high BMI), high blood glucose levels, high blood pressure and high cholesterol. Section 10 discusses trends in these main risk factors, except high blood glucose levels. Diabetes is characterised by high blood glucose levels and is discussed earlier in this chapter.
Environmental and occupational risks include air pollution, unsafe water and other risks due to the working or living environment. The highest ranked environmental risk in 2016 was occupational ergonomic factors, which is particularly associated with MSK conditions.
In GBD 2016, obesity and smoking were the leading risk factors for morbidity. GBD analysis demonstrates that these are associated with many of the most common causes of morbidity including cardiovascular disease, MSK conditions, respiratory disease, diabetes and most cancers.
Figure 12: morbidity rate attributed to risk factors, England, 1990 and 2016
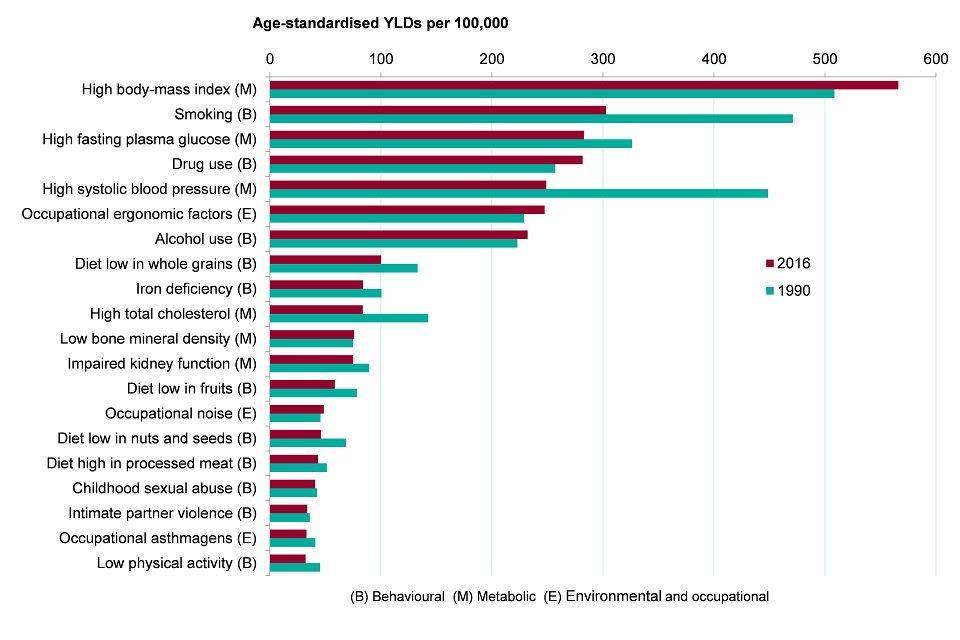
Figure 12: morbidity rate attributed to risk factors, England, 1990 and 2016 [Source: Global Burden of Disease Study 2016 (GBD 2016) Results. Seattle, United States: Institute for Health Metrics and Evaluation (IHME), 2016]
Note: Disease burden attributable to specific risks are independently calculated for each risk factor. Risk factors attributed to YLDs cannot be summed together.
10. Trends in risk factors
This section looks at trends in the main behavioural or metabolic risk factors associated with morbidity. The prevalence of smoking in England has continued to decline over the past 7 years to 14.9% of adults in 2017. Time series analysis suggests that if this trend continues it will reduce to between 8.5% and 11.7% by 2023 (Figure 13).
There has also been a downward trend in the prevalence of high blood pressure in adults from 30.2% in 2010 to 28.3% in 2016. Time series analysis suggests that this figure is likely to continue to decline up to 2023, but the rate of decline is uncertain (Figure 13). These figures include adults with blood pressure higher than 140/90 mmHg and also those with blood pressure below this limit who take medication to lower their blood pressure.
There has been an overall reduction in average total cholesterol in the population between 2003 and 2016, although there have been some fluctuations over time. For males, average total cholesterol has dropped from 5.5mmol/L in 2003 to 5.0mmol/L in 2016, and the drop over the same period for females was from 5.6mmol/L to 5.2mmol/ L[footnote 14]. These figures include people who take lipid-lowering drugs such as statins; in 2017 over 72 million prescriptions for such drugs were issued in England and the number has increased by 53.2% since 2007[footnote 15].
In England, in 2016, 26.2% of adults were obese. Although there has been a slight upward trend in obesity since 2007, and it is forecast that levels of obesity may increase by 2023, there is uncertainty around this forecast due to fluctuations in prevalence over this time period (Figure 13).
Similarly, although there have been fluctuations in prevalence, there has been little change in levels of alcohol consumption (as measured by the percentage of the population drinking more than 8 (men) or 6 (women) units on the heaviest drinking day in the last week) between 2010 and 2016 and the forecasts on the data reflect the uncertainty in the trend (Figure 13).
Figure 13: trend in prevalence of smoking, high blood pressure, obesity and alcohol consumption, adults, England, 2010 to 2016*, and forecasts to 2023
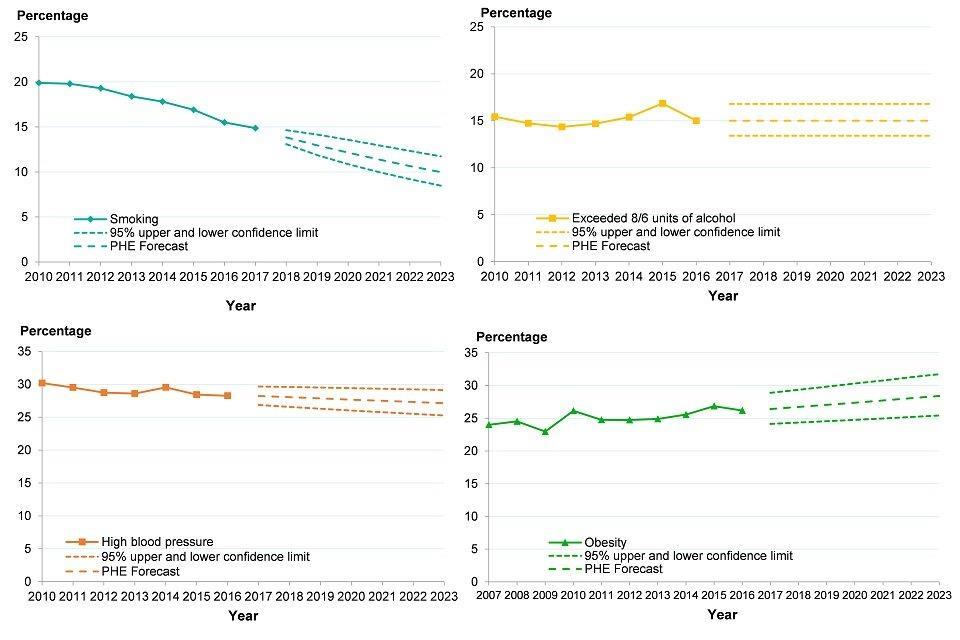
Figure 13: trend in prevalence of smoking, high blood pressure, obesity and alcohol consumption, adults, England, 2010 to 2016*, and forecasts to 2023 [Source: PHE analysis of Annual Population Survey, Health Survey for England and Opinions and Lifestyle Survey]
*trend in smoking prevalence data is for 2010 to 2017, trend in obesity prevalence data is for 2007 to 2016. Smoking data is for adults 18+, all other measures are for adults 16+.
See the full data sources:
Prevalence of high blood pressure
Note: These profiles may use alternative data sources at a local level and may not be comparable with the data in the chart above.
There has been a reduction in illicit drug use among adults aged 16 to 59 years in England and Wales compared with a decade ago, from 10.5% using illegal drugs in the last year in financial year 2005 to 2006, to 8.5% in 2016 to 2017. The most commonly used drugs were cannabis and powder cocaine, used by 6.6% and 2.3% of adults respectively. Over the same period, the proportion using drugs in the last month has fallen from 6.3% to 4.0%
In terms of use of specific drugs, there were an estimated 257,476 opiate users in England in the financial year 2014 to 2015, this figure is similar to the estimate in 2011 to 2012. The estimated number of crack users has increased by 10% over this time period, from 166,640 to 182,828.
In 2016, just over one in four people aged 65 years and over consumed the recommended 5 portions of fruit or vegetables each day (5 A Day), and this proportion has fallen significantly in recent years. The proportion of younger adults aged 19 to 64 years who consumed 5 A Day increased slightly over time, but was still less than one in three in 2016 (Figure 14).
Figure 14: trend in the percentage of the population consuming the recommended 5 A Day fruit and vegetable portions, by age, England, survey year 2008 to 2009 up to 2015 to 2016
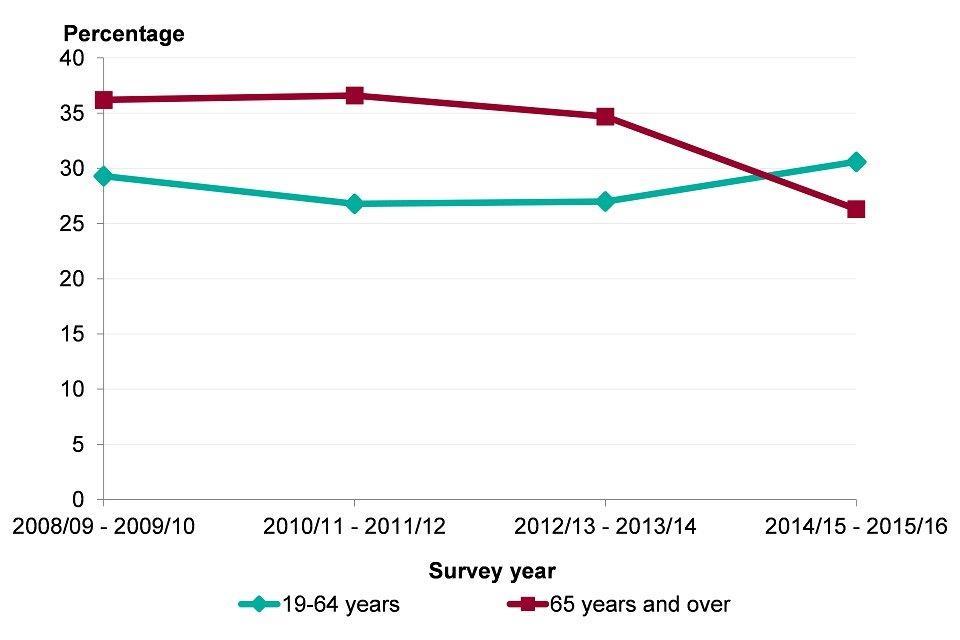
Figure 14: trend in the percentage of the population consuming the recommended 5 A Day fruit and vegetable portions, by age, England, survey year 2008 to 2009 up to 2015 to 2016 [Source: National Diet and Nutrition Survey]
Note: These profiles may use alternative data sources at a local level and may not be comparable with the data in the chart above.
Physically active adults are those who report doing at least 150 moderate intensity equivalent minutes of physical activity per week and in the financial year 2016 to 2017 two in three adults met this recommendation. However, 22.2% of adults did less than 30 mins of such activity per week
The prevalence of risk factors also varies across England and is higher in some population groups than others. See Chapter 5 for a discussion on inequalities in the main behavioural risk factors.
11. Further information
The Global Burden of Disease 2016 study is used in this chapter to identify those conditions that contribute most to morbidity in England and their associated risk factors. Morbidity measures are very important for understanding the demand for health and social care services. The major causes of death and changes over time are discussed in Chapter 2.
More information on the GBD study is available from the Institute of Health Metrics and Evaluation website
12. References
-
Global Burden of Disease Study (2016) Results. Seattle, United States: Institute for Health Metrics and Evaluation (IHME). Accessed 13 July 2018. ↩
-
Arthritis UK (2018) State of Musculoskeletal Health 2018. Accessed 13 July 2018. ↩
-
Public Health England (2017) Musculoskeletal diseases profile: a short commentary, November 2017. Accessed 13 July 2018. ↩ ↩2 ↩3 ↩4
-
Public Health England (2018) Musculoskeletal diseases profile: a short commentary, June 2018. Accessed 13 July 2018. ↩ ↩2 ↩3
-
Arthritis UK (2013) Musculoskeletal Health – A Public Health Approach. Accessed 27 June 2018. ↩
-
Vigo D, Thornicroft G, Atun R (2016) Estimating the true global burden of mental illness. The Lancet Psychiatry, 3(2):171 to 178. ↩
-
Kessler RC, Berglund P, Demler O et al. (2005) Lifetime prevalence and age-of-onset distributions of dsm-iv disorders in the national comorbidity survey replication. Archives of General Psychiatry, 62(6):593 to 602. ↩
-
NICE (2016) Early years: promoting health and wellbeing in under 5s. Quality standard QS128. Accessed 13 July 2018. ↩
-
Public Health England (2015) Promoting children and young people’s emotional health and wellbeing. A whole school and college approach, March 2015. Accessed 24 July 2018. ↩
-
McManus S, Bebbington P, Jenkins R, Brugha T (eds.) (2016) Mental health and wellbeing in England: Adult Psychiatric Morbidity Survey 2014. Accessed 13 July 2018. ↩ ↩2 ↩3
-
Naylor C, Parsonage M, McDaid D and others. (2012) Long term conditions and mental health – the cost of co-morbidities. Accessed 20 July 2018. ↩
-
Arnow BA, Hunkeler EM, Blasey CM and others. (2016) Comorbid depression, chronic pain, and disability in primary care. Pschosom Med 68(2): 262 to 268. Accessed 20 July 2018. ↩
-
Holman N, Forouhi NG, Goyder E and others. (2011) The Association of Public Health Observatories (APHO) Diabetes Prevalence Model: estimates of total diabetes prevalence for England, 2010 to 2030. Diabetic Medicine, 28(5):575 to 582. ↩
-
The Marmot Review Team (2010) The Marmot Review: Fair Society, Healthy lives. Accessed 13 July 2018. ↩
-
PHE analysis of Health Survey for England data (2016) Health Survey for England - Health, social care and lifestyles.. Accessed 13 July 2018. ↩
-
NHS Digital (2018) Prescriptions dispensed in the Community, England 2007-2017. Accessed 20 July 2018. ↩