Chapter 3: trends in morbidity and behavioural risk factors
Published 13 July 2017

© Crown copyright 2017
This publication is licensed under the terms of the Open Government Licence v3.0 except where otherwise stated. To view this licence, visit nationalarchives.gov.uk/doc/open-government-licence/version/3 or write to the Information Policy Team, The National Archives, Kew, London TW9 4DU, or email: psi@nationalarchives.gov.uk.
Where we have identified any third party copyright information you will need to obtain permission from the copyright holders concerned.
This publication is available at https://www.gov.uk/government/publications/health-profile-for-england/chapter-3-trends-in-morbidity-and-behavioural-risk-factors
1. Main messages
The total burden of morbidity in England increased between 1990 and 2013. However, this increase is more than accounted for by changes in population size and ageing. The age-standardised morbidity rate reduced by 1.4% over this period.
Age-specific morbidity rates decreased for nearly all of the age groups between 1990 and 2013. The largest reduction was for the over 80 age group. However, older people experience higher rates of morbidity. In 2013 those aged over 80 had twice the morbidity rate of the 60 to 64 age group, which in turn had twice that of the 20 to 24 age group.
There has been little change in the leading causes of morbidity between 1990 and 2013. Low back and neck pain, skin diseases (mainly dermatitis, acne and psoriasis) and depressive disorders remain the leading causes overall for both sexes combined.
In 2013, the leading risk factors for morbidity were high body mass index (BMI) and high blood sugar. Smoking and alcohol use were also significant contributors to morbidity.
The prevalence of smoking has declined from 19.3% to 15.5% in the last 4 years. However, there has been little change in other risk factors such as having a high body mass index (excess weight).
2. Introduction
The population of England grew by 15% between 1990 and 2015, an increase of 7 million people [footnote 1]. Over the last 30 years, England has seen a steady increase in life expectancy for males and females and an increase in healthy life expectancy (the number of years spent in good health) (Chapter 1). There is also a greater proportion of the population in the older age groups; half a million people in the UK are now in their 90s, which is more than two and half times the number in 1985 [footnote 8].
Chapter 1 also showed that since 2000 to 2002, life expectancy has increased by more years than healthy life expectancy, and therefore the number of years lived in poor health has also increased slightly. In 2013 to 2015 it was 16.1 years for males and 19.0 years for females. However, the proportion of life spent in poor health has remained stable.
This data does not give an indication of the severity of poor health, the types of conditions that are prevalent at each age group, or an indication of trends in poor health (or morbidity) at each age group. This chapter will provide an overview of trends in morbidity by age group, adjusted for the severity of disease.
The Global Burden of Disease (GBD) study 2013 provides modelled estimates of the burden of poor health and disability. The burden of disease analysis is a way to compare the impact of different diseases, conditions or injuries on a population. This impact can be broadly divided into morbidity (living with a disease) and mortality (dying from a disease).
The GBD also provides modelled estimates of the burden that can be attributed to a number of risk factors. It uses years lived with disability (YLDs) to attribute the burden of morbidity, which is the focus of this chapter.
YLDs is a measure of morbidity that combines the prevalence of each disease with a rating of the severity of its symptoms (excluding death itself), to give an overall measure of the loss of quality of life. This chapter looks at the trends in the following measures of YLDs:
- total burden of morbidity in the population (the total number of YLDs)
- crude or age-specific burden of morbidity (the number of YLDs divided by the total or age-specific population and presented as a rate per 100,000 population)
- age-standardised burden of morbidity (the number of YLDs per 100,000 population adjusted for the age structure of the population)
The GBD groups diseases into a 4 level cause hierarchy. Level 1 groups diseases at a high level: communicable diseases, non-communicable diseases, and injuries. Each subsequent level in the hierarchy presents a finer grouping of conditions that nest within the level above. For example, the second level consists of major disease or injury groups, such as musculoskeletal conditions or transport injuries. The third level, which is used for the majority of this chapter, further subdivides causes into disease or injury type such as osteoarthritis, low back and neck pain, and road injuries.
Further information on how YLDs are calculated and the disease hierarchy can be found in the definitions and data notes sections at the end of this chapter.
3. The overall burden of morbidity
The total burden of morbidity, measured by the total number of years lived with disability (YLD) in the population in a given year, increased by nearly a sixth between 1990 and 2013, from just over 6 million to 7 million (table 1).
The crude rate (YLDs per 100,000 population) increased by 3.3% during this period, however when adjusting for age, the age-standardised rate of morbidity has reduced by 1.4%. This indicates that the increase in the total burden of morbidity can be accounted for by increases in population size and population ageing.
Similar trends were seen for males and females. The total morbidity burden for males increased by 19.5% between 1990 and 2013, compared to an increase of 13.1% for females. The age-standardised rate for males during this period decreased by 2.1% compared to 0.6% for females. In general, the overall morbidity burden for males is lower than for females.
3.1 Table 1: trends in morbidity from 1990 to 2013
| Persons | Males | Females | |||||||
|---|---|---|---|---|---|---|---|---|---|
| Year | YLDs - Number | YLDs per 100,000 pop - crude rate | YLD per 100,000 pop - Age-Standardised | YLDs - Number | YLDs per 100,000 pop - crude rate | YLD per 100,000 pop - Age-Standardised | YLDs - Number | YLDs per 100,000 pop - crude rate | YLD per 100,000 pop - Age-Standardised |
| 1990 | 6,154,293 | 12,902 | 11,346 | 2,762,492 | 11,902 | 11,006 | 3,391,801 | 13,850 | 11,674 |
| 1995 | 6,280,076 | 12,987 | 11,315 | 2,816,576 | 11,970 | 10,932 | 3,463,500 | 13,951 | 11,684 |
| 2000 | 6,470,663 | 13,141 | 11,359 | 2,921,508 | 12,155 | 10,959 | 3,549,155 | 14,081 | 11,746 |
| 2005 | 6,680,145 | 13,202 | 11,284 | 3,040,578 | 12,270 | 10,867 | 3,639,567 | 14,098 | 11,693 |
| 2010 | 7,016,211 | 13,356 | 11,311 | 3,217,407 | 12,459 | 10,866 | 3,798,803 | 14,224 | 11,751 |
| 2013 | 7,138,127 | 13,329 | 11,185 | 3,301,953 | 12,511 | 10,772 | 3,836,174 | 14,124 | 11,600 |
See the full data source: GBD study 2013
4. Trends in morbidity by disease group
There has been little change in the leading causes of morbidity between 1990 and 2013. Low back and neck pain, skin diseases (mainly dermatitis, acne and psoriasis) and depressive disorders remained the largest contributors (figure 1).
However, there were some changes in the leading causes over time. Morbidity due to diabetes increased by three-quarters (75%), moving from a rank of 14th highest to eighth highest, driven mainly by high levels of obesity in the population[footnote 2].
There was also a notable increase (16%) in alcohol disorders, moving from a rank of 26th to 22nd. During the same period, the morbidity due to falls declined by a third (30%), moving from a rank of fifth to seventh. Improvements in the quality of treatment since 1990 are likely to have contributed to the reduction in morbidity due to falls [footnote 3] (figure 1).
The leading cause of morbidity for men and women, low back and neck pain, accounted for 3 times the morbidity of the second-placed condition for both sexes: skin diseases for men and depressive disorders for women (figure 2 and figure 3).
In addition, if low back pain and neck pain are combined with other musculoskeletal conditions such as osteoarthritis (level 2), these account for 24% of all YLDs (per 100,000), compared to 3% for cardiovascular disease (stroke and coronary heart disease) and 1% for cancers. These musculoskeletal causes of morbidity are long-term debilitating conditions that individuals live with and manage for many years.
4.1 Figure 1: ranks of leading causes of morbidity (age-standardised YLDs per 100,000 population), persons, England 1990 and 2013 (GBD 2013, level 3 groupings)
Between 1990 and 2013 the top 4 ranked conditions have remained the same. Morbidity due to diabetes moved from 14th to eighth, while falls moved from a rank of fifth to seventh
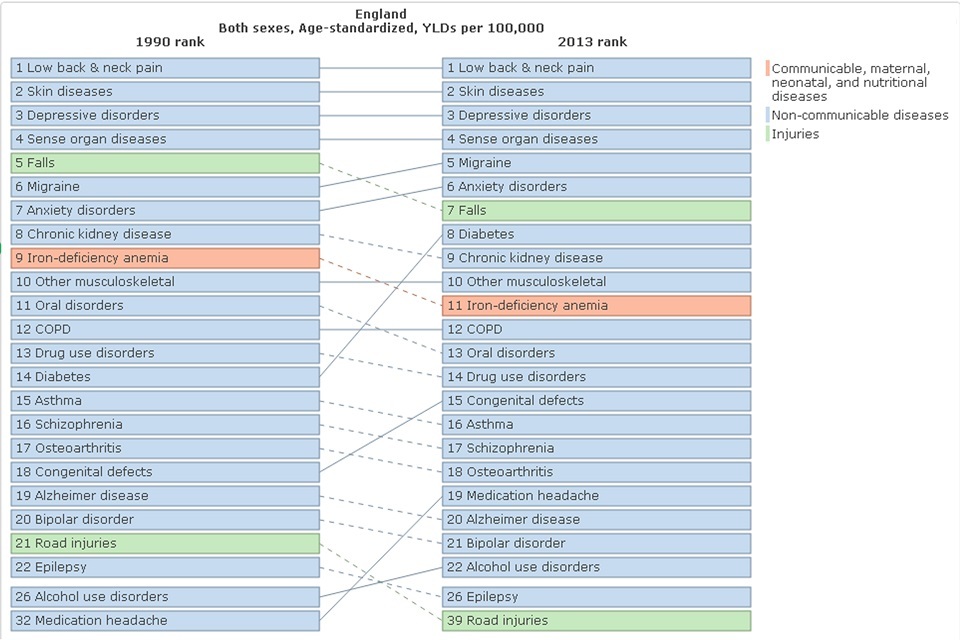
Figure 1. Ranks of leading causes of morbidity (age-standardised YLDs per 100,000 population), persons, England 1990 and 2013 (Global Burden of Disease 2013, level 3 groupings)
This shows:
- the top 4 leading causes of morbidity in 2013 were the same as in 1990
- the contribution to overall morbidity increased for diabetes between 1990 and 2013, moving from a rank of 14th to 8th
- morbidity due to falls declined by a third (30%), moving from a rank of 5th to 7th
See the full data source: GBD study 2013
4.2 Figure 2: top 15 leading causes of morbidity in males (age-standardised YLDs per 100,000 population), England 1990 and 2013 (GBD 2013, level 3 groupings)
For males, the leading cause of morbidity in 2013 was low back and neck pain followed by skin and subcutaneous diseases and sense organ diseases
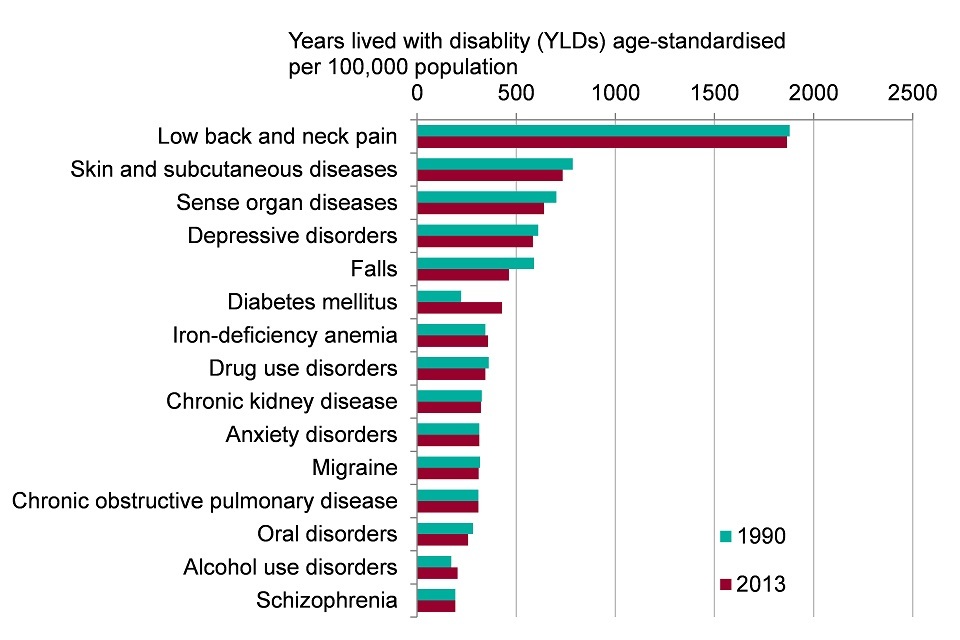
Figure 2. Top 15 leading causes of morbidity in males (age-standardised YLDs per 100,000 population), England 1990 and 2013 (Global Burden of Disease 2013, level 3 groupings)
This shows:
- the greatest burden of morbidity for males was due to low back and neck pain, which was 3 times greater than the burden due to skin disease (the group in second place)
- morbidity from falls declined between 1990 and 2013, while morbidity from diabetes increased
- over two-thirds (68%) of morbidity was accounted for by the top 15 conditions in 2013
See the full data source: GBD study 2013
4.3 Figure 3: top 15 leading causes of morbidity in females (age-standardised YLDs per 100,000 population), England 1990 and 2013 (GBD 2013, level 3 groupings)
For females across all ages, the highest rates of morbidity in 2013 were due to low back and neck pain, depressive disorders, and skin and subcutaneous diseases
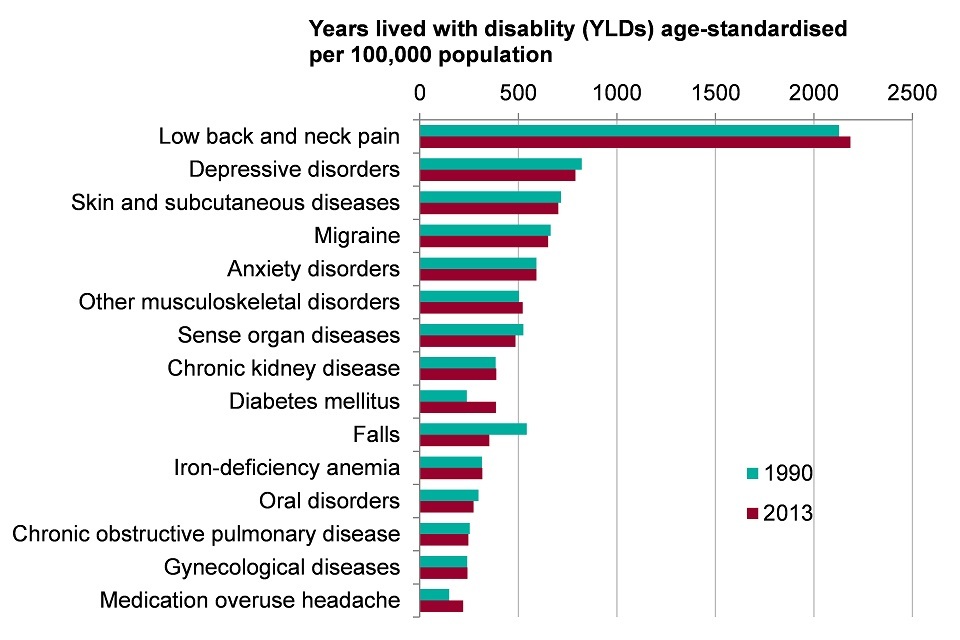
Figure 3. Top 15 leading causes of morbidity in females (age-standardised YLDs per 100,000 population), England 1990 and 2013 (Global Burden of Disease 2013, level 3 groupings)
This shows:
- the greatest burden of morbidity for females was due to low back and neck pain, and was 3 times greater than the burden due to depressive disorders (the group in second place)
- falls saw the greatest decrease in morbidity between 1990 and 2013 a reduction of 35%, and diabetes the greatest increase, up by 62%
- over 70% of all morbidity was accounted for by the top 15 conditions in 2013
See the full data source: GBD study 2013
5. Morbidity by age
The age-specific morbidity rate (YLDs per 100,000 population) increases steadily from birth through to middle age and then more rapidly into old age. The over 80 age group experiences twice the morbidity rate of the 60 to 64 years group, which is in turn twice that of the 20 to 24 group (figure 4).
This reflects the fact that morbidity from many diseases increases with age; in particular, musculoskeletal conditions (including low back and neck pain), neurological diseases (including Alzheimer’s and other dementias), and diabetes (figure 5).
In a study of comorbidities in Somerset, it was found that half of people aged over 60 have 2 or more long term conditions (comorbidities) and a quarter have at least 3 long-term conditions (figure 6). The number of people with comorbidities is set to increase in England from 1.9 million in 2008 to 2.9 million by 2018[footnote 4].
5.1 Figure 4: rate of morbidity (age-specific YLDs per 100,000 population), persons, England 1990 and 2013
The morbidity rate increases with age
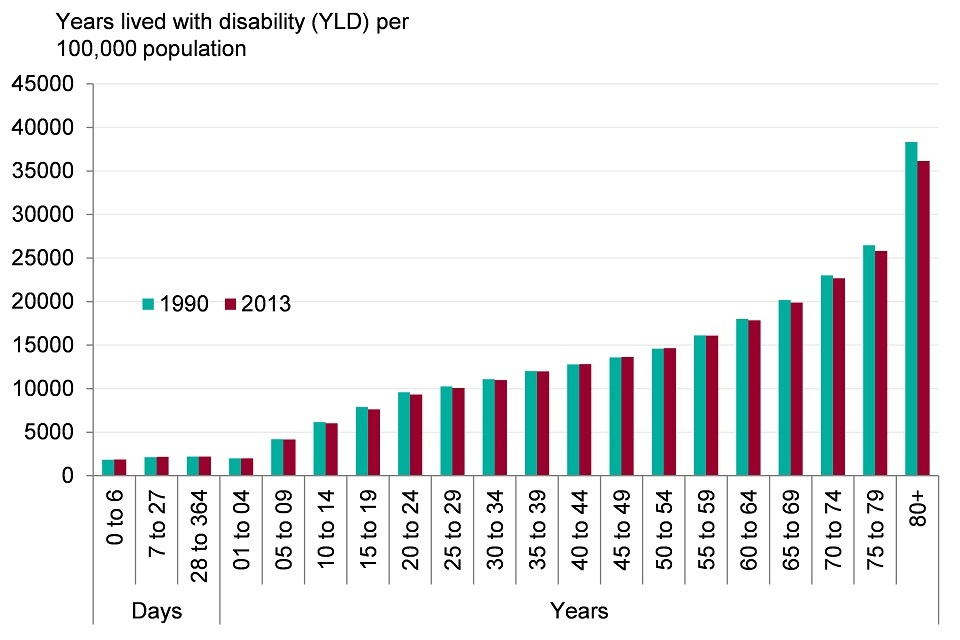
Figure 4. Rate of morbidity (age-specific YLDs per 100,000 population), persons, England 1990 and 2013
This shows:
- from the age of 5 morbidity increases through the life course. The morbidity rate for those in their 80s is almost double that of those in their 60s, which in turn is double that of those in their 20s
See the full data source: GBD study 2013
5.2 Figure 5: morbidity by age group and top 8 broad causes person (YLDs per 100,000 population), England 2013
In 2013, the morbidity burden increased steadily to mid-life, then more rapidly into old age
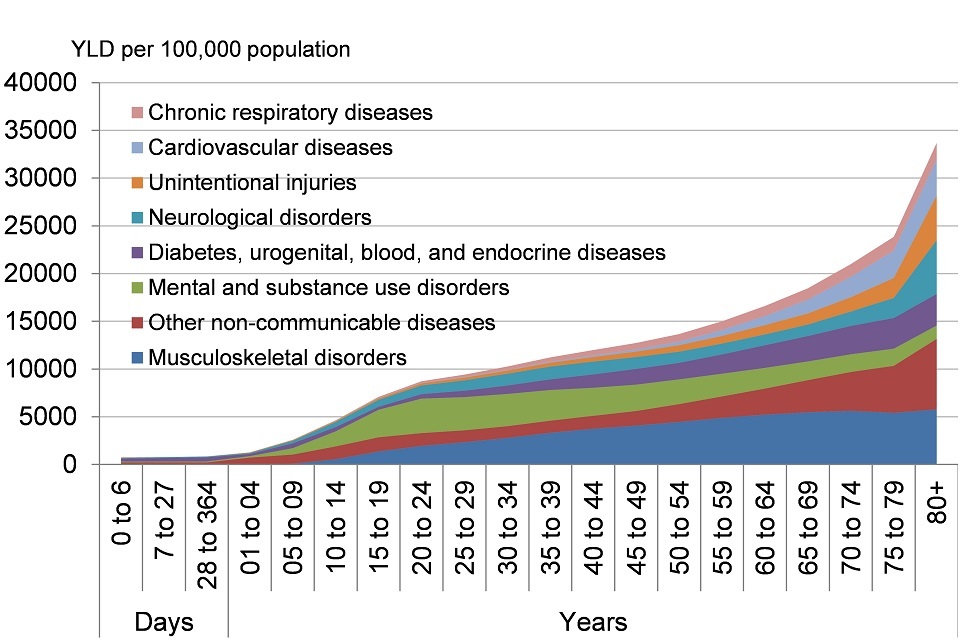
Figure 5. Morbidity by age group, persons (YLDs per 100,000 population), England 2013
This shows:
- 4 disease groups account for more than half of the total burden at all ages: musculoskeletal disorders, other non-communicable diseases, mental and substance use disorders, and diabetes, urogenital, blood, and endocrine diseases (level 2)
- apart from mental and substance use disorders, the burden from most disease groups tends to increase with age
See the full data source: GBD study 2013
5.3 Figure 6: the proportion of the population with long-term conditions by age group, persons, 2012 to 2013
In 2012 to 2013, over two-thirds of people aged 60 to 64 had 1 long-term condition, and a third had 2 or more
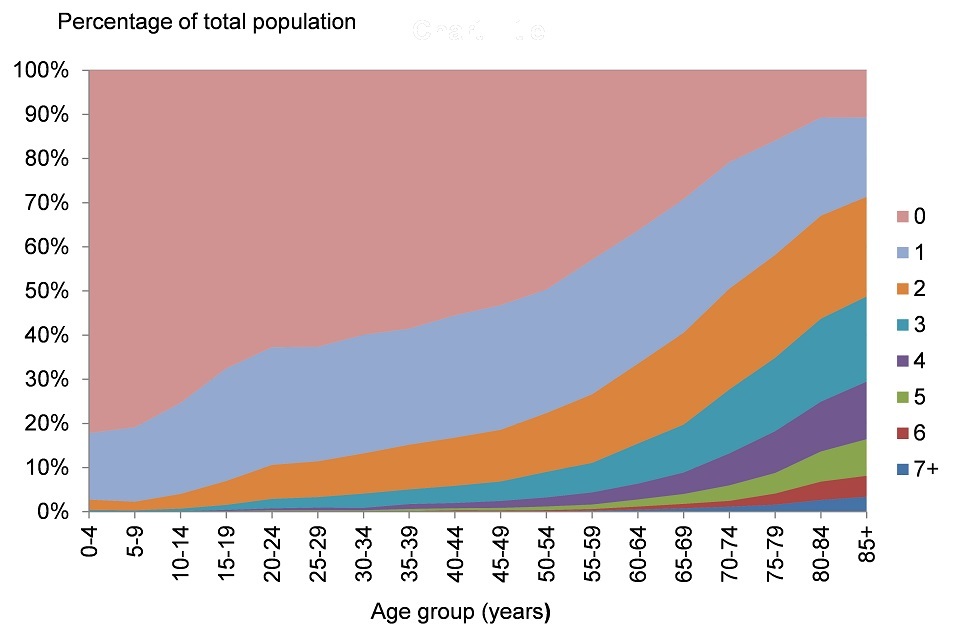
Figure 6. Proportion of the population with long term conditions by age group, persons, 2012/13
Note: Data are for South Somerset local authority
This shows:
- the number of long-term conditions increased steadily with age
- at age 40, 44% of people had 1 or more long-term condition
- at age 60, 64% of people had 1 or more long-term condition and over 30% had 2 or more
- at age 80, nearly 90% of people have had 1 or more long-term condition and 44% had 3 or more
See the full data source: Reproduced with permission from the Symphony study
The conditions contributing most to morbidity varied by age group. Low back and neck pain was the biggest cause of morbidity in the 15 to 49 age group, and was consistently within the top 2 for males and females in the older age groups. Skin diseases and mental health and substance disorders were also leading causes for those aged 15 to 49; depressive and drug use disorders ranked third and fourth for males. For females, depressive and anxiety disorders ranked second and fourth.
Diabetes and hearing and sight diseases (sense organs), appeared in the top 5 causes for those aged over 50. For those aged over 70, Alzheimer’s disease and falls were among the leading causes (figures 7 and 8).
5.4 Figure 7: top 5 leading causes of morbidity by age, (YLDs per 100,000 population) for males, England 2013
Low back and neck pain was one of the top 2 leading causes of morbidity for males aged 15 and over in 2013
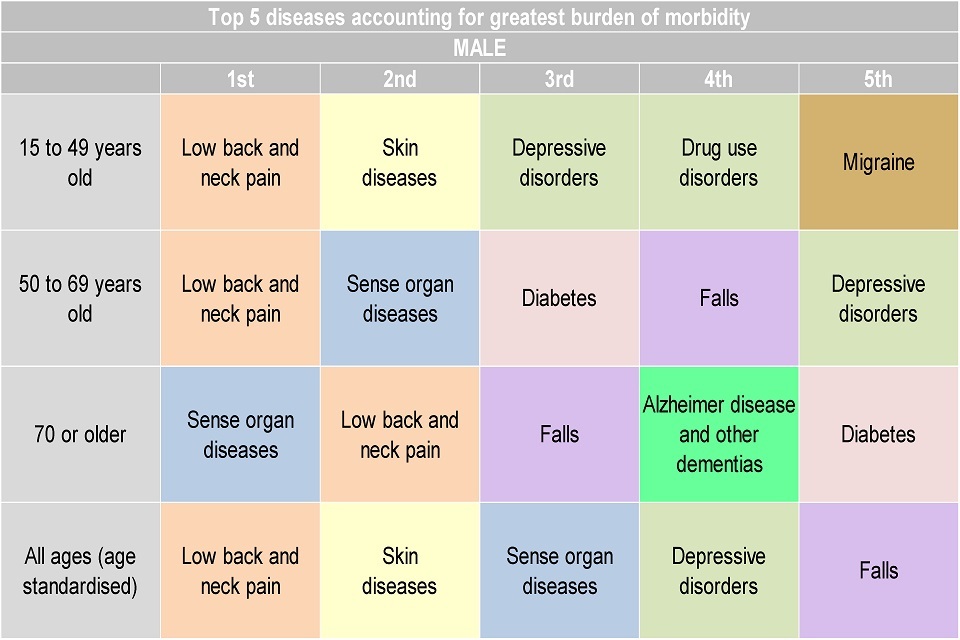
Figure 7. Top 5 leading causes of morbidity by age, (YLDs per 100,000 population) for males, England 2013
This shows:
- low back and neck pain, and sense disorders (hearing and sight loss) were ranked first or second as contributors of morbidity in males aged 50 years and older
- for males aged 15 to 49, while low back and neck pain was the leading cause, skin diseases were ranked second for males aged 15 to 49
See the full data source: GBD study 2013
5.5 Figure 8: top 5 leading causes of morbidity by age, (YLDs per 100,000 population) for females, England 2013
In 2013, patterns of female morbidity were similar to those for males in most age groups
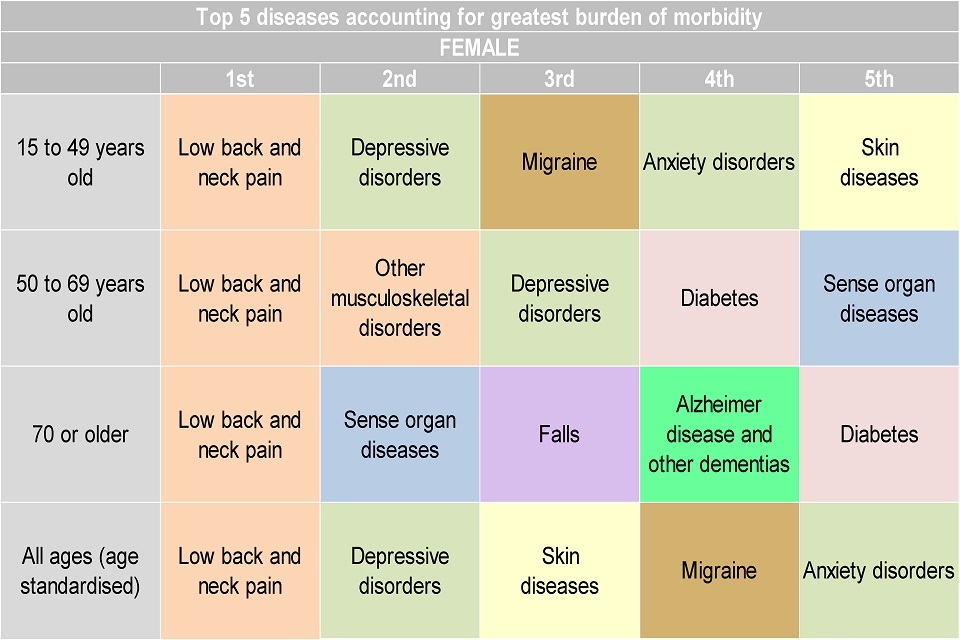
Figure 8. Top 5 leading causes of morbidity by age, (YLDs per 100,000 population) for females, England 2013
This shows:
- low back and neck pain is the number 1 contributor of morbidity in females aged 15 and over
See the full data source: GBD study 2013
6. Trends in morbidity by age
Age-specific morbidity rates decreased for nearly all of the age groups between 1990 and 2013. The largest reduction was for the over 80 aged group, where the rate of YLDs decreased by 5.7% (figure 9).
6.1 Figure 9: percentage change in YLDs per 100,000 population between 1990 and 2013, by age group, persons, England
Between 1990 and 2013, the rate of YLDs for the majority of age groups decreased
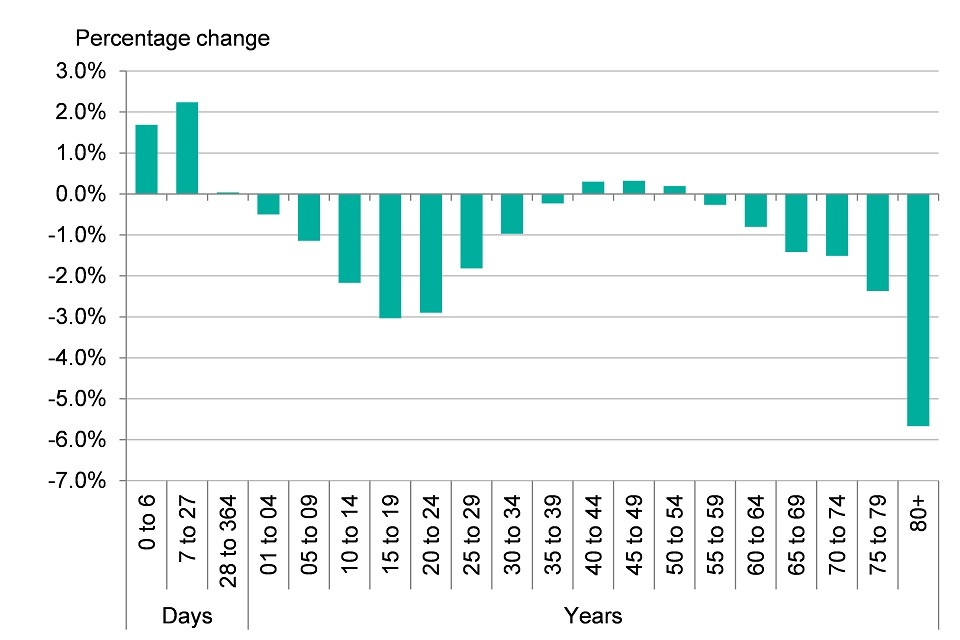
Figure 9. Percentage change in YLDs per 100,000 population between 1990 and 2013, by age group, persons, England
This shows:
- the rate of morbidity has decreased for many of the age groups, the largest percentage change between 1990 and 2013 was seen in the over 80 age group with a reduction of 5.7%
- the rate of morbidity increased for those under the age of 1 and for those in middle age (40 to 54)
See the full data source: GBD study 2013
7. Risk factors associated with morbidity
The trends and causes of morbidity in the population are influenced by a broad range of factors. Figure 1 in chapter 6 describes the broad range of influences on health, which include age, sex and hereditary factors; individual lifestyle and behavioural risk factors; social and community networks; living and working conditions; and general socioeconomic, cultural and environmental conditions.
The broad social and economic circumstances which together influence the quality of the health of the population are known as the ‘social determinants of health’ and are discussed further in chapter 6 [footnote 5].
Risk factors play an important role in determining whether a person becomes ill, but also at which age and what the impact on their life quality is [footnote 6]. The GBD model divides certain risk factors into 3 main groups: behavioural, metabolic and environmental.
Metabolic risk factors include high BMI and high cholesterol, behavioural risks include smoking, alcohol, and unsafe sex, while environmental and occupational risks include air pollution, unclean water and other risks due to the working or living environment.
In 2013, all identified risk factors in GBD jointly explain 26.3% of age-standardised YLDs, with the remaining 73.7% age-standardised YLDs as yet unexplained. The single risk factor accounting for the most morbidity was high BMI followed by high fasting plasma glucose (high blood sugar).
High BMI is a risk factor for heart disease, stroke, osteoarthritis, back pain, chronic kidney disease, diabetes and some cancers. High fasting plasma glucose is another major driver of cardiovascular diseases and diabetes. Smoking and alcohol use were ranked sixth and seventh. Over half of the leading risk factors related to diet and nutrition (figure 10).
7.1 Figure 10: morbidity for persons attributed to risk factors (YLDs per 100,000 population). England, 1990 and 2013
In 2013, high BMI was the leading modifiable risk factor and over half of the top 20 risk factors related to diet
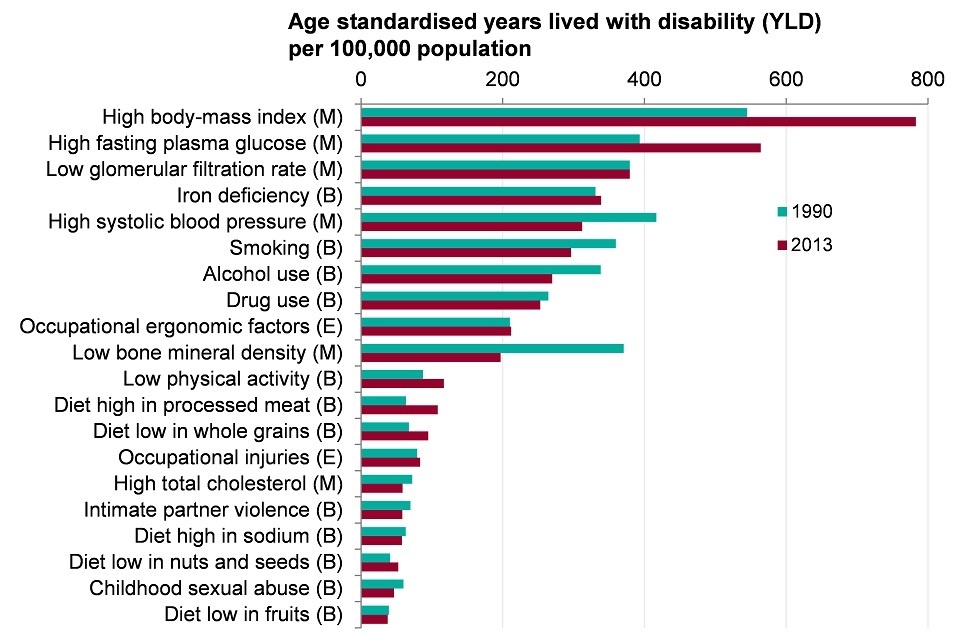
Figure 10. Morbidity for persons attributed to risk factors (YLDs per 100,000 population). England, 1990 and 2013
Note: Disease burden attributable to specific risks are independently calculated for each risk factor. Risk factors attributed to YLDs cannot be summed together.
This shows:
- risk factors can be grouped into 3 broad categories; behavioural, metabolic and environmental. Metabolic risk factors include high BMI and high cholesterol; behavioural risk factors include smoking, alcohol use, and drug use, while environmental and occupational risk factors include air pollution, unclean water and other risks due to the working or living environment
- high BMI was the leading risk factor for morbidity, followed by high fasting plasma glucose (high blood sugar). Smoking and alcohol use were ranked sixth and seventh
See the full data source: GBD study 2013
The presence of these leading risk factors in the population continues to pose a challenge to the health of the nation. While there have been some decreases in the prevalence of risk factors, notably in tobacco smoking (figure 11), there has been little change in other risk factors such as excess weight, physical inactivity (figure 12) and diagnosed hypertension (figure 13). Recent estimates suggest that almost 2 out of 3 adults in England are either overweight or obese[footnote 7].
The prevalence of risk factors also varies across England and is higher in some population groups than others (chapter 5). Underpinning trends and inequalities in the prevalence of risk factors are inequalities in the broader social determinants of health (chapter 6).
Figure 11: trend in prevalence of smoking in England, 2012 to 2016, persons aged 18 and over
Smoking prevalence continues to decline in England
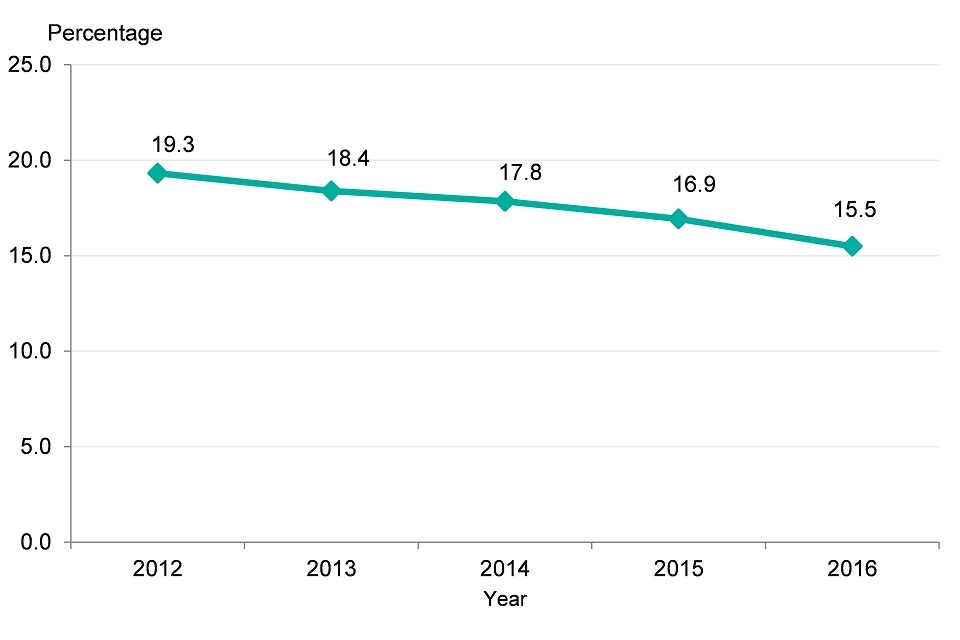
Figure 11. Trend for decreasing prevalence of smoking in England, 2012-2016, persons aged 18 and over [Source: Public Health Outcomes Framework]
This shows:
- the prevalence of smoking in England has continued to decrease over the past 4 years to just under 16%, less than a sixth of the population
7.2 Figure 12: the proportion of the population aged 16 and over getting the recommended 150 minutes of physical activity per week in England (2012 to 2015)
Over half of adults were doing the recommended 150 minutes of physical activity per week in England (2012 to 2015):
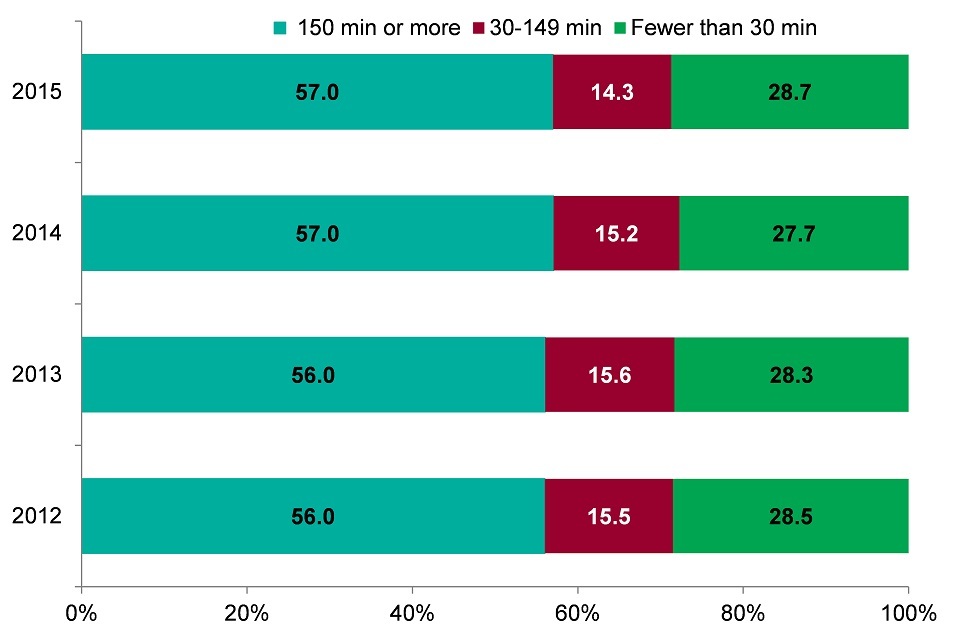
Figure 12. Proportion of the population aged 16 and over getting the recommended 150 minutes of physical activity per week in England (2012-2015) [Source: Physical Activity Profile]
This shows:
- over half of adults had the recommended 150 minutes of at least moderate intensity physical activity each week
- more than a quarter of adults had fewer than 30 minutes of physical activity per week
- there has been no change in activity levels since 2012
Figure 13: the proportion of adults diagnosed with hypertension in England (2009 to 2010 up to 2015 to 2016)
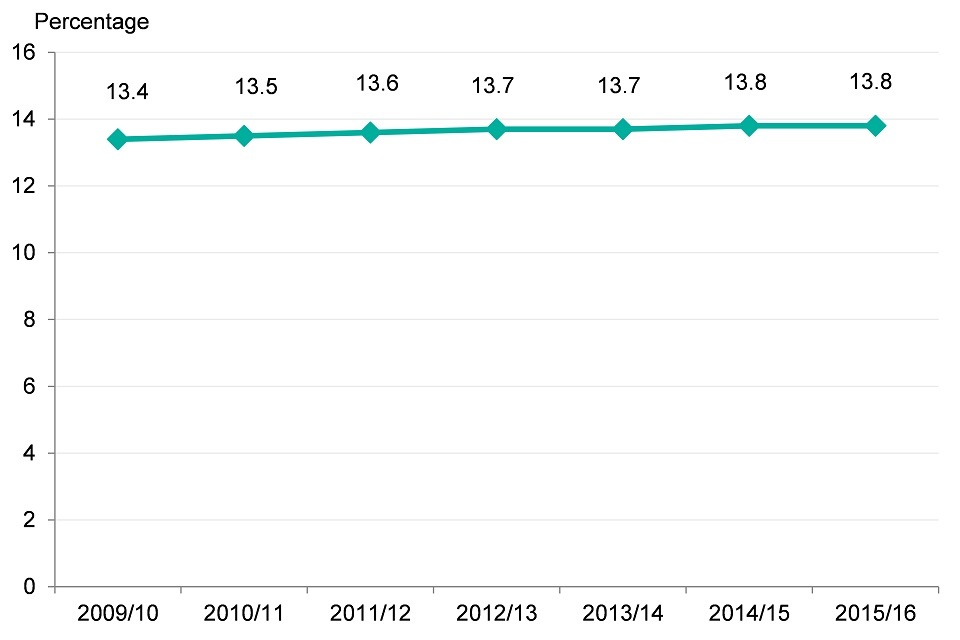
Figure 13. Proportion of adults diagnosed with hypertension in England (2009/10-2014/15) [Source: Cardiovascular disease profiles, PHE]
This shows:
- there has been a slight increase in the proportion of adults diagnosed with hypertension in England
- Overall, the proportion increased from 13.4% in 2009 to 2010 up to 13.8% in 2015 to 2016
8. Further information
The GBD 2013 model has been used in this chapter to identify those conditions that contribute most to morbidity in England and their associated risk factors. Morbidity measures are very important for understanding the demand for health and social care services. For European comparisons on morbidity, see chapter 4. The major causes of death and changes over time are discussed in chapter 2.
The GBD collects data from over 80,000 data sources from countries across the world. These are used as inputs for the GBD modelling methodology to produce comparative estimates of death and disability.
More information on the GBD study is available from the Institute of Health Metrics and Evaluation website.
9. Definitions
Years lived with disability
Years lived with disability (YLD) is a measure that summarises levels of poor health and disability in a given population. It combines the prevalence of each disease with a rating for the severity of its symptoms.
Definition: YLD is a measure of poor health or morbidity. For a particular year, the YLDs associated with a given disease or condition are calculated in 3 steps:
- the symptoms and disabilities associated with the disease are identified (each known as a ‘sequelae’ for the disease)
- the prevalence of each of the associated sequelae is multiplied by a ‘disability weight’ for the sequelae capturing its severity. Disability weights represent the magnitude of health loss associated with each sequelae. The weights are measured on a scale from 0 to 1, where 0 equals a state of full health and 1 equals death
- these figures for each sequelae associated with the disease or condition are then summed to give an overall estimate of the morbidity associated with the disease
This means, for example, that conditions with a low severity but high prevalence are comparable with conditions with a low prevalence and high severity, in terms of overall loss of quality of life. The YLD measure is used throughout this chapter to describe the non-fatal burden and is referred to as morbidity. Better health is associated with fewer years lived in disability.
10. Data notes
This chapter reports results from the GBD Study 2013, providing consistency with the Lancet article Changes in health in England, with analysis by English regions and areas of deprivation, 1990 to 2013: a systematic analysis for the Global Burden of Disease Study 2013.
Confidence intervals are produced for each indicator to support the interpretation of the data. Wide confidence intervals are not unusual with modelled data and do not invalidate the outputs for a single country. The GBD study provides an indication of the burden of morbidity and mortality.
The data from the study is made available via the Institute of Health Metrics and Evaluation’s web data visualisation tool.
Grouping of diseases for analysis
The International Classification of Disease (ICD10) lists over 10,000 codes for diseases, disorders, conditions, injuries and complaints. The GBD study groups these codes to simplify analyses, and takes a hierarchical approach
There are 4 levels in the hierarchy. Level 1 groups conditions into 3 broad categories; communicable, non-communicable and injuries. Level 2 has 21 disease groups, that link back to level 1, level 3 links back to level 2 and level 4 links back to level 3. The list of diseases at each level is available from the Institute of Health Metrics(IHME).
11. References
-
ONS. (2016) ONS Population Estimates for UK, England and Wales, Scotland and Northern Ireland. Accessed 18 June 2017. ↩
-
ONS (2016) Estimates of the very old (including centenarians), UK: 2002 to 2015 (Online. Office for National Statistics. Accessed 18 June 2017. ↩
-
Golay A, Ybarra J. (2005) Link between obesity and type 2 diabetes. Best Practice & Research Clinical Endocrinology & Metabolism 19: 649 to 663. ↩
-
Neuburger J, Currie C, Wakeman R, Tsang C, Plant F, De Stavola B, Cromwell DA, van der Meulen J. (2015) The impact of a national clinician-led audit initiative on care and mortality after hip fracture in England: an external evaluation using time trends in non-audit data. Med Care 53: 686 to 691. ↩
-
Department of Health. (2012) Long Term Conditions Compendium of Information. 3rd edition. ↩
-
The Marmot Review Team (2010). The Marmot Review: Fair Society, Healthy lives. ↩
-
de Oliveira FF, Bertolucci PHF, Chen ES, Smith MC. (2014), Risk factors for age at onset of dementia due to Alzheimer’s disease in a sample of patients with low mean schooling from São Paulo, Brazil, International Journal of Geriatric Psychiatry 29: 1033-1039. doi: 10.1002/gps.4094. ↩
-
Public Health England. (2016) Public Health Outcomes Framework online tool. ↩