Chapter 2: trends in mortality
Published 11 September 2018

© Crown copyright 2018
This publication is licensed under the terms of the Open Government Licence v3.0 except where otherwise stated. To view this licence, visit nationalarchives.gov.uk/doc/open-government-licence/version/3 or write to the Information Policy Team, The National Archives, Kew, London TW9 4DU, or email: psi@nationalarchives.gov.uk.
Where we have identified any third party copyright information you will need to obtain permission from the copyright holders concerned.
This publication is available at https://www.gov.uk/government/publications/health-profile-for-england-2018/chapter-2-trends-in-mortality
1. Main messages
The overall age-standardised mortality rate in England, for both males and females, declined between 2001 and 2016. However, since 2011 the rates have fluctuated and the rate of improvement has reduced. This is reflected in the forecasts of mortality rates for 2023 which show that it is unclear what the future trend will be. This finding is consistent with the analysis of the trend in life expectancy in Chapter 1.
Age-specific mortality rates declined in all age groups between 2001 and 2016. However, in some age groups the rate has fluctuated in more recent years and the rate of improvement has reduced since 2011. Mortality rates in those aged 20 to 24 years through to 30 to 34, 40 to 44 through to 55 to 59, and 65 to 69 all increased between 2015 and 2016. However, none of these increases were statistically significant. Mortality rates for those aged over 75 years significantly increased between 2014 and 2015 but fell between 2015 and 2016, and returned to levels more similar to previous years.
In 2016 the most common cause of death in males was heart disease, accounting for 13.6% of deaths. The most common cause of death in females was dementia and Alzheimer’s disease, accounting for 15.8% of deaths.
The mortality rate from dementia and Alzheimer’s disease in males and females has increased steadily since 2006. The reasons for this are not clear, but increased awareness of dementia, making it more likely to be diagnosed and recorded, is a factor. Forecasts for 2017 to 2023 show that mortality rates from dementia and Alzheimer’s are expected to continue to increase for both males and females. For males, it is estimated that the rate may overtake heart disease as early as 2020 if heart disease mortality rates continue to fall.
Falling mortality rates from heart disease were the biggest cause of increases in life expectancy between 2001 and 2016. However, between 2011 and 2016, improvements in heart disease mortality reduced and rising mortality from dementia offset these gains in life expectancy by 0.2 years in males and 0.3 years in females. These are the causes that have made the biggest contribution to the reduction in the rate of improvement in life expectancy since 2011.
Drug misuse deaths increased between 2012 and 2016. There were nearly 2,400 drug misuse deaths in England in 2016, an increase of 3.6% on the year before and the highest figure on record. This rise has been linked to heroin and opioid use, and heroin-related deaths doubled over the period 2012 to 2016. Data for 2017 showed a decline in the rate of drug misuse deaths for the first time in 5 years.
The premature mortality rate in people with a serious mental illness (SMI) such as bipolar disorder or schizophrenia was 3.7 times higher than that of the general population in the financial year 2014 to 2015. This gap has widened since 2009 to 2010 and the mortality rate for people with an SMI has increased.
The burden of premature death in males in the UK was ranked 10th lowest among the 28 countries of the EU and was significantly lower than the EU average in 2016. However, for females, it was ranked 18th lowest and was significantly higher than the EU average.
A range of causes contributed to this difference in EU rankings for male and female premature mortality, however, the greatest difference in rankings (15 places) was for premature cancer mortality. For premature cancer mortality, the UK was ranked 8th lowest for males and 23rd lowest for females in 2016. The comparatively high burden of female cancer mortality in the UK makes a substantial contribution to the poorer relative position of female mortality, compared with males, when ranked across the EU.
2. Introduction
Mortality rates have fallen over time for a wide range of causes. Advances in medical science and public health interventions, including better sanitation, vaccination, improved housing and living conditions and safer water, have led to changes in the causes of death from communicable diseases to non-communicable diseases[footnote 1],[footnote 2]. This has shifted deaths from younger to older ages (Chapter 1).
This chapter looks at mortality trends in England, it provides an update to last year’s Health Profile for England 2017 report, but also includes some additional analyses that were not presented last year.
3. Trends in mortality from all causes
Between 2001 and 2016 there was a significant decline in the age-standardised mortality rate for all causes of death combined, in both males and females (Figure 1). However, since 2011 the rate has fluctuated and the rate of improvement has reduced.
Between 2014 and 2015 the age-standardised mortality rate in males and females significantly increased by 3.1% and 5.1% respectively. The reduction in the rate of improvement and the increase in the death rate in 2015 are being further examined by PHE, but influenza is likely to have contributed to the increase in 2015[footnote 3]. Data for 2016 show that the rates have significantly decreased from 2015 for males and females by 2.6% and 3.0% respectively (Figure 1).
The time series for the age-standardised mortality rates from 2001 to 2016 were used as a basis for forecasts for 2017 to 2023 shown in Figure 1. The confidence limits around the forecasts reflect the uncertainty around the recent fluctuations and reduction in the rate of improvement in the trend. They have not been observed for long enough to be clear on what the future trends will be. The forecasts indicate that, for both sexes, the future trend is unclear.
Figure 1: trend in the age-standardised mortality rate, males and females, England, 2001 to 2016 and forecasts for 2017 to 2023
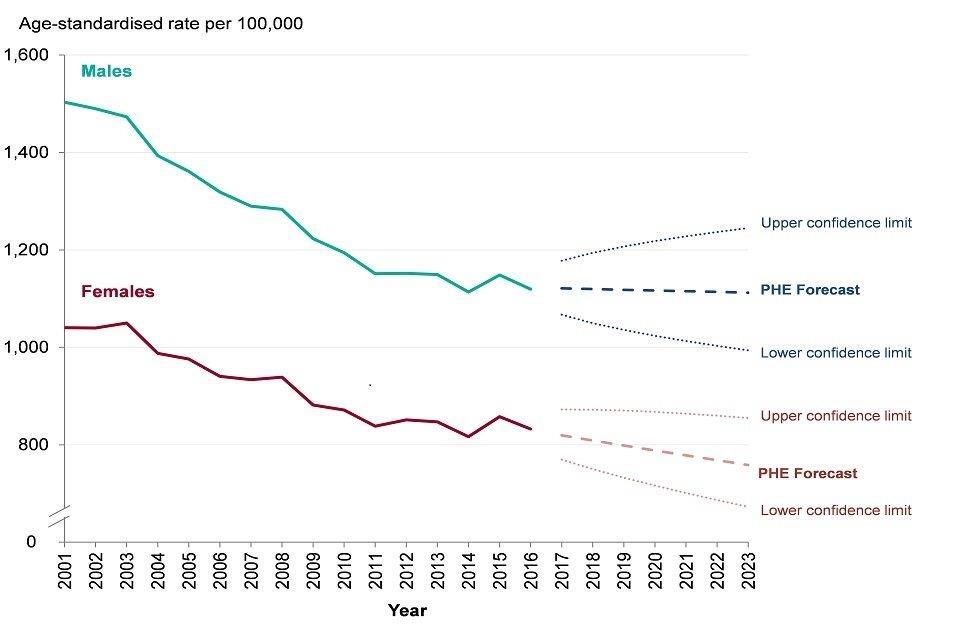
Figure 1: trend in the age-standardised mortality rate, males and females, England, 2001 to 2016 and forecasts for 2017 to 2023 [Source: PHE analysis of ONS Mortality data]
4. Trends in age-specific mortality rates
Figure 2 shows all-cause mortality rates by 5 year age bands from 2001 to 2016. Three different scales have been used to present the data to clearly show the trends over time in each age band.
Mortality rates declined in all age groups between 2001 and 2016. However, improvements in the mortality rate reduced from around 2011 (Chapter 1) and some age groups showed an increase between 2015 and 2016 (Figure 2). Death rates in those aged 20 to 24 years through to 30 to 34, 40 to 44 through to 55 to 59, and 65 to 69 all increased in 2016 compared with 2015 (Figure 2). The largest percentage increase between 2015 and 2016 was seen in those aged 30 to 34 years where the rate increased by 8.0%. However, none of the increases between 2015 and 2016 was statistically significant.
Mortality rates at 75 to 79 through to 90 years and over significantly increased between 2014 and 2015 but fell between 2015 and 2016, and returned to levels more similar to previous years (Figure 2). The infant mortality rate, although not included in Figure 2, has also declined over time. Infant mortality is discussed further in Chapter 4.
Figure 2: trend in the age-specific mortality rate by age, persons, England, 2001 to 2016
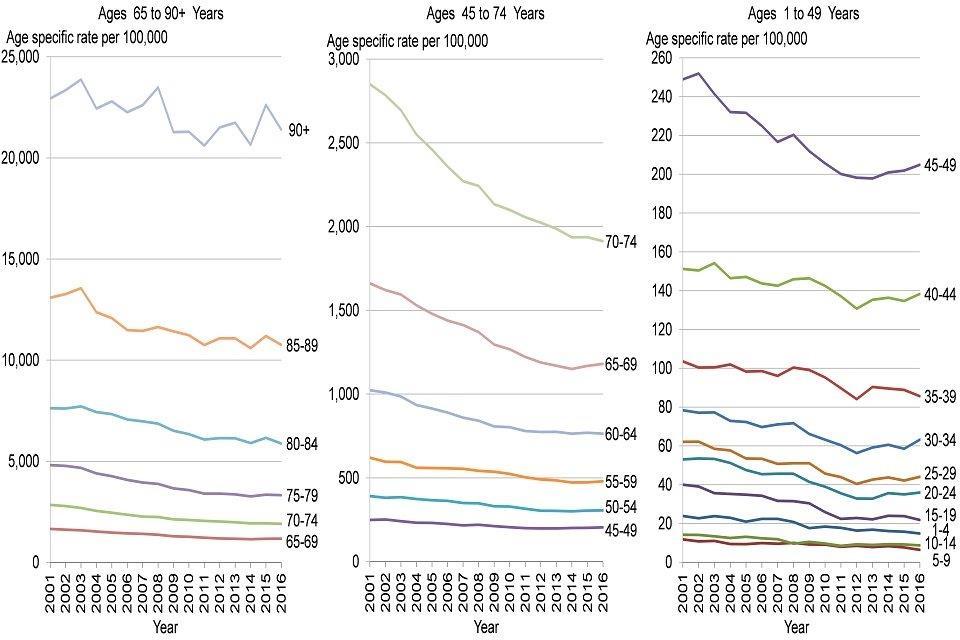
Figure 2: trend in the age-specific mortality rate by age, persons, England, 2001 to 2016 [Source: PHE analysis of ONS Mortality data]
5. Leading causes of death in 2016
The Health Profile for England 2017 report identified heart disease and dementia and Alzheimer’s as the most common underlying causes of death in males and females respectively and this remained the case in 2016 (Table 1).
The list of the most common site-specific cancers remained unchanged from 2015 in both sexes. Lung cancer, colorectal and anal cancer, and leukaemia and lymphomas were all in the top ten leading causes of death in 2016.
Prostate cancer and breast cancer remained amongst the top ten leading causes of death for males and females respectively, both ranked seventh, the same as in 2015. Lung cancer deaths remained the third most common cause of death for males and sixth most common for females in 2016.
When deaths from all cancers are grouped together, cancer accounted for 25.6% of all deaths in females and 30.3% of all deaths in males in 2016. This would make it the leading cause, in 2016, for both sexes.
Table 1: leading causes of death, males and females, England, 2016
| Males | Females | ||||
|---|---|---|---|---|---|
| Rank | Cause | Percentage (%) of all deaths | Cause | Percentage (%) of all deaths | |
| 1 | Heart disease | 13.6% | Dementia and Alzheimer’s disease | 15.8% | |
| 2 | Dementia and Alzheimer’s disease | 8.3% | Heart disease | 8.3% | |
| 3 | Lung cancer | 6.5% | Stroke | 7.0% | |
| 4 | Chronic lower respiratory diseases | 6.1% | Chronic lower respiratory diseases | 5.8% | |
| 5 | Stroke | 5.4% | Influenza and pneumonia | 5.5% | |
| 6 | Influenza and pneumonia | 4.8% | Lung cancer | 5.2% | |
| 7 | Prostate cancer | 4.1% | Breast cancer | 3.8% | |
| 8 | Colorectal and anal cancer | 3.1% | Colorectal and anal cancer | 2.5% | |
| 9 | Leukaemia and lymphomas | 2.6% | Leukaemia and lymphomas | 1.9% | |
| 10 | Cirrhosis and other diseases of liver | 2.0% | Kidney disease and other diseases of the urinary system | 1.8% |
Source: NOMIS
In 2016 the most common cause of death between ages one and 9 years in both sexes was congenital anomalies (Figures 3 and 4). Brain cancer, acute respiratory diseases, and leukaemia and lymphomas were also common causes of death in persons under 20 years. However, the number of deaths, from any cause, in childhood was small and therefore the leading causes vary from year to year.
Infant mortality has not been included in the analysis because deaths under 28 days do not record an underlying cause of death in the same way as those 28 days and over. Infant mortality is discussed in more detail in Chapter 4.
Deaths from external factors dominated the leading causes in those under the age of 50 years in 2016 (Figures 3 and 4). Suicide, including injury and poisoning of undetermined intent, was the leading cause of death in males and females aged 10 to 34 years, and in males aged 35 to 49 years. The Public Health Outcomes Framework showed that in the period 2014 to 2016 there were over 14,000 deaths from suicide, of which 75% were males. Accidental poisonings appeared in the top 5 leading causes of death for males and females aged 20 to 49 years and males aged 10 to 19 years.
The leading causes of death in those aged 35 years and over remained largely unchanged from 2015 (Figures 3 and 4). Deaths from heart disease, stroke, cancers and respiratory disease were leading causes from age 50 years in both sexes.
Liver disease was a common cause of death in both males and females between the ages of 20 and 64 years. In females, breast cancer was one of the common causes of death between the ages of 20 and 64 years, and in males, colorectal and anal cancer, and prostate cancer were common in the 50 to 64 and 65 to 79 age groups respectively. Lung cancer was the second most common cause of death in males and the most common in females aged 50 to 79 years.
In the 80 plus age group, the most common cause of death was dementia and Alzheimer’s disease in both sexes (Figures 3 and 4).
Figure 3: leading causes of death by age, males, England, 2016
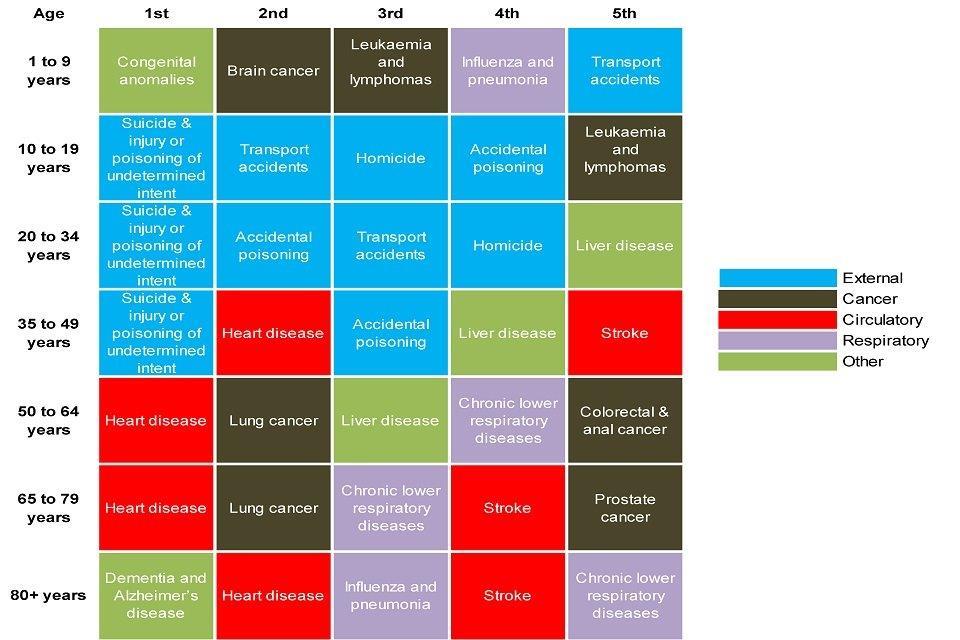
Figure 3: leading causes of death by age, males, England, 2016 [Source: NOMIS]
Figure 4: leading causes of death by age, females, England, 2016
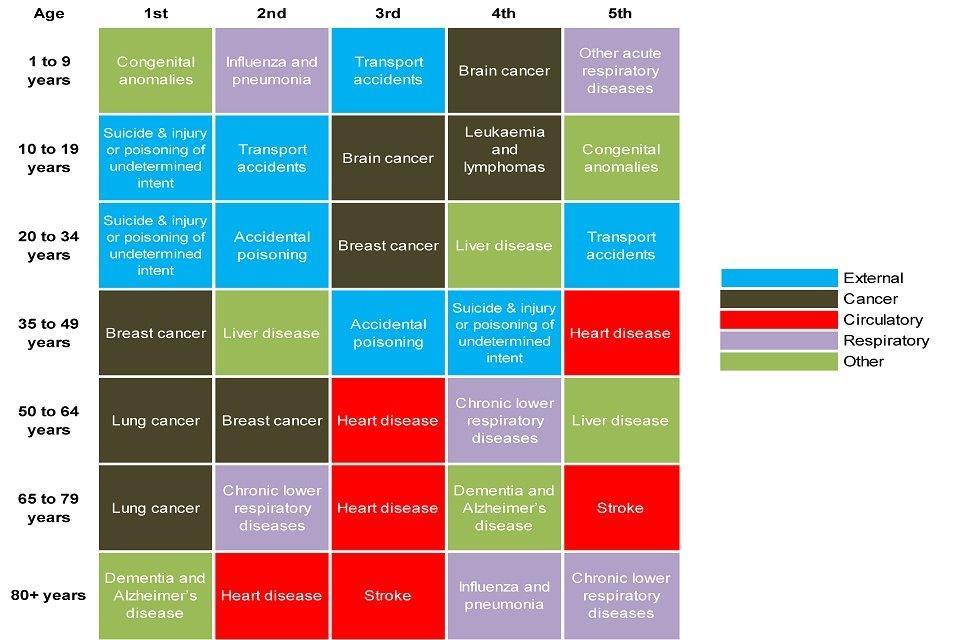
Figure 4: leading causes of death by age, females, England, 2016 [Source: NOMIS]
Notes: Deaths under 1 were not included in the analysis because only deaths at 28 days and over record on the death certificate using the International Statistical Classification of Diseases and Related Health Problems (ICD-10) recommended by the World Health Organisation (WHO). Neonatal deaths (under 28 days) are registered using a special death certificate which allows reporting of relevant diseases or conditions on both infant and mother.
In the youngest age group (1 to 9 years), the total number of deaths (male and female) was very small (630) and the total number of deaths for a given leading cause was similarly low; for example, 80 deaths were due to congenital malformations (47 males and 33 females).
In females aged 1 to 9 years, brain cancer and other acute respiratory diseases were ranked equally as the 4th most common cause of death.
6. Trends in the leading causes of death
The Health Profile for England 2017 outlined the trends in the leading causes of death from 2001 to 2015. The main findings showed a long-term decline in the death rate from heart disease, stroke and most major cancers, and an increase in dementia and Alzheimer’s for both males and females. This report updates this analysis to include data for 2016 (Figures 5 to 8).
Figures 5 and 6 show trends in the mortality rates from dementia and Alzheimer’s, heart disease and stroke for males and females respectively. A number of factors contributed to the increase in the death rates from dementia and Alzheimer’s disease including an increase in awareness of dementia and historical NHS policies encouraging GPs to diagnose, leading to increased recording on death certificates[footnote 4]. This means that, in recent years, deaths may have been classified as dementia that would not have been in the past.
In 2012, the mortality rate from dementia and Alzheimer’s among females overtook heart disease. The time series for mortality rates from 2001 to 2016 was used as a basis for forecasts for 2017 to 2023 and show that the mortality rates from dementia and Alzheimer’s may continue to rise (Figures 5 and 6). In males, it is estimated that the rate may overtake heart disease as early as 2020 if the heart disease mortality rate continues to fall (Figure 5).
Figure 5: trend in the age-standardised mortality rate from 3 leading causes of death, males, England, 2001 to 2016 and forecasts for 2017 to 2023
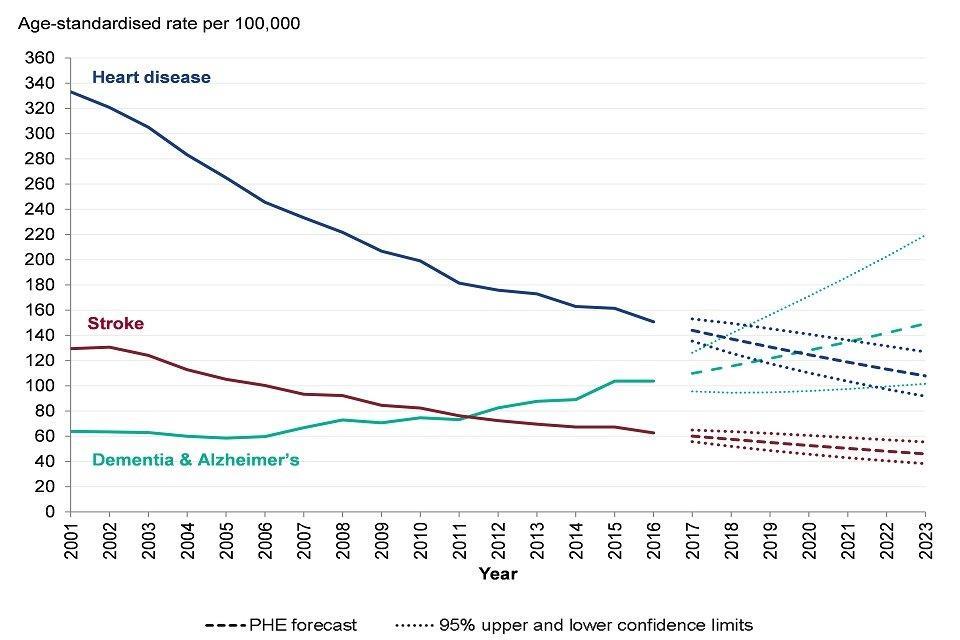
Figure 5: trend in the age-standardised mortality rate from three leading causes of death, males, England, 2001 to 2016 and forecasts for 2017 to 2023 [Source: PHE analysis of ONS Mortality data]
Figure 6: trend in the age-standardised mortality rate from 3 leading causes of death, females, England, 2001 to 2016 and forecasts 2017 to 2023
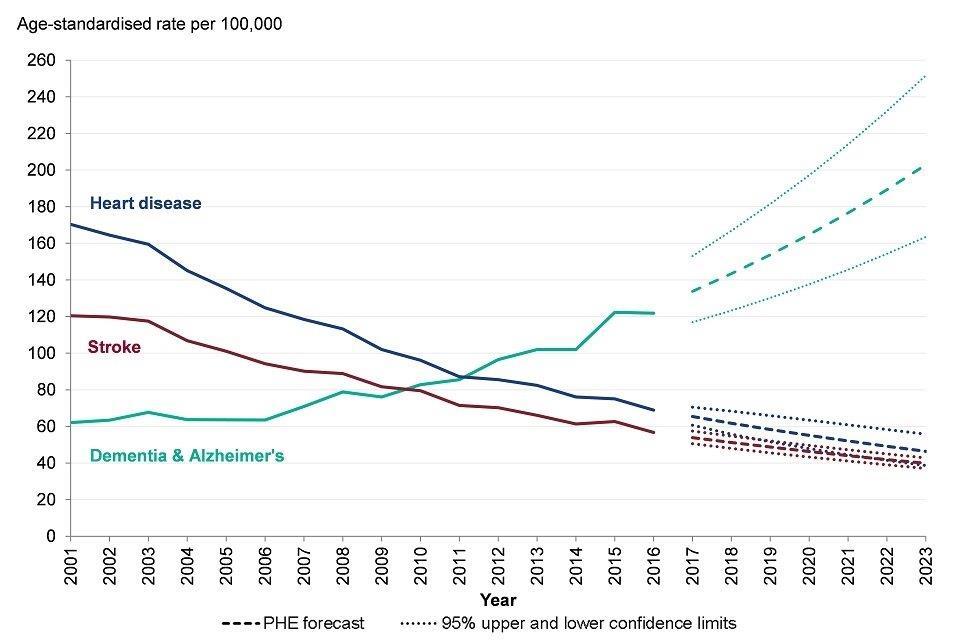
Figure 6: trend in the age-standardised mortality rate from three leading causes of death, females, England, 2001 to 2016 and forecasts 2017 to 2023 [Source: PHE analysis of ONS Mortality data]
Despite the long-term trends in dementia and Alzheimer’s, between 2015 and 2016 there was a decline in the mortality rate from most of the top ten leading causes in both males and females (Figures 5 to 8). The exceptions were cirrhosis and liver disease in males, which rose by 2.9% (Figure 7) and colorectal and anal cancer in females, which rose by 1.1% (Figure 8).
Table 1 highlighted lung cancer deaths as the third most common cause of death for males and the sixth most common for females in 2016. Although the rate in males has declined, in females there was an overall increase in the death rate from lung cancer between 2001 and 2016 (Figures 7 and 8). Between 2015 and 2016 there was a small reduction in the lung cancer death rate in females. It is too early to say if this is the start of a declining trend in the rates of lung cancer deaths in females.
The mortality rates from influenza and pneumonia have been declining for males and females since 2001 (Figures 7 and 8). Influenza immunisation has been recommended to those in clinical at risk groups since the late 1960’s but was extended to all persons aged 65 years and over in 2000[footnote 5]. Further extension of the programme to children occurred in 2013.
In 2015 the mortality rates from influenza and pneumonia increased. Low vaccine effectiveness was seen in winter 2014 to 2015, reflecting the mismatch between the viruses which were circulating and the main strain which had been included in the flu vaccine formula[footnote 6].
The trend in the chronic respiratory disease mortality rate in males between 2001 and 2016 showed an overall decline, however, there has been variability in the trend year on year (Figure 7). In females, the rate has also fluctuated and peaked in 2015.
Figure 7: trend in the age-standardised mortality rate from selected leading causes of death, males, England, 2001 to 2016
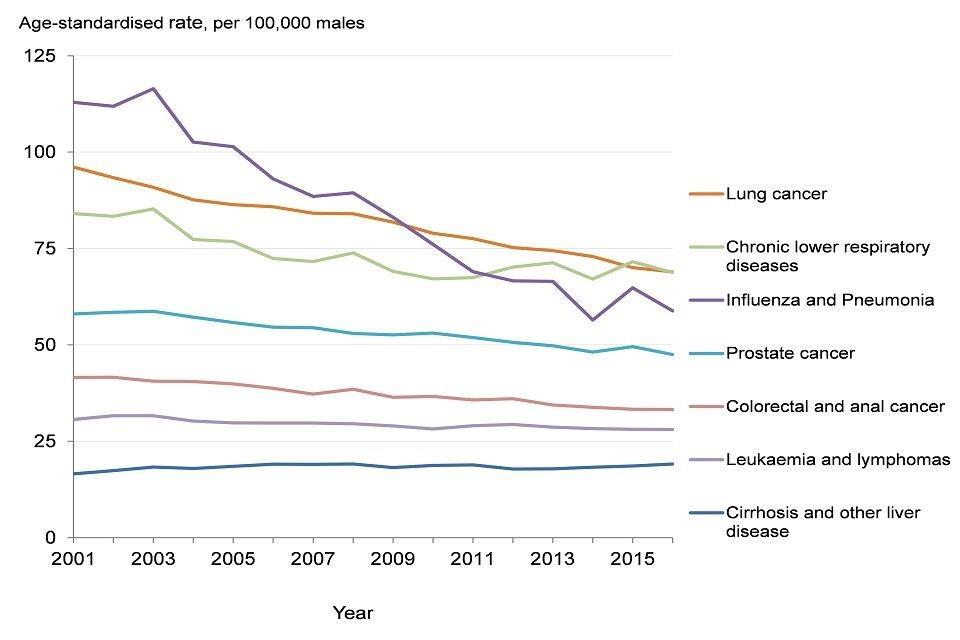
Figure 7: trend in the age-standardised mortality rate from selected leading causes of death, males, England, 2001 to 2016 [Source: PHE analysis of ONS mortality data]
Figure 8: trend in the age-standardised mortality rate from selected leading causes of death, females, England, 2001 to 2016
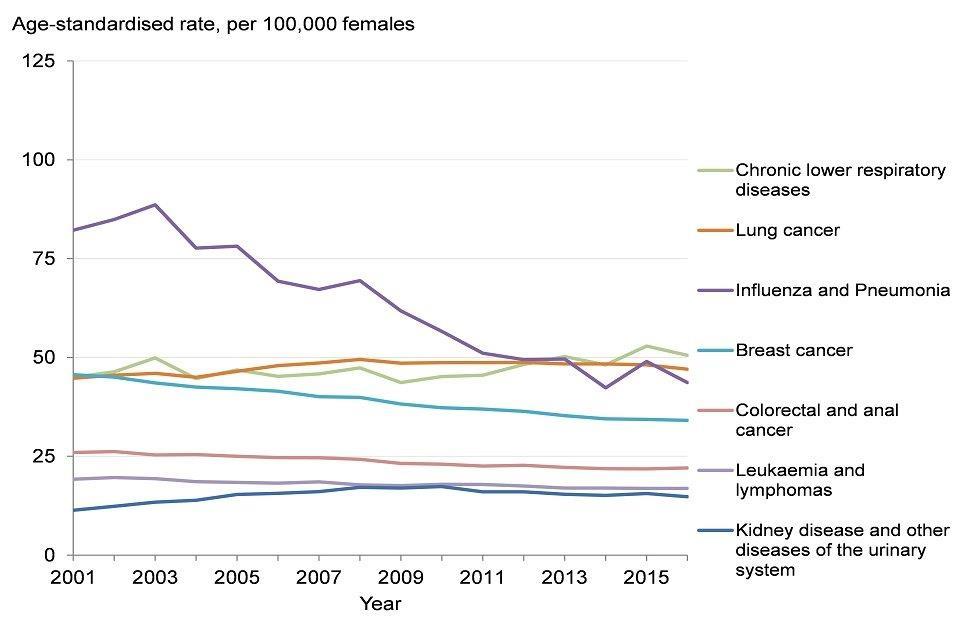
Figure 8: trend in the age-standardised mortality rate from selected leading causes of death, females, England, 2001 to 2016 [Source: PHE analysis of ONS mortality data]
7. Contribution of causes of death to trends in life expectancy
Chapter 1 discussed the analysis of the contribution of mortality in different age groups to changes in life expectancy over time. This chapter looks at the contribution the leading causes of death made to life expectancy gains over 3 six-year periods between 2001 and 2016. Life expectancy increased in males and females by 3.6 and 2.5 years respectively between 2001 and 2016.
Between 2001 and 2006, a reduction in mortality from several causes led to a 1.5 year increase in male life expectancy. The biggest contributors to gains in life expectancy were reductions in mortality rates from heart disease (adding around 0.7 years to life expectancy), stroke (adding 0.2 years) and other causes (adding 0.3 years) (Figure 9).
Between 2006 and 2011 male life expectancy increased by 1.6 years. Again the biggest contributors were reductions in mortality rates from heart disease, stroke and other causes which accounted for gains in life expectancy of 0.6, 0.2 and 0.6 years respectively. The increase in life expectancy was offset by 0.1 years due to a rise in mortality from dementia and Alzheimer’s (Figure 9).
Between 2011 and 2016 male life expectancy increased by 0.4 years. Reductions in mortality rates from heart disease still had a positive effect on life expectancy, adding 0.3 years, but this was a much smaller contribution than in previous years. Deaths from dementia and Alzheimer’s continued to offset gains in life expectancy but had a larger effect than in the preceding period, offsetting life expectancy gains by 0.2 years (Figure 9).
The ‘other’ group comprised of deaths from a wide range of causes and further examination did not reveal a dominant cause that contributed to the change in life expectancy in males.
Figure 9: contribution of causes of death to changes in life expectancy, males, England, 2001 to 2006, 2006 to 2011 and 2011 to 2016
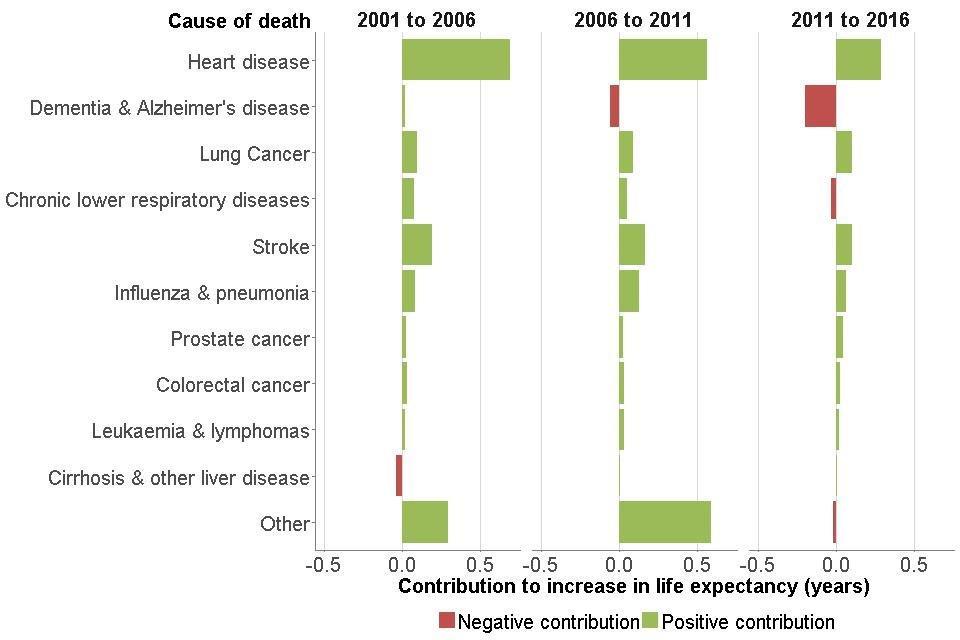
Figure 9: contribution of causes of death to changes in life expectancy, males, England, 2001 to 2006, 2006 to 2011 and 2011 to 2016 [Source: PHE analysis of ONS Mortality data]
Between 2001 and 2006 female life expectancy at birth increased by 1.1 years. The biggest contributors to gains in life expectancy were a reduction in mortality rates from heart disease (adding 0.5 years), stroke (adding 0.2 years) and other causes (adding 0.3 years) (Figure 10).
Between 2006 and 2011 female life expectancy increased by 1.3 years. The biggest contributors were reductions in mortality from heart disease, stroke, influenza and pneumonia and other causes, accounting for gains in life expectancy of 0.4, 0.2, 0.2 and 0.5 years respectively. The increase in life expectancy was offset by 0.2 years due to a rise in mortality from dementia and Alzheimer’s (Figure 10).
By 2016 the leading cause of death in females was dementia and Alzheimer’s (Table 1). The effect that rising mortality rates from dementia and Alzheimer’s had on life expectancy between 2011 and 2016 is shown in Figure 10. Rising dementia and Alzheimer’s mortality offset gains in life expectancy by 0.3 years. Reductions in mortality rates from heart disease still contributed the biggest gains in life expectancy (adding 0.2 years), but the contribution was smaller than in previous years and female life expectancy only improved by 0.1 years between 2011 and 2016.
The ‘other’ group comprised of deaths from a wide range of causes and further examination did not reveal a dominant cause that contributed to the change in life expectancy in females.
Figure 10: contribution of causes of death to changes in life expectancy, females, England, 2001 to 2006, 2006 to 2011 and 2011 to 2016
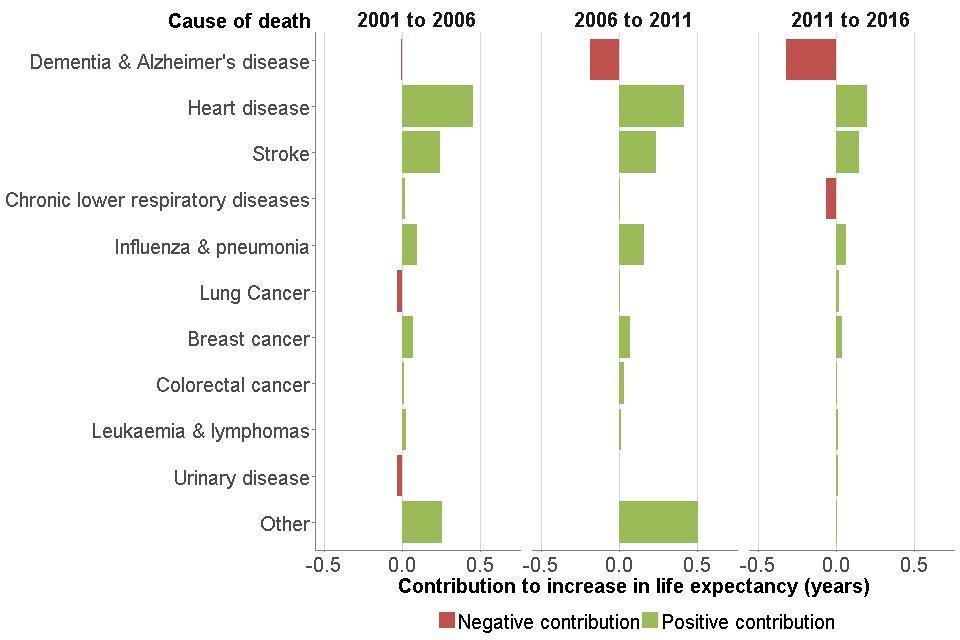
Figure 10: contribution of causes of death to changes in life expectancy, females, England, 2001 to 2006, 2006 to 2011 and 2011 to 2016 [Source: PHE analysis of ONS Mortality data]
8. Premature mortality
Figure 11 describes trends in premature mortality rates (in those under 75 years) from all causes, and two of the main causes of death in the under 75s, cardiovascular disease (heart disease and stroke) and cancer. As the numbers of deaths by cause in those under 75 is relatively small and subject to significant variation year to year, the data are considered on a three-year rolling average basis.
There was a steady reduction in the rate of deaths in those under 75 years. From the period 2001 to 2003, rates for overall premature mortality reduced by 28% for males and 24% for females by 2014 to 2016. Reductions in overall premature mortality, however, slowed down from 2011 to 2013 for both sexes (Figure 11).
Mortality rates from cardiovascular disease in those under 75 have almost halved from 2001 to 2003 (Figure 9). However, from 2014 to 2016, over 100,000 people under 75 years died from cardiovascular disease which accounted for around 22% of all premature deaths[footnote 7].
The Health Profile for England 2017 reported that behavioural risk factors such as poor diet, smoking and low physical activity, along with high blood pressure, high body mass index and high cholesterol are the main risk factors for cardiovascular disease. Therefore a large proportion of these premature deaths are preventable[footnote 8],[footnote 9]. Chapter 3 presents information on trends in these risk factors.
Mortality rates from cancer in the under 75s have been falling year on year in both sexes and have reduced by 21% in males and 17% in females since the period 2001 to 2003. When all cancers are combined, they were the largest cause of death in persons under 75, responsible for nearly 187,500 deaths in the period 2014 to 2016. Like cardiovascular disease, behavioural risk factors contribute significantly to the risk of cancer, the largest contributor being smoking[footnote 9].
Figure 11: trend in the age-standardised mortality rate in people aged under 75 years, males and females, 2001 to 2003 to 2014 to 2016, England
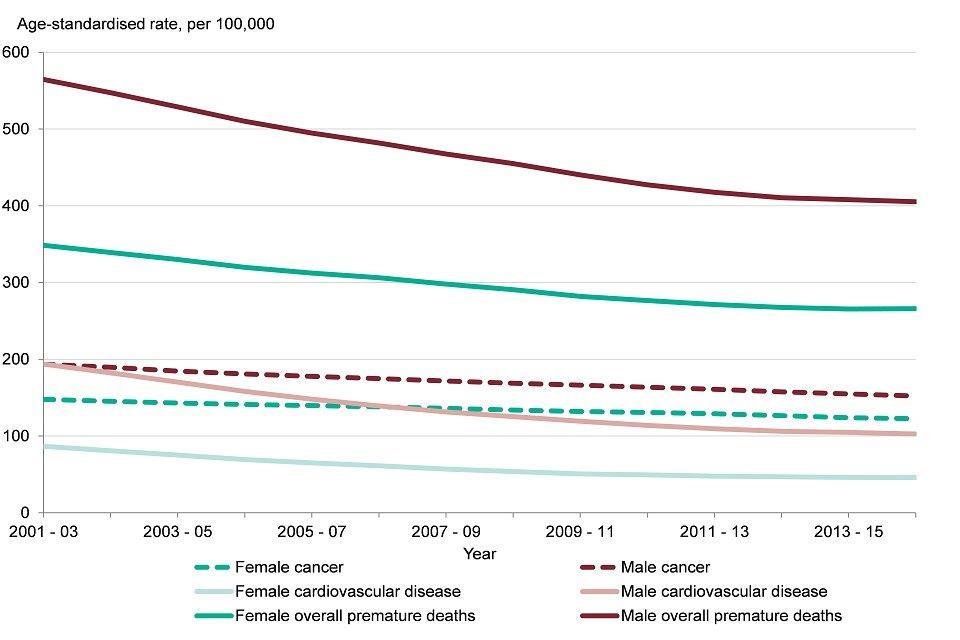
Figure 11: trend in the age-standardised mortality rate in people aged under 75 years, males and females, 2001 to 2003 to 2014 to 2016, England [Source: Public Health Outcomes Framework]
See how your area compares:
9. Premature mortality among people with serious mental illness (SMI)
Premature mortality rates among people with an SMI such as bipolar disorder or schizophrenia were 3.7 times higher than the general population in the financial year 2014 to 2015[footnote 10]. This gap has widened in recent years (from 3.3 in the financial year 2009 to 2010)[footnote 10], largely due to increases in the mortality rate in those with an SMI[footnote 10].
Premature mortality rates in people with an SMI were higher than the general population for many of the leading causes of death, including cardiovascular disease, cancer, respiratory disease and liver diseases. In 2014 to 2015, the gap was wider for deaths from respiratory disease and liver disease mortality. The premature mortality rates were 4.7 and 5.0 times greater in those with an SMI respectively[footnote 10]. However, as with the general population, there were more premature deaths among people with SMI from cardiovascular disease and cancer than the other causes[footnote 10].
These findings in part reflect the higher levels of smoking and substance misuse including alcohol[footnote 12] in those with an SMI.
10. Drug misuse deaths
The number and rate of drug misuse deaths have risen sharply in recent years. In England, there were almost 2,400 drug misuse deaths in 2016, an increase of 3.6% on the previous year, and an increase of 60% since 2012[footnote 13] (Figure 12).
The rise has been linked to heroin and opioid use, and heroin-related deaths doubled between 2012 and 2016. Two factors have been identified that may be responsible for the increase: the increased availability and purity of heroin, alongside an ageing population of heroin users in poorer health. In addition, spikes in deaths related to the use of illicit fentanyl have also been identified[footnote 13]. PHE has published guidance to support local areas in tackling this[footnote 14]. New data for 2017 shows that the number and rate of drug misuse deaths fell slightly from 2016, the first fall in 5 years[footnote 17].
Drug misuse can increase the likelihood of individuals developing mental illness or make symptoms of mental illness worse[footnote 12]. For some conditions the relationship is bi-directional, where poor mental health can lead to drug misuse and vice versa. Around 70% of people accessing drug services have experienced mental health problems and more than half (54%) of suicides among patients accessing mental health services occurred among those with a history of either drug or alcohol misuse[footnote 15] .
Figure 12: trend in the number of deaths and age-standardised mortality rate for deaths related to drug misuse, persons, England, 2001 to 2016
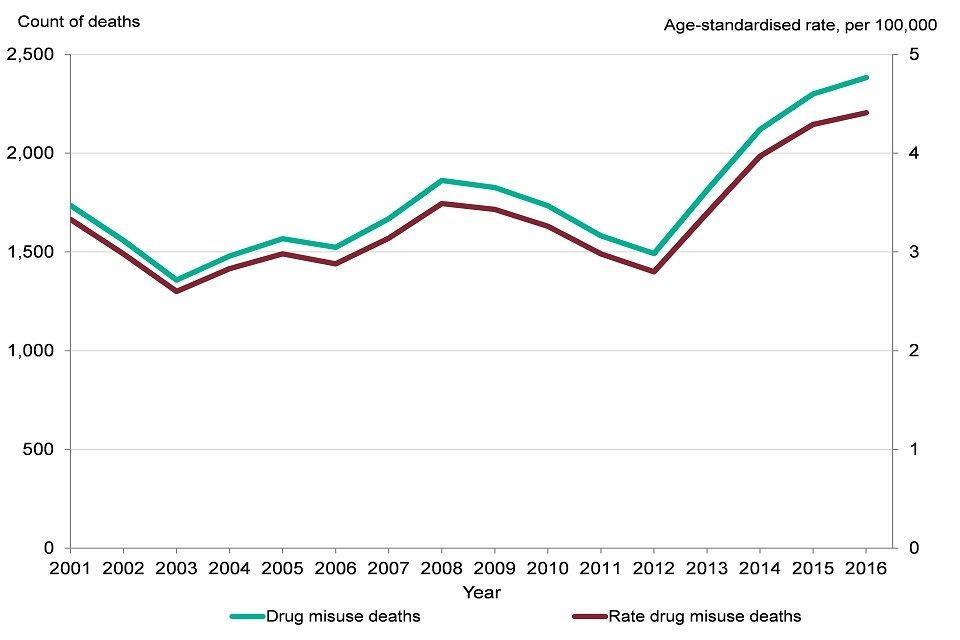
Figure 12: trend in the number of deaths and age-standardised mortality rate for deaths related to drug misuse, persons, England, 2001 to 2016 [Source: ONS]
11. Deaths from neurological conditions
Neurological conditions result from damage to the brain, spinal column or nerves, caused by illness or injury[footnote 16]. In 2014, there were nearly 32,000 deaths of people aged 20 years and over with a mention of a neurological condition on their death certificate. This represented 7% of all deaths in England. The specific conditions included are listed in the Methods, data and definitions section. Only half of these deaths had a neurological condition listed as the underlying cause of death, the remainder had one listed as a contributory cause of death.
The number of deaths with a neurological condition as an underlying or contributory factor increased by 39% between 2001 and 2014.
There is likely to have been a number of factors contributing to this increase. This includes a reduction in mortality from other leading causes (leading to population ageing) and more neurological conditions being identified in an ageing population. However, improvements in the detection and diagnosis practices and a greater awareness of neurological conditions among healthcare professionals will also have contributed.
In addition to the increase in the number of deaths, the resulting death rate for any mention of a neurological condition also increased from 71.0 per 100,000 population in - 2003 to 2005, to 79.8 per 100,000 population in - 2012 to 2014), a rise of 12%.
12. European comparisons
The Global Burden of Disease study (GBD) 2016[footnote 9] uses the age-standardised rate of years of life lost (YLL) to measure the burden of premature death across a population. It gives an indication of the effect a disease has on lifespan. This chapter provides an update on the analysis presented in the Health Profile for England 2017.
Among the 28 countries of the European Union (EU), in 2016, the male burden of premature death in the UK was 18% higher than the country with the lowest burden, Luxembourg. The UK was ranked 10th lowest burden out of the 28 EU countries, the same as in 2015, and the burden was significantly lower than the EU average (Figure 13).
The female burden of premature death in the UK was 42% higher than for Spain, the country with the lowest burden. The UK ranked 18th lowest out of the EU countries, no change from 2015, and the burden was significantly higher than the EU average (Figure 14).
In 2016 over half of the burden of premature deaths in EU countries was due to cancers and cardiovascular diseases (heart disease and stroke) (Figures 13 and 14).
For the male burden of cardiovascular disease, the UK was ranked 10th lowest. The burden was significantly lower than the EU average but 36% higher than the country with the lowest burden, France. For male cancer burden, the UK was ranked 8th. The burden was significantly lower than the EU average but 31% higher than Finland, the country which had the lowest burden (Figure 13).
For females in the UK, the burden of cardiovascular disease was ranked 9th lowest out of the EU countries, was significantly lower than the EU average but 49% higher than France, which had the lowest burden. However, for the cancer burden, the UK was ranked 23rd, the burden was significantly higher than the EU average and 42% higher than Spain, which had the lowest cancer burden (Figure 14).
UK females ranked lower than UK males across the EU for a wide range of causes. However, for premature cancer mortality, the UK was ranked 8th lowest for males and 23rd lowest for females in 2016, a difference in rankings of 15 places. Although the burden from cancer was greater in UK males than females, cancer made a substantial contribution to the overall poorer relative position of UK females compared to males across the EU.
Compared with other countries of the UK, England had the lowest burden of premature mortality from all causes, cardiovascular disease and cancer in both males and females, however, the majority of these differences were not statistically significant.
Figure 13: age-standardised years of life lost rate, males, EU and UK countries, 2016
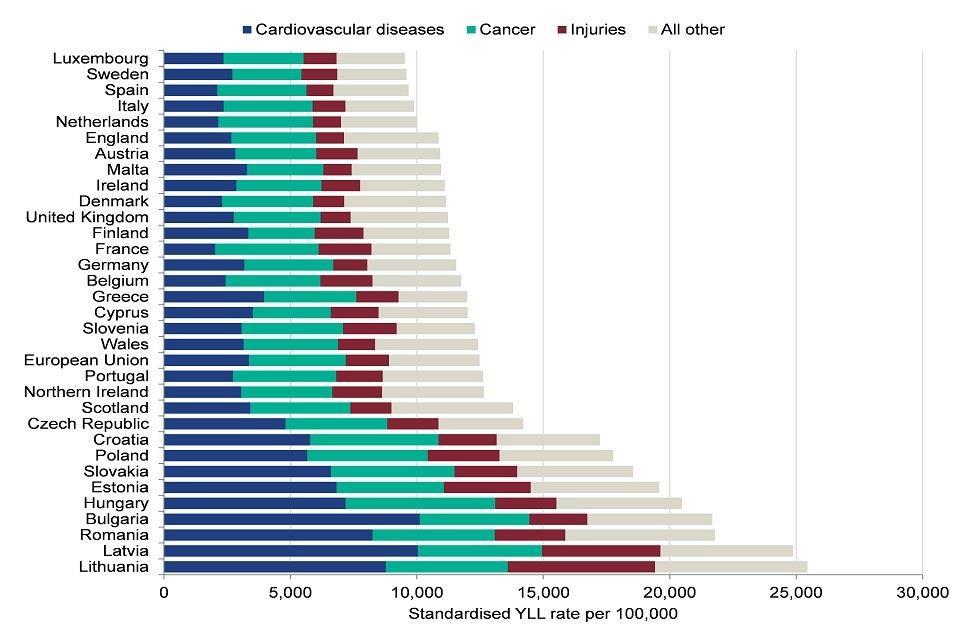
Figure 13: age-standardised years of life lost rate, males, EU and UK countries, 2016 [Source: Global Burden of Disease study 2016]
Figure 14: age-standardised years of life lost rate, females, EU and UK countries, 2016
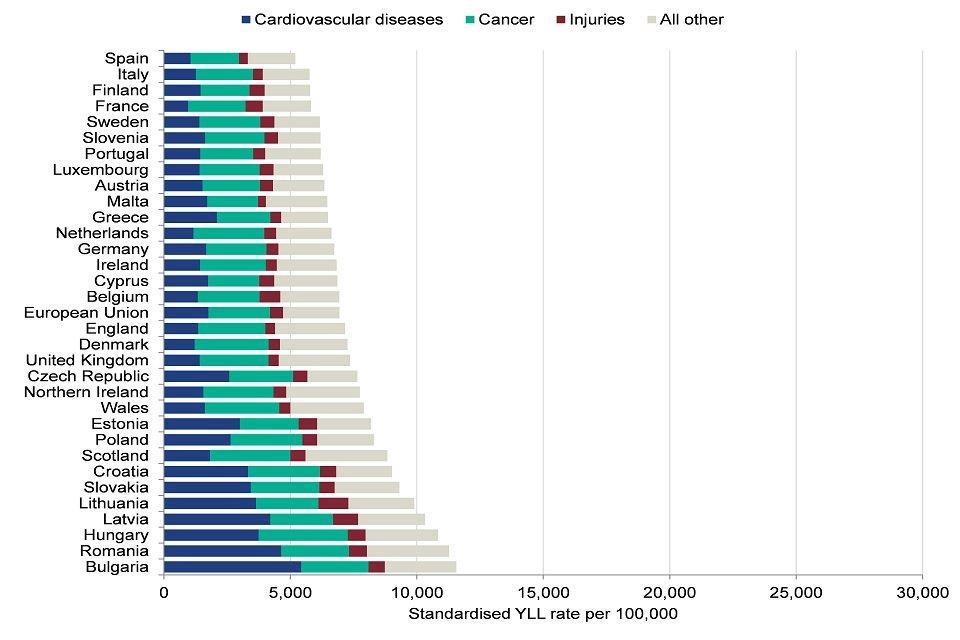
Figure 14: age-standardised years of life lost rate, females, EU and UK countries, 2016 [Source: Global Burden of Disease study 2016]
13. Further information
This chapter focused on trends in mortality by age, sex and cause in England. However, mortality rates vary within England across different populations. There are differences in mortality relating to socioeconomic status, ethnicity, geographical area and other social factors. Mortality rates tend to be higher in more deprived areas and Chapter 5 looks closely at the relationship between health outcomes and deprivation.
Trends and causes of death in the population are also influenced by a broad range of risk factors. The Global Burden of Disease (GBD) model[footnote 9] identifies the behavioural, metabolic and environmental risk factors contributing to deaths in each age group and by each cause. The risk factors contributing to the highest proportion of overall deaths outlined in the Health Profile for England 2017 were obesity and tobacco smoking. Chapter 3 discusses these risk factors in more detail.
14. References
-
ONS (2017) Causes of death over 100 years. Accessed 13 June 2018. ↩
-
Baillie L, Hawe E (2012) Causes of Death: A Study of a Century of Change in England and Wales. Office of Health Economics. Accessed 10 May 2018. ↩
-
Baker A, Ege F and others. (2018) Response to articles on mortality in England and Wales. Journal of the Royal Society of Medicine. Accessed 9 July 2018. ↩
-
NHS England (2014) Enhanced Service Specification Dementia Identification Scheme. NHS England. Accessed 6 June 2018 ↩
-
PHE (2017) Influenza: the green book, Chapter 19. Accessed 9 July 2018. ↩
-
Public Health England (2015) Surveillance of influenza and other respiratory viruses in the United Kingdom: winter 2014 to 2015. Accessed 9 July 2018. ↩
-
BHF (2017) BHF CVD Statistics Factsheet England. British Heart Foundation. Accessed 26 April 2018. ↩
-
Institute of Health Metrics and Evaluation (2018) Global Burden of Disease Study 2016 ↩ ↩2 ↩3 ↩4
-
NHS Digital (2016) NHS Outcomes Framework - Indicator 1.5.i, Excess under 75 mortality rate in adults with serious mental illnes. Accessed 6 June 2018. ↩ ↩2 ↩3 ↩4 ↩5
-
Turning Point (2016) Duel Dilemma. The impact of living with mental health issues combined with drug and alcohol misuse. Accessed 11 May 2018. ↩ ↩2
-
ONS (2017) Deaths related to drug poisoning in England and Wales: 2016 registrations. Office for National Statistics. Accessed 11 May 2018. ↩ ↩2
-
PHE (2017) Public health matters: Fentanyl: What’s being done to mitigate future problems. Accessed 13 June 2018. ↩
-
ONS (2018) Deaths related to drug poisoning in England and Wales. Accessed 5 September 2018. ↩
-
Health Quality Improvement Partnership (2016) The National Confidential inquiry into Suicide and Homicide by People with Mental Illness. Making Mental Health Care Safer: Annual Report and 20-year Review. Accessed 11 May 2018. ↩
-
The neurological alliance (2018) What is a neurological condition? Accessed 9 July 2018. ↩