Chapter 2: major causes of death and how they have changed
Published 13 July 2017

© Crown copyright 2017
This publication is licensed under the terms of the Open Government Licence v3.0 except where otherwise stated. To view this licence, visit nationalarchives.gov.uk/doc/open-government-licence/version/3 or write to the Information Policy Team, The National Archives, Kew, London TW9 4DU, or email: psi@nationalarchives.gov.uk.
Where we have identified any third party copyright information you will need to obtain permission from the copyright holders concerned.
This publication is available at https://www.gov.uk/government/publications/health-profile-for-england/chapter-2-major-causes-of-death-and-how-they-have-changed
1. Main messages
Since 2001, death rates from heart disease and stroke have halved for both males and females.
Over the same time period deaths from dementia and Alzheimer’s have increased by 60% in males and have doubled in females. This partly reflects the fact that the population is ageing and that two-thirds of deaths now occur among those aged 75 and over, but also an increased awareness of dementia.
In 2015, heart disease was the most common cause of death for males. It was the cause of 1.8 times as many deaths as the second leading cause of death: dementia and Alzheimer’s disease. For females, dementia and Alzheimer’s was the most common cause of death, followed by heart disease. For both males and females over 80, dementia and Alzheimer’s was the leading cause of death.
Cancers as a whole accounted for 30.0% of deaths in males and 24.8% of deaths in females in 2015. When considered separately, 4 of the 10 leading causes of death in males and females were cancers. For both sexes, lung cancer, colorectal cancer, and leukaemia and lymphomas were among the top 10 leading causes of death. Prostate cancer was also in the top causes of death for males, as was breast cancer for females.
In 2015, between ages 50 to 79, heart disease and cancers were the most common causes of death, and for those under 35, external causes, such as accidents and suicide, were the most common.
The trends and causes of death in the population are influenced by a broad range of factors. Using the Global Burden of Disease (GBD) model it is possible to identify the behavioural, metabolic and environmental risk factors contributing to deaths in each age group and also by each cause. The behavioural risk factors contributing to the highest proportion of deaths in 2013 were poor diet and tobacco smoking.
2. Introduction
Mortality rates have steadily fallen over time, both overall and for a range of causes. The resulting improvements in longevity reflect a shift in the leading causes of disease and death.
In the late 19th century, infectious diseases were the leading causes of death. It was predominantly infants and children that died from these diseases [footnote 1]. With the introduction of better sanitation, safer water, improved housing and diet, and the later routine immunisation against childhood killers, infectious diseases declined as a leading cause of death [footnote 2]. Life expectancy accelerated and subsequently, new patterns of disease and death emerged [footnote 3].
Non-communicable diseases have replaced communicable diseases as the leading causes of death, and unlike in centuries past, deaths have become concentrated in the older ages rather than in the younger [footnote 2].
3. Trends in leading causes of death
In the last 15 years, there has been a steady decline in the death rate from heart disease (ischaemic heart disease), stroke (cerebrovascular diseases) and most major cancers for both males and females (figure 1 and figure 2). Both genders have seen death rates reducing by around 50% for stroke and heart disease. However, males generally have higher death rates for these conditions, in particular, death rates for heart disease are twice as high for males as for females (figure 1 and figure 2).
3.1 Figure 1: trends in age-standardised mortality rates from leading causes of death, males, 2001 to 2015, England
For males, death rates from heart disease and stroke have halved since 2001, whereas the death rate from dementia and Alzheimer’s has increased
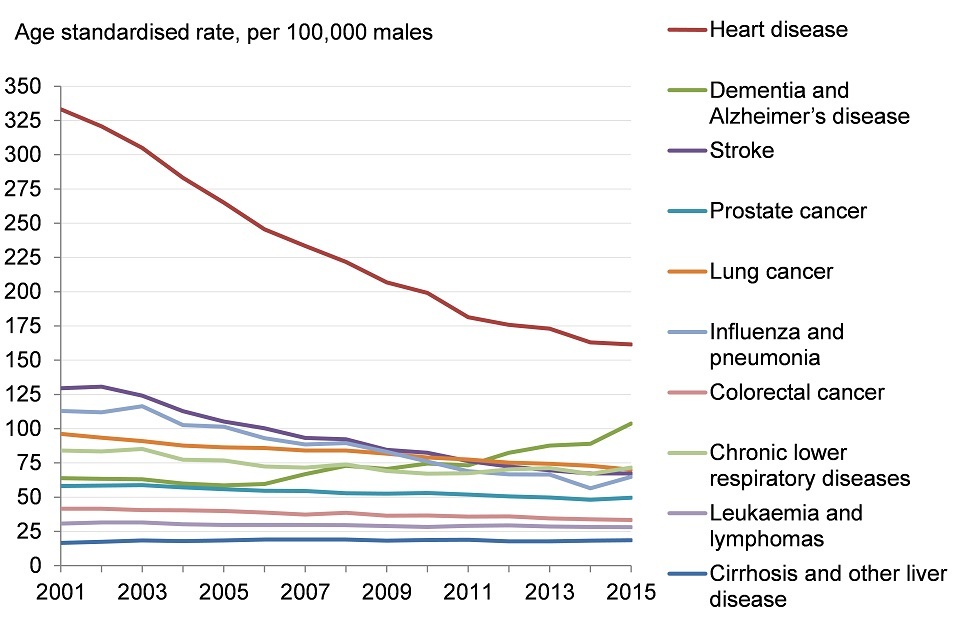
Figure 1. Trends in age standardised mortality rates from leading causes of death, males, 2001 to 2015, England [Source: PHE analysis of ONS mortality data]
3.2 Note: Data have been adjusted for coding changes.
This shows:
- for males, the death rates from heart disease (ischaemic heart disease) and stroke (cerebrovascular disease) have reduced by about 50% since 2001
- the death rate from lung cancer has reduced by almost a third
- there has been an increase in the death rate from dementia and Alzheimer’s of more than 60% and deaths from liver disease have increased by 12%
3.3 Figure 2: trends in age-standardised mortality rates from leading causes of death, females, 2001 to 2015, England
For females, the death rates from heart disease and stroke have halved since 2001, whereas the death rate from dementia and Alzheimer’s disease has doubled
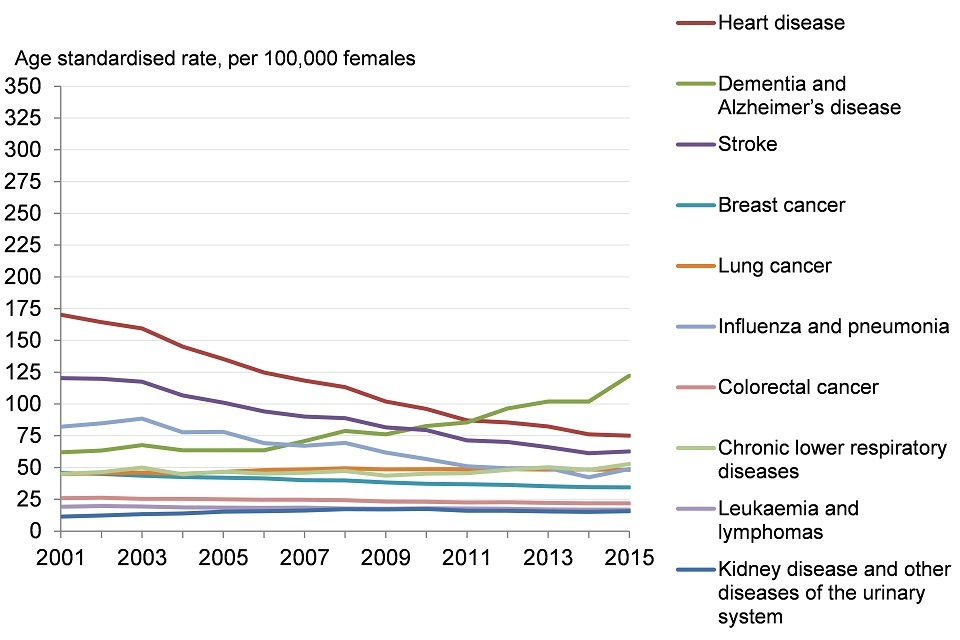
Figure 2. Trends in age standardised mortality rates from leading causes of death, females, 2001 to 2015, England [Source: PHE analysis of ONS mortality data]
3.4 Note: Data have been adjusted for coding changes.
This shows:
- for females, the death rate due to heart disease (ischaemic heart disease) has decreased by 56% since 2001
- the rate for stroke (cerebrovascular disease) deaths have reduced by 48%
- there has been a smaller decrease in the death rate from breast cancer of 24%
- the death rate from dementia and Alzheimer’s has doubled since 2001
- there has also been an increase in the death rate from lung cancer (8%), kidney disease and other diseases of the urinary system (38%) and chronic lower respiratory disease (18%)
In 2015, heart disease, stroke, and certain cancers were still among the top 10 leading causes of death in males and females. However, as people live longer and the population ages, the number of deaths with dementia and Alzheimer’s disease as the cause of death has increased, making it the leading cause of death for females and the second leading cause for males (table 1, figure 1, and figure 2).
In 2015, the proportion of deaths from dementia and Alzheimer’s disease was higher among females than males as more deaths in females occur at the oldest age groups.
While the number of deaths as a result of dementia and Alzheimer’s disease has increased, there have also been coding changes that make dementia and Alzheimer’s disease more likely to be classified, in place of other causes, as the main cause of death [footnote 4].
Furthermore, in 2013 to 2014 new regulations were introduced to encourage the identification and diagnosis of dementia among older people who had had an episode of emergency or unplanned hospital care, and in the financial years 2014 to 2015, GPs were financially incentivised to diagnose dementia [footnote 5],[footnote 6].
These changes have made it more difficult to compare deaths from dementia and other causes over time. However, figures 1 and 2 do adjust for the coding changes [footnote 7].
Cancers are broken down into site-specific causes in the leading cause analysis. However, cancers as a whole accounted for 30.0% of deaths in males and 24.8% of deaths in females in 2015. When site-specific cancers are considered separately, in both sexes, lung cancer, colorectal cancer, and leukaemia and lymphomas all appear in the top 10 leading causes.
For males, prostate cancer was also among the 10 leading causes, while for females, breast cancer was one of the 10 leading causes (table 1).
Lung cancer is the 3rd most common cause for males and 6th most common for females. However, for males the rate is declining, while for females there has been a small increase (figure 1 and figure 2). This reflects the trend in the rate at which people are being diagnosed with lung cancer (the incidence rate).
Although the incidence rate for lung cancer is higher in males than females, between 1995 and 2015, the age-standardised incidence rate of lung cancer decreased by 30% for males but increased by 28% for females [footnote 8]. This pattern is explained partly by the fact that the uptake of smoking among females last century lagged behind males, and so the first cohort of females who developed smoking-attributable lung cancer came later than for males [footnote 9].
Huge improvements have been made in the prevention, management, and treatment of heart disease and stroke, and their risk factors, which has underpinned much of the decline in death rates [footnote 10],[footnote 12]. However, some modifiable risk factors for heart disease and stroke, such as high body mass index (excess weight) and diabetes, have not declined (see Chapter 3) which could affect the downward trend in the death rate over time [footnote 10],[footnote 12].
Although not identified separately in the leading cause analysis, drug poisoning and drug misuse deaths have risen sharply over the past 3 years to 3,416 and 2,300 deaths respectively, both the highest on record [footnote 14]. The factors responsible for the increase in these deaths are multiple and complex. They include changes in the availability of heroin over time and an ageing cohort of heroin users, who are now experiencing cumulative physical and mental health conditions that make them more susceptible to overdose [footnote 15].
3.5 Table 1: leading causes of death in England in 2015
In 2015, heart disease was the leading cause of death in males and dementia and Alzheimer’s disease the leading cause of death in females
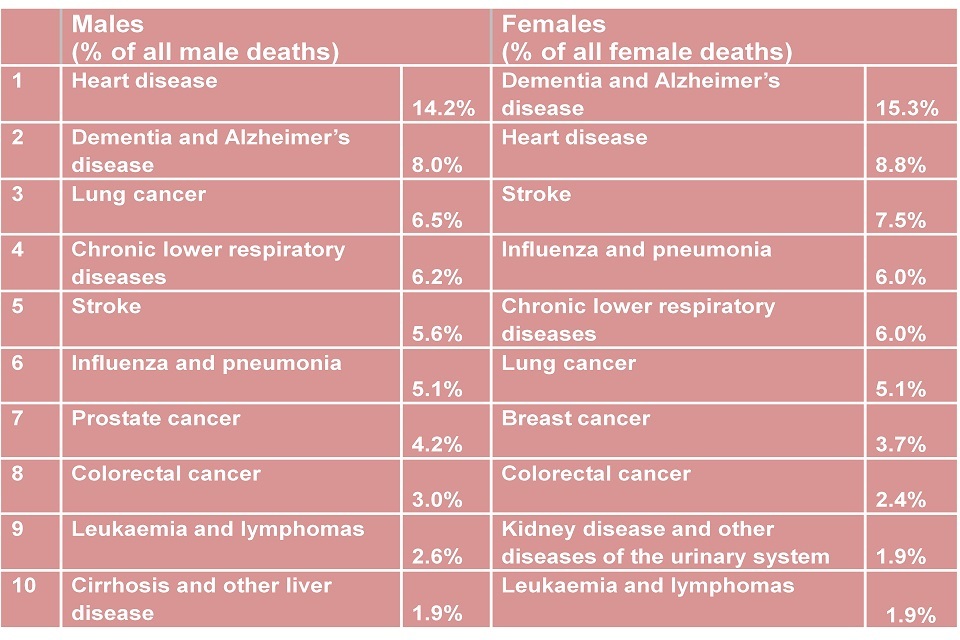
Table 1. Leading causes of death in England in 2015
This shows:
- for males, in 2015, heart disease (ischaemic heart disease) was the most common cause of death; It was the cause of 1.8 times as many deaths as the second leading cause of death, dementia, and Alzheimer’s disease
- for females, dementia and Alzheimer’s disease was the most common cause of death, followed by heart disease
- for males and females, 4 of the 10 leading causes of death were cancers and of these, lung cancer caused the most deaths
- if deaths from all forms of cancer were grouped together, cancer deaths would account for 24.8% of all deaths in females and 30.0% of all deaths in males (PHE analysis of ONS data)
See the full data source: ONS
The majority of deaths occur at older ages (more than two-thirds occur at ages 75 and over) and as a result, the leading causes of all deaths are predominantly reflective of the deaths occurring in males and females over the age of 65. The leading causes of death for all ages and the leading causes of death for specific age groups naturally differ (table 2 and table 3).
In general, between ages 50 to 79, heart disease, stroke and cancers were the most common causes of death, and among younger adults under 35, external causes, such as accidents and suicide, were the most common.
3.6 Table 2: leading causes of death by age group for males in England, 2015
Leading causes of death vary by age for males
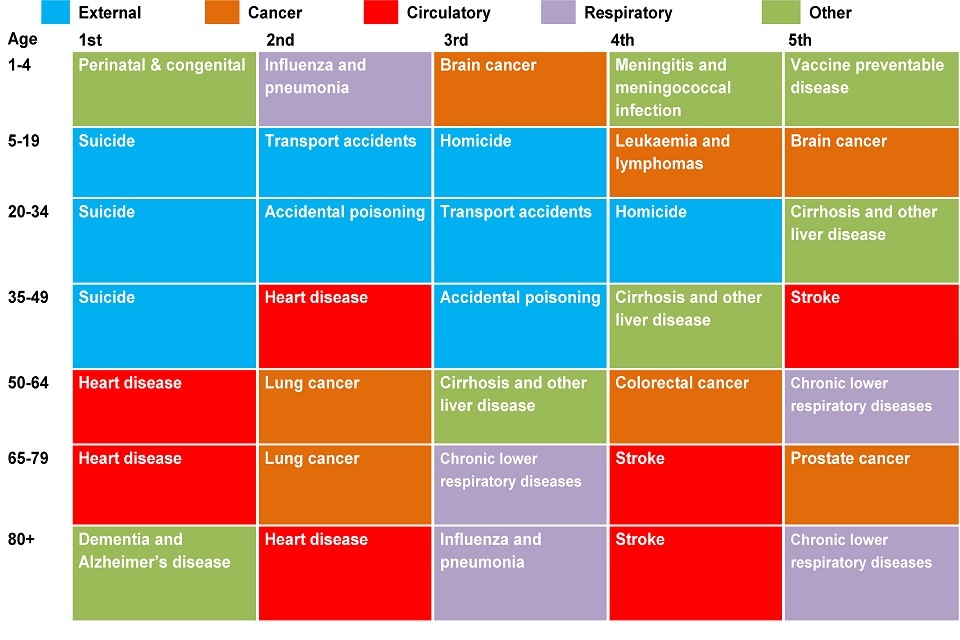
Table 2. Leading underlying causes of death by age group for males in England, 2015
3.7 Table 3. Leading causes of death by age group for females in England, 2015
Leading causes of death vary by age for females
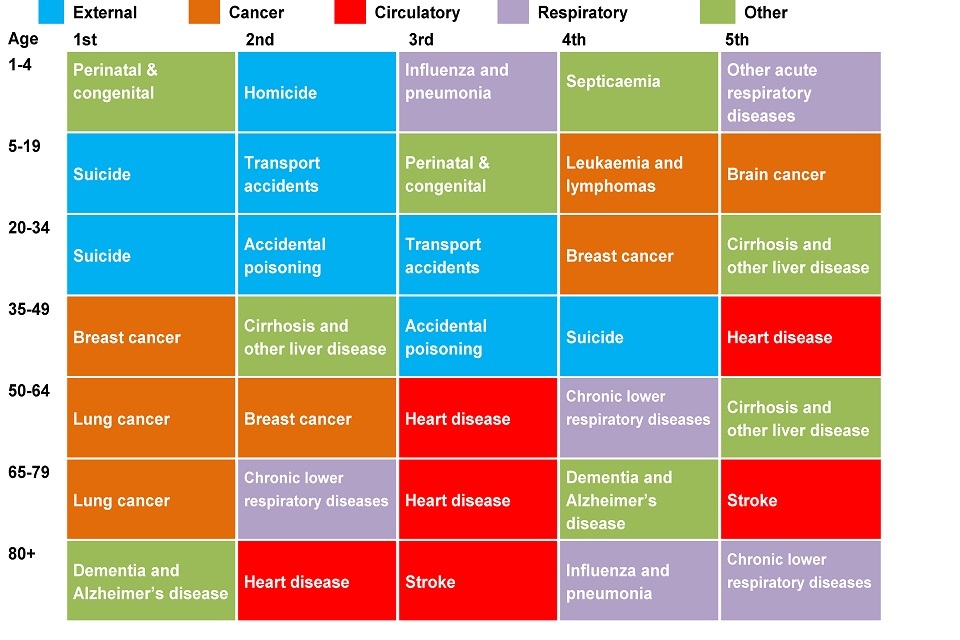
Table 3. Leading underlying causes of death by age group for females in England, 2015
3.8 Note:
In the youngest age group (1 to 4 years), the total number of deaths was very small (437) and the total number of deaths for a given leading cause was similarly low; for example, 14 deaths were due to homicide (7 males and 7 females).
In England and Wales, a conclusion of suicide cannot be returned for children under the age of 10 years.
For males aged 1 to 4, the causes of death ranked 4 and 5 both had 10 deaths.
For females aged 1 to 4, the causes of death ranked 2, 3 and 4 had 7 deaths (these are presented alphabetically) and there were 2 causes with 6 deaths, other acute respiratory diseases, and cardiomyopathy.
For females aged 5 to 19 there were 2 causes with 22 deaths, brain cancer, and cerebral palsy and other paralytic syndromes.
This shows:
- for males and females, the leading causes of death varied depending on the age of death
- deaths among young people under age 35 years were due mostly to external causes, such as suicide and transport accidents, and at the youngest ages, childhood cancers and conditions present from birth were also leading causes
- between ages 50 to 79, heart disease and cancers were the most common causes of death
- as more people die at older ages, the leading causes at older ages are increasingly reflective of the leading causes of death for the population as a whole. Dementia and Alzheimer’s disease was the most common cause for both males and females over the age of 80
See the full data source: ONS, NOMIS
4. Risk factors contributing to deaths by cause
The trends and causes of death in the population are influenced by a broad range of factors. Figure 1 in Chapter 6 describes the broad range of influences on health which include age, sex and hereditary factors, individual lifestyles and behavioural risk factors, social and community networks, living and working conditions, and general socio-economic, cultural and environmental conditions. The broad social and economic circumstances, which together influence the quality of health of the population, are known as the ‘social determinants of health’ and are discussed further in Chapter 6 [footnote 11].
Using the Global Burden of Disease (GBD) model, certain risk factors for disease can be ranked based on the proportion of deaths they are associated with (figure 3 and 4). The GBD divides risk factors into three main groups: behavioural, metabolic and environmental. Metabolic risk factors include a high body mass index (BMI) and high cholesterol.
Behavioural risks include smoking, alcohol, and unsafe sex, while environmental and occupational risks include air pollution, unclean water and other risks due to the working or living environment.
The behavioural risk factors estimated to account for the highest proportion of deaths in England in 2013 were diet and tobacco smoke (figure 3). Breaking dietary risk factors down into the causes of death they are associated with, it can be seen that they contribute to deaths from cardiovascular disease (heart disease and stroke), cancers and diabetes.
The smoking of tobacco is associated with deaths from cancer, chronic respiratory diseases, cardiovascular diseases, and other common infections, especially lower respiratory conditions.
4.1 Figure 3: attribution of deaths to risk factors and broken down by broad causes of death in England, 2013
Among those risk factors included in the GBD analysis, dietary risk factors and tobacco smoke accounted for the most deaths
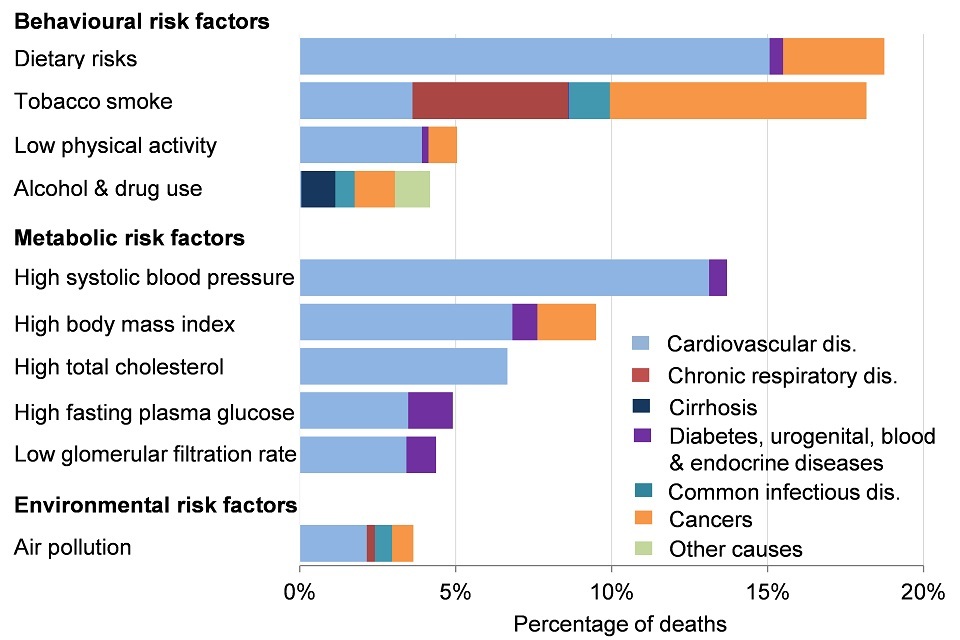
Figure 3. Attribution of deaths to risk factors and broken down by broad causes of death in England, 2013 [Source: GBD 2013]
This shows:
- among those risk factors included in the GBD analysis, dietary risk factors and tobacco smoke accounted for the most deaths, almost 20%
- for dietary risks, the majority of deaths were due to cardiovascular diseases (heart disease and stroke)
- tobacco smoke accounted for deaths from four major causes, cardiovascular diseases (heart disease and stroke), neoplasms (cancers), chronic respiratory diseases, and common infectious diseases
See the full data source: GBD data visualisation tool
Just as causes of death differ by age group, the risk factors accounting for the highest proportion of deaths also differ (figure 4). For deaths among those aged 15 to 49, unlike deaths at all ages, alcohol and drug use is the behavioural risk factor associated with the highest proportion of deaths. Alcohol and drug use were associated with a broad range of causes of death, the four most common being substance use disorders, liver disease, accidents, and suicide.
Alcohol-related deaths typically occur at younger ages than deaths from all causes. As a result, in 2015, there were an estimated 167,000 working years lost due to alcohol, 16% of all working years lost in England [footnote 16]
4.2 Figure 4: attribution of deaths in ages 15 to 49 to risk factors and broken down by broad causes of death in England, 2013
Of the deaths occurring in those aged 15 to 49, the risk factors included in GBD and accounting for the largest proportion of deaths was alcohol and drug use
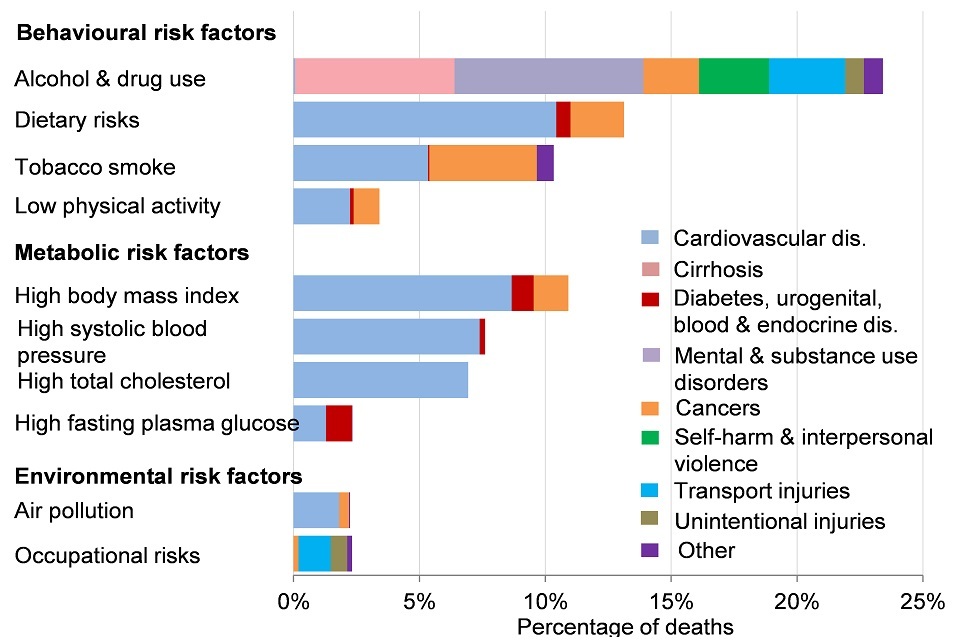
Figure 4. Attribution of deaths in ages 15-49 to risk factors and broken down by broad causes of death in England, 2013 [Source: GBD 2013]
This shows:
- of the deaths occurring in those aged 15 to 49, the risk factor included in GBD and accounting for the largest number of deaths was alcohol and drug use. The causes of deaths in this age group were varied and reflect both the acute (accidents) and chronic (cirrhosis) effects of alcohol consumption
- dietary risks accounted for the second most deaths, mostly from cardiovascular diseases (heart disease and stroke)
- high body mass index (BMI) and smoking were also leading risk factors for deaths in this age group and also predominantly contribute to deaths from cardiovascular diseases (heart disease and stroke) and cancers
See the full data source: GBD data visualisation tool
5. Further information
The prevalence of behavioural risk factors has been changing over time and this is discussed in Chapter 3. In addition, the prevalence of risk factors varies across England and is higher in some population groups than others (Chapter 5). Underpinning inequalities in the prevalence of risk factors are the broader social determinants of health (Chapter 6). As discussed, these are the broad social and economic circumstances which together influence the quality of health of the population.
6. References
-
McKeown T & Record R G (1962) Reasons for the decline of mortality in England and Wales during the nineteenth century. Population Studies 16, 94 to 122 ↩
-
Baillie L & Hawe E. (2012) Causes of Death: A Study of a Century of Change in England and Wales. Office of Health Economics ↩ ↩2
-
Omran A R (2005) The Epidemiologic Transition: A Theory of the Epidemiology of Population Change. Milbank Quarterly 83, 731-757. ↩
-
ONS (2016) Registered deaths by age, sex, selected underlying causes of death and the leading causes of death for both males and females. Office for National Statistics Accessed 20 December 2016. ↩
-
NHS (2017) Dementia Assessment and Referral Accessed 19 February 2017. ↩
-
NHS (2016) Enhanced Service Specification: Dementia Identification Scheme. NHS England. ↩
-
PHE (2015) Using ONS mortality data: taking account of changes to cause of death coding from 2014. ↩
-
ONS (2017) Cancer Registration Statistics, England: 2015 Accessed 29 May 2017. ↩
-
NCIN (2013) Recent trends in lung cancer incidence, mortality and survival. Public Health England. ↩
-
Department of Health (2013). Cardiovascular disease outcomes strategy. Improving outcomes for people with or at risk of cardiovascular disease. ↩ ↩2
-
Bajekal M, Scholes S, Love H, Hawkins N, O’Flaherty M. (2012) Analysing Recent Socioeconomic Trends in Coronary Heart Disease Mortality in England, 2000 to 2007: A Population Modelling Study. PLoS Med 9(6): e1001237. ↩ ↩2
-
ONS (2016) Deaths Related to Drug Poisoning in England and Wales: 2015 registrations. Accessed 5 July 2017. ↩
-
PHE (2016a) Understanding and preventing drug-related deaths: The report of a national expert working group to investigate drug-related deaths in England. Accessed 5 July 2017. ↩
-
Marmot M. (2010) Fair society, healthy lives: the Marmot Review: strategic review of health inequalities in England post-2010. Department for International Development. ↩
-
Public Health England (2016b). The public health burden of alcohol and the effectiveness and cost-effectiveness of alcohol control policies. An evidence review. Accessed 5 July 2017. ↩