Chapter 4: European comparisons
Published 13 July 2017

© Crown copyright 2017
This publication is licensed under the terms of the Open Government Licence v3.0 except where otherwise stated. To view this licence, visit nationalarchives.gov.uk/doc/open-government-licence/version/3 or write to the Information Policy Team, The National Archives, Kew, London TW9 4DU, or email: psi@nationalarchives.gov.uk.
Where we have identified any third party copyright information you will need to obtain permission from the copyright holders concerned.
This publication is available at https://www.gov.uk/government/publications/health-profile-for-england/chapter-4-european-comparisons
1. Main messages
Among the 28 countries of the EU, in 2015, the UK was ranked 10th for male life expectancy but only 17th for female life expectancy. UK male life expectancy was 1 year shorter than the best countries and female life expectancy was 3 years shorter.
Life expectancy in the UK is increasing more slowly than the EU average, for both males and females. Of the other EU countries with large populations, Germany had a slower rate of life expectancy increase while France, Italy and Spain had faster rates.
80% of the burden of premature death in England was due to non-communicable diseases largely cancer and cardiovascular disease (heart disease and stroke). For cancer and cardiovascular disease males in England were doing better than the EU average; the female burden in England was better than average for cardiovascular diseases but worse than average for cancers.
Chronic respiratory disease and other smoking-related diseases accounted for much of the additional burden of premature death in England when compared with the countries with the lowest burden; for lung cancer among females the burden was two and half times that for Spain, while for chronic respiratory diseases the burden for both sexes was among the highest in Europe.
In terms of ill health prior to death (morbidity), there was little variation among EU countries; total male morbidity in England was only 5% higher than Spain, the best-ranked country for males, and total female morbidity was only 7% higher than Poland, the best-ranked country for females.
In the EU, over half of total morbidity is typically due to 3 disease groups:
- mental health conditions and substance misuse
- musculoskeletal conditions such as low back and neck pain
- a group of ‘other non-communicable diseases’ that includes skin diseases, hearing loss, sight loss’
In these 3 disease groups, there are only small differences between England and the best-ranked countries.
2. Introduction
Life expectancy in England has generally increased over recent decades (chapter 1). Prevalence of smoking continues to decline and mortality rates for heart disease and stroke have reduced by a half since 2001 (chapter 2). These important public health achievements are also shared by many other developed countries[footnote 1].
To get a broader perspective on these health trends it is important to make a comparison between England and other European countries. In this chapter, measures of mortality and morbidity are used to compare health in England with countries of the European Union and also with the other UK nations; Wales, Scotland and Northern Ireland.
Comparing health outcomes across a broader range of countries reveals more about how improvements could be made in the UK and England. Statistics from the Global Burden of Disease Study (GBD) are advancing our ability to do this and are used throughout this chapter.
The GBD uses years of life lost (YLL) and the years lived with disability (YLD) to estimate the impact of disease on population mortality and morbidity. YLL is a measure related to life expectancy that quantifies the impact on lifespan of a given disease.
YLD is a measure of morbidity that combines the prevalence of each disease with a rating of the severity of its symptoms (excluding death itself), to give an overall measure of the loss of quality of life. The definitions and data notes at the end of this chapter provide more detail on the measures.
In this chapter, comparisons are made between EU countries and England or the UK. However it should be noted that there is considerable variation within countries (chapter 5) and in particular, the UK and England are subject to relatively high levels of health inequality[footnote 2].
3. Life expectancy in the UK, England and other EU countries
Across the 28 EU countries, average life expectancy (all persons) in 2015 was highest in Spain at 83.0 years and lowest in Lithuania at 74.6 years, a difference of over 8 years (figure 1); although this does conceal differences between males and females.
Countries in the south of Europe, including Italy (82.7 years), France (82.4 years), Cyprus (81.8 years) and Spain (83.0 years) had the longest life expectancies.
Countries in the east of Europe, that joined the EU more recently, had the shortest life expectancies including Lithuania (74.6 years), Bulgaria (74.7 years), Latvia (74.8 years), and Romania (75.0 years).
3.1 Figure 1: life expectancy at birth (persons), EU countries, 2015
France, Italy and Spain had the highest person life expectancy of the EU countries. The UK lagged behind by 2 years along with Germany, Greece, and Belgium

Figure 1. Life expectancy at birth (persons), EU countries, 2015
This shows:
- life expectancy varied by as much as 8 years across EU countries
- generally Western European countries had higher life expectancy than Central and Eastern European countries
- Southern European countries, including Spain, Italy, and France had the highest life expectancy in 2015
See the full data source: Eurostat tables
The UK was ranked 10th of the 28 EU countries for male life expectancy at 79.2 years (2015). UK male life expectancy was trailing the best countries by just over 1 year (figure 2) but was well above the EU average for males of 77.9 years.
Although life expectancy in the UK is higher for females than males, it is females that are doing less well in comparison with other EU countries. In 2015, the UK ranked 17th for female life expectancy (82.8 years), 3 years less than those countries with the greatest life expectancy and was below the EU average of 83.3 years (figure 2). Of Western European countries, only Denmark had lower female life expectancy than the UK, and all other countries with lower female life expectancy were more recent entrants to the EU from Eastern and Central Europe.
Across the EU, males generally die younger than females; in 2015, average EU male life expectancy was 4.9 years lower than the average female life expectancy (figure 2). The gap varies by country; in the Netherlands, females lived 3.3 years longer than males while, in Latvia and Lithuania, females on average lived about 10 years longer than males. A large part of this difference between the sexes was due to high rates of heart disease among males in all EU countries (figure 5).
3.2 Figure 2: male and female life expectancy, EU countries, 2015
Of the 28 EU members, the UK was ranked 10th for male life expectancy and 17th for female life expectancy
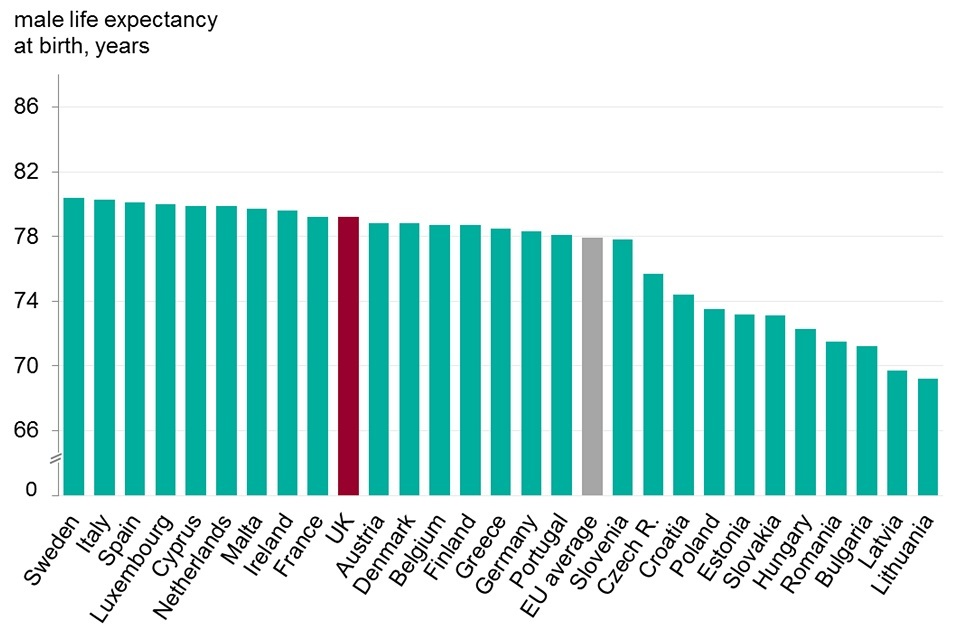
Figure 2. Male and female life expectancy, EU countries, 2015
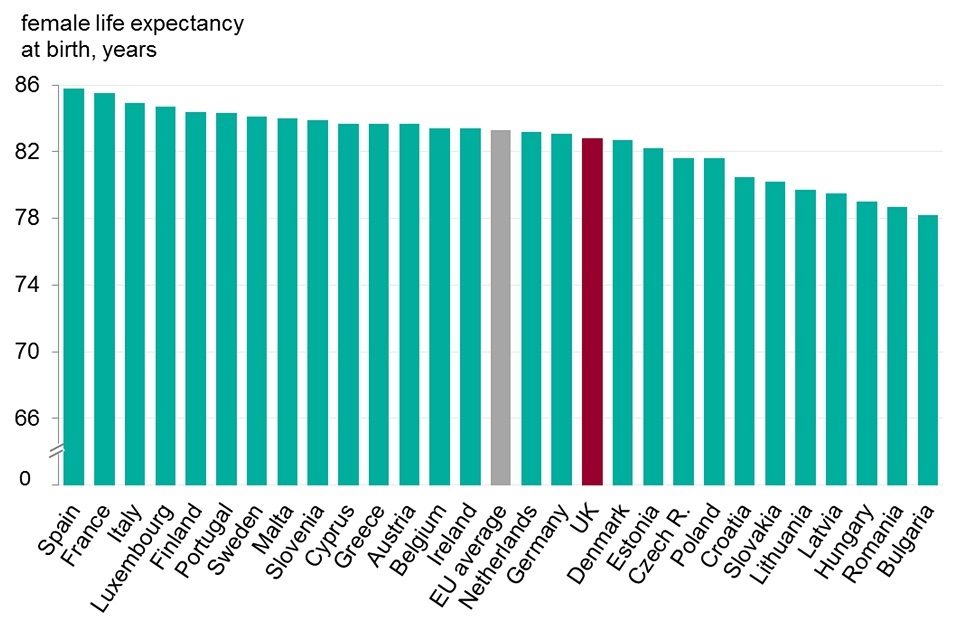
Figure 2. Male and female life expectancy, EU countries, 2015
This shows:
- UK males were ranked comparatively higher than UK females on life expectancy
- males were ranked 10th and higher than the EU average while females were ranked 17th and below the EU average
- female life expectancy for the UK was 3 years less than for Spain, the country with the longest life expectancy, while male life expectancy was only 1.2 years behind Sweden
- of Western European countries only Denmark had lower female life expectancy than the UK
See the full data source: Eurostat tables
Life expectancy in the UK is increasing more slowly than the EU average, for both males and females. Of the other EU countries with large populations, Germany has slower life expectancy growth while France, Italy and Spain have faster growth (figure 3).
3.3 Figure 3: life expectancy at birth, EU countries with a population greater than 35 million, 2003 to 2015
Life expectancy in the UK increased more slowly than the EU average for both males and females. Of the larger EU countries only Germany has slower life expectancy growth for both sexes
Male

Figure 3. Life expectancy at birth, EU countries with population greater than 35 million, 2003-15
Female
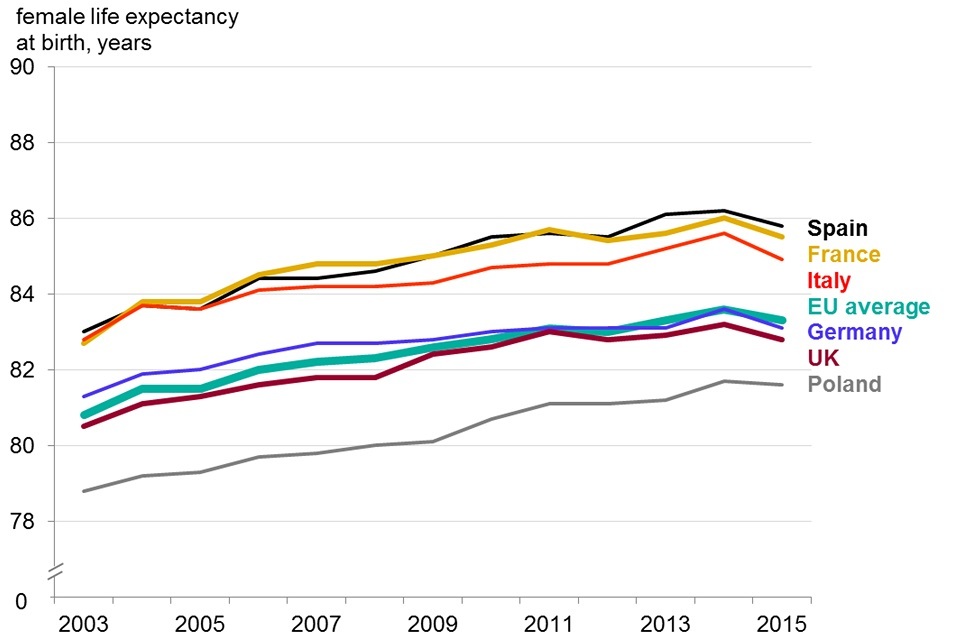
Figure 3. Life expectancy at birth, EU countries with population greater than 35 million, 2003-15
This shows:
- UK male life expectancy has remained consistently higher than the EU average since 2003, while female life expectancy has remained consistently lower
- UK male life expectancy increased at a rate of 3.0 months per year over the period from 2003 to 2015, while Spain had the fastest growth in male life expectancy of these 6 countries at 3.7 months per year. The EU average grew at a rate of 3.3 months per year
- life expectancy for females in the UK increased at a rate of 2.3 months per year while France and Spain had the fastest growth at 2.8 months per year
See the full data source: Eurostat tables
Within the UK
In 2015, male life expectancy in England was 79.3 years, a year higher than in Wales (78.3 years) and Northern Ireland (78.2 years), and more than 2 years higher than Scotland (77.0 years; figure 4).
For female life expectancy, the countries were similarly spread; England highest at 83.0 years, Northern Ireland (82.2 years), Wales (82.0 years) and Scotland (81.0 years). Scotland was lower than all Western European countries for male life expectancy in 2015, and for female life expectancy Scotland was also lower than several Eastern European countries including Estonia, Poland, and the Czech Republic. The differences in life expectancy between the 4 countries of the UK have been sustained over the period from 1981 to 2015 (figure 4).
3.4 Figure 4: life expectancy at birth for males and females, home nations of the UK, 1981 to 2015
Within the UK, life expectancy was highest in England for both males and females, and lowest in Scotland
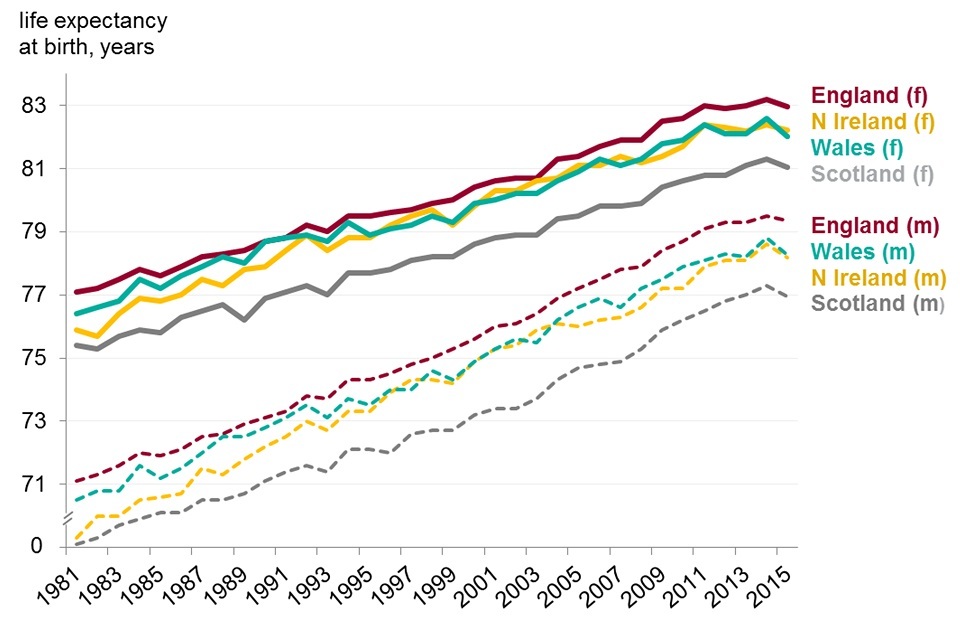
Figure 4. Life expectancy at birth for males and females, home nations of the UK, 1981 to 2015
This shows:
- England had the highest life expectancy in the UK for both males and females, followed by Wales, Northern Ireland and Scotland
- life expectancy in Scotland was approximately 2 years less than in England for both males and females
See the full data source: ONS life expectancy estimates
4. The burden of premature death by disease group in 2015
The male burden of premature death in England amounted to 10,600 YLL per 100,000 population, 13% higher than the country with the lowest burden, Sweden. For male burden, England was ranked 7th lowest out of the 28 EU countries and was lower than the EU average (figure 5, 6).
The female burden of premature death was 7,100 YLL per 100,000 population, 38% higher than for Spain, the country with the lowest burden. This placed England 17th lowest, which was worse than the EU average (figure 5, 7). Of Western European countries, only Denmark had a higher burden of female premature death in 2015.
4.1 Figure 5: EU countries and England compared by burden of premature death (age-standardised YLL per 100,000 population) 2015
In England in 2015 the burden of premature death in males was 7th lowest compared to other countries in the EU, the burden for females was 17th lowest
Male
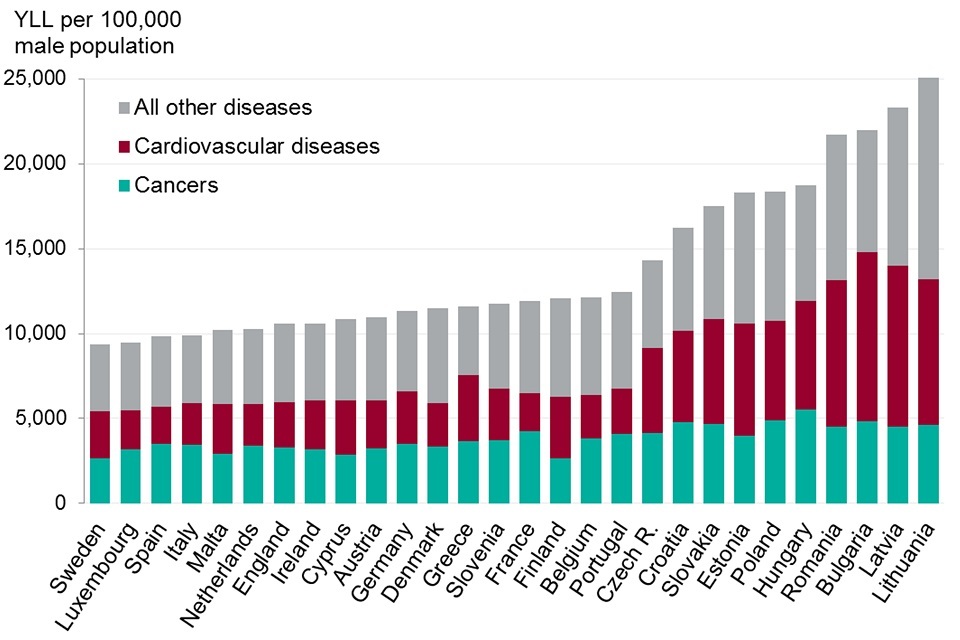
Figure 5. EU countries and England compared by burden of premature death, age standardised Years of Life Lost per 100,000 population, 2015
Female
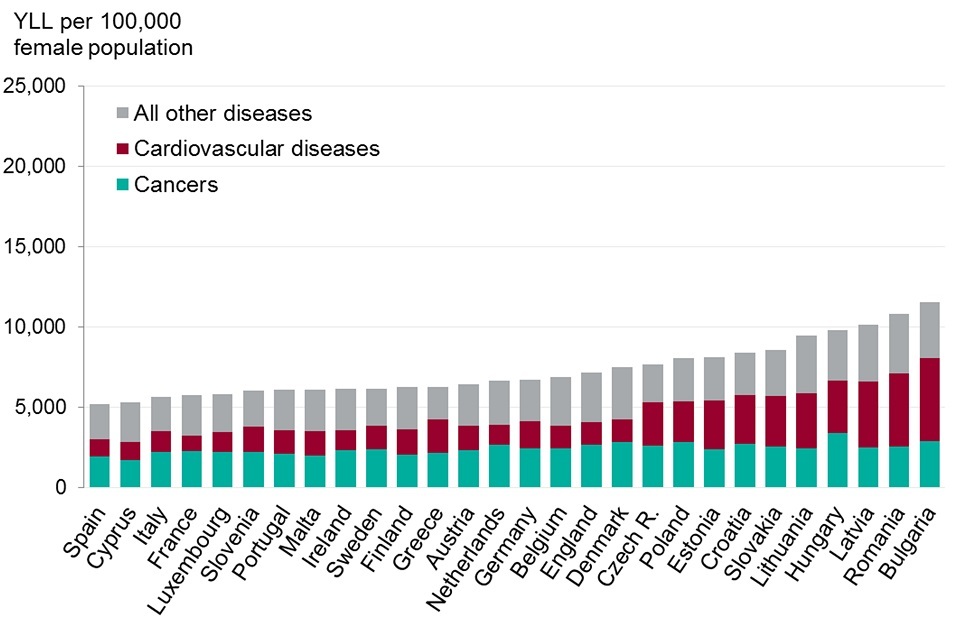
Figure 5. EU countries and England compared by burden of premature death, age standardised Years of Life Lost per 100,000 population, 2015
This shows:
- in 2015, England was in ranked seventh lowest for male burden of premature death and 17th for female premature death. Denmark was the only Western European country that had a higher female burden of premature death
- over half of the burden of premature death in EU countries was due to cancers and cardiovascular diseases
- compared with Sweden, males in England had a fifth higher burden of premature death due to cancers but a similar burden due to cardiovascular diseases
- compared with Spain, females in England had a third higher burden due to cancers and cardiovascular diseases
See the full data source: Global Burden of Disease Study 2015
4.2 Figure 6: male burden of premature death (age-standardised YLL per 100,000 population) England, 2015
Males in England had a much higher burden of premature death due to chronic respiratory diseases, common infectious diseases, and neonatal disorders than the EU as a whole
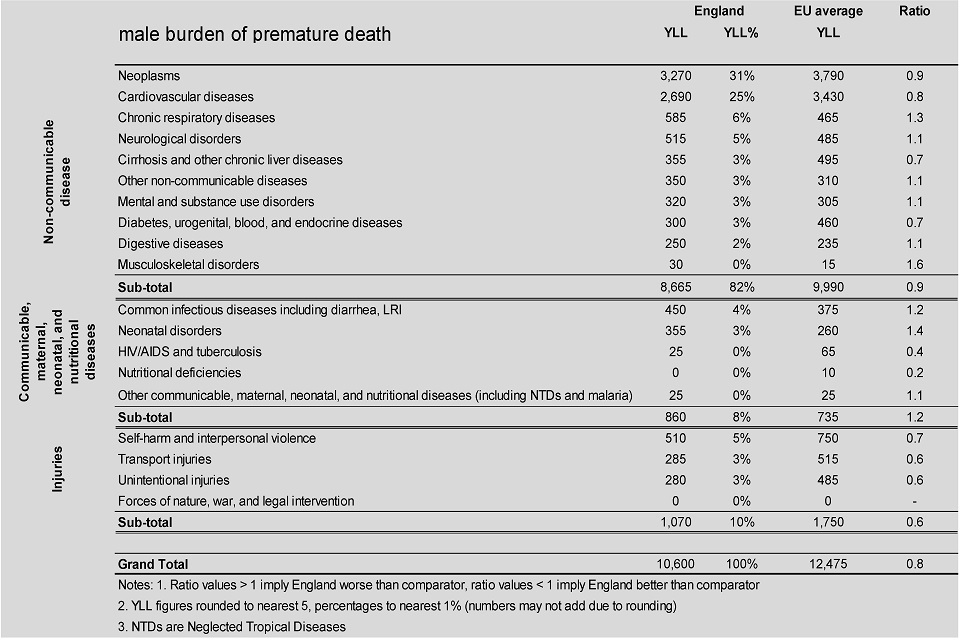
Figure 6. Male burden of premature death, age standardised YLLs per 100,000 population England, 2015
This shows:
- in England (and in the EU as a whole), non-communicable diseases accounted for the greatest burden of premature death, followed by injuries, and communicable diseases
- together, cancers and cardiovascular diseases accounted for over half of the burden of premature death for males (and females), and for these disease groups the male burden in England was lower than the EU average
- for musculoskeletal and neonatal disorders, and chronic respiratory diseases males in England had a significantly higher than average burden of premature death
- however, better than average outcomes were seen for accidents and injuries, nutritional deficiencies, HIV/AIDS and tuberculosis; for these groups, the burden of premature death in England was at least 40% lower than the EU average
See the full data source: Global Burden of Disease 2015
4.3 Figure 7: female burden of premature death (age-standardised YLL per 100,000 population) England, 2015
Females in England suffered a higher burden of premature death due to chronic respiratory diseases, common infectious diseases and neonatal disorders than most other EU countries, but a lower than average burden for cardiovascular diseases
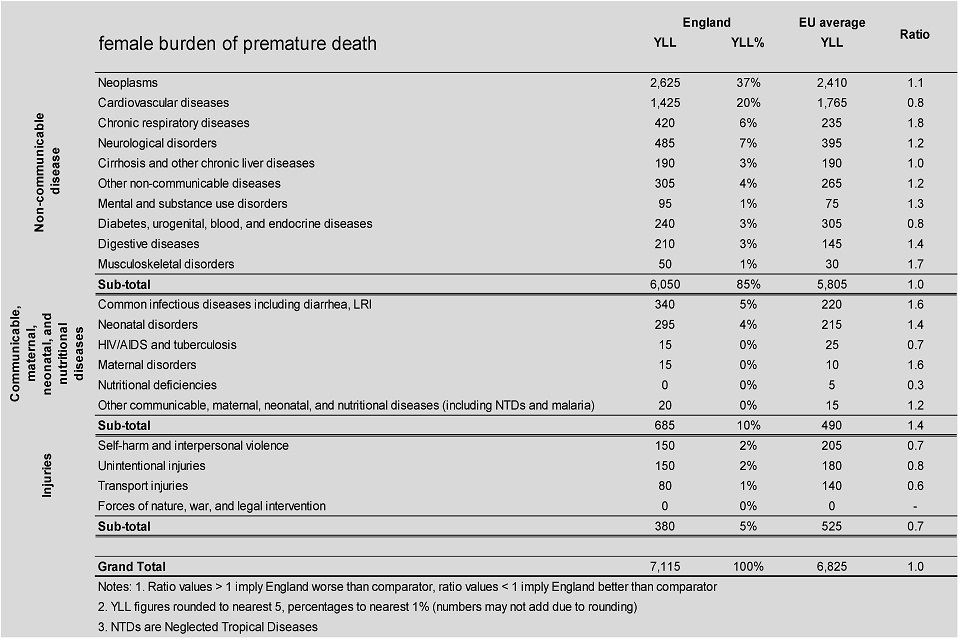
Figure 7. Female burden of premature death, age standardised YLLs per 100,000 population England, 2015
This shows:
- the female burden of premature death in England was lower than the EU average for cardiovascular diseases but higher than average for cancers
- for females, the burden of premature death for chronic respiratory diseases was 80% higher than the EU average
- musculoskeletal disorders, common infectious diseases, maternal, neonatal and digestive disorders also accounted for a significantly higher than average burden of premature death
- in England the female burden of premature death due to accidents and injuries was 30% lower than the EU average and was also significantly lower than average for self-harm and interpersonal violence, HIV/AIDS and tuberculosis and nutritional deficiencies.
See the full data source: Global Burden of Disease 2015
Non-communicable diseases
In England, as in the EU as a whole, non-communicable diseases accounted for over 80% of the burden of premature death, with injuries and communicable, maternal, neonatal and nutritional diseases accounting for the remainder (figure 6, 7).
In England and in other Western European countries, premature death from non-communicable diseases was chiefly due to cancers and cardiovascular diseases (figure 6,7). In Central and Eastern European countries the burden of cancers was lower and a larger part of the total burden of premature death was due to other diseases, including cardiovascular diseases, cirrhosis, and injuries.
Cancers (Neoplasms)
For males in England, the burden of premature death due to cancers was lower than the EU average (Figure 6), however, it was 23% higher than in Sweden the country with lowest male burden in the EU (Figure 5). England had the eighth smallest male cancer burden.
Women in England did less well (figure 5, 7); the cancer burden for females in England was higher than the EU average (Figure 7). 38% higher than in Spain and England ranked 22nd of the 28 countries (21 countries had a lower cancer burden). Indeed only Denmark and the Netherlands had a higher female burden in 2015 for premature deaths from cancer of Western European countries.
Lung cancer accounted for the greatest burden of premature cancer death in males, and the second greatest in females, after breast cancer. For lung cancer, males in England had twice the burden of males in Sweden and females had two and a half times that of Spain (Figure 8).
4.4 Figure 8: England compared to EU countries with the lowest burden of premature death due to cancer (age-standardised YLL per 100,000 population) 2015
Lung and related cancers, oesophageal cancer, and breast cancer each accounted for a significantly greater burden of premature death in England compared with Sweden (males) and Spain (females)
Male

Figure 8. England compared to EU countries with lowest YLL by types of cancer, 2015
Female

Figure 8. England compared to EU countries with lowest YLL by types of cancer, 2015
Note: Spain has the second lowest female burden of premature death due to cancers after Cyprus. Spain is taken as comparator as a country of much greater population size than Cyprus and as such its GBD results are more robust.
This shows:
- compared to the countries with the lowest burden, England had twice the male and female burden of premature death for lung, tracheal and bronchus cancers in 2015
- for breast and ovarian cancer, the female burden in England was 50% higher than in Spain
- in England oesophageal cancer had 3 times the burden for males and 5 times the burden for females found in Sweden and Spain respectively
See the full data source: Males: Global Burden of Disease Study 2015 Females: Global Burden of Disease Study 2015
Cardiovascular diseases
Over recent decades there has been a significant decline in death rates due to cardiovascular diseases in England (chapter 2) and all EU countries. The male and female burden of cancer in England were both lower than the EU average. However the male burden in England was still 23% higher than Spain and the female burden was 43% higher than France, the countries with the lowest burden for each sex (figure 5).
Chronic respiratory diseases
Among EU countries there is considerable variation in the burden of premature death due to chronic respiratory diseases, with the male burden in some countries over 3 times greater than those with the lowest burden and the female burden 5 times greater than the countries with the lowest burden. The male and female burden from respiratory disease in England were both higher than the EU average.
These diseases contributed substantially to the higher burden of premature death among males and females in England, compared to the countries with the lowest burden. The male burden of chronic respiratory diseases (which includes Chronic Obstructive Pulmonary Disease [COPD]) was 2 times higher than Sweden, and the female burden was 5 times higher than Latvia, the EU countries with the lowest burden for each sex (figure 9, 10).
4.5 Figure 9: ranking of EU countries by the male burden of premature death for major disease groups (age-standardised YLL per 100,000 population) 2015
For cancers and cardiovascular diseases, England was ranked eighth for males, but much lower rankings were seen for chronic respiratory diseases, neurological disorders, common infectious diseases, and neonatal disorders

Figure 9. Ranking of EU countries by male burden of premature death for major disease groups, the YLL per 100,000 male population, 2015
This shows:
- for cancers and cardiovascular disease, the 2 disease groups accounting for the greatest male burden of premature death, England was ranked eighth
- for a number of other diseases, accounting for a smaller part of the overall burden, England had a much lower ranking:
- ranked 23rd for chronic respiratory diseases, with over twice the burden of Sweden, the country with the lowest burden
- ranked 24th for neurological disorders with 33% higher burden than Hungary, the country with the lowest burden
- ranked 19th for common infectious diseases and 22nd for neonatal disorders, with twice the burden of the countries with the lowest burden
- the burden for mental and substance use disorders was 3 times as great as in Italy, the country with the lowest burden
- England had a better ranking for self-harm and interpersonal violence, diabetes and transport and unintentional injuries
See the full data source: Global Burden of Disease 2015
4.6 Figure 10: ranking of EU countries by female burden of premature death for major disease groups (age-standardised YLL per 100,000 population) 2015
Compared to females in other EU countries, females in England had one of the highest burdens of premature death for neurological conditions, chronic respiratory disease, and musculoskeletal disorders
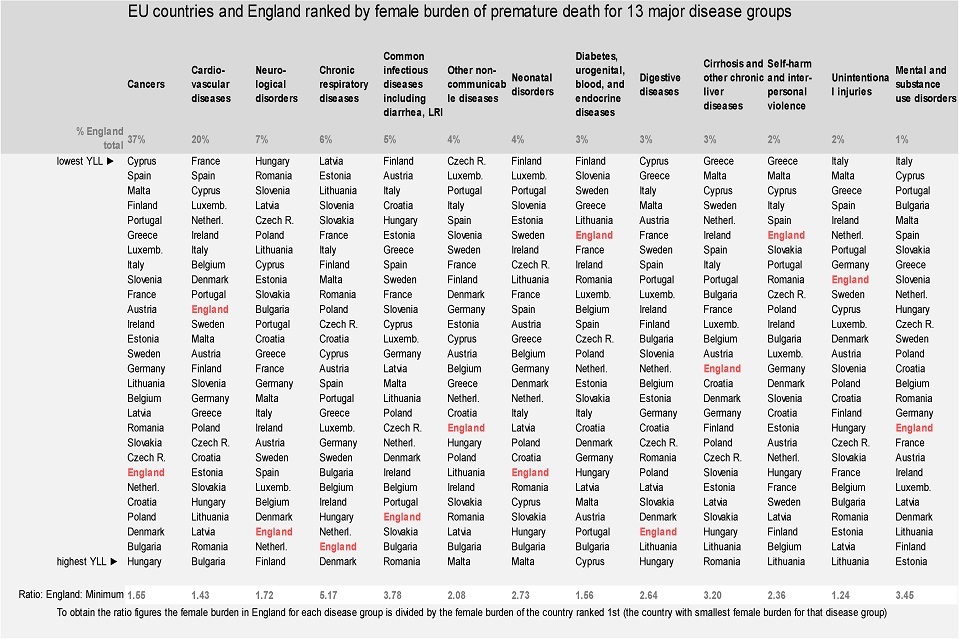
Figure 10. Ranking of EU countries by female burden of premature death for major disease groups, the YLL per 100,000 male population, 2015
This shows:
- for cancers, which account for more than a third of the total burden of premature death in females, England was ranked 22nd of the 28 EU countries
- low rankings were also seen for neurological conditions, chronic respiratory diseases, common infectious diseases, neonatal disorders, digestive diseases, and musculoskeletal disorders
- for diabetes and transport injuries female burden of premature death was relatively low
See the full data source: Global Burden of Disease 2015
Smoking and secondhand smoke are risk factors for a range of diseases including lung cancer, COPD and lower respiratory infections, driving both premature death and morbidity. In England, the female burden of premature death attributable to smoking was one of the largest in Europe at 1,200 YLL per 100,000 female population (GBD 2015). The burden for males was higher than for females at 2,000 YLL per 100,000 male population, but was comparatively better with England ranked 5th lowest among European countries.
People who smoke are significantly more likely to suffer with chronic respiratory diseases, cancers and cardiovascular diseases. Compared with other EU countries, the UK has seen a substantial fall in smoking since the 1980s. Smoking prevalence in the UK is now among the lowest of EU countries with 17% of adults smoking, (on a daily basis or occasionally) (Eurobarometer data) (figure 11).
4.7 Figure 11: smoking prevalence for adults (daily and occasional), selected EU countries, change from 1987 to 1988 up to 2017
17% of adults now smoke daily or occasionally in the UK, less than many other EU countries. This low percentage follows a dramatic decline in smoking in the UK since the late 1980s
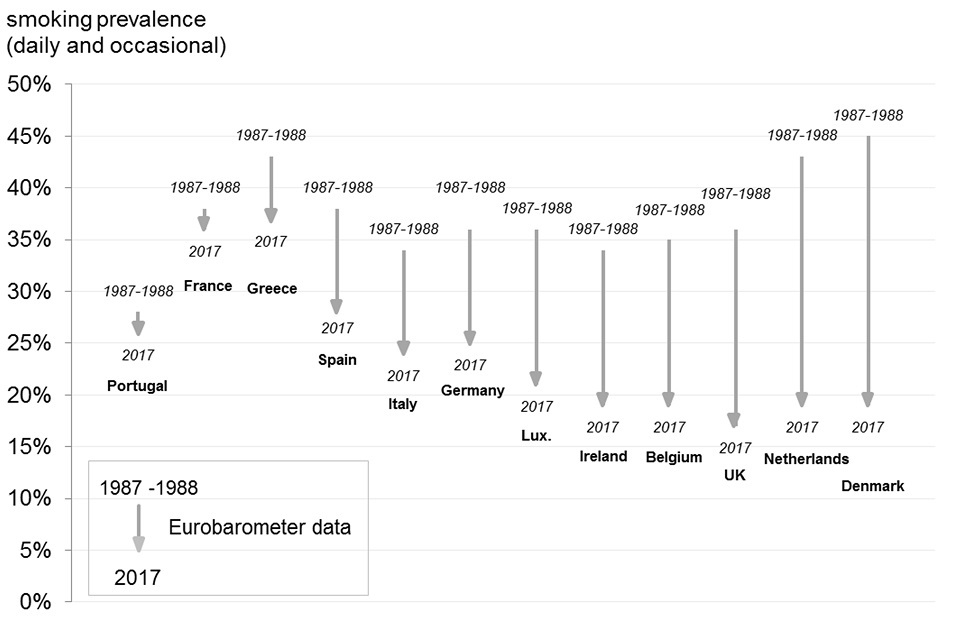
Figure 11. Proportion of daily smokers of cigarettes 1987-88 and 2017
This shows:
- in 2017 smoking prevalence in the UK is among the lowest in Europe at 17%
- the UK has seen a relatively large reduction in prevalence since 1987 to 1988, falling 19 percentage points; only the Netherlands and Denmark saw greater reductions in smoking prevalence
- England and the UK currently have comparatively high morbidity and mortality from lung cancer and other respiratory diseases which reflects the higher smoking prevalence in the 1980s and earlier
See the full data source: Eurostat tables, Eurobarometer
5. Morbidity by disease group in 2015
There was little variation among EU countries for morbidity in comparison with the variation seen in burden of premature death (figure 12):
- the lowest female burden of morbidity was in Poland (10,000 YLD per 100,000 female population) while the greatest was in Luxembourg (11,400 YLD per 100,00 female population), a difference of just 14%
- the lowest male morbidity was in Spain (9,200 YLD per 100,000 male population) while the greatest was in Lithuania (10,600 YLD per 100,00 male population), a difference of just 15%
Male morbidity in England (9,600 YLD per 100,000 male population) was just 5% higher than in Spain, and female morbidity (10,500 YLD per 100,000 female population) just 7% higher than in Poland, the best-ranked countries (figure 12).
In England, morbidity in males was the 5th lowest among EU countries. Although morbidity for females in England was ranked lower at 15th, the difference in rankings between males and females is less important given the overall lack of variation among EU countries (figure 12).
In EU countries over half of the total burden of morbidity was due to 3 disease groups (figure 12):
- mental and substance use disorders (including depressive and anxiety disorders)
- musculoskeletal disorders (including low back and neck pain and arthritis)
- a group of ‘other non-communicable diseases’ that includes skin diseases, hearing loss, sight loss.
Across the EU, these disease groups formed a similar proportion of the total burden (figure 12).
5.1 Figure 12: EU countries and England compared by burden of morbidity, (age-standardised YLDs per 100,000 population) 2015
In England in 2015 morbidity in males was ranked 5th lowest of EU countries. The burden for females ranked 15th, however there is little variation
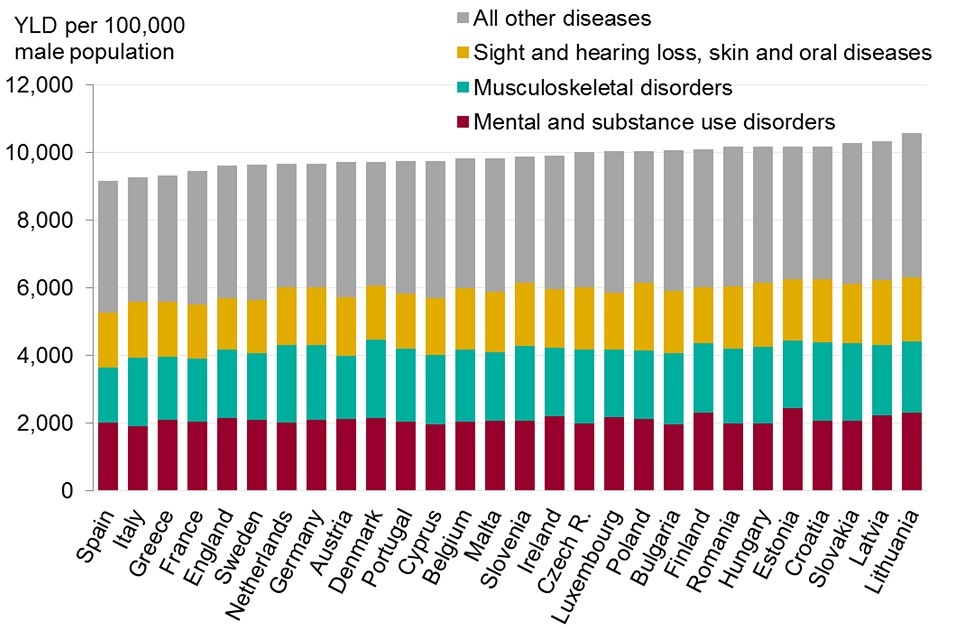
Figure 12. Burden of morbidity (years lived with disability (YLD), EU countries and England, 2015
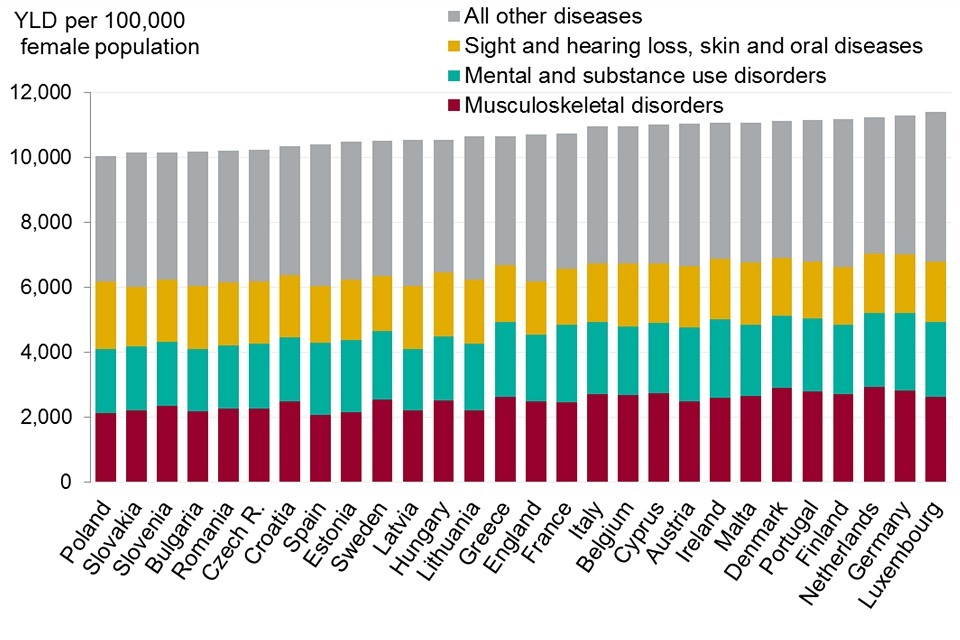
Figure 12. Burden of morbidity (years lived with disability (YLD), EU countries and England, 2015
This shows:
- there was little variation among EU countries for morbidity in comparison with the variation seen in burden of premature death. Male morbidity in England was 5% higher than in Spain, and female morbidity just 7% higher than in Poland, the top ranked countries
- the greatest female morbidity was in Luxembourg at 11,400 YLD, only 14% higher than the lowest, in Poland at 10,000 YLD
- although morbidity for females in England was ranked lower than for males the difference in rankings between males and females was less significant given the overall lack of variation among EU countries
- in EU countries over half of the total burden of poor health was due to 3 disease groups: mental and substance use disorders (including depressive and anxiety disorders); musculoskeletal disorders (including low back and neck pain and arthritis); a group ‘other non-communicable diseases’ that includes skin diseases, hearing loss and sight loss
See the full data source: Global Burden of Disease Study 2015
6. Further information
The data presented in this chapter provide an overview of mortality and morbidity in EU countries. A more detailed examination of trends in death rates in England is provided in chapter 2 while trends in ill health and disability (morbidity) are discussed in chapter 3.
More detailed data comparing EU countries on a range of health indicators is available from the Eurostat website and more detailed GBD data can be extracted from the various GBD tools on the Institute for Health Metrics and Evaluation (IHME) website
7. Definitions
Life expectancy at birth
Life expectancy is an estimate of the average lifespan for a population and relates to a given period of time, often a year. It involves a relatively complex calculation using a combination of population data and data on all the deaths in the given year. Life expectancy is the most widely used summary measure of population health. It is typically calculated for males and females separately, but person life expectancy is also used. Longer average lifespans are associated with better health, shorter average lifespans with worse health.
Years of life lost
YLL is a health measure that relates to lifespan, summarising the level of premature death in a population over a period of time. The measure takes account of the age at which death occurs, with deaths at younger ages giving rise to greater ‘years of life lost’ than deaths at older ages. A population with greater YLL is less healthy than one with fewer YLL (IHME)
Definition:
Years of life lost (YLL): the years of life lost attributed to a single male/female death are equal to the highest male/female life expectancy globally at that age. For example, if a woman dies aged 50 in 2010 the ‘years of life lost’ are equal to the highest female life expectancy globally at age 50 in 2010. For a population the ‘years of life lost’ is the sum, for each person who dies prematurely in a given year of their individual ‘years of life lost’.
Relating life expectancy and years of life lost
The YLL measure is quite closely related to life expectancy, however the rankings produced by each measure are not always the same. In general, if country A has a longer life expectancy than country B, then A will have fewer years of life lost than B. However this is not necessarily always the case.
The YLL measure places more weight than life expectancy on deaths that occur at young ages. This means that country A could have higher YLL and also higher life expectancy than country B. This might occur if country A had higher mortality rates than B for young age groups but much lower mortality rates for older age groups.
Years lived with disability
YLD is a measure that summarises levels of poor health and disability in a given population. It combines the prevalence of each disease with a rating for the severity of its symptoms GBD frequently asked questions. This means for example that conditions with a low severity but high prevalence are comparable with conditions with a low prevalence and high severity, in terms of overall loss of quality of life.
The YLD measure is used throughout this chapter to describe the non-fatal burden and is referred to as morbidity. Better health is associated with fewer years lived in disability.
Definition:
‘Years lived with disability’ (YLD): years lived with disability is a measure of poor health or morbidity. For a particular year, the YLDs associated with a given disease or condition are calculated in 3 steps:
- The symptoms and disabilities associated with the disease are identified (each known as a ‘sequela’ for the disease).
- The prevalence of each of the associated sequela is multiplied by a ‘disability weight’ for the sequela capturing its severity. Disability weights represent the magnitude of health loss associated with each sequela. The weights are measured on a scale from 0 to 1, where 0 equals a state of full health and 1 equals death GBD collaborators, 2016.
- These figures for each sequelae associated with the disease or condition are then summed to give an overall estimate of the morbidity associated with the disease.
Terminology
Years of life lost and years lived with disability are measures of the impact of disease on the length of life and on the loss of health respectively. They are said to give a measure of the ‘burden of disease’ in a population. Years of life lost is said to be a measure of the burden of premature death. Years lived with disability is said to be a measure of the burden of poor health and disability, also the burden of morbidity and also simply, ‘health loss’.
8. Data notes
Absolute and age-standardised rate measures
A country with twice the population of another country will typically suffer twice the absolute number of ‘years of life lost’. It is important to adjust the measure so it is not sensitive to population size, to make comparisons between countries easier. In this chapter ‘years of life lost’ per 100,000 population is used to compare countries.
Furthermore, the estimates are age-standardised. This is because a country with a higher proportion of older people will typically suffer a higher burden of poor health, as many diseases are more common in old age groups. To improve the readability of figures in the text a burden of premature death is quoted as 300 YLL rather than 300 YLL per 100,000 age-standardised female/male population. Similarly, morbidity is quoted as 300 YLD rather than 300 YLD per 100,000 age-standardised female/male population.
GBD modelled estimates
In order to provide such comprehensive statistics, the Global Burden of Disease study uses modelling. The model utilises the same data sources used for standard life expectancy estimates, prevalence and incidence statistics. These include data from death certificates, health surveys, GP consultations, and hospital admissions.
This data is fed through a complex model that interpolates missing values, calibrates weaker sources to stronger ones and adjusts for differences in diagnosing and attribution of disease found globally. The power of such a comprehensive dataset is undeniable, but the estimates are subject to quite wide confidence intervals.
Morbidity measures and healthcare
Morbidity measures are very important for understanding the pressure on health and social care and care services. However data on morbidity is less accurate and complete than mortality data, and the confidence intervals around morbidity estimates tend to be wider than those around life expectancy or YLL estimates. In many countries, mortality data is complete and accurate due to the legal requirement to record death certificates.
Grouping of diseases for analysis
The International Classification of Disease (ICD10) lists over 10,000 codes for diseases, disorders, conditions, injuries and complaints. The GBD study groups these codes to simplify analyses, and takes a hierarchical approach.
There are 4 levels in the hierarchy:
- level 1 groups conditions into 3 broad categories:
- communicable
- non-communicable
- injuries
- level 2 has 21 disease groups, that link back to level 1
- level 3 links back to level 2
- level 4 links back to level 3
The list of diseases at each level is available from the Institute of Health Metrics (IHME).