Chapter 6: wider determinants of health
Published 11 September 2018

© Crown copyright 2018
This publication is licensed under the terms of the Open Government Licence v3.0 except where otherwise stated. To view this licence, visit nationalarchives.gov.uk/doc/open-government-licence/version/3 or write to the Information Policy Team, The National Archives, Kew, London TW9 4DU, or email: psi@nationalarchives.gov.uk.
Where we have identified any third party copyright information you will need to obtain permission from the copyright holders concerned.
This publication is available at https://www.gov.uk/government/publications/health-profile-for-england-2018/chapter-6-wider-determinants-of-health
1. Main messages
The wider determinants of health are a diverse range of social, economic and environmental factors which influence people’s mental and physical health. Systematic variation in these factors constitutes social inequality, an important driver of the health inequalities presented in Chapter 5.
The quality of the built and natural environment such as air quality, the quality of green spaces and housing quality also affect health. While the proportion of homes meeting the Decent Homes Standard has increased, homelessness has continued to rise, and housing has continued to become less affordable.
Educational attainment is linked to health behaviours and outcomes throughout a person’s life and varies considerably by socioeconomic position. The gap in the percentage of children achieving 5 GCSEs at A*-C between those living in the most deprived local authorities and those in the least deprived local authorities remains substantial.
Income and health are strongly associated. The proportion of individuals in the UK falling below the Minimum Income Standard (MIS) increased between 2008 to 2009 and 2013 to 2014, followed by a small decline to 29.7% in 2015 to 2016. A higher proportion of children were in households living below this standard (44.3%) than working age adults (29.0%) and pensioners (15.4%).
The employment rate in England was at a record high at 74.4% in 2016 to 2017. However, in-work poverty has increased. In 2015 to 2016, 57% of people living in households with incomes below 60% of the median (after housing costs) were children or working age adults from households with someone in work, up from 35% in 1994 to 1995.
Access to employment, and the benefits this can bring is much lower for people with certain limiting health conditions. In 2016 to 2017, only 5.7% of people with a learning disability and 7.0% of people in contact with secondary mental health services were in employment. The quality of work, and the health benefits work provides, also varies substantially.
Crime can have a wide ranging effect on people’s health. The rate of first time entrants into the criminal justice system reduced in 2017. However, police recorded violent crimes and violent sexual offences continued to rise in 2016 to 2017, with a larger increase in the most deprived local authorities.
2. Introduction
Good or bad health is not simply the result of individual behaviours, genetics and medical care. A substantial part of the difference in health outcomes is down to the social, economic and environmental factors that shape people’s lives[footnote 1]. These factors are collectively described as the wider determinants of health.
In this chapter, the wider determinants are grouped under the following headings: the built and natural environment, education, income, work and the labour market, crime and social capital. This chapter provides an update to the Health Profile for England 2017 but also presents some additional analysis.
Systematic variations in these factors are social inequalities. They determine the extent to which different individuals have the physical, social and personal resources to identify and achieve goals, meet their needs, and deal with changes to their circumstances[footnote 2]. These interactions of social factors with states of mind are known as psychosocial factors; they are an important mediator of the influence of the wider determinants of health outcomes[footnote 3].
The link between social inequalities and differences in health outcomes is strong and persistent[footnote 4], as presented in Chapter 5. Addressing the wider determinants of health will help improve health equity as well as overall health.
The mechanisms by which the wider determinants influence both mental and physical health can be complex and inter-related, often acting over a long time. Figure 1 is a model of the main health determinants developed by Dahlgren and Whitehead[footnote 5]. It places the individual and their ‘constitutional factors’ such as age and genetics in the centre, surrounded by individual lifestyle factors.
Outside these individual factors are the wider determinants: the conditions of people’s daily lives, and then the broader contextual socioeconomic, cultural and environmental conditions within which our lives take place. Crucially, the different layers of the model are shown as interlinked, highlighting the complex processes which determine people’s health.
Figure 1: the Dahlgren and Whitehead model of the main determinants of health[footnote 5]
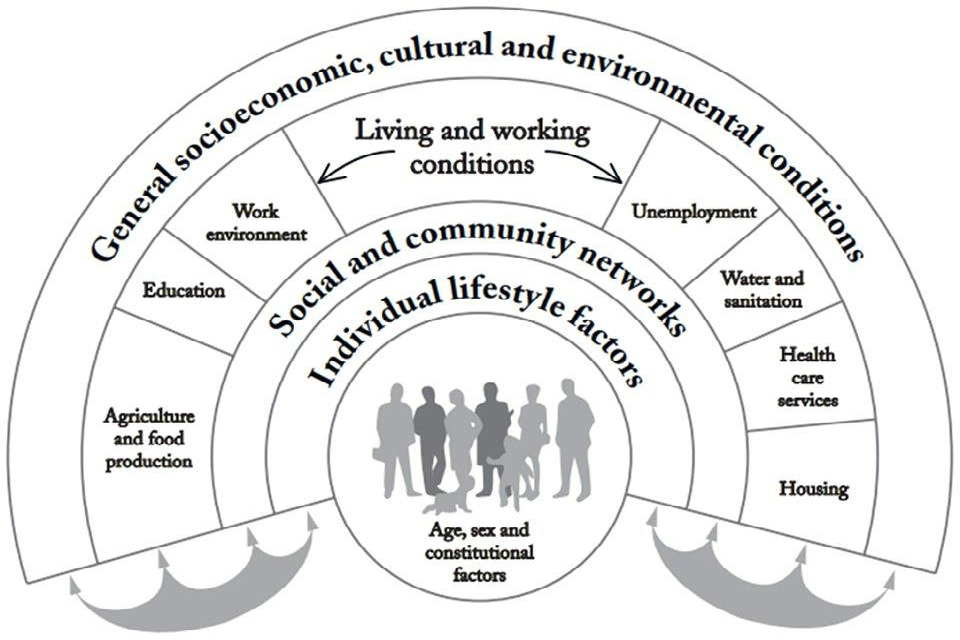
Figure 1: the Dahlgren and Whitehead model of the main determinants of health [Source: Dahlgren and Whitehead]
3. The built and natural environment
In England, most people spend large amounts of their time in human-made or modified environments. Features such as neighbourhood design, housing, the food environment, transport, and natural and sustainable environments are all recognised as determinants of health and are described in detail in the Public Health England (PHE) document Spatial Planning for Health.
Air quality is a central feature of the environment. A number of air pollutants have adverse effects on health. Some of the strongest evidence is for effects of fine particulate matter (PM2.5). Exposure to PM2.5 increases mortality risk, particularly from heart and lung conditions[footnote 6],[footnote 7].
The annual concentration of human-made fine particulate matter (adjusted to account for population exposure) varies across England, as seen in Figure 2. Higher concentrations were found close to specific sources of emissions (such as major ports) and more generally in larger urban areas with multiple sources. They are also strongly influenced by weather patterns. Long-range transport from Europe contributes to high concentrations across the mid- and south east of England.
At a more local level, disadvantaged communities are often disproportionately exposed to poor air quality[footnote 8] because they tend to be concentrated in and around polluted spots, such as busy roads. For more detail on the effect of air pollution, see Chapter 7.
Figure 2: annual concentration of human-made population weighted fine particulate matter (PM2.5), by lower tier local authority, England, 2016
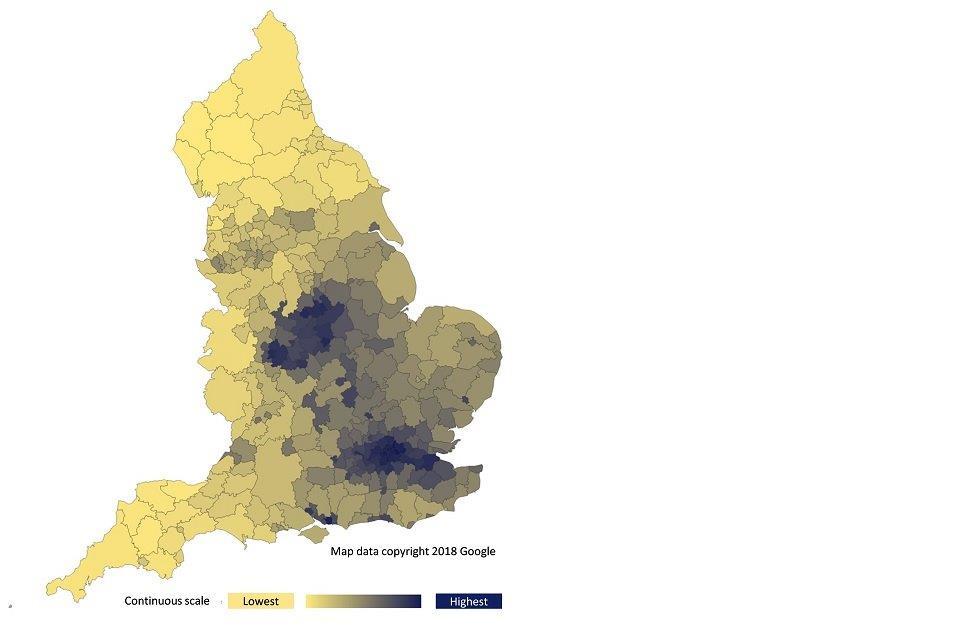
Figure 2: annual concentration of human-made population weighted fine particulate matter (PM2.5), by lower tier local authority, England, 2016 [Source: Wider determinants of health profile]
Notes: concentrations of PM2.5 vary from year to year due to a number of factors including changes in emissions and changes in weather. Variation due to weather is generally greater than the year to year variation due to changes in emissions. Population weighted concentrations are used to reflect population exposure.
There is evidence to suggest that access to green spaces has a beneficial effect on physical and mental wellbeing through both physical access and use[footnote 9]. In England, the proportion of people who used outdoor space for health or exercise in a given week increased from 14.0% in survey year 2011 to 2012 to 17.9% in 2014 to 2015 and was unchanged in 2015 to 2016. Access to green space is unequally distributed, with poorer communities generally having less access[footnote 10].
Many aspects of housing can affect our health. The Decent Homes Standard is an assessment of multiple elements of a dwelling. In 2016 20% of dwellings in England (equates to 4.7 million homes) failed to meet the standard, down from 35% in 2006[footnote 11]. The private rented sector had the largest proportion of dwellings not meeting the standard at 27%, compared with 20% of owner-occupied homes and 13% of social rented homes.
Another important aspect of both rented and owned housing is affordability. This influences where people live and work and affects the quality of housing, poverty, community cohesion, and time spent commuting[footnote 11]. The affordability of home ownership in England has worsened since 2013, when the ratio of median house price to median gross annual earnings was 6.8, it was 7.9 in 2017.
Figure 3 shows the regions that are the most and least affordable compared with the England average. In 2017, London was the least affordable, with median house prices 13.2 times higher than median earnings, while the North East was the most affordable with a ratio of 5.2. The difference between these two regions was three times larger in 2017 than it was in 2007 (the year, in recent records, when the difference was lowest).
Figure 3: trend in ratio of median house price to median gross annual residence-based earnings, England, London and the North East, from 2002 to 2017
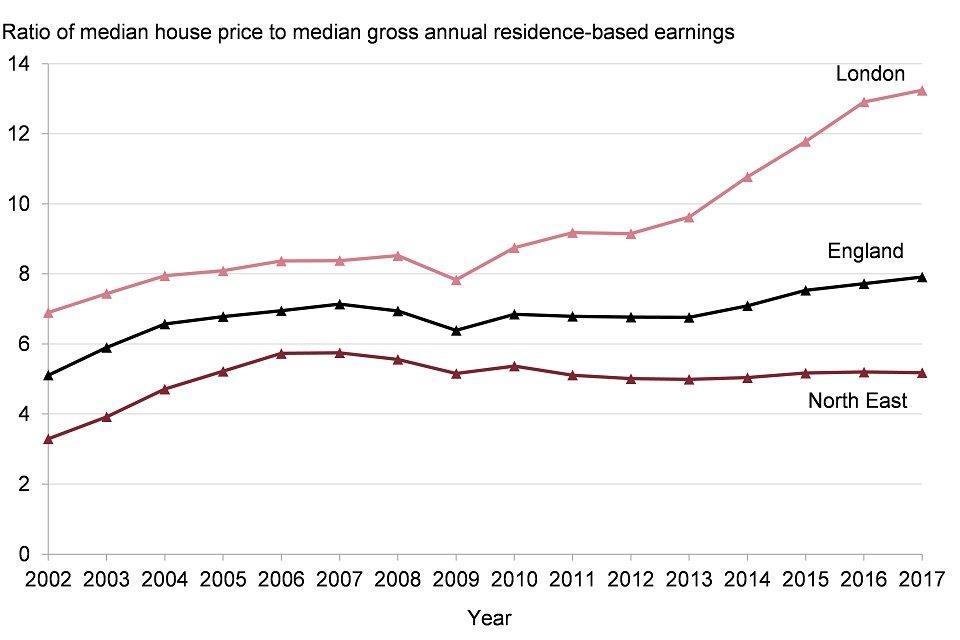
Figure 3: trend in ratio of median house price to median gross annual residence-based earnings, England, London and the North East, 2002 to 2017 [Source: Office for National Statistics, house price to residence-based earnings ratio]
Homelessness often results from a combination of individual and social issues. People who are homeless have poorer health on average than the general population and tend to die earlier[footnote 12]. Across England, the proportion of households in temporary accommodation due to statutory homelessness rose from 2.2 per 1,000 households in financial year 2010 to 2011 to 3.3 in 2016 to 2017. The annual Crisis homelessness monitor 2018 also reported an ongoing rise in rough sleeping[footnote 13].
4. Education
Educational attainment is strongly linked with health behaviours and outcomes. Better-educated individuals are less likely to suffer from long term diseases, to report themselves in poor health, or to suffer from mental conditions such as depression or anxiety[footnote 14]. Education provides knowledge and capabilities that contribute to mental, physical, and social wellbeing. Educational qualifications are also a determinant of an individual’s labour market position, which in turn influences income, housing and other material resources associated with health.
Children are assessed for ‘school readiness’ upon completion of the Reception year in school at around 5 years of age, as discussed in Chapter 4. To achieve a ‘good level of development’ a child needs to have reached expected levels in early learning goals relating to communication and language, physical development, and personal, social and emotional development[footnote 15]. The proportion of children in England assessed as achieving a good level of development has increased from 51.7% in academic year 2012 to 2013 to 70.7% in 2016 to 2017.
There are inequalities in school readiness: among children who are eligible for free school meals (indicative of low household income) the proportion was 56.0% in academic year 2016 to 2017, compared with 73.0% for children not eligible for free school meals. The gap has narrowed a small amount over the period since academic year 2012 to 2013, though remains substantial (Figure 4). See the Health Equity Dashboard for further information.
Figure 4: trend in the percentage of children achieving a good level of development at the end of reception, by free school meals status, England, academic year 2012 to 2013 up to 2016 to 2017

Figure 4: trend in the percentage of children achieving a good level of development at the end of reception, by free school meals status, England, academic year 2012 to 2013 up to 2016 to 2017 [Source: Department for Education, EYFS Profile statistical series]
Unequal attainment patterns are evident from early years and entrench through the education system. Attainment at key stage 4 split by deprivation decile highlights this inequality (Figure 5). In academic year 2015 to 2016, 57.8% of children in England achieved 5 GCSEs at A*-C including English and maths. However, in the most deprived decile of areas, 51.8% of children achieved this benchmark compared with 68.7% in the least deprived decile.
Figure 5: percentage of children achieving 5 GCSEs at A-C including English and Maths, by deprivation decile, England, academic year 2015 to 2016
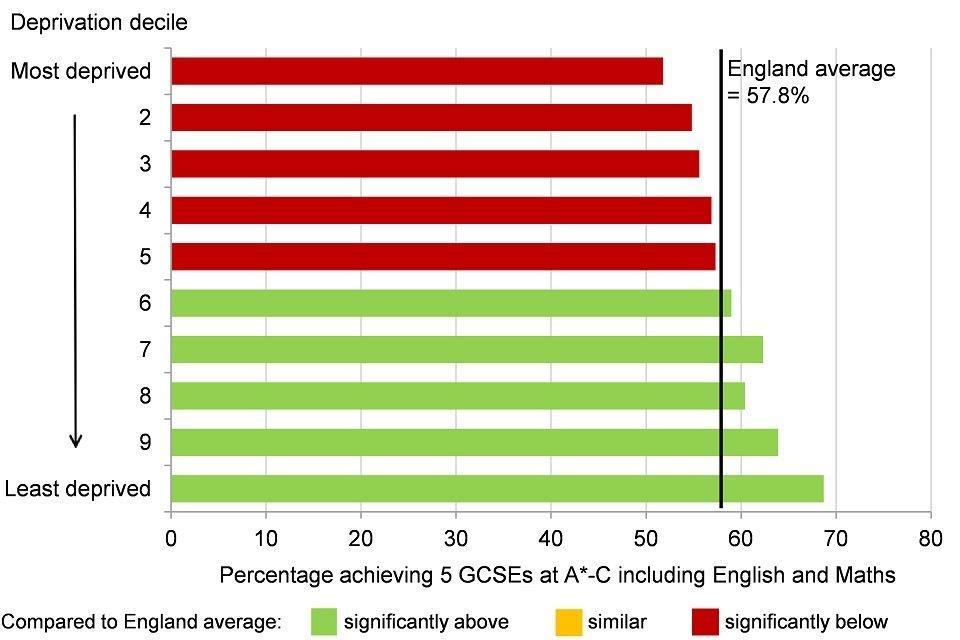
Figure 5: percentage of children achieving 5 GCSEs at A*-C including English and Maths, by deprivation decile*, England, academic year 2015 to 2016 [Source: Department for Education, Revised GCSE and equivalent results in England: 2015 to 2016]
*district and unitary authority deprivation deciles in England (Index of Multiple Deprivation 2015).
Remaining in education, employment or training after school is associated with a reduced risk of a range of negative mental and physical health outcomes, as well as better employment prospects[footnote 16]. In 2016, 6.0% of 16 to 17 year olds in England were not in education, employment or training, or their activity was not known.
5. Income
Many physical and mental health outcomes improve incrementally as income rises[footnote 17]. Income is related to life expectancy, disability free life expectancy[footnote 4], self-reported health and a range of biomarkers (objective indicators linked to diseases/conditions)[footnote 18]. The relationship operates through a variety of mechanisms. Financial resources determine the extent to which a person can both invest in goods and services which improve health and purchase goods and services which are bad for health. Low incomes can also prevent active participation in social life and day to day activities, affecting feelings of self-worth and status[footnote 19].
The Minimum Income Standard (MIS) is defined as not having enough income to afford a ‘minimum acceptable standard of living’, based on what members of the public think is enough money to live on[footnote 20]. The proportion of individuals in the UK not reaching the MIS rose from 25.8% in financial year 2008 to 2009 (when the measure began) to 31.4% in 2013 to 2014, then fell slightly to 29.7% in 2015 to 2016[footnote 20].
Figure 6 shows that people in social or private rented accommodation were more likely to be below the MIS in financial year 2015 to 2016 compared with owner occupiers, as were children compared with adults. Children in lone parent households (75.0%) were more at risk of falling below the MIS than those in couple parent families (35.0%).
Figure 6: percentage of individuals below the Minimum Income Standard, by household characteristics, UK, financial year 2015 to 2016
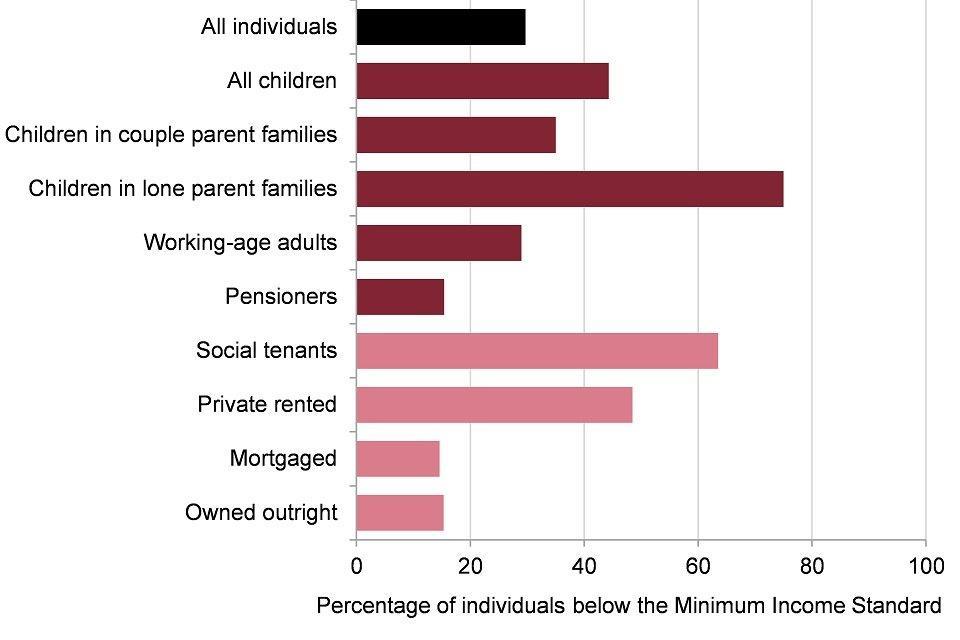
Figure 6: percentage of individuals below the Minimum Income Standard, by household characteristics, UK, financial year 2015 to 2016 [Source: Joseph Rowntree Foundation, Households below a Minimum Income Standard: 2008/09 - 2015/16 [See Methods, data and definitions - Minimum Income Standard]]
Child poverty is an important issue for public health, with evidence suggesting it can lead to premature mortality and poor health outcomes in subsequent adulthood[footnote 4].
Child poverty measures from the ‘households below average income’ analysis for the UK[footnote 21] show no significant change between the financial years 2015 to 2016 and 2016 to 2017. Unlike the MIS measure presented above which is based on public opinions of standard of living, these child poverty measures are based on people living in households below 60% of median income. Before housing costs, the percentage of children in relative low income households was 19%, while after housing costs the proportion remained steady at 30% in financial year 2016 to 2017 (Figure 7).
These levels were higher than the proportion of pensioners in low income households over the same period (17% before housing costs and 16% after housing costs)[footnote 21]. The available data mostly predates the higher levels of inflation seen during 2017 however, so the picture may be changing.
Figure 7: trend in percentage of children aged under 16 years living in relative low-income households, UK, financial year 2012 to 2013 up to 2016 to 2017
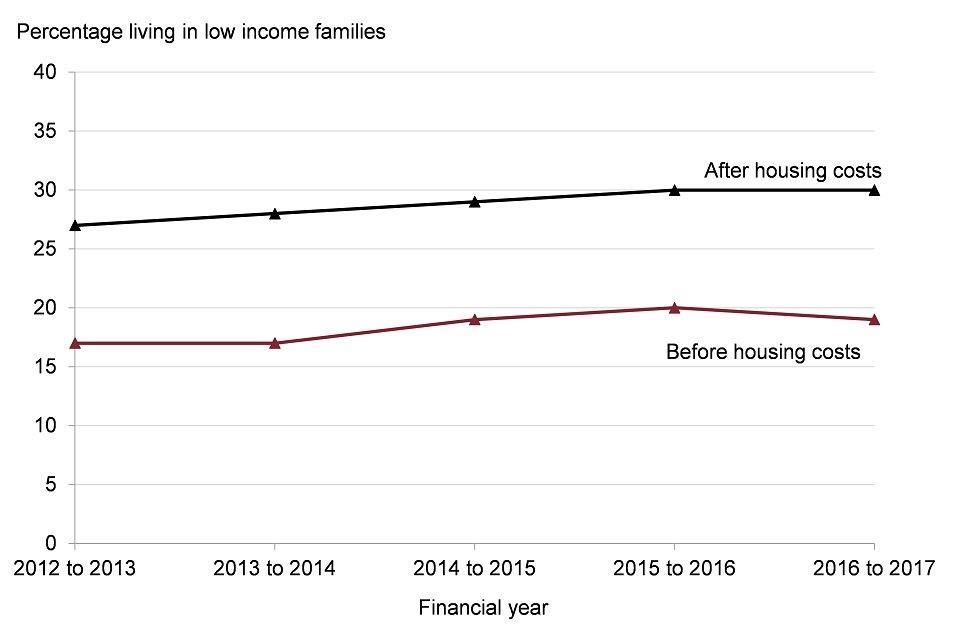
Figure 7: trend in percentage of children aged under 16 years living in relative low income households, UK, financial year 2012 to 2013 up to 2016 to 2017 [Source: Department of Work and Pensions (2018) HBAI: an analysis of the UK income distribution 1994/95 to 2016/17]
Notes: relative low income is household income below 60% of contemporary median income.
The proportion of children and working age adults living in workless households has fallen over the past two decades but being in work does not necessarily protect against low income. Analysis by the Institute of Fiscal Studies shows that in financial year 2015 to 2016, 57% of people in poverty (people living in households with incomes below 60% of the median after housing costs) were children or working age adults living in a household where someone was in work, up from 35% in 1994 to 1995[footnote 22].
Fuel poverty is the condition of being unable to afford to keep one’s home adequately heated for comfort and is associated with a reduced quality of health and excess winter deaths[footnote 23]. In England, 11% of all households were fuel poor in 2015. People living in the private rented sector were most vulnerable to fuel poverty, 21.3% of households experienced fuel poverty, compared with 7.4% of owner-occupiers.
6. Work and the labour market
A strong local economy provides sufficient quantity and quality of employment opportunities for the population. On the whole, work is good for mental and physical health[footnote 24]. In addition to the health benefits associated with an adequate wage, work can provide valuable social interactions, a place to develop and practice skills, and a sense of social participation and contribution to society[footnote 25].
A person’s employment status has both an associative and a causal relationship with a range of health outcomes[footnote 26],[footnote 27],[footnote 28]. While not working will be the right option for some people, staying out of work longer term may contribute to a worsening of health outcomes for others. Unemployment does not just affect working age people. Children growing up in workless households are almost twice as likely not to reach expected attainment at all stages of education compared with children growing up in working families[footnote 29].
Unemployment is the status of being available for work and looking for work, but not being in work. Unemployment in England increased substantially from 2008 peaking at over 8.0% during 2011[footnote 30], and saw a pronounced fall from 2013, down to 4.8% in 2016. However, in 2016, there was substantial variation among population groups. Unemployment among disabled people (8.9%) was double the proportion among people who were not disabled (4.4%) (Figure 8). Some ethnic minority groups also experienced significantly higher unemployment including the Pakistani or Bangladeshi (11.5%) and Black or Black British (10.3%) groups, compared with the White groups (4.3%)
Figure 8: trend in percentage of the economically active population who are unemployed, by disability status, England, 2013 to 2016
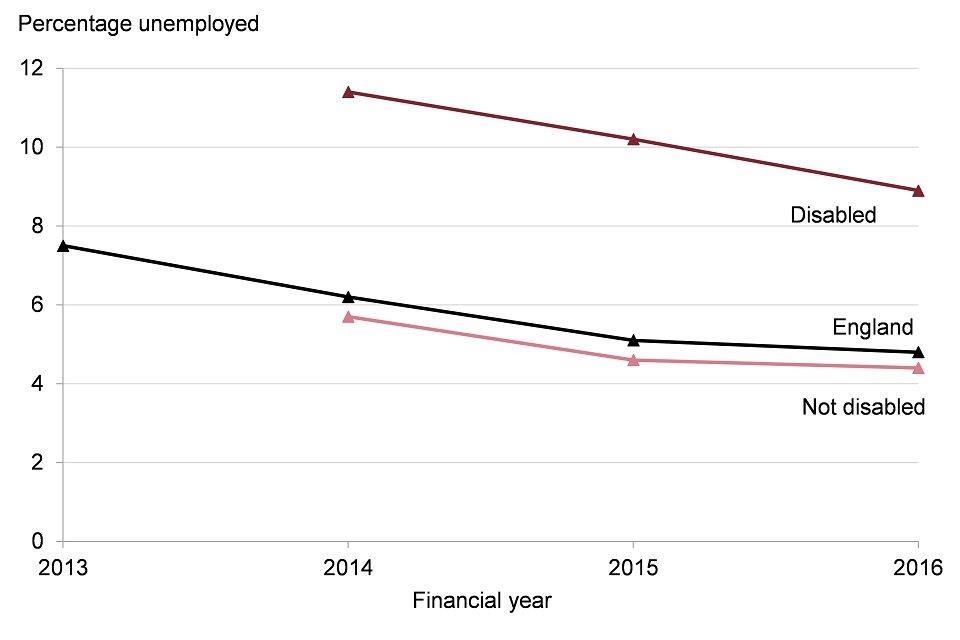
Figure 8: trend in percentage of the economically active population who are unemployed, by disability status, England, 2013 to 2016 [Source: NOMIS, Annual Population Survey/Labour Force Survey.]
Note: England value refers to population aged 16+, whereas the disabled/not disabled values refer to population aged 16-64. The ‘not disabled’ category is calculated by PHE.
The unemployment rate is strictly defined, requiring people to actively seek and be ready to start work, so it does not count people who are out of work for more complex reasons but would ideally like to work. The employment rate, in contrast, takes a wider look at the status of all people aged 16 to 64 years. Consequently, irrespective of the reason people are not working it gives insight into the proportion of different groups who gain the benefits that employment provides (though not all employed people will have as much work as desired).
Across all people aged 16 to 64 years old in England, the employment rate was 74.4% in financial year 2016 to 2017. This compares to an employment rate of 45.0% for people with long term health conditions, 7.0% for people in contact with secondary mental health services, and 5.7% for people with a learning disability (Figure 9). Employment is not appropriate for all people, but some of this inequality will compound health issues further by limiting access to the health benefits work can provide.
Figure 9: percentage of the population who are employed, by disability status, England, 2016 to 2017

Figure 9: percentage of the population who are employed, by disability status, England, 2016 to 2017 [Source: 1) NOMIS, Annual Population Survey/Labour Force Survey. 2) NHS Digital, Adult Social Care Outcome Framework.]
Notes: the values for England and people with long term health conditions are from a different source (source 1) to the values for people with a learning disability and people in contact with secondary mental health conditions (source 2). Reference age groups vary: values from source 1 are for 16 to 64 year olds; the value for people with a learning disability is for 18 to 64 year olds; the value for people in contact with secondary mental health services is 18 to 69 year olds.
See how your area compares:
Gap in employment rate for people with a long term health condition
Gap in employment rate for people in contact with secondary mental health services
Gap in employment rate for people with a learning disability
The availability of jobs in the economy is the most important determinant of employment and unemployment rates. Job density (the number of jobs relative to the number of working age people) has been increasing steadily, rising from 0.80 jobs per person in 2013 to 0.85 in 2016 in England
The quality of work, and consequently the health benefits work provides, varies substantially[footnote 31]. One topical issue is the changing nature of employment arrangements. The Office for National Statistics estimates that around 1.8 million contracts did not guarantee a minimum number of hours in November 2017 and that people on these contracts (also called zero-hour contracts) were more likely to want to work more hours compared with other workers[footnote 32].
For people in work, healthy workplaces are essential for a healthy workforce. There were nearly 4,000 illnesses caused or made worse by work per 100,000 workers in England in financial year 2016 to 2017. This rate has remained broadly flat in recent years, with around 80% of these illnesses being musculoskeletal disorders, stress, depression or anxiety[footnote 33]. These are leading causes of morbidity identified in Chapter 3.
7. Crime
Crime affects physical and mental health in many ways[footnote 34]. Violence against people is the most direct link, while the psychological effects of experiencing crime, whether violent or not, can also have far reaching consequences. Through less direct channels, the fear of crime can not only have psychological effects but directly reduce health promoting behaviours such as physical activity and social contact. Furthermore, the economic cost of crime to both individuals and public services may reduce resources available for health improvement. Perpetrators of crime are also more likely to have worse health across a range of conditions than the general population[footnote 35].
Both offenders and victims are more likely to live in the most deprived areas. The rate of first time entrants into the criminal justice system in the most deprived upper tier local authorities was 226.3 per 100,000 population in 2017, compared with 132.7 per 100,000 in the least deprived areas. Across England the rate reduced in 2017 to 166.4 per 100,000 population, down from 262.6 per 100,000 in 2014. The rate of first time entrants into the youth justice system follows the same pattern, with inequalities by deprivation level and a reducing trend across England.
Police recorded offences for violence against the person in England have increased from 10.6 per 1,000 in financial year 2012 to 2013, up to 20.0 per 1,000 in 2016 to 2017 (Figure 10). For people living in the most deprived upper tier local authorities the rate was 26.2 per 1,000, compared with 15.3 per 1,000 in the least deprived areas. The gap between the most and least deprived areas has widened as rates increased. A similar pattern is evident for police recorded violent sexual offences, both in the trend for England and for differences between the most and least deprived areas, though at the much lower rate of 1.9 per 1,000 in England in 2016 to 2017.
Figure 10: trend in police recorded violence against the person offences, rate per 1,000 population, England and selected deprivation deciles*, financial year 2010 to 2011 up to 2016 to 2017
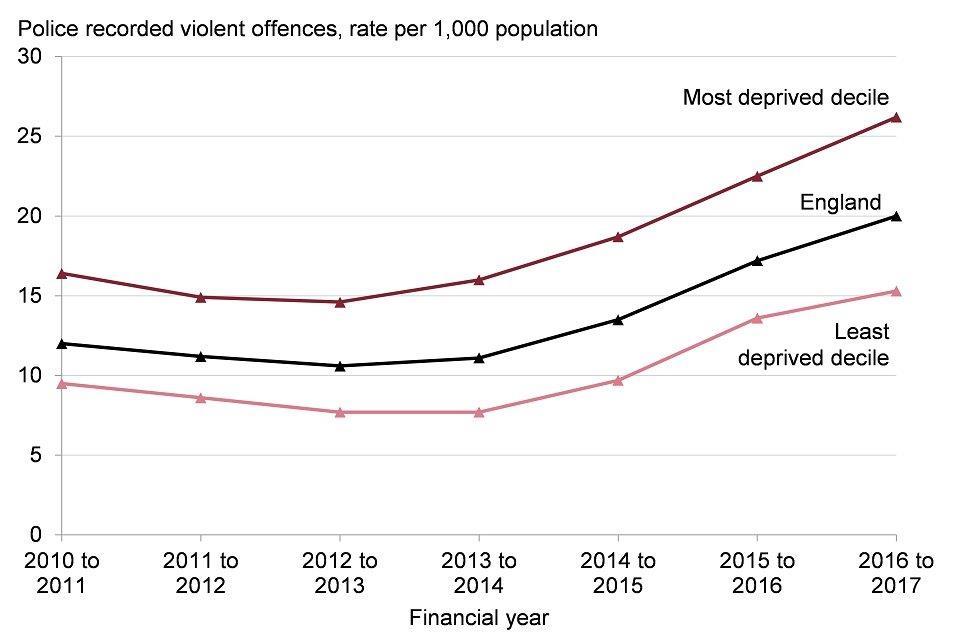
Figure 10: trend in police recorded violence against the person offences, rate per 1,000 population, England and selected deprivation deciles*, financial year 2010 to 2011 up to 2016 to 2017 [Source: Figures calculated by PHE using crime data supplied by the Home Office and population data supplied by Office for National Statistics (ONS).]
*County and unitary authority deprivation deciles in England (Index of Multiple Deprivation 2015).
Note: improved recording and/or increased reporting may be responsible for some change in reported crimes.
8. Social capital
Community life, social connections and having a voice in local decisions are all factors that have a vital contribution to make to health and wellbeing. These community level determinants build control and resilience and can help buffer against disease and influence health related behaviour[footnote 36].
The Community Life Survey revealed that 39% of the population in England formally or informally volunteered at least once a month in survey year 2016 to 2017[footnote 37]. Furthermore, the survey found that only 27% of people felt they could influence decisions that affect their local area, and 51% of people would like to be more involved in decisions made by their local council.
Most people in England (62% in survey year 2016 to 2017) felt strongly that they belonged to their immediate neighbourhood[footnote 37]. Those with a lower sense of belonging to their neighbourhood or who have little trust in others in their local area reported feeling lonely more often[footnote 38]. In England, around 1 in 5 adults in 2016 to 2017 reported feeling lonely all or some of the time[footnote 37]. Loneliness was reported more frequently by women than men, and by young adults (16 to 24 years) compared with those in older age groups. In addition, the most recent Adult Psychiatric Morbidity Survey 2014 found that most mental health problems were more common in people living alone[footnote 39].
9. Further information
PHE’s Wider Determinants of Health Profiles present further information.
PHE has a statutory duty to have due regard to reducing health inequalities within England: Health and Social Care Act 2012 and, like other public sector organisations, to promote equality: Equality Act 2010.
PHE’s Health Equity Board has selected 18 indicators to help monitor how these duties are met, and this forms the PHE Health Equity Dashboard. The indicators are drawn from the Public Health Outcomes Framework and indicators on the social determinants of health are included.
10. References
-
The King’s Fund (2016) Time to Think Differently. Broader determinants of health: future trends. Accessed 1 August 2016. ↩
-
Dennis R (2004) Social Determinants of Health: Canadian Perspectives. Toronto: Canadian Scholar’s Press Inc. ↩
-
Bell R (2017) Psychosocial pathways and health outcomes: Informing action on health inequalities. Public Health England. ↩
-
Marmot MG, Allen J, Goldblatt P and others. (2010) Fair society, healthy lives: Strategic review of health inequalities in England post-2010. Accessed 27 April 2018. ↩ ↩2 ↩3
-
Dahlgren G and Whitehead M (1993) Tackling inequalities in health: what can we learn from what has been tried? Working paper prepared for the King’s Fund International Seminar on Tackling Inequalities in Health, September 1993, Ditchley Park, Oxfordshire. London, King’s Fund. In Dahlgren, G. and Whitehead, M. (2007). Editors. European Strategies for Tackling Social Inequities in Health: Levelling Up Part 2. Copenhagen: WHO Regional Office for Europe; pp. 20 to 32. ↩ ↩2
-
COMEAP (2010) The Mortality Effects of Long-Term Exposure to Particulate Air Pollution in the United Kingdom. Accessed 27 April 2018. ↩
-
Air Quality Expert Group (2012) Fine Particulate Matter (PM2.5) in the United Kingdom. Accessed 27 April 2018. ↩
-
DEFRA (2006) Air quality and social deprivation in the UK: an environmental inequalities analysis. Final report to Department of Environment, Food and Rural Affairs. ↩
-
Whitelaw S and others. (2008) Physical activity and mental health: The role of physical activity in promoting mental wellbeing and preventing mental health problems: an evidence briefing. NHS Scotland: Edinburgh. ↩
-
Forest Research (2010) Benefits of green infrastructure: Health and well-being. Forest Research, Farnham. ↩
-
Ministry of Housing, Communities and Local Government (2018) English Housing Survey Headline Report, 2016 to 2017 Accessed 27 April 2018. ↩ ↩2
-
Local Government Association (2017) The impact of homelessness on health. A guide for local authorities Accessed 27 April 2018. ↩
-
Fitzpatrick S et al. (2018) The homelessness monitor: England 2018. ↩
-
Cutler DM and Lleras-Muney A (2006) Education and health: evaluating theories and evidence. National Bureau of Economic Research: Cambridge, MA. Working paper 12352. ↩
-
Department for Education (2017) Statutory framework for the early years’ foundation stage. Setting the standards for learning, development and care for children from birth to five Accessed 14 June 2017. ↩
-
Allen M (2014) Reducing the number of young people not in employment, education or training (NEET). Public Health England and the Institute of Health Equity. ↩
-
Joseph Rowntree Foundation (2014) How Does Money Influence Health?. Accessed 14 June 2017. ↩
-
Davillas A and others. (2017) The income-health gradient: Evidence from self-reported health and biomarkers using longitudinal data on income (No. 2017-03). ISER Working Paper Series. ↩
-
Anand S, Peter F and Sen A (2004) Public health, ethics, and equity. Oxford University Press on Demand. ↩
-
Padley M et al. (2017) Households below a Minimum Income Standard: 2008/09 to 2015/16. Joseph Rowntree Foundation. Accessed 27 April 2018. ↩ ↩2
-
Department of Work and Pensions (2018) HBAI: an analysis of the UK income distribution 1994/95 to 2016/17 Accessed 27 April 2018. ↩ ↩2
-
Joyce R (2018) Poverty and low pay in the UK: the state of play and the challenges ahead. Institute of Fiscal Studies. Accessed 27 April 2018. ↩
-
Hills J (2012) Getting the measure of fuel poverty. Final report of the fuel poverty review: CASE Report 72. Department of Energy and Climate Change. Accessed 14 June 2017. ↩
-
Waddell G and Burton K (2006) Is work good for your health and well-being? An independent review. Accessed 27 April 2018. ↩
-
Sen A (1997). Inequality, unemployment and contemporary Europe. International Labour Review, 136(2), 155 to 171. ↩
-
Warr P (1987) Work, unemployment, and mental health. New York: Oxford University Press. ↩
-
Brown J and others. (2012) Employment Status and Health: Understanding the Health of the Economically Inactive Population in Scotland. BMC Public Health, 12(327). ↩
-
Steele F and others. (2013) Adjusting for selection bias in longitudinal analyses using simultaneous equations modelling: the relationship between employment transitions and mental health. Epidemiology, 24(5), 703 to 711. ↩
-
Department for Work and Pensions (2017) Improving Lives, Helping Workless Families Accessed 14 June 2017. ↩
-
Office for National Statistics (2018) Unemployment rate (aged 16 and over, seasonally adjusted) Accessed 27 April 2018. ↩
-
Benach J and others. (2014) Precarious Employment: Understanding an Emerging Social Determinant of Health. Annual Review of Public Health. 35, 229 to 253. ↩
-
Office for National Statistics (2018) Contracts that do not guarantee a minimum number of hours: April 2018 Accessed 27 April 2018. ↩
-
Health and Safety Executive (2018) LFS - Labour Force Survey - Self-reported work-related ill health and workplace injuries: Index of LFS tables Accessed 27 April 2018. ↩
-
Lorenc T and otehrs. (2014) Crime, fear of crime and mental health: Synthesis of theory and systematic reviews of interventions and qualitative evidence. Public Health Research, 2(2). ↩
-
Public Health England (2017) Health and Justice Annual Review 2016/17 Accessed 19 June 2018. ↩
-
UCL Institute of Health Equity (2013) Review of social determinants and the health divide in the WHO European Region: executive summary. Copenhagen: World Health Organization Europe. ↩
-
Department for Digital, Culture, Media & Sport (2016) Community Life Survey 2016-2017 Accessed 12 June 2018. ↩ ↩2 ↩3
-
Office for National Statistics (2018) Loneliness – What characteristics and circumstances are associated with feeling lonely? Accessed 19 June 2018. ↩
-
McManus S, Bebbington P, Jenkins R, Brugha T. (eds.) (2016) Mental health and wellbeing in England: Adult Psychiatric Morbidity Survey 2014. Leeds: NHS Digital Accessed 19 June 2018. ↩