Chapter 6: social determinants of health
Published 13 July 2017

© Crown copyright 2017
This publication is licensed under the terms of the Open Government Licence v3.0 except where otherwise stated. To view this licence, visit nationalarchives.gov.uk/doc/open-government-licence/version/3 or write to the Information Policy Team, The National Archives, Kew, London TW9 4DU, or email: psi@nationalarchives.gov.uk.
Where we have identified any third party copyright information you will need to obtain permission from the copyright holders concerned.
This publication is available at https://www.gov.uk/government/publications/health-profile-for-england/chapter-6-social-determinants-of-health
1. Main messages
The broad social and economic circumstances that together influence health throughout the life course are known as the ‘social determinants of health’. There is a social gradient across many of these determinants that contribute to health with poorer individuals experiencing worse health outcomes than people who are better off.
Children growing up in more deprived areas often suffer disadvantages throughout their lives, from educational attainment through to employment prospects, which in turn affect physical and mental wellbeing. Although the percentages of children not ready for school, and young people not in education, employment or training (NEET) have both fallen in recent years, inequalities remain.
In the academic year 2015 to 2016, just under a third of those who were not eligible for free school meals were not ready for school at age 5, compared with almost half of children who were eligible and 1 in 20 young people living in deprived areas were NEET compared to 1 in 33 living in the least deprived areas.
Income and work are 2 of the most important determinants of health and wellbeing. Unemployment has been falling in England, down to 5.1% in 2015, but this proportion increases to 8.4% for people living in the most deprived areas, more than double that of people in the least deprived areas (3.4%). The quality of available work can also play a part in health outcomes both physically and mentally.
A healthy standard of living such as adequate income and housing is associated with many positive health outcomes. In the financial year 2014 to 2015, just under a third (30.2%) of individuals lived in households with an income below the minimum income standard and this was higher amongst children (45.7%) and children in lone parent families (74.5%).
2. Introduction
Chapter 5 presents a summary of health inequalities in England and shows that life expectancy is lowest in the most deprived areas, around 9 years shorter for males and 7 years shorter for females compared to those in the least deprived areas. These inequalities in population health are an example of the social gradient in health. The lower an individual’s social position the poorer an individual’s health is likely to be[footnote 1]. A regional divide is also evident with health outcomes generally worse and the social gradient in health steeper in northern regions compared to the south of England[footnote 1],[footnote 2].
Chapter 5 also shows that behavioural risk factors, such as smoking and a diet low in fruit and vegetables, are higher in more deprived areas. The drivers of these health and behavioural inequalities are reviewed in this chapter.
Health inequalities are underpinned by the conditions in which people are born, grow, live, work and age. The broad social and economic circumstances which together influence the quality of the health of the population are known as the ‘social determinants of health’[footnote 1] (figure 1). The mechanisms by which these social determinants impact on both mental and physical health are complex and inter-related, often acting over a long period of time[footnote 1].
2.1 Figure 1: the Dahlgren and Whitehead model of health determinants
The broad social and economic circumstances that together determine the quality of the health of the population are known as the ‘social determinants of health’
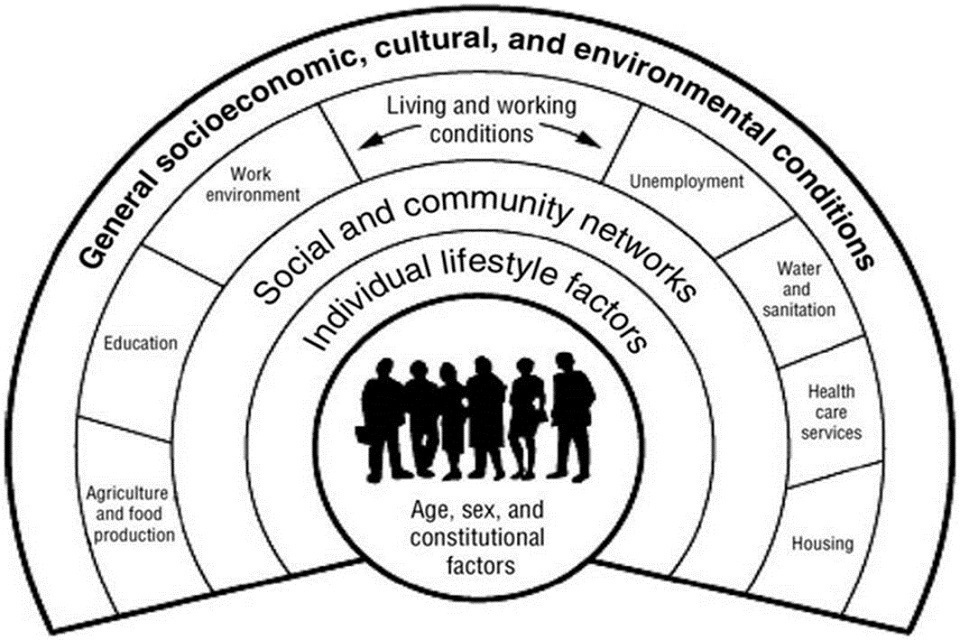
Figure 1. The Dahlgren and Whitehead model of health determinants [Source: Dahlgren and Whitehead (1991)]
This shows:
- personal characteristics occupy the core of the model and include sex, age, ethnic group, and hereditary factors
- individual ‘lifestyle’ factors include behaviours such as smoking, alcohol use, and physical activity
- social and community networks include family and wider social circles
- living and working conditions include access and opportunities in relation to jobs, housing, education and welfare services
- general socioeconomic, cultural and environmental conditions include factors such as disposable income, taxation, and availability of work
The Marmot Review ‘Fair Society, Healthy Lives’[footnote 1] states that action on health inequalities requires action across all of the social determinants of health. This chapter presents indicators of social determinants that influence health across the life course drawn from various (Public Health England) PHE tools. They reflect the priority areas for action identified in the Marmot Review.
3. Child development and educational attainment
Educational attainment is strongly linked with health behaviours and outcomes. More educated individuals are less likely to suffer from long-term diseases and to report themselves in poor health, or suffer from mental disorders such as depression or anxiety[footnote 3]. It is one of the key milestones for wellbeing through the life course and can impact on many outcomes in later life including, quality of work, future earnings, involvement in crime, morbidity, and death[footnote 4].
Children are assessed for their ‘school-readiness’ upon completion of the Reception Year in school, at around 5 years of age. To achieve a ‘good level of development’ a child should have reached the expected level in early learning goals around communication and language, physical development, and personal, social and emotional development. For example paying attention, listening to stories, using the toilet, dressing themselves, and they should have started to read, write and do simple sums[footnote 5].
The rate of school readiness has improved in recent years from just under a half of children in the academic year 2012 to 2013 (48.3%) not achieving a good level of development, to just under a third of all children (30.7%) in 2015 to 2016. However, reporting changes may account for the improvements seen between 2012 to 2013 and 2015 to 2016.
The rate of school readiness differs across the social gradient. From 2015 to 2016, 14.0% of children in England were eligible to receive free school meals (a proxy for low household income). Of these children, 45.6% did not reach a good level of development compared with 28.3% of children not eligible for free school meals (figure 2).
3.1 Figure 2: percentage of children who are not achieving a good level of development at the end of Reception Year (age 5) by free school meal status, England, 2012 to 2013 up to 2015 to 2016
Almost half of children eligible to receive free school meals do not achieve a good level of development by age 5 compared to under a third of children not eligible for free school meals
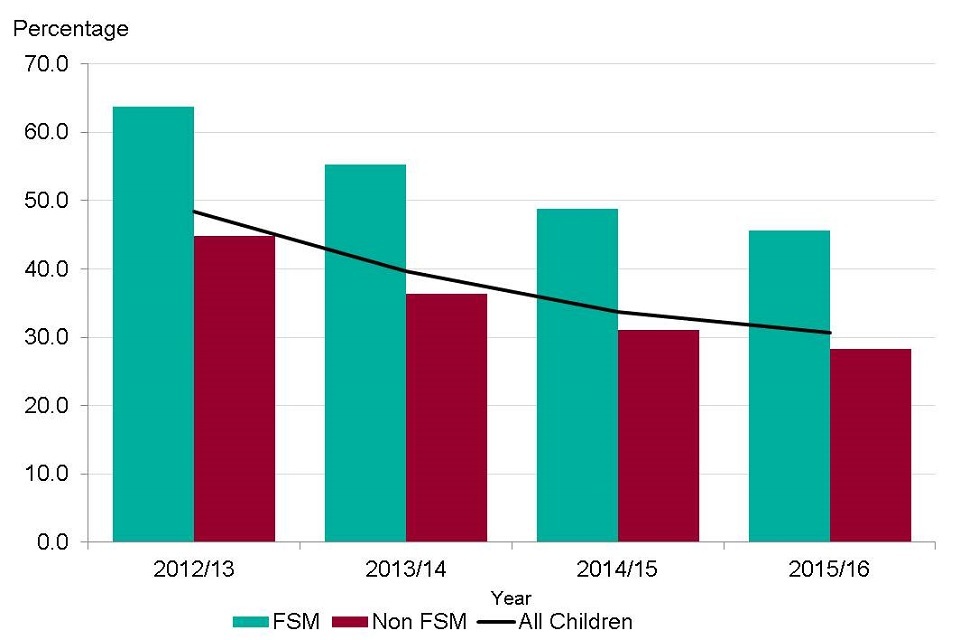
Figure 2. Percentage of children who are not achieving a good level of development at the end of Reception Year (age 5) by free school meal status, England, 2012/13 to 2015/16 [Source: Public Health Outcomes Framework: Health Equity Report]
Note: this is the inverse of the Marmot indicator on school readiness and the population of school children not eligible for free school meals has been calculated for comparison.
This shows:
- the rate of school readiness has improved in recent years, but around a third (30.7%) of all children did not reach a good level of development in 2015 to 2016
- 14% of children in England were eligible for free school meals (a proxy for low household income); Children eligible for receiving free school meals were significantly less likely to reach a good level of development than children not eligible for free school meals, with an attainment gap of 17 percentage points between the 2 groups. However, this gap has reduced from 19 percentage points in 2012 to 2013
Other disadvantaged groups also face challenges in development and educational attainment that can lead to poorer health outcomes in later life. Children with special educational needs, those whose first language is not English and children from the Gypsy, Roma community and travellers of Irish heritage have some of the lowest proportions of children achieving a good level of development[footnote 6],[footnote 7].
Further challenges exist for children in care who often have multiple risk factors inhibiting educational attainment. A higher proportion of children in care have special educational needs and poorer emotional and behavioural health[footnote 8], again impacting on educational attainment, and in turn health outcomes in later life. In addition, pupils in deprived areas are more likely to miss school and therefore have lower levels of educational attainment[footnote 9].
GCSE examinations assess school children in Year 11. For pupils leaving education, GCSEs will determine the kind of work they will be offered, while for pupils continuing in education, results will determine the courses open to them at the next level.
A total of 14% of children were eligible for free school meals in the academic year 2014 to 2015. Only a third (33.1%) achieved 5 good GCSEs (including maths and English), while nearly twice as many (60.9%) pupils not eligible for free school meals attained this level (figure 3). There has been little change in the size of the attainment gap between these 2 groups of children in recent years.
3.2 Figure 3: the proportion of pupils (aged 15 to 16 years) achieving 5 or more GCSEs of grade A* to C or equivalent including English and maths, by free school meal status. England, 2009 to 2010 up to 2014 to 2015
Only a third of children eligible for free school meals do well at GCSE compared to almost two-thirds of pupils who are not eligible to receive free school meals
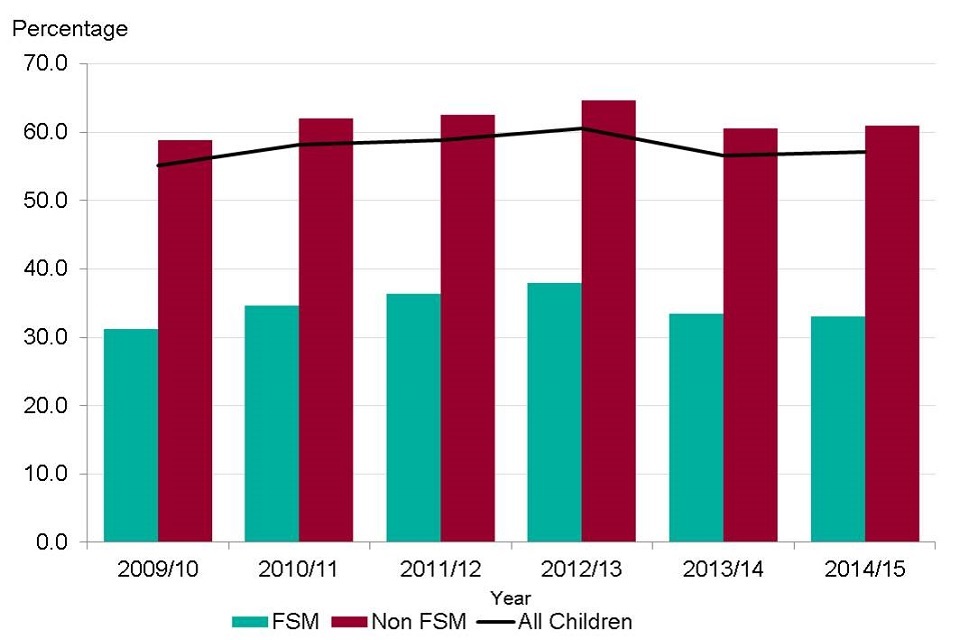
Figure 3. Proportion of pupils (aged 15-16 yrs) achieving 5 or more GCSEs of grade A* to C or equivalent including English and mathematics, by free school meal status. England, 2009/10 to 2014/15
This shows:
- 14% of children were eligible for free school meals in 2014 to 2015
- only a third (33.1%) of children eligible for free school meals achieved 5 good GCSEs including maths and English in 2014 to 2015, while nearly twice as many pupils not eligible for free school meals attained this level (60.9%)
- there has been little change in the size of the attainment gap between these 2 groups of children since 2009 to 2010
See the full data source: Department for Education: Revised GCSE and equivalent results in England: 2014 to 2015
4. Employment
Employment is one of the most important determinants of physical and mental health; the long-term unemployed have a lower life expectancy and worse health than those in work[footnote 10]. The effect of unemployment does not just affect individuals. Children growing up in workless households are almost twice as likely to fail at all stages of education compared with children growing up in working families[footnote 11].
Young people who are NEET are considered to be at greater risk of poor physical and mental health, being unemployed, and having low quality and low wage work in later life[footnote 12].
Over the past 4 years, there has been a steady decline in the proportion of young people in England who are NEET. This is due in part to legislation introduced in 2013 that required all young people to remain in some form of education or training until the end of the academic year in which they turned 17, a threshold that rose to age 18 in 2015.
Across the whole of England in 2015, 4.2% of 16 to 18-year-olds were NEET, which is down from 6.1% in 2011 before the changes in legislation (figure 4). However, there are still inequalities between different groups of the population, with the proportion of NEETs living in the most deprived areas at 5.1% compared to 3.0% in the least deprived areas and little change in the absolute gap over time (figure 4).
When analysis is focused on the 19 to 24 year age group to account for the age changes in compulsory education, the proportion of young adults who were NEET in 2016 was higher at 13.4%, but the overall trend showed a continuing decline from 2012 (16.4%)[footnote 13]. Deprivation data was unavailable for the 19 to 24 year age group.
4.1 Figure 4: the percentage of 16 to 18-year-olds who are NEET by deprivation decile, England, 2011 to 2015
In the most deprived areas 1 in 20 young people are NEET, compared with 1 in 33 young people living in the least deprived areas
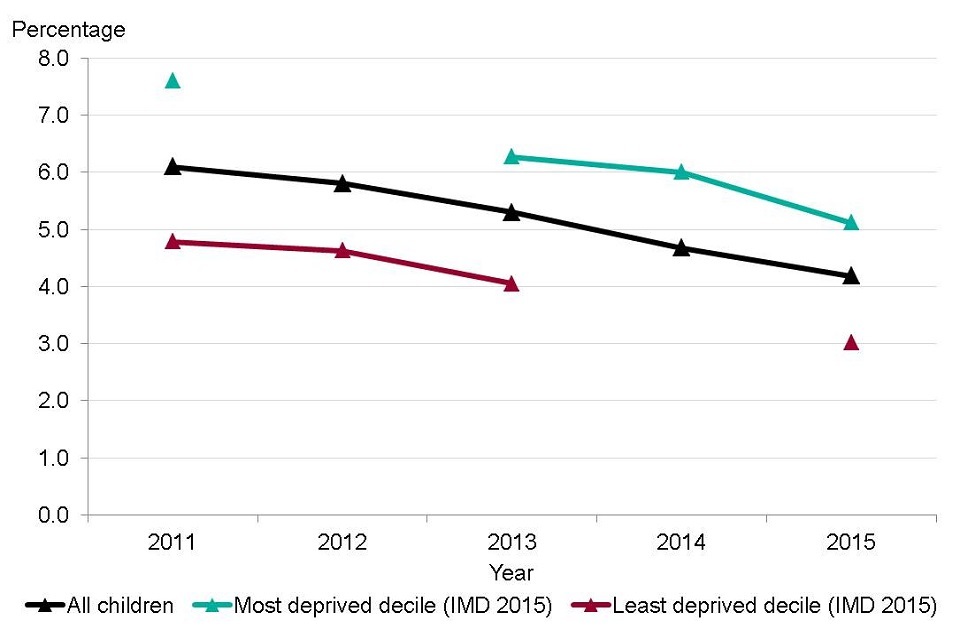
Figure 4. Percentage of 16-18 year olds not in education, employment or training (NEET) by Index of Multiple Deprivation (IMD) 2015 decile based on upper tier local authorities in England, 2011 to 2015 [Source: Public Health Outcomes Framework]
Note:
IMD 2015 deprivation deciles are based on upper tier local authority deciles[footnote 14].
Missing points for decile level data in 2012 and 2014.
This shows:
- over the last 4 years there has been a steady decline in the proportion of young people in England who are NEET; This is due in part to legislation introduced in 2013 that required all young people to remain in some form of education or training until the end of the academic year in which they turned 17, a threshold that rose to age 18 in 2015
- the proportion of young people who were NEET was significantly higher in the most deprived areas. In 2015, 5.1% of young people aged 16 to 18 years in the most deprived local authorities were NEET, compared to just 3.0% in the least deprived local authorities
Unemployment has been falling in England, down to 5.1% in 2015, but this proportion increases to 8.4% for people living in the most deprived areas, more than double that of people in the least deprived areas (3.4%) (figure 5).
4.2 Figure 5: unemployment rate in persons (16+ years) by deprivation decile, England, 2013 to 2015
Unemployment in the most deprived areas is more than double that of the least deprived areas
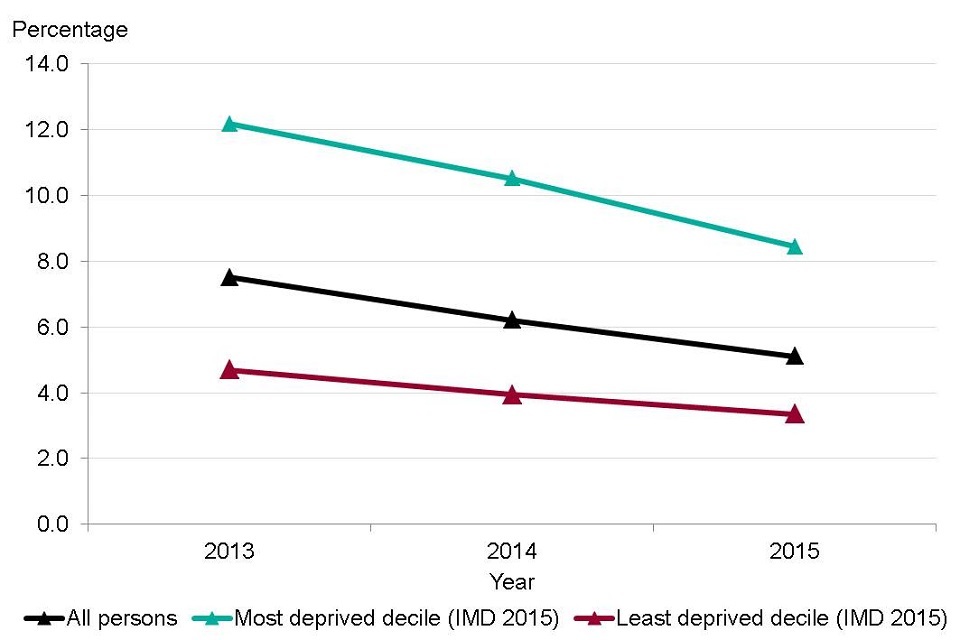
Figure 5. Unemployment rate in persons (16+ yrs) by Index of Multiple Deprivation (IMD) 2015 deciles based on District/Unitary Authority decile, England, 2013 to 2015 [Source: Wider Determinants of Health Profile]
Note: IMD 2015 deprivation deciles are based on district/unitary authority deciles[footnote 14].
This shows:
- there is a clear social gradient in unemployment
- in 2015, unemployment in the most deprived local authorities was more than double that of the least deprived local authorities
- the gap between unemployment in the most and least deprived decile has decreased from 7.5 percentage points in 2013 to 5.1 percentage points in 2015
While being in good quality employment can be good for physical and mental health, certain aspects of jobs or features of work can be detrimental.
The Marmot Review sets out 10 key components of good work that protect and promote good health. Examples of these include: having a safe working environment with good job security; individuals having a degree of control through decision-making on working patterns; appropriately challenging work; promoting a sense of belonging and meaningfulness; having the ability to participate in organisational decision making; and preventing social isolation. Lack of control and lack of reward at work are crucial determinants of several stress-related disorders and these are more prevalent among lower occupational status groups[footnote 1].
Self-reported work-related illness has been falling gradually in England over the last decade from 4,290 per 100,000 employees in the financial year 2012 to 2013 to 3,990 employees per 100,000 in 2014 to 2015[footnote 16].
Around 80% of self-reported work-related conditions in 2015 to 2016 were musculoskeletal and mental health disorders such as stress, depression and anxiety[footnote 17]. As outlined in chapters 3 and 4, these disease groups are major contributors to the total burden of morbidity across England and EU countries.
5. Living standards
There is a strong association between income and health, with many health outcomes improving incrementally as income rises. Income can affect many aspects of health and in turn, have a knock-on effect on other social determinants. For example, a parent’s income may influence a child’s early development and educational opportunities, which in turn can affect a child’s employment opportunities and their income[footnote 18].
The minimum income standard is defined as a ‘minimum acceptable standard of living’, based on what members of the public think is enough money to live on. The proportion of the population in England not reaching the minimum income standard has risen from 25.7% in the financial year 2008 to 2009 to 30.2% in 2014 to 2015, and the figure rises to 45.7% among children. For children in lone parent families in Britain, the figure is 74.5%[footnote 19].
Poor housing conditions are associated with a number of health problems, including respiratory infections, asthma and poor mental health[footnote 20],[footnote 21]. In 2013, a fifth of dwellings (21%, 4.8 million homes) failed to meet the decent homes standard[footnote 22], which is a reduction of 2.9 million homes since 2006 when around a third of homes (35%, 7.7 million) failed to meet the standard[footnote 23].
Significant expansion of the private rented sector in the last 20 years (from 10% to 19%), has provided an additional 2.5 million homes. However, this sector had the highest proportion of non-decent homes. The social rented sector had the lowest proportion of non-decent homes (15%) and almost a fifth (19%) of owner-occupied homes failed to meet the standard. Conditions in the private rented sector are still behind, but the situation has been an improving trend, falling from 47% of non-decent homes in 2006 to 28% in 2014. More families with children are using the private sector where homes are less likely to meet the decent homes standard.
With the shortage of housing in the social rented sector, due in part because of a lack of affordable housing[footnote 24], more low-income families are relying on private sector accommodation, where homes are less likely to be affordable and meet the decent homes standard.
Fuel poverty is the condition of being unable to afford to keep one’s home adequately heated for comfort, and this is one of the factors associated with a reduced quality of health[footnote 25]. In England, 10.6% of households were fuel poor in 2014 (figure 6). However, a social gradient in fuel poverty exists where those on lower household incomes are more likely to be at risk of fuel poverty, contributing to social and health inequalities[footnote 26].
In 2014, 12.6% of households living in the most deprived local authorities were living in fuel poverty, compared to just 7.6% of households in the least deprived local authorities. Households living on low income are more likely to live at lower temperatures[footnote 27], which is linked to a range of negative health outcomes[footnote 28], contributing to excess winter deaths across England and morbidity from cardiovascular and respiratory disease[footnote 25]. More information on excess winter deaths is presented in chapter 7.
5.1 Figure 6: the proportion of households living in fuel poverty by deprivation decile, England, 2014
Just over 1 in 10 households are in fuel poverty in England, equating to almost 2.4 million households
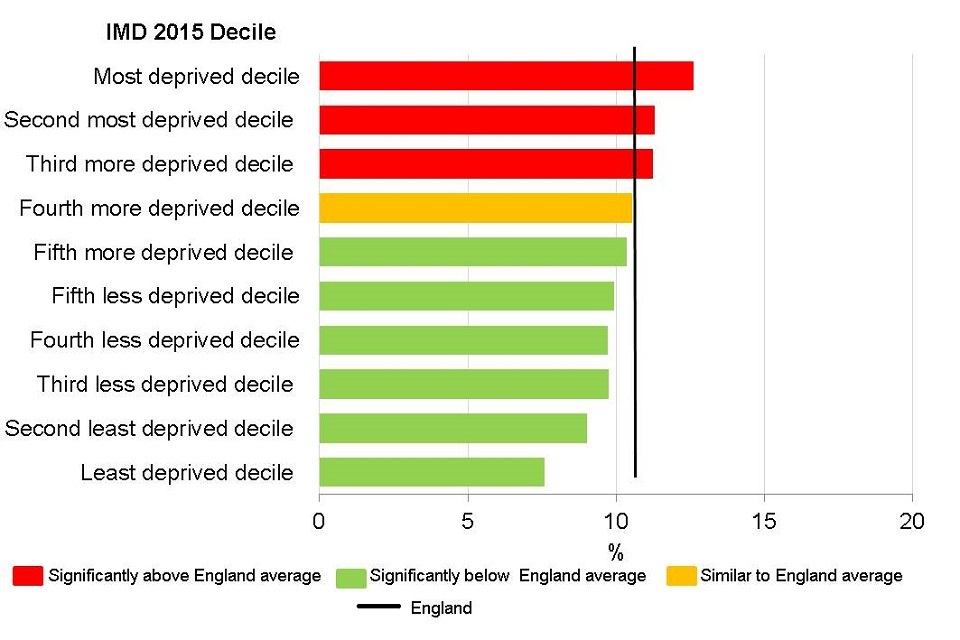
Figure 6. Proportion of households living in fuel poverty by Index of Multiple Deprivation (IMD) 2015 deciles based on District/Unitary Authority decile, 2014 [Source: Wider Determinants of Health Profile]
Note: IMD 2015 deprivation deciles are based on district/unitary authority deciles[footnote 14].
This shows:
- in England, 10.6% of households were fuel poor in 2014. This increases to 12.6% of households in the most deprived local authorities and reduces to 7.6% of those in the least deprived local authorities
- the proportion of households experiencing fuel poverty in the most deprived areas was significantly higher than those in the least deprived areas
6. Sustainable communities and places
There is strong evidence to suggest that access to green spaces has a beneficial impact on physical and mental wellbeing through both physical access and use[footnote 29]. Access to green space is unequally distributed across the social gradient, with poorer communities generally having less access[footnote 30].
In England, the proportion of people who used outdoor space in a given week for health or exercise increased from 14.9% in March 2012 to February 2013 to 17.9% in 2014 to 2015 (figure 7). While it is positive to note an increase, this still means that less than 1 in 5 people regularly use outdoor space for health or exercise. This indicator measures health behaviour, which is not a social determinent, but provides useful information about the use of outdoor space[footnote 31].
6.1 Figure 7: the proportion of people (aged 16+ years) using outdoor space for exercise/health reasons, England, 2011 to 2012 up to 2015 to 2016
18% of people use outdoor space for health or exercise
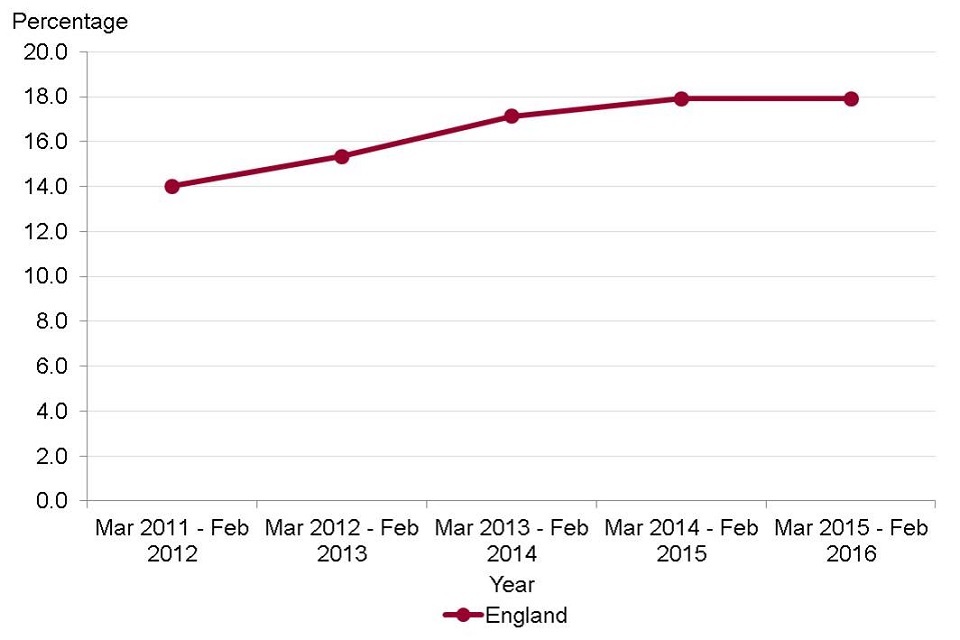
Figure 7. Proportion of people (aged 16+ yrs) using outdoor space for exercise/health reasons, England, 2011/12 to 2015/16 [Source: Wider Determinants of Health Profile]
This shows:
- the proportion of people in England using outdoor space for exercise and health reasons has significantly increased from 14% in 2011 to 2012 to almost 18% in 2015 to 2016
7. Further information
PHE has a statutory duty to have due regard to reducing health inequalities within England (Health and Social Care Act 2012), and like other public sector organisations, to promote equality (Equality Act 2010).
PHE’s Health Equity Board has selected 18 indicators to help monitor how these duties are met, and this forms the PHE Health Equity Dashboard. The indicators are all drawn from the Public Health Outcomes Framework and are divided into 3 groups:
- core, overarching health outcomes
- PHE priority areas
- social determinants of health
More information can be found in the report ‘Public Health Outcomes Framework: Health Equity Report. Focus on Ethnicity’[footnote 7].
8. References
-
The Marmot Review Team. (2010) The Marmot Review: Fair Society, Healthy Lives. ↩ ↩2 ↩3 ↩4 ↩5 ↩6
-
Ellis A, Fry R, Office for National Statistics. (2010) Regional health inequalities in England. Regional Trends 42: 60. Accessed 14 June 2017. ↩
-
Cutler DM, Lleras-Muney A. (2006) Education and health: evaluating theories and evidence. National Bureau of Economic Research: Cambridge, MA. Working paper 12352. ↩
-
PHE. (2015) Public Health Matters: Ensuring all children have the best start in life. Accessed 14 June 2017. ↩
-
Department for Education. (2017) Statutory framework for the early years foundation stage. Setting the standards for learning, development and care for children from birth to five. Accessed 14 June 2017. ↩
-
Department for Education. (2016) Early years foundation stage profile results: 2015 to 2016. Accessed 14 June 2017. ↩
-
Public Health Outcomes Framework: Health Equity Report. Focus on Ethnicity. ↩ ↩2
-
Department for Education. (2013) Outcomes for Children Looked after by Local Authorities in England, as at 31 March 2013. Accessed 14 June 2017. ↩
-
Department for Education. (2011) New data highlights true picture of school absence. Accessed 14 June 2017. ↩
-
Bartley M, Ferrie J, Montgomery SM. (2005) Chapter 5: Health and labour market disadvantage: unemployment, non-employment and job insecurity. Social Determinants of Health 2nd Edition. Oxford University Press: Oxford. ↩
-
Department for Work and Pensions. (2017) Improving Lives, Helping Workless Families. Accessed 14 June 2017. ↩
-
Public Health England and the Institute of Health Equity. (2014) Reducing the number of young people not in employment, education or training. Accessed 14 June 2017. ↩
-
PHE. (2017) Wider Determinants of Health in 19 to 24-year-olds not in education, employment or training. Accessed 14 June 2017. ↩
-
The IMD is a measure of relative deprivation for small areas. Deciles are calculated by ranking local authorities’ IMD scores from most deprived to least deprived and dividing into 10 equal groups. These deciles range from most deprived 10% to the least deprived 10% of areas nationally. ↩ ↩2 ↩3
-
PHE. (2017) Wider Determinants of Health: Work-related illness. Accessed 14 June 2017. ↩
-
Health and Safety Executive. (2017) Work-related ill health and occupational disease. Accessed 14 June 2017. ↩
-
Joseph Rowntree Foundation. (2014) How Does Money Influence Health? Accessed 14 June 2017. ↩
-
Joseph Rowntree Foundation. (2017) Just about managing: Four million more people living on inadequate incomes in modern Britain. Accessed 14 June 2017. The Joseph Roundtree Foundation report provides data for Britain rather than England. The estimates reported for the proportion of the population not reaching the MIS for all people and for children are for England and were supplied to PHE by the JRF. The figure for children in lone-parent families is from the published report and is for Britain rather than England. ↩
-
PHE. (2015) Understanding the cost of poor housing to health: BRE briefing papers.. Accessed 14 June 2017. ↩
-
Krieger J, Higgins DL. (2002) Housing and Health: Time Again for Public Health Action. American Journal of Public Health 92(5): 758-768. Accessed 14 June 2017. ↩
-
The decent homes standard is based on four criteria, of which one is the need to meet the minimum standard for housing. Estimates of whether this standard is met are based on 15 hazards in order to maintain consistency with survey estimates since 2006. ↩
-
Department for Communities and Local Government. (2014) English Housing Survey: Headline Report 2013-14. Accessed 14 June 2017. ↩
-
Shelter. (2017) Why we need more social housing. Accessed 16 June 2017. ↩
-
Hills J. (2012) Getting the measure of fuel poverty. Final report of the fuel poverty review: CASE Report 72. LSE: London. Accessed 14 June 2017. ↩ ↩2
-
PHE and the Institute of Health Equity. (2014) Local action on health inequalities: Fuel poverty and cold-related health problems. Accessed 14 June 2017. ↩
-
Wilkinson P, Armstrong B, London M. (2001) Cold comfort: The social and environmental determinants of excess winter deaths in England, 1986-1996. Joseph Roundtree Foundation: London. Accessed 14 June 2017. ↩
-
Marmot Review Team. (2011) The Health Impacts of Cold Homes and Fuel Poverty. Accessed 14 June 2017. ↩
-
Whitelaw S, Swift J, Goodwin A, Clark D. (2008) Physical activity and mental health: The role of physical activity in promoting mental wellbeing and preventing mental health problems: an evidence briefing. NHS Scotland: Edinburgh. ↩
-
Forest Research. (2010) Benefits of green infrastructure: Health and well-being. Accessed 18 May 2017. ↩
-
Public Health Outcomes Framework. (2017) Utilisation of outdoor space for exercise/health reasons. Indicator Definitions and Supporting Information. ↩