NTS 2025: Quality report
Updated 11 September 2026
Applies to England

© Crown copyright 2026
This publication is licensed under the terms of the Open Government Licence v3.0 except where otherwise stated. To view this licence, visit nationalarchives.gov.uk/doc/open-government-licence/version/3 or write to the Information Policy Team, The National Archives, Kew, London TW9 4DU, or email: psi@nationalarchives.gov.uk.
Where we have identified any third party copyright information you will need to obtain permission from the copyright holders concerned.
This publication is available at https://www.gov.uk/government/statistics/national-travel-survey-2025/nts-2025-quality-report
Introduction
Purpose of the report
This background quality report relates to the National Travel Survey statistical series. The purpose of this document is to provide users of the statistics with information about the quality of the outputs, measured against different dimensions of statistical quality. It also provides information about how the department has responded to previous user feedback, as well as planned developments. As a result, this document helps to demonstrate how the Department complies with the Code of Practice for Statistics. For information about the release and the tables see the technical reports and notes and definitions
Overview of the National Travel Survey
The NTS is a household survey of personal travel by residents of England travelling within Great Britain, from data collected via interviews and a one-week travel diary. The NTS is part of a continuous survey that began in 1988, following ad-hoc surveys from the 1960s, which enables analysis of patterns and trends.
Accreditation and Code of Practice compliance
The NTS is produced to high professional standards set out in the Code of Practice for Statistics. The NTS was confirmed as National Statistics in July 2011 by the UK Statistics Authority and passed its most recent Office for Statistics Regulation compliance check in September 2018.
Recent methodological changes
A new digital diary was introduced as the primary travel data collection tool for the NTS in January 2025. This was among the largest methodological changes in NTS history requiring intensive development and testing over a number of years, and alterations to fieldwork process and training. The digital diary was designed to replicate the paper diary as closely as possible, however as a new mode of data collection it appears to have some impacts on the data collected. Section 3 gives details on the development and implementation of the digital diary, work undertaken to date on understanding its impact, and further work planned for the future.
Impact of the Covid-19 pandemic
From March 2020, NTS data collection was affected by varying restrictions associated with the coronavirus (COVID-19) pandemic. Following a pause in fieldwork in March and April 2020, the NTS then relied upon data collection via ‘push-to-telephone’ with interviews being conducted over the telephone and interviewers completing the travel diary on behalf of respondents. During 2021, a ‘knock-to-nudge’ approach was introduced, whereby an interviewer would knock at the door of an address to encourage participation (but not enter the address) and arrange to complete the interview and diaries via telephone.
Due to the emergence of the Omicron variant in late 2021, the knock-to-nudge approach was retained for the first quarter of 2022. As the effects of the pandemic eased, the NTS returned to face-to-face interviewing from April onwards, retaining the option of a telephone backup. 2023 was the first full year since the beginning of the pandemic in which fieldwork operated normally, i.e. face-to-face.
During the pandemic, the field force of interviewers available to work on the NTS reduced substantially, meaning that in 2022 not all households could be surveyed face-to-face as planned, instead relying on the push-to-telephone method employed as a back-up. Across the whole of 2022, this method was used for some 1,666 addresses, or 13% of the full sample (12,852 households). Response rates for push-to-telephone were substantially lower, meaning that this is one of the key reasons for the overall 2022 response rate being lower than in pre-pandemic years. The push-to-telephone method was not retained for 2023.
For these reasons, data from 2020 to 2022 are considered as standalone years and users are advised to exercise caution when comparing trends to other years.
Response rates have remained substantially lower than in pre-pandemic years. This is due to a number of factors such as challenges in the recruitment and retention of interviewers, and a slightly higher rate of refusals. However, from 2023 the NTS operated with its normal fieldwork methodology (face-to-face interviews), and the composition of the responding sample is closer to target and more similar to that achieved in pre-pandemic times. The sample is therefore more efficient, and corrective weighting is smaller than in pandemic-affected years.
More details on the changes made to fieldwork operations and weighting strategies in 2020 to 2022, and their impact on the data, can be found Chapter 1 of the 2022 Technical Report.
Section 1: Background to the statistics
About the National Travel Survey
The National Travel Survey (NTS) is a stratified random household survey of personal travel by residents of England travelling within Great Britain, from data collected via interviews and a one-week travel diary. The NTS is a continuous survey that began in 1988, following ad-hoc surveys conducted periodically starting in the 1960s, which enables analysis of long-term trends and travel patterns. NTS data is collected on behalf of DfT by our contractor, the National Centre for Social Research (NatCen), via two main methods: a household survey conducted face-to-face with all members of the household, followed by a 7-day travel diary for each household member. The travel diary is completed either on paper or via the digital diary hosted on gov.uk, which is developed and maintained by Ghost Digital Limited. The NTS covers travel by people in all age groups, including children, across England.
Purpose and uses of the statistics
The NTS provides the main and trusted source of data for the Department for Transport (DfT) on personal travel by residents of England within Great Britain. The purpose of the NTS is to inform all interested parties, within and outside government, on how and why different sectors of the population travel, and how this changes over time. The NTS’ longevity, richness of data, and focus on the users of transport make it a unique and widely utilised data source.
Informing policy
NTS data is regularly used to aid the development of DfT policies including contributing to the evidence base to support DfT’s work on the Government missions and most recently in development of the DfT’s Better Connected strategy. NTS data is frequently used by other government departments, for example:
- travel to school data used by the Department of Education as the key national source of data on this topic, and used to inform the cross-departmental school streets initiative
-
travel time estimates being used by the Ministry of Housing and Local Government in allocating the Local Government Funding Settlement
- rural travel data used by the Department for the Environment, Food and Rural Affairs in its Connectivity and Accessibility statistics for Rural England
Supporting transport planning
Data from the NTS is fed into and used to calibrate key strategic forecasting models such as the National Trip End Model and the National Car Ownership Model.
External use including open data access
The NTS statistical release comprises the narrative report, a set of approximately 90 statistical tables and adhoc releases based on statistics compiled for freedom of information and other requests made to the team, including commissions for statistics to support emerging policy priorities. The statistics consistently rank in the top three most accessed statistical publications by the Department for Transport. The full dataset is made available to researchers via the UK Data Service. Users can access the safeguarded data at three different levels depending on their project requirements. The data is accessed over 300 times per year, primarily by academics and groups working on behalf of local authorities to develop local transport models and plans.
Methodology and data production
The NTS has a long-established methodology, however where weaknesses or potential improvements are identified, these are explored, tested and incorporated into the survey. Reports detailing the methods and findings from various developments and experiments are available.
The following sections describe various aspects of the NTS methodology and their impacts on the quality of the data. Further details can be found in the technical reports.
Sample selection The NTS is designed to provide a representative sample of households in England and in 2025 was based on a stratified, clustered random sample of 35,156 private households. This sampling frame is the Postcode Address File (PAF), which is a list of all addresses in England. Postcode sectors are employed as Primary Sampling Units (PSUs). The sample is drawn by selecting a number of PSUs and then by selecting 22 addresses within each PSU.
The NTS uses a quasi-panel design, where half the PSUs in a given year’s sample are retained for the next year’s sample and the other half are replaced. This has the effect of reducing the variance of estimates of year-on-year change.
Stratification
Grouped postcode sectors in England are stratified using a regional variable, an urban or rural indicator, and car ownership, all drawn from Census data. This is done to increase the precision of the sample and to ensure that the different strata in the population are correctly represented. The most recent stratification review is available.
London
Response rates tend to be much lower in London compared with the rest of England. The NTS oversamples London with the aim of achieving responding sample sizes in London and elsewhere which are proportional to their population.
Ineligible households
There are some address types which are classified as ineligible to participate in the NTS. These types of addresses include houses which are not yet built or under construction, vacant houses and non-residential addresses such as an address occupied solely by a business.
Data collection
Start date
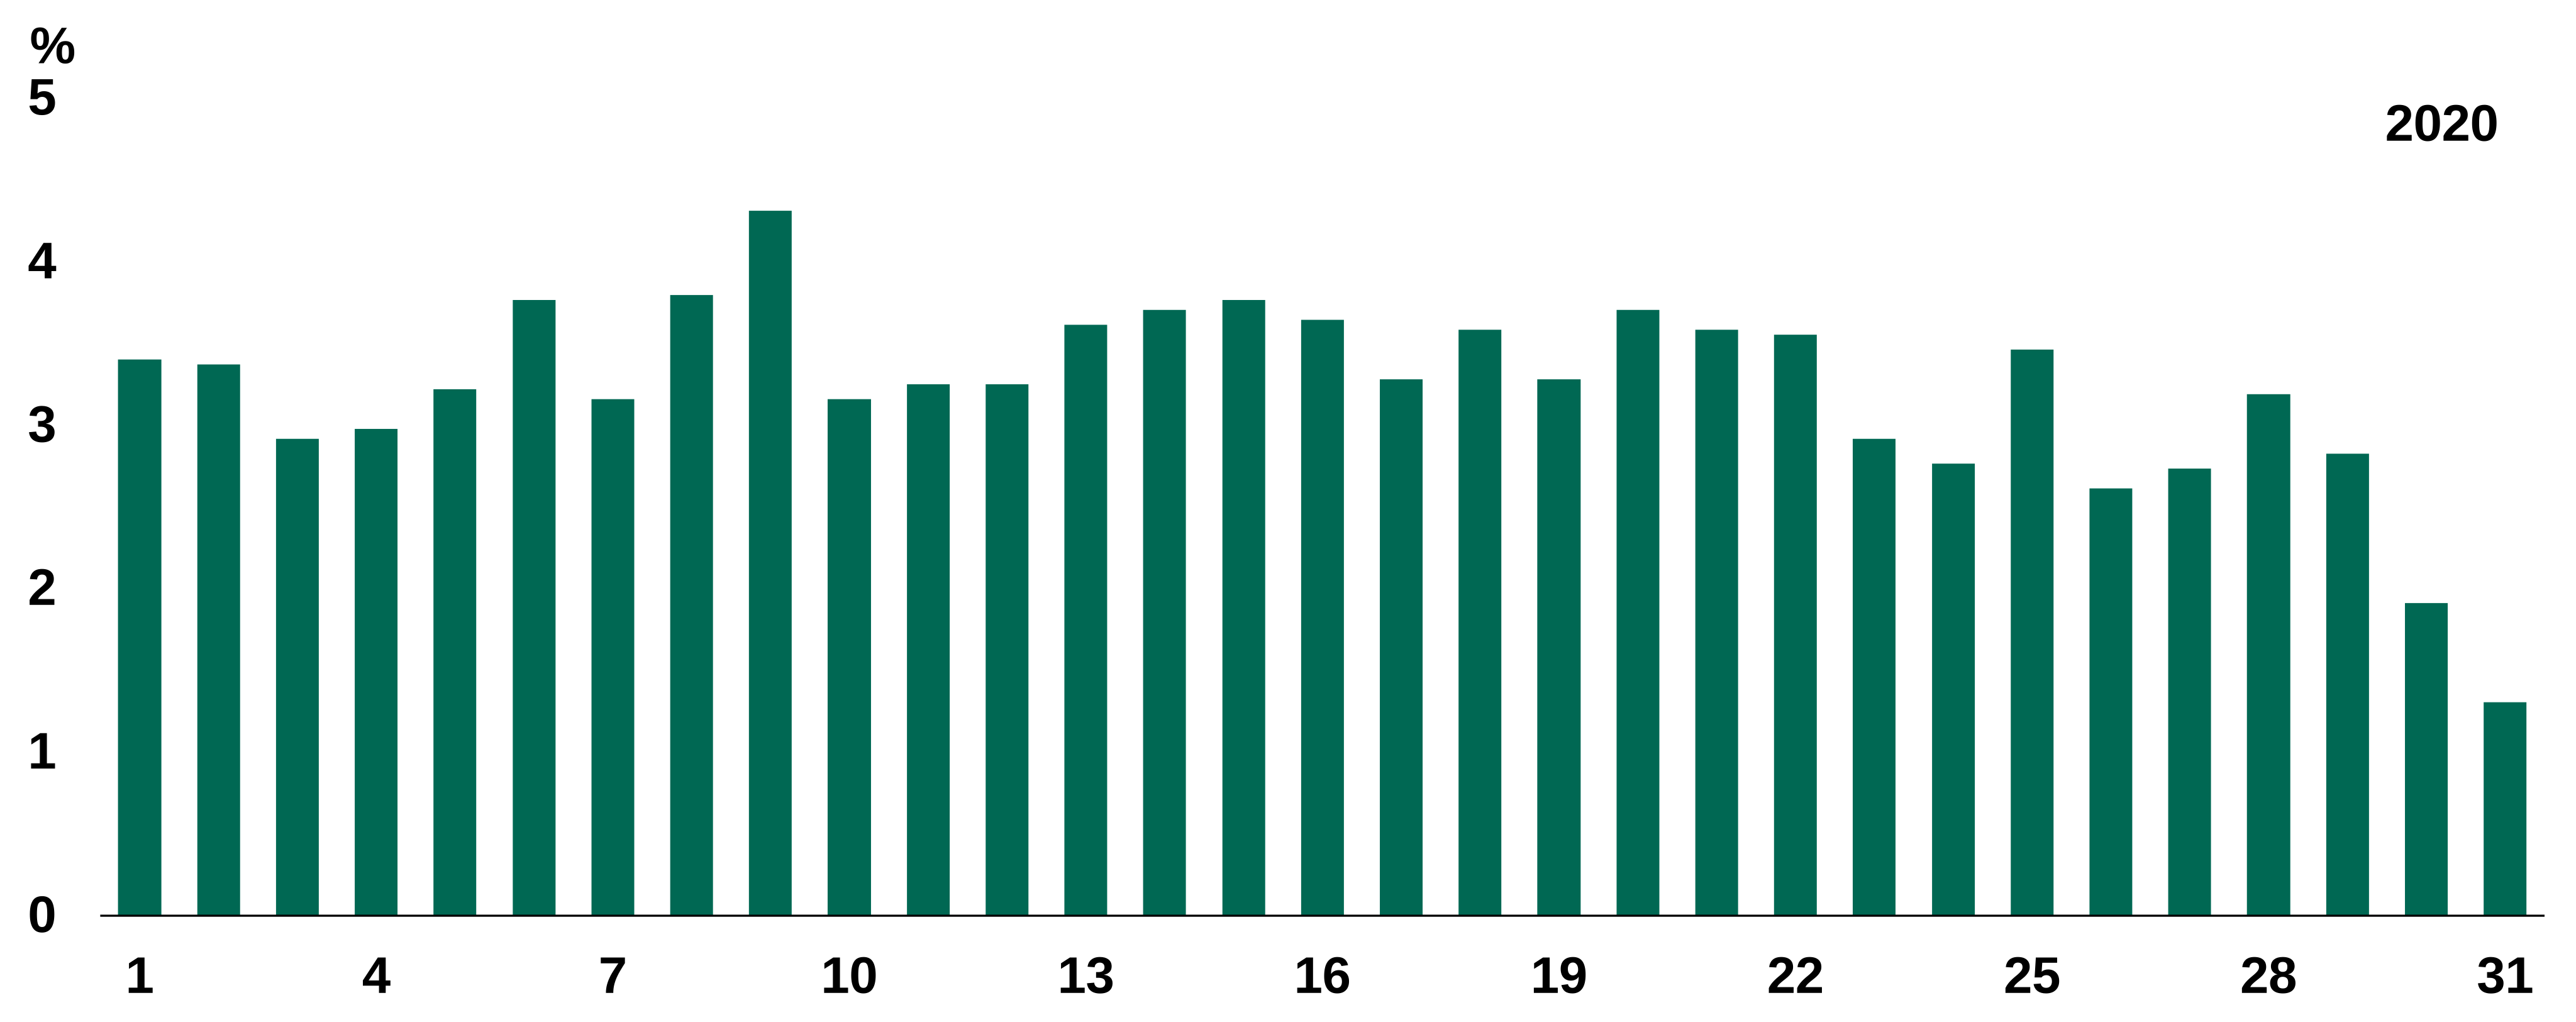
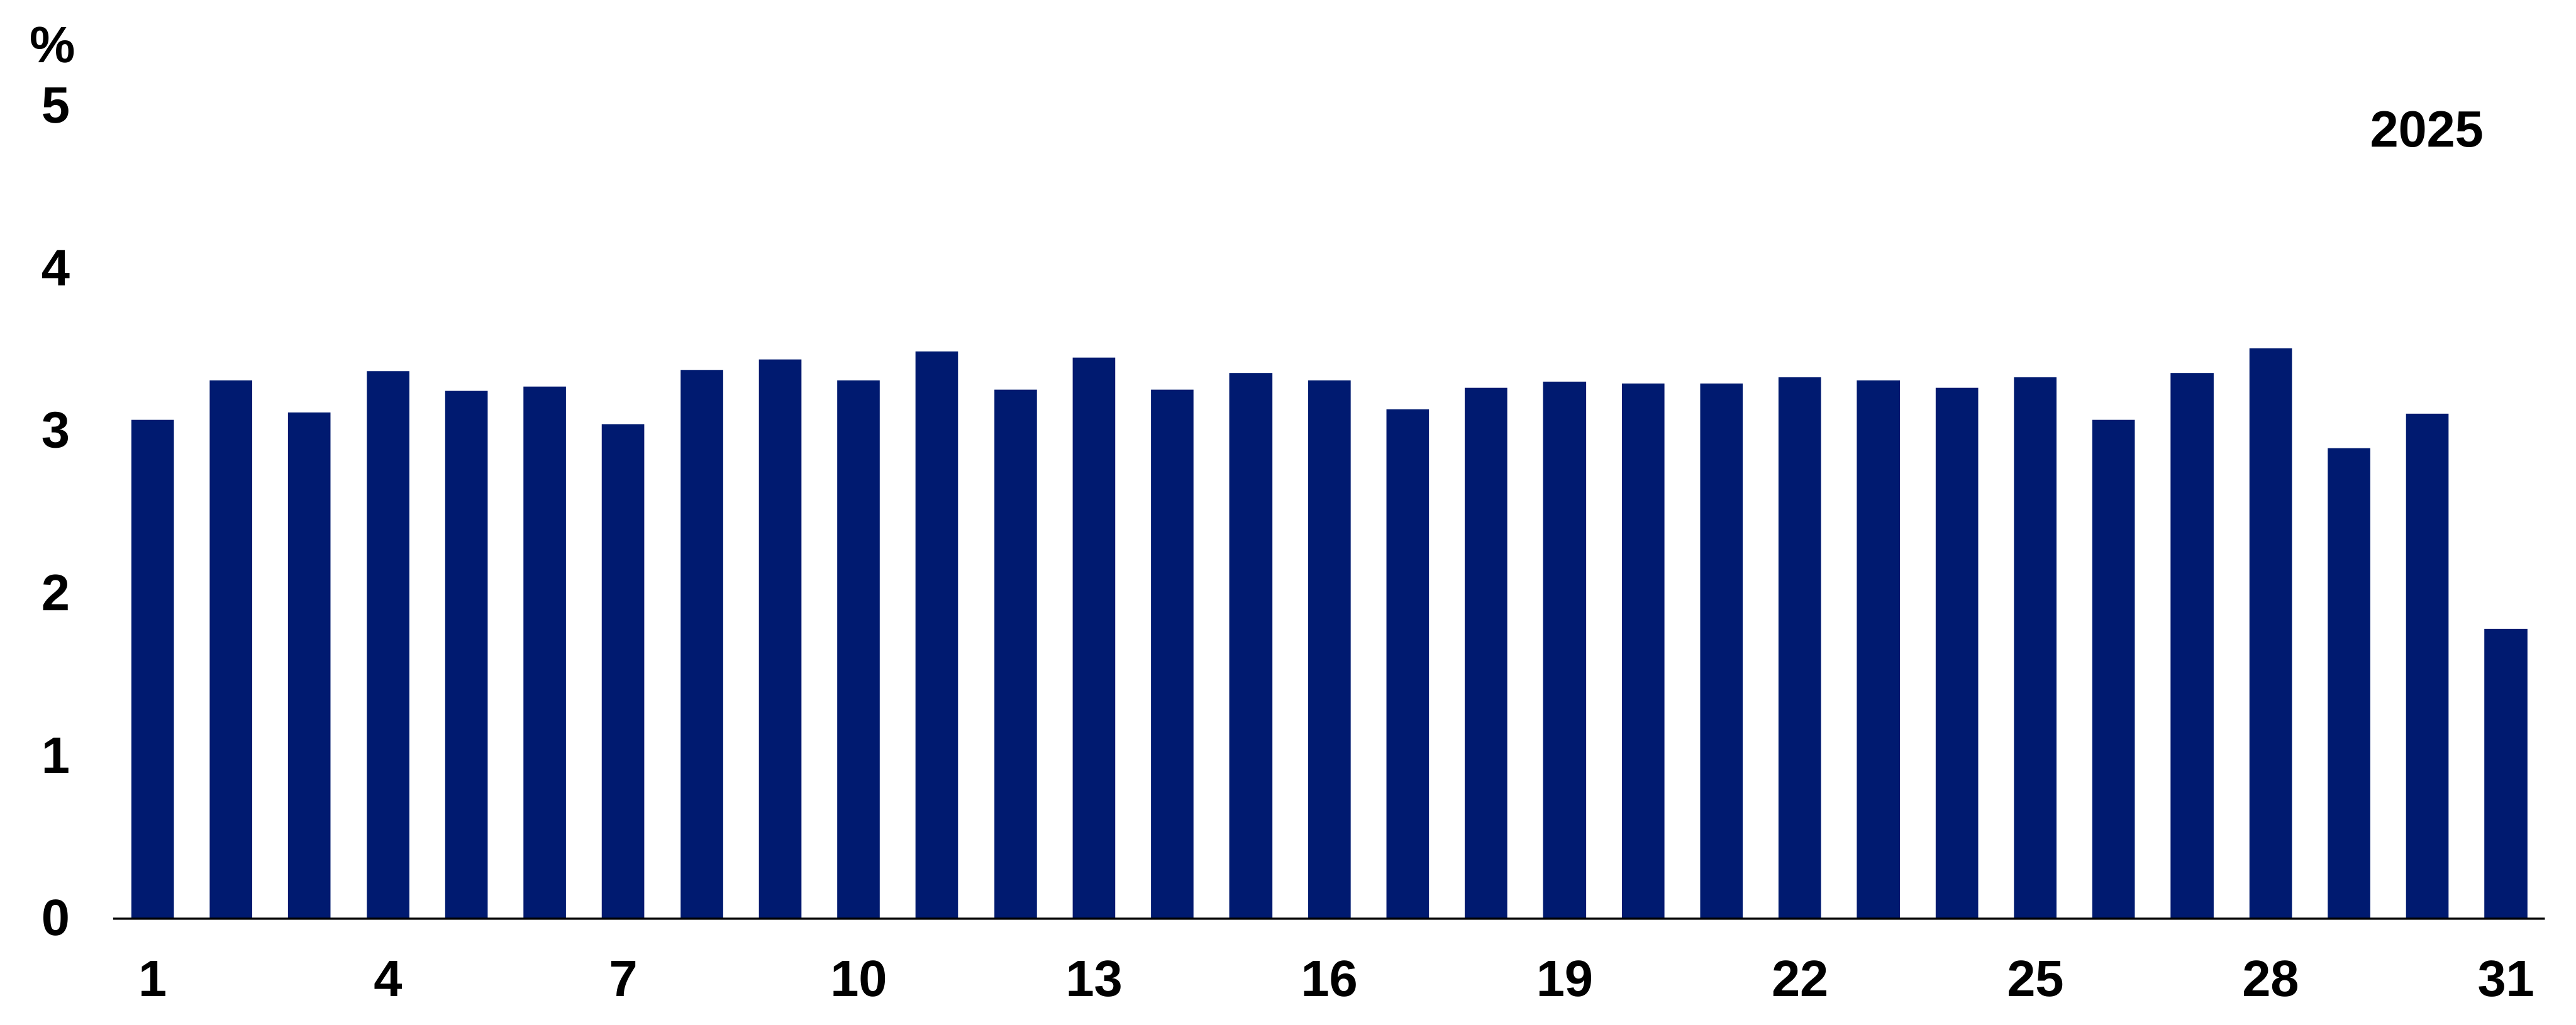
PSUs are assigned to interviewers in each month of the year. Since 2014 interviewers have been assigned to start on different dates across the month to ensure that the interviewing and travel week start dates are evenly spread across the month, which in practice can mean that diary recording starts one or 2 weeks after the interview (Chart 1). This reduces sample bias and means there is more data available for analysis on days of the month which were previously under-represented.
Between 2020 and quarter 2 2022, due to the data collection being conducted primarily over the telephone, the approach was changed to instead use a ‘rolling travel week’ or starting the travel diary one day before the initial interview. This was designed to reduce the risk of drop-off. Fixed weeks were reintroduced in 2022, and the survey operated normally with fixed travel weeks and face-to-face methodology from 2023.
Chart 1 and 2: Percentage of travel weeks which start on each day of the month, England, 2020 and 2025
Household interview
The sampling method selects addresses rather than households, so once at an address, interviewers follow protocols to confirm that it is an existing and occupied private address and where there is more than one household present, one household is randomly selected. An adult will act as the household reference person, and further questions are asked of all members of the household. All household members are then asked to complete the travel diary, and a household is only regarded as fully responding if all interviews and diaries are completed.
Proxy interviewing
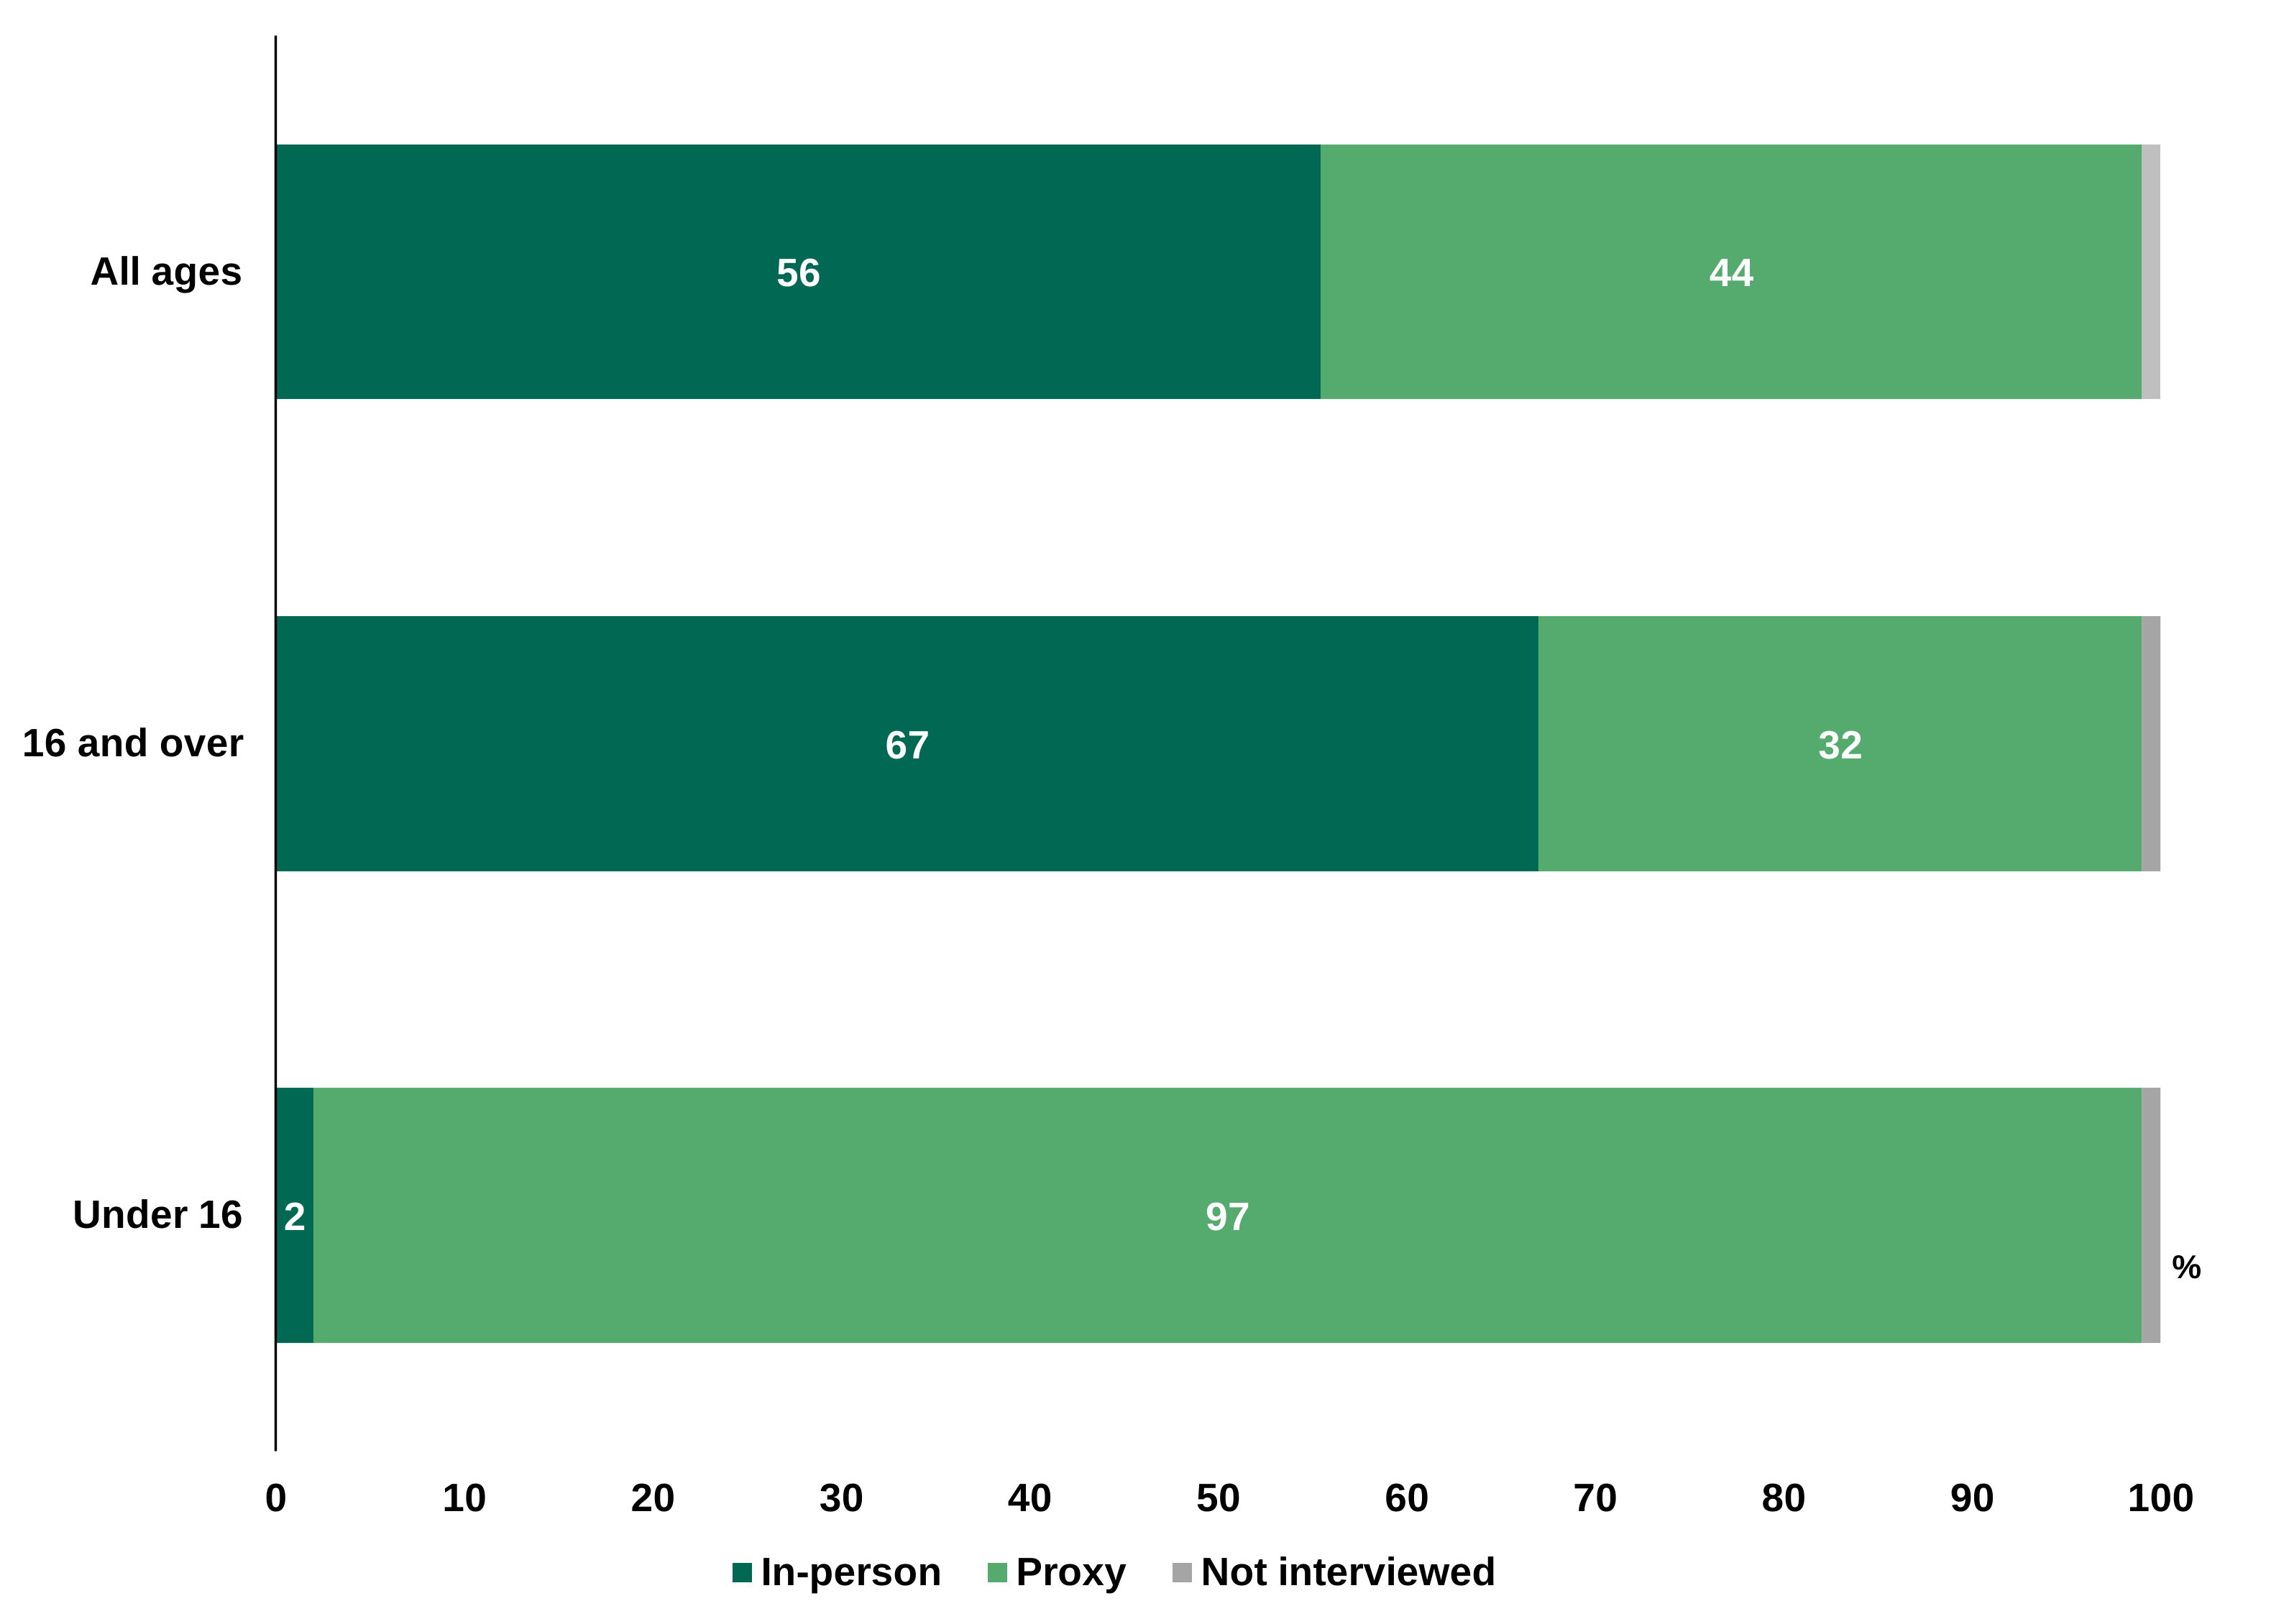
The NTS covers people of all ages and as a consequence, a notable amount of data is collected by proxy, that is someone in the household completes the survey or travel diary on behalf of another household member (or members). Children under 11 years old are not directly interviewed as a matter of policy, and the interview and travel diary are completed on their behalf by an adult in the household. There are also instances where not all adults in the household are present or capable of completing the travel diary, and so the interview and diary can be completed by another adult on their behalf. Interviewers may also complete diaries on behalf of respondents if necessary.
Chart 3: Proportion of interviews completed directly or by proxy, by age: England, 2025
Data quality assurance and processing
There are validation checks on the data at all stages of processing. The first stage of checking is done by interviewers at the mid-week interview to check that the respondent is filling out the diary correctly, and then by the interviewer at the pick-up interview where they will check each diary to make sure that all the necessary information has been included. Within the digital diaries, there are some validations on entry such as valid times, and respondents are prompted to fill in fields they have missed.
When converting the diaries into a dataset, data coders will contact interviewers for clarification on any diary data that is unclear (for example if they are unable to read handwriting) or seems unusual (such as no return trip entered). In some cases the interviewer will go back to the respondent for clarification. Trips can be added, deleted, split and amended at this stage.
Responses are coded in line with the NTS definitions manual and geographic data including trip origin and destination is matched to the NTS Gazetteer.
Imputation
A relatively small number of variables undergo imputation process, where missing values are derived using assumptions based on other known data. Imputation routines and are automated and run in a specific order due to dependencies between variables.
Real household income equivalence
To allow analysis of trip behaviour by income on a comparable basis, households are categorised into income bands based on a measure of household affluence known as real household income equivalence. This adjusts a household’s stated income so that the household’s size and composition are taken into account. This adjustment is carried out using a measure called the McClements Scale. Incomes are also adjusted for inflation to facilitate analysis across time periods.
Weighting and calibration
Since 2005 the NTS has applied a weighting strategy to compensate for non-response bias, plus additional adjustments to trip data to account for observed drop-off in recorded trips over the course of 7 days. The strategy of aiming for evenly distributed start days and weeks across a nationally representative sample allows the pattern of drop-off to be identified and adjustments made where needed. See technical report for more details.
Section 2: Quality assessment
In this section, the quality of the statistics is considered in relation to the different dimensions of quality as stated in the European Statistical System (ESS) quality framework.
1. Relevance
Relevance is the degree to which a statistical product meets user needs in terms of content and coverage.
Statistical outputs
The statistical outputs presented within National Travel Survey statistics include:
- a statistical release containing key findings, trends over time and signposts to further information and related datasets
- ODS data tables with key statistical breakdowns, including travel by mode, purpose, time of day and year, travel by region, rural-urban classification, combined authority, and vehicle availability and usage
- table index files to help users find statistics of interest
- an annual technical report and notes and definitions
- factsheets focusing on specific topics, released periodically
- datasets available via the UK Data Service
How DfT engages with users
DfT regularly engages with users by email, seminars, presentations and face to face methods when possible. This includes requesting feedback within every statistical release, and providing contact details. Each publication is promoted via X. DfT also regularly analyses web page hits, ad-hoc requests and social media analytics to monitor activity over time and identify which products are more useful.
In recent years, specific engagement activities include:
- Presentations to the International Transport Forum and the Transport Statistics User Group
- 2022 user engagement exercise
- 2020 user feedback survey
From autumn 2026, the NTS is embarking on a modernisation programme designed to make the survey more flexible and scalable, and utilise modern technologies. The first phase of this work is to conduct a stakeholder engagement exercise to establish current and future key needs for NTS data. The first part of this exercise will aim to establish the core needs for personal travel data among a selection of known internal and external stakeholders. This will be accompanied by wider outreach where we are seeking views from all NTS users. Findings from this exercise will be used to inform developments as part of the NTS modernisation programme.
If you have any feedback or wish to contribute to our stakeholder engagement programme, please get in touch with us via email.
NTS outputs are kept under review and amended based on additions to the survey, or on requirements for new policies. For example, new tables on multi-modal travel and a trip chaining factsheet have been released within the last three years in response to demand from users for understanding complex trips and the people that make them.
In 2025, table NTS9920: Trips and stages under 5 miles by rural-urban classification of residence and mode’ was introduced in order to provide statistics used in monitoring objectives within the DfT’s third cycling and walking investment strategy. Table NTS0320: Trips by main mode and protected characteristics was also introduced in 2025 following the expansion of harmonised questions on protected characteristics, and due to the increased sample sizes allowing more granular breakdowns. Table NTS0809: Main barriers and encouragements to cycling, walking and walking to school has been superseded by new tables NTS0810, 0811 and 0812 which provide statistics on all barriers and encouragements in addition to the ‘main’ ones, and breakdowns by sex. This follows requests from internal and external users on this topic.
In line with the Code of Practice for Statistics, users will be informed about any changes or revisions to the data series and given the opportunity to feedback prior to any changes being made. Proposed and recent changes are typically highlighted on the statistical release and collection pages on GOV.UK, such as when tables are added, removed or consolidated.
How well the statistics meet user needs
NTS statistics are amongst the most widely used statistical series produced by the Department for Transport. Bespoke data tables are produced on request, and these are published as ad-hoc releases. When repeated interest is shown by users, ad-hoc tables are made into regular series, such as a breakdown of flights per year by household income quintile, which in 2025 has been added to table NTS0316.
Regular engagement with colleagues in different policy areas ensures that the NTS questionnaire is kept up to date. Questions may be added, removed, or amended to ensure the survey meets user needs as much as possible. Any new questions undergo in-depth levels of pilot or cognitive testing to check that they are fit for purpose and understood by respondents. Recent examples include changes to road safety injury classifications to align with other data sources, and new questions on acquisition and ownership of motor vehicles, and electric vehicle charging.
At the time of publication, DfT’s stakeholder engagement exercise is ongoing but early feedback from internal and external analyst users indicates that this type of user finds NTS data and statistics valuable and use them in various transport modelling and analysis applications. They have identified some areas where they feel the NTS could better meet their needs, including:
- users would like to have access to more granular trip origin and destination locations but acknowledge data protection and privacy concerns
- users would like more geographically granular data, but acknowledge that there are cost limitations in terms of achievable sample sizes for smaller areas
- users would like better coverage of modes with lower market demand share such as rail
- users would like easier access to the underlying data
A full report will be published in due course.
The NTS has a number of strengths which contribute to its ability to meet user needs. These include:
-
Long term and continuous: The NTS first ran in 1965 and has been running on an annual basis since 1988. The methodology has been broadly unchanged meaning that long-term trends can be monitored.
-
Large and representative sample: Continuous efforts to obtain a suitable sample size that is representative of England’s population, including work to facilitate a notable increase in the sample size over the last few years, from 6,314 fully responding households in 2023 to 10,893 in 2025. This makes it possible to analyse data by various demographics such as age, sex, region and ethnic group.
-
Detailed travel pattern data collected: The NTS collects a large, detailed dataset on personal travel including who, how, why and when people travel, which is highly valued by users. No other data source collects this level of detail on personal travel for England.
-
Inclusivity: As a household survey with a randomly stratified sample, every address in England has a known and calculable chance of being invited to participate in the survey. Provisions are made to include those who may not have a sufficient level of English language capability to participate, by matching those households to interviewers who can speak alternative languages. Respondents can complete travel diaries digitally or on paper, depending on their preferences and abilities.
Innovation and development
The NTS has invested in work to improve the survey in recent years, which will continue with the NTS modernisation programme. Notable recent developments and methodological work include:
-
Digital diary. Following a seven-year programme of development and testing, the digital diary was introduced into NTS data collection in 2025. More details are available
-
Stratification review. This review was conducted following the 2021 Census to ensure the sampling design was up to date
-
Weighting review. This review followed the stratification review, updating and streamlining the weighting strategy
-
Incentives experiments. Various experiments testing the effect of changing the incentives strategy
-
Recording of e-scooter trips Work commissioned to attempt to understand whether respondents accurately record trips using this mode of transport
Future development
From autumn 2026, the NTS is launching a modernisation programme, which aims to review the survey’s methodology, data collection and outputs. The intention is to make the survey more flexible and scalable, reduce burden on respondents, and utilise modern technologies where appropriate.
The first stages involve capturing the views of our users and stakeholders on their use of, and need for, NTS data and statistics. We are contacting a number of known stakeholders directly, however we are keen to gather views from as wide a range of users as possible.
We want to ensure that the survey meets the needs of users, and any feedback provided will help inform the future design and development of the survey. If you have any feedback or wish to discuss this with the team, please email National Travel Survey statistics.
2. Accuracy and reliability
Response rates
NTS aims to produce estimates that are representative of travel at the England population level. Achieving a good response rate is an important aspect of ensuring representativeness, supported by a robust sampling and weighting strategy.
As can be observed in a number of other large government surveys, NTS response rates since the onset of the covid-19 pandemic have been lower than in previous years. However, the issued sample has been increased from 2023 to ensure that sufficient responses are collected, which has helped to mitigate the effects of a lower response rate.
There are two ways of measuring response rates: the achieved sample rate and the standard response rate. The achieved response rate is the percentage of fully co-operating households amongst all addresses selected in the sampling frame. Only data for fully co-operating households is included in the final diary dataset used for analysis. The standard response rate is the percentage of fully co-operating households amongst the eligible households within the sampling frame. Ineligible households such as empty homes are excluded from the total; usually about 10% of selected households are ineligible to participate in the NTS.
Definitions
Fully cooperating: All household members fully completed the interview and travel diary.
Partially cooperating: All household members completed the interview but not all completed the travel diary.
Chart 4: NTS achieved sampling rate and standard response rate: England, 2025
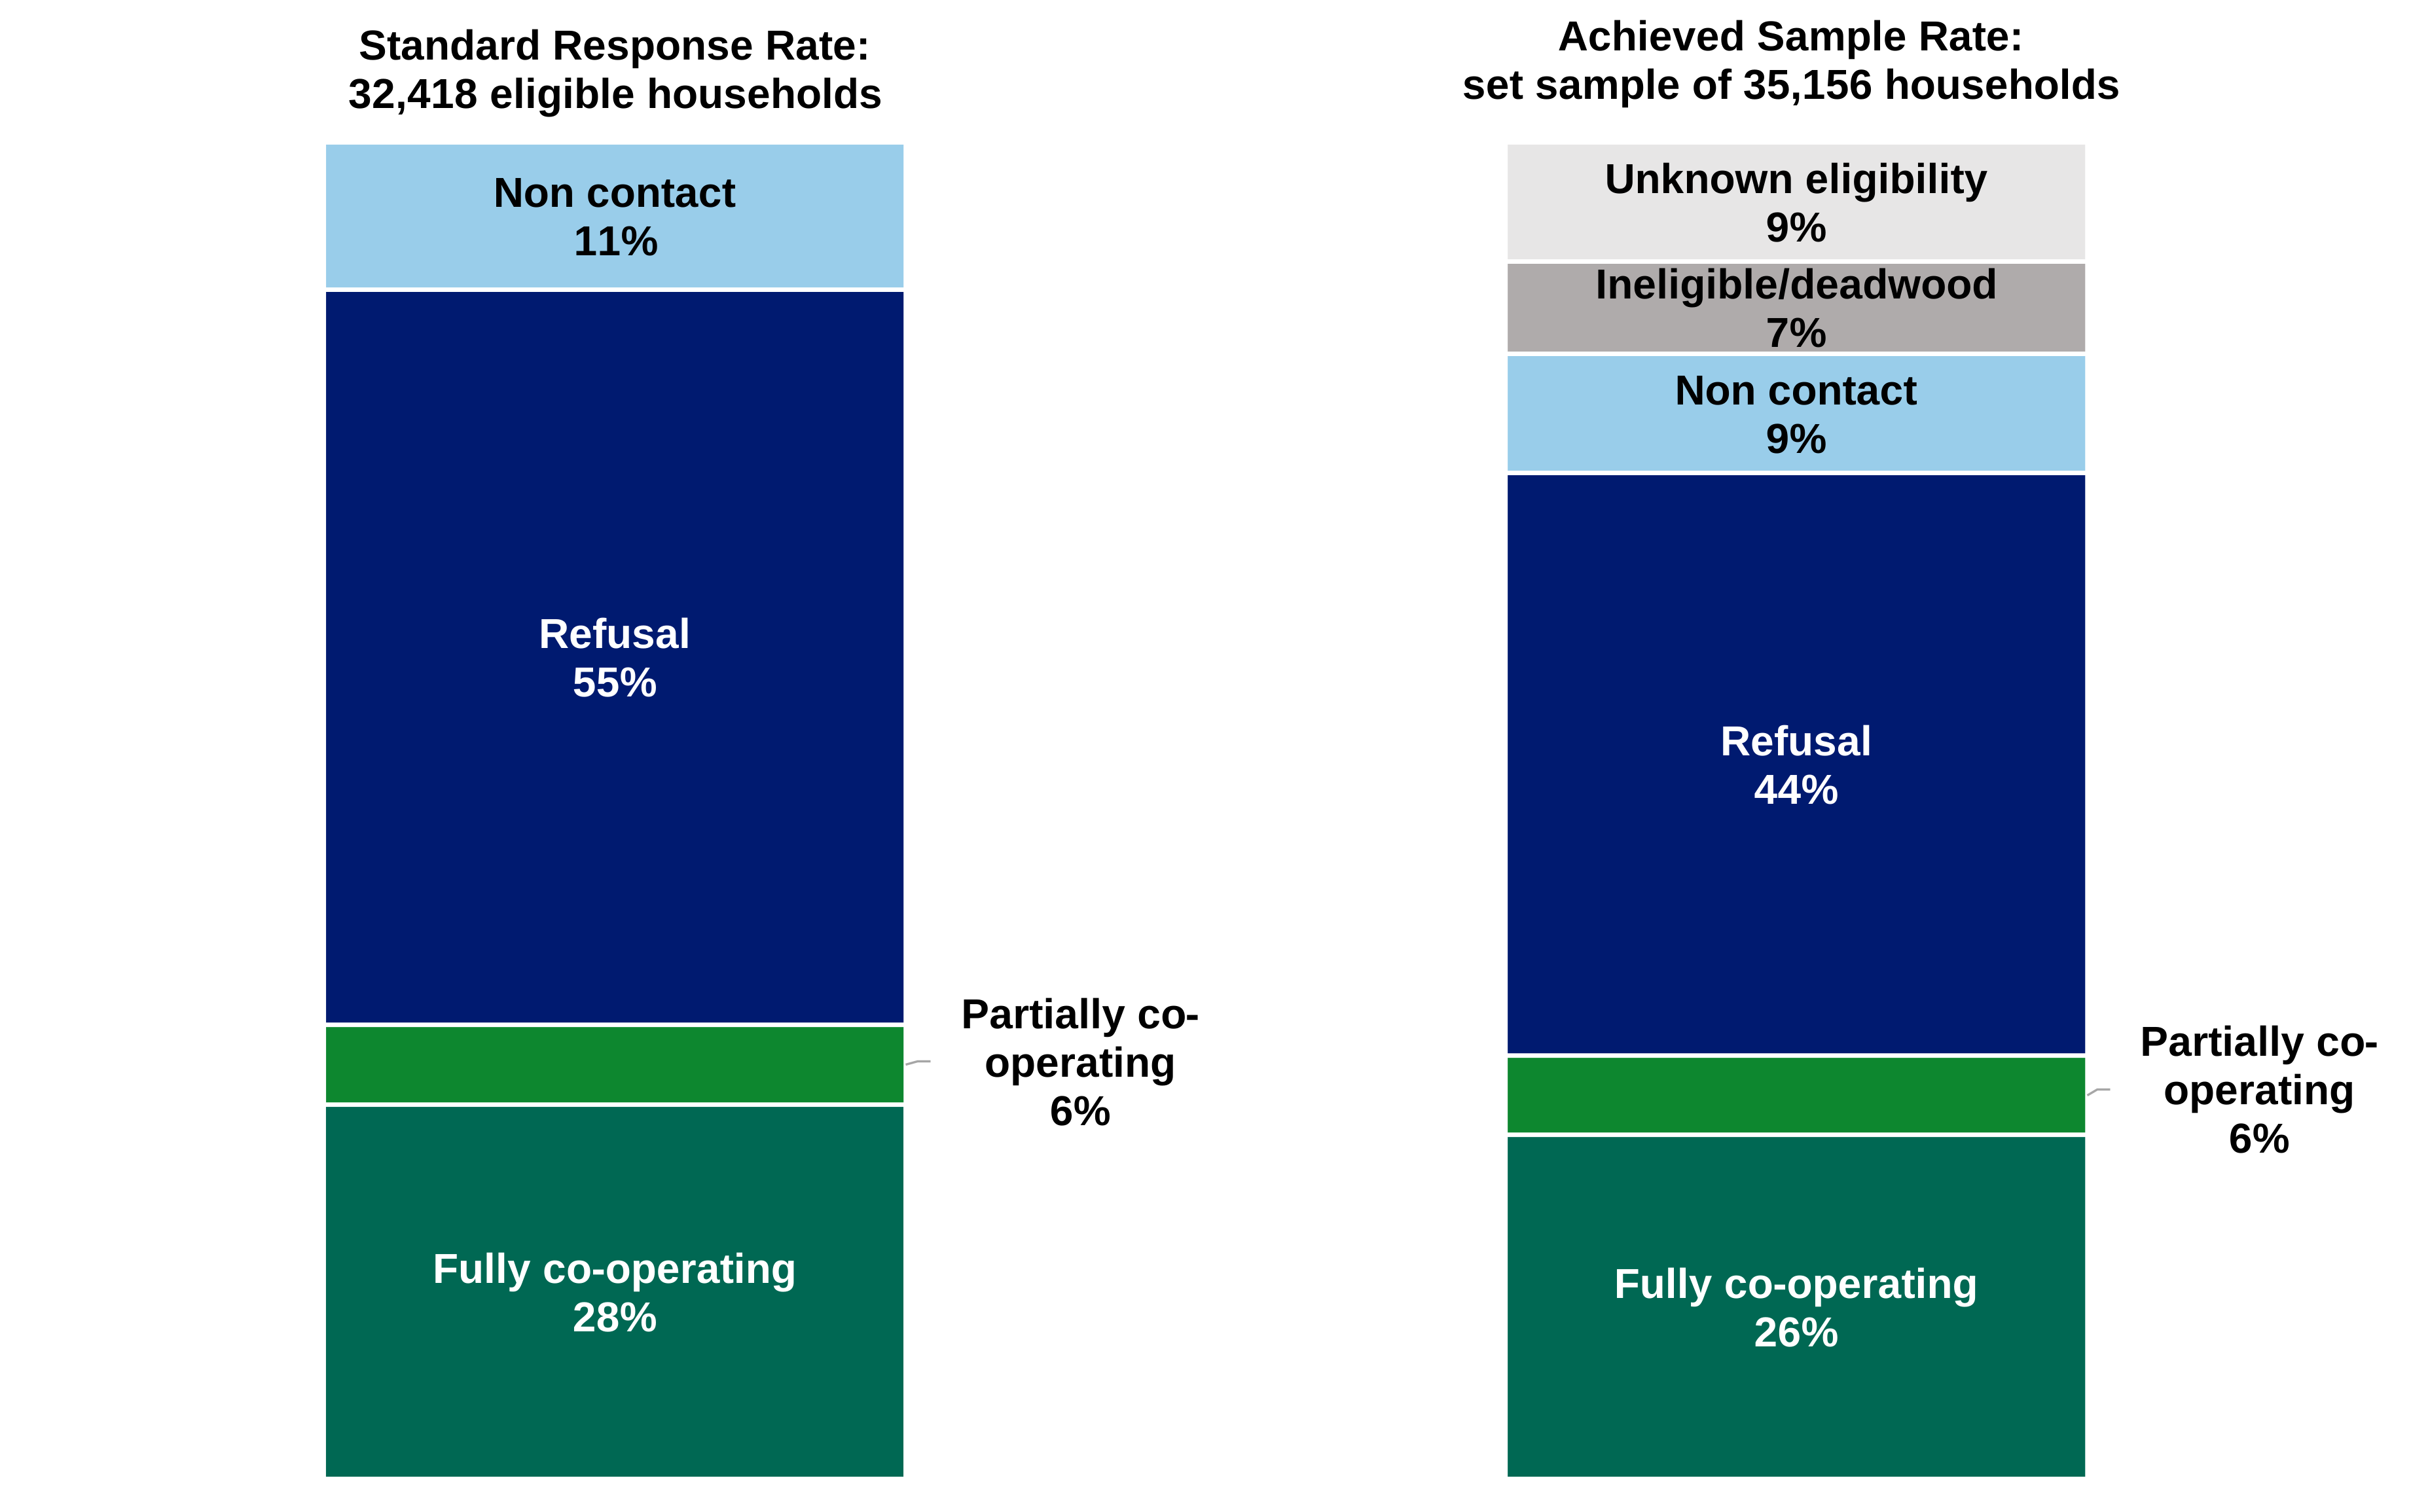
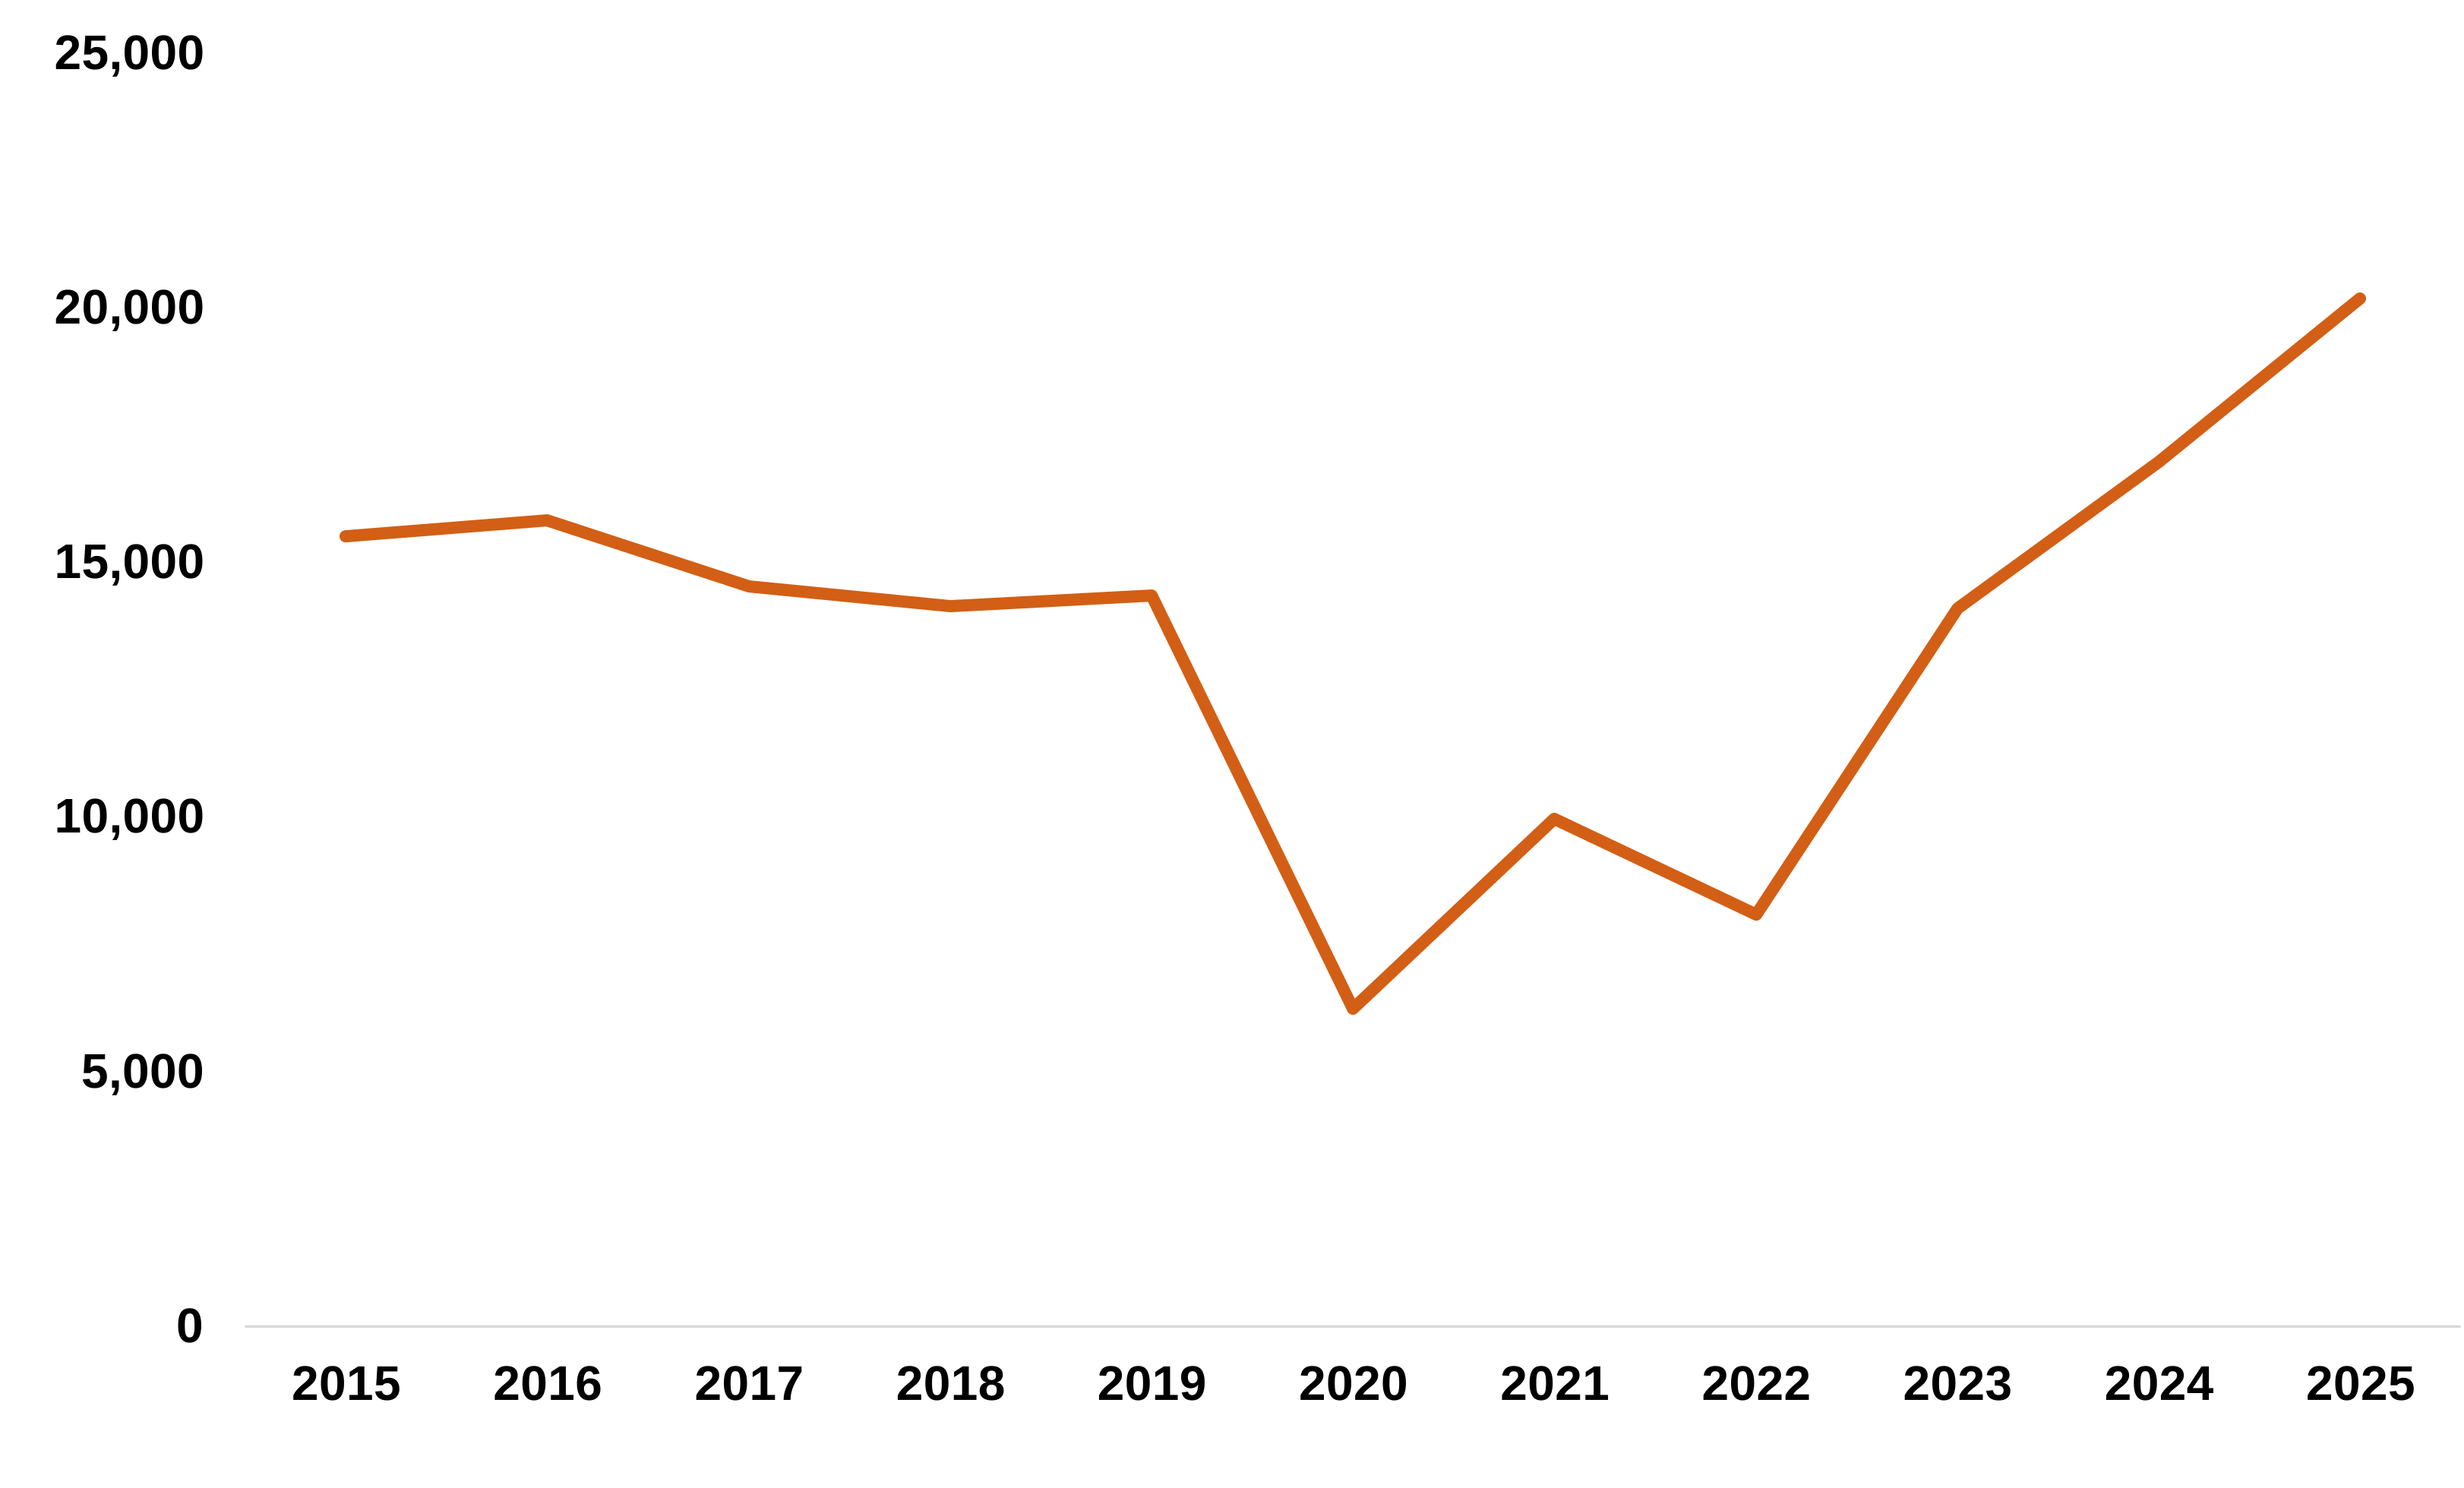
Standard response rates declined to 53% in 2017 before increasing slightly to 54% in 2019. Due to changes in data collection due to the coronavirus (COVID-19) pandemic in 2020 the response rate dropped to 16%. In 2021 the response rate partially recovered to 38% despite ongoing pandemic-related restrictions, largely due to the introduction of the knock-to-nudge methodology. A reduced field force in 2022, along with a slightly higher rate of refusals and an increase in the proportion of partially productive cases, contributed to a reduction in the response rate for 2022 to 31%. Whilst the response rates for 2023 and 2024 were slightly higher at 32%, the number of responses has increased substantially due to the increased sample size. The response rate for 2025 was 28%, however due to the increased sample size, the number of fully responding households was 20% higher than in 2024.
Chart 5: Standard response rate: England 2015-25
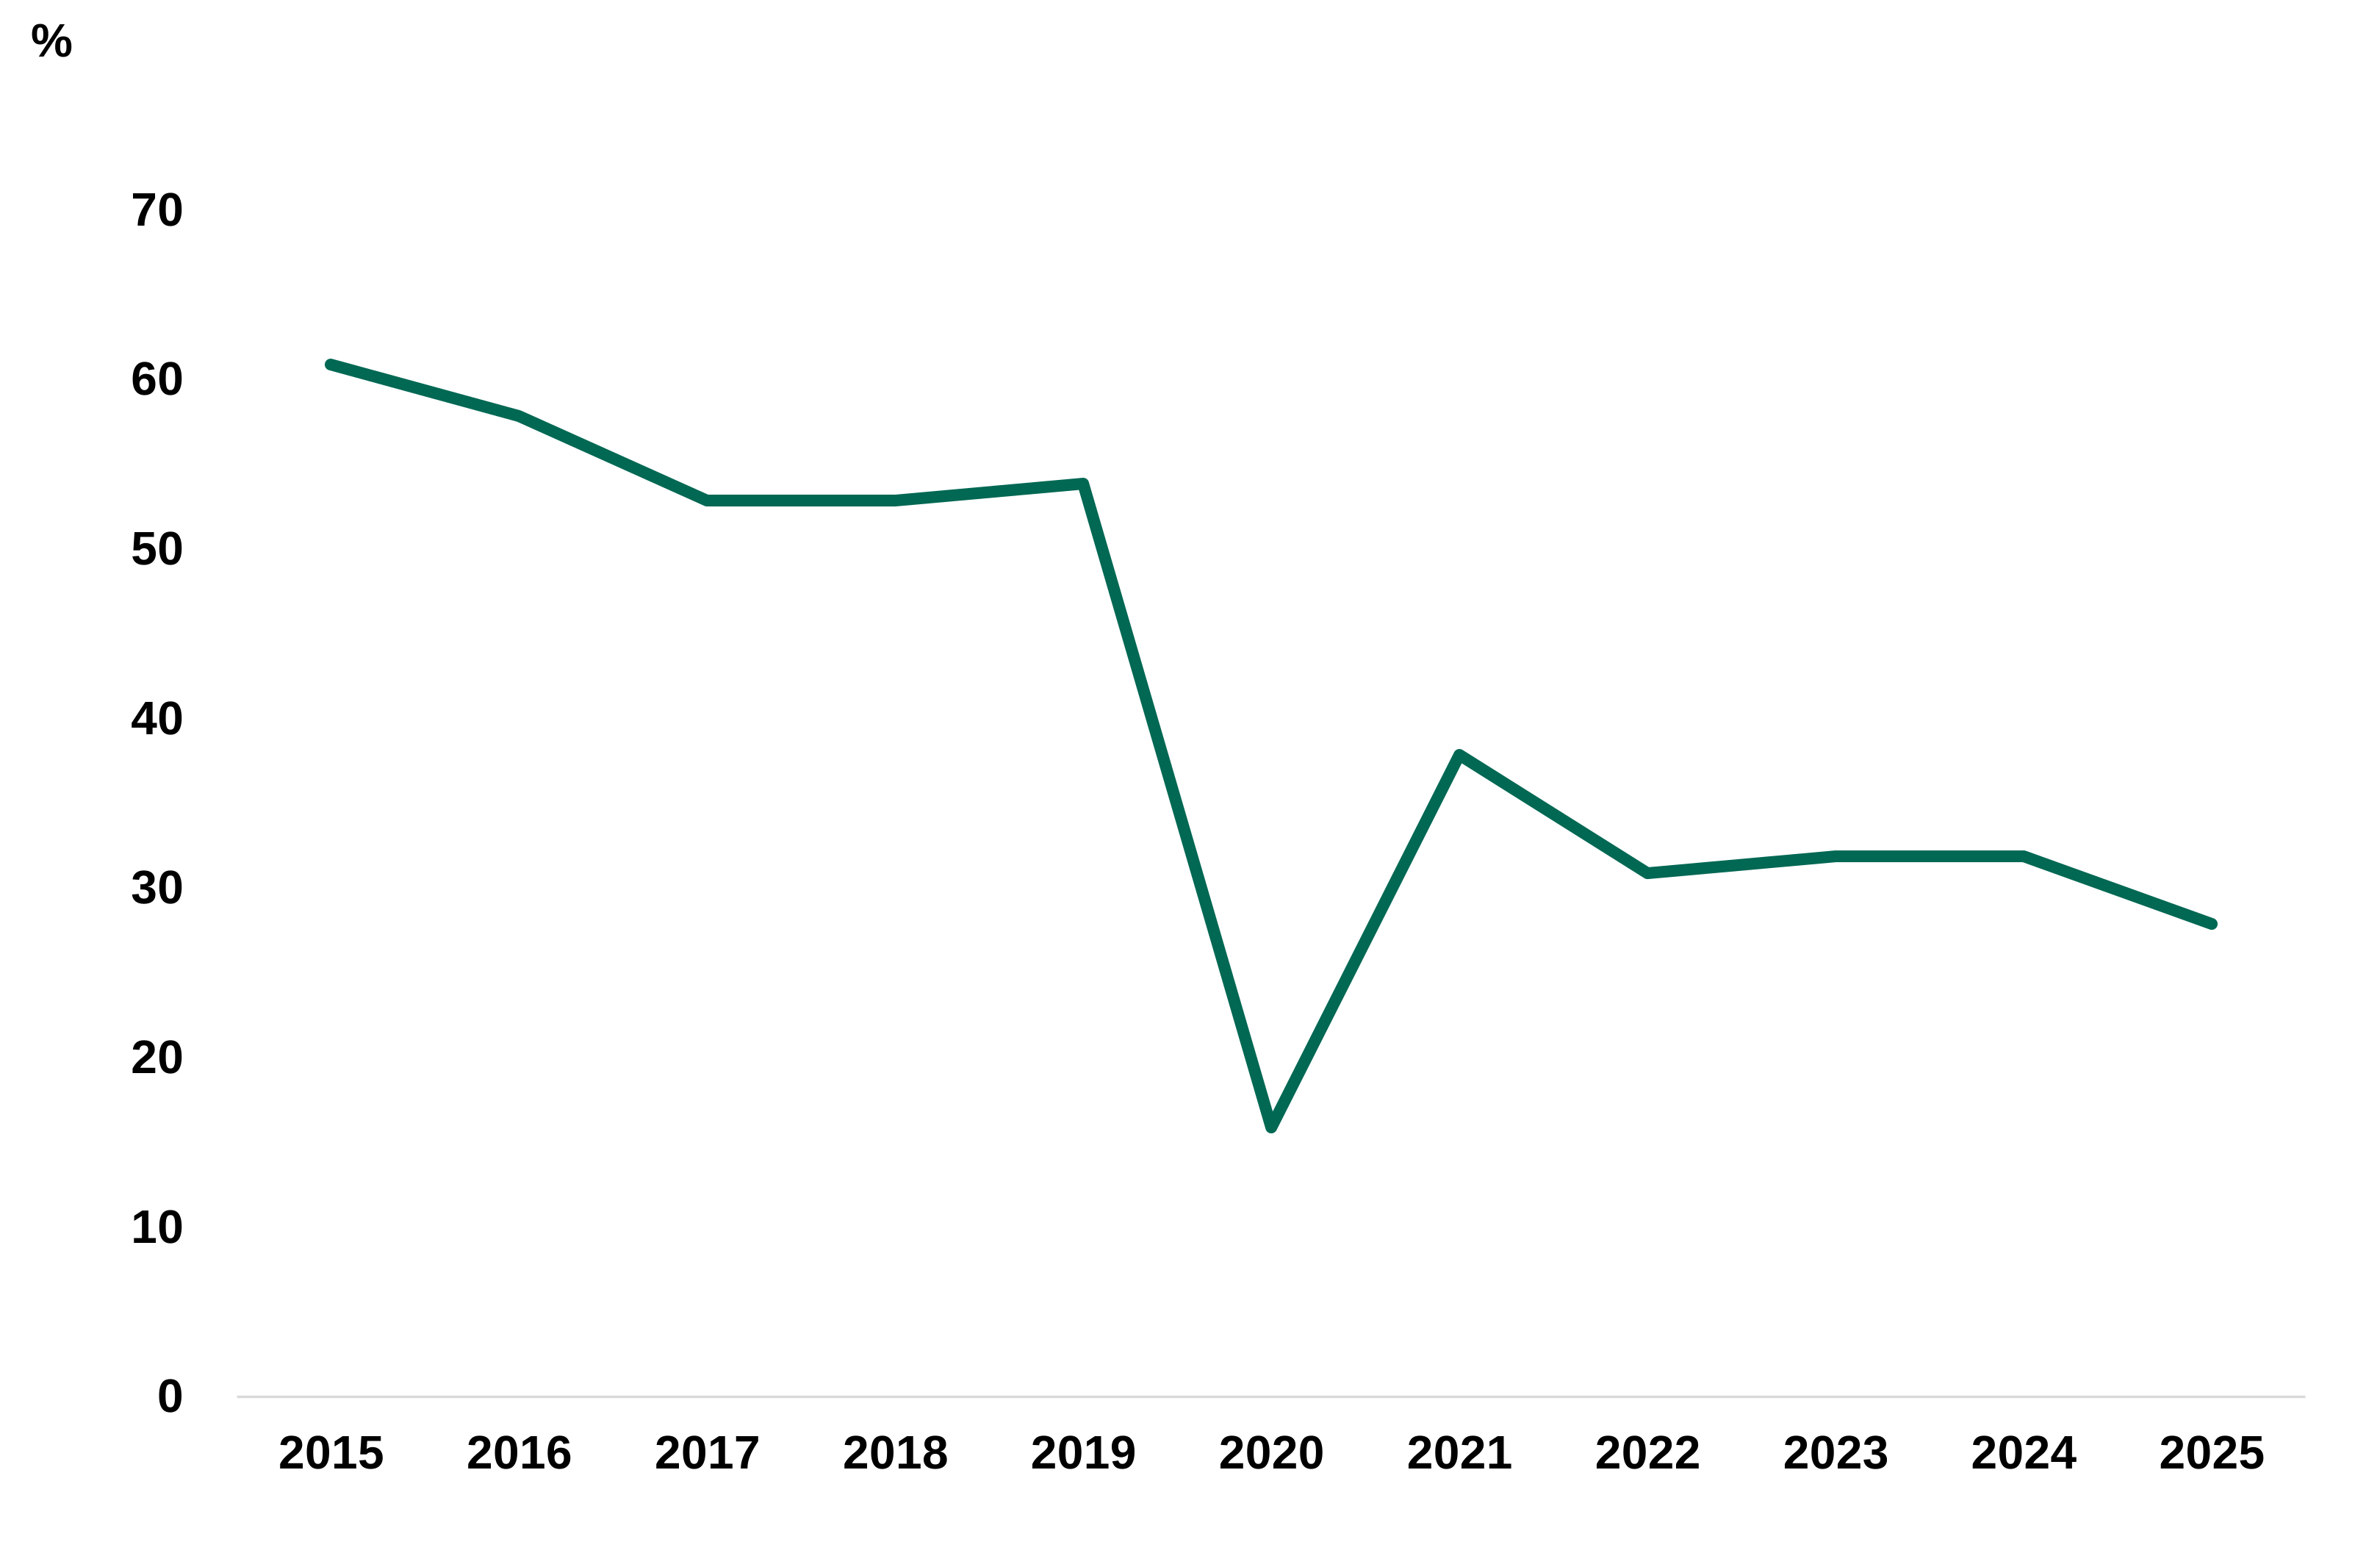
Chart 6: Number of fully responding individuals: England 2015-25
Potential sources of error
Lower level geographies: The NTS sampling strategy is not designed to produce robust data below regional level. Whilst it is possible to analyse data for smaller geographies, for example local authorities, often many years of data need to be combined to obtain a suitable sample size. This approach is not ideal as weightings are applied to the sample to be representative of England in a single year. This is likely to skew analyses as demographics at sub-national level can vary significantly from the national level. Standard errors have been calculated to indicate to users the margin of error at different levels of geography including Combined Authority.
Multiple variable breakdowns: Just as with analyses for smaller geographies, it is also difficult to obtain a large enough sample size to produce robust analysis for specific groups which require multiple demographic breakdowns (for example analysing motorcycle trips of men over the age of 50 in London).
Self-reporting may not reflect actual travel behaviour: Disadvantages to relying on self-reporting include inaccurate recall, forgetting to write journeys down and wrongly or imprecisely estimating time and distances of journeys (for example rounding a 7 minute journey to 10 minutes). Whilst there are extensive validation checks in place to minimise error, it is not possible to eliminate them entirely. The apparent impact of the digital diary on trip recording suggests further that the mode of data collection may influence the likelihood of recording all trips.
Limitations to the amount of data that can be collected: Whilst the NTS collects a rich level of detail of travel patterns, it is not currently able to collect other types of data such as journey satisfaction or how participants would prefer to travel (for example a participant may have taken the bus but would have preferred to travel by train if that travel option was available). The NTS seeks to achieve a balance between achieving its key aims and avoiding over-burdening respondents.
Since 2019, DfT has periodically run the National Travel Attitudes Study which captures topical information from previous NTS respondents, such as attitudes towards cycling and towards travelling using various methods during the pandemic, and this serves to address some of these gaps.
Not fully inclusive: Even though a household survey is considered one of the most inclusive methodologies for surveys, the NTS does exclude certain groups such as people with no fixed abode or people living in communal establishments such as residential care homes.
Limited geographical coverage: Prior 2013, NTS used to cover all households in Great Britain but since 2013 it has covered England only. The reasons for this are outlined in the 2011 Consultation on the Future Design of the National Travel Survey.
Covid-19 impact The pandemic and its associated restrictions and uncertainty resulted in changes to the operation of the survey fieldwork, and as a consequence the survey has achieved a lower response rate and therefore reduced statistical and analytical power, especially in 2020 and 2021.
Quality management approach
The NTS employs a range of quality control measures at all stages:
Interviewer standards
Interviewers play a crucial role in the delivery of the NTS. All interviewers undergo technical training to ensure they are capable of using the technology needed to deliver the NTS including the digital diary. New interviewers receive a 2-day briefing which covers all aspects of the survey and includes role-play exercises to practice. They receive a comprehensive set of instructions which they can refer to throughout fieldwork, and all new interviewers are accompanied by an experienced interviewer on their first day working on the NTS. Interviewers also attend a one day refresher briefing every year to be trained on any changes being made to the survey.
Interviewers are set clear assignment-level performance targets which include a deadline for completion, coverage milestones, a requirement for all cases to be contacted within the first seven days of the wave, and minimum expected response rate. During the fieldwork period, close attention is paid to response rates and coverage so that swift action can be taken to remedy any potential shortfall. There are a number of other performance indicators that are to be monitored regularly at an assignment level, such as number of completed interviews, hours worked, strike rate achieved, number of broken appointments and number of refusals.
Back-checking
Interviews are back-checked to ensure that interviewers were working to the standards to which they were trained and in accordance with survey requirements. A minimum of 10% of the total productive interviews are back-checked, the majority (usually 90%) by telephone but by letter where this was not possible. If the responses received indicate significant deviations from the standards set, a supervisor will revisit the address(es) concerned personally. Most back-checking is carried out within 2 weeks, and always within 4 weeks, of the interview date. Back-checking has found no systematic errors in the way interviewers are working. All interviewers are also subject to twice yearly supervisions to confirm that they are working to the highest standards.
Mid-week checks
Interviewers are required to check on respondents halfway through the Travel Week in order to encourage and help out respondents with any difficulties they might be experiencing whilst filling out their travel diaries. This could be either a phone call or a personal visit and is at the interviewer’s discretion, although they are strongly encouraged to conduct a face-to-face check for elderly participants. During the operation of the push-to-telephone method from 2020 to 2022, mid-week checks were conducted by telephone, including the collection of several days’ worth of travel diary entries. In 2025 98% of fully productive households had a mid-week check, compared with 77% in 2024 and 80% in 2019.
Pick-up interview
After the end of the Travel Week the interviewer will conduct a short interview known as the pick-up interview. The main purposes of this are to collect vehicle mileage information, resolve any remaining questions on the travel diary and also to check if there have been any changes since the household interview. For example, the pick-up interview checks if any vehicles have been acquired or disposed of and whether any new driving licences or season tickets have been acquired since the initial interview.
Validation checks
There are validation checks on the data at all stages of processing. The first stage of checking is done by interviewer at the mid-week interview to check that the respondent is filling out the diary correctly, and then by the interviewer at the pick-up interview where they will check each diary to make sure that all the necessary information has been included. When converting the diaries into a dataset, data coders will contact interviewers for clarification on any diary data that is unclear (for example if they are unable to read handwriting) or seems unusual (such as no return trip entered). In some cases the interviewer will go back to the respondent for clarification. There are many further quality assurance checks in place both when NatCen compile and clean the dataset and when the DfT NTS team produce the statistics based on the underlying dataset.
Imputation
In 2025, 45 variables contained imputed data, the majority of which had imputed values in less than 1% of cases. Table 1 lists the 15 variables which had more than 0.5% of their cases imputed in 2025.
Table 1: NTS variables with more than 0.5% of cases imputed, 2025
| Variable | % of imputed cases |
|---|---|
| Household:HHIncome_Imp | 32.5 |
| Individual:IndIncome_Imp | 16.3 |
| Stage:NumBoardings_Imp | 89.8 |
| Stage:StageTime_Imp | 0.5 |
| Trip:TripTotalTime_Imp | 1.0 |
| Trip:TripTravTime_Imp | 0.5 |
| Vehicle:EngineCap_Imp | 11.4 |
| Vehicle:RegLetter_Imp | 8.7 |
| Vehicle:RegYear_Imp | 3.4 |
| Vehicle:VehAge_Imp | 3.0 |
| Vehicle:VehAnMileage_Imp | 4.1 |
| Vehicle:VehBusMile_Imp | 27.5 |
| Vehicle:VehComMile_Imp | 27.6 |
| Vehicle:VehPriMile_Imp | 29.2 |
| Vehicle:VehRank_Imp | 4.1 |
Household and individual income is imputed primarily in cases where some, but not all, earning members of the household answer the relevant questions. In 2025 the household income imputation rate has fallen to 32.5%, from 38% in 2024. There are some variables with apparently high imputation rates, although none are considered as a cause for concern in terms of data quality. For example, the ‘NumBoardings’ variable records the number of boardings for a stage of a public transport journey and has an imputation rate of 89.8%. For almost all these cases the number of boardings does not actually apply (for example, when travelling by private modes of transport) and so a value of ‘0’ is imputed into the final dataset. Further details about these variables can be found on the NTS Documentation section of the UK Data Archive.
Gazetteer checks
The NTS Gazetteer is a database of over 100,000 places in Great Britain which is used to align locations to grid references. Distances recorded for trips are then checked against straight line distances between Gazetteer grid locations. For trips of 15 miles or over, respondents’ estimates of distance are flagged for checking if they are not between 0.75 and 1.75 as the crow fly miles at the data processing stage. Discrepancies in distance estimates are not flagged where respondent and crow fly miles are both below 15 miles.
Alongside this, a series of plausibility checks are performed. For example, if a car trip is reported as 100 miles in distance but completed in 20 minutes, the trip would be flagged for correction. In cases where there is insufficient data to establish the true values, fields are marked as missing. If the interviewer has indicated that they have checked a questionable entry then it is not rechecked.
Standard errors and uncertainty
Standard errors, together with the 95% confidence intervals, provide an indication of the degree of uncertainty associated with estimates derived from sample data. Smaller standard errors and narrower confidence intervals indicate greater precision, while larger standard errors and wider confidence intervals indicate greater uncertainty. Relative standard errors express the standard error as a percentage of the estimate, providing a standardised measure of uncertainty that allows estimates to be compared consistently. The design factor compares the standard error obtained under the NTS stratified sample design with that expected from a simple random sample of the same size. Further information about the NTS sample design can be found in the technical report. Values greater than one indicate that features of the survey design increase the variance of the estimates relative to a simple random sample. Sampling error arises because estimates are based on a sample rather than a full census of the population, meaning that results from any single sample will vary from the true values for the population. Where estimates are subject to a high degree of uncertainty, combining data across multiple survey years can increase sample sizes and improve precision.
Prior to 2002, standard errors were calculated for the NTS every three to four years. Since 2005, the NTS has applied a weighting strategy to compensate for non-response bias. In 2010, the Office for National Statistics (ONS) designed a methodology for calculating standard errors for a weighted NTS sample and applied this to the 2009 dataset. The methodology and accompanying set of standard errors were published as part of the NTS standard errors guide. The process for calculating standard errors using this methodology was resource intensive and it was not possible to routinely update them for subsequent survey years. The process for producing standard errors was implemented in R in 2018 (replacing the original STATA implementation, while retaining the underlying methodology), resulting in efficiency improvements and enabling updated standard errors to be produced for a selection of key 2018 NTS estimates.
Standard errors have been updated for the 2025 NTS dataset using the methodology applied to the 2009 and 2018 NTS datasets. Following changes to the NTS sample design and weighting framework over recent years, the methodology was reviewed for its application to the 2025 data. The review found that the existing approach remained appropriate for producing measures of uncertainty for NTS estimates, while recommending several updates to reflect changes to the sampling and weighting of the survey. These included the use of updated primary sampling unit (PSU) and strata variables, together with revised calibration variables aligned with the weighting process for the 2025 dataset. The resulting variance estimates therefore reflect the current NTS survey design while maintaining consistency with the methodology used in previous standard error exercises.
NTS estimates are generally derived from weighted survey data and are often expressed as ratios of weighted totals, including averages, rates and proportions. Standard errors are calculated using a complex survey variance estimation approach that reflects the survey’s stratified and clustered sample design, together with the weighting and calibration procedures used in producing the estimates.
Calibration is used within the NTS to align survey estimates with known population totals for key demographic and household characteristics, reducing potential bias arising from non-response. To account for the information introduced through the calibration process, the estimator is modelled using the calibration variables and uncertainty is estimated from the residual variation that remains after the effects of calibration have been removed. For ratio-based estimates, such as trips per person per year, Taylor linearisation is used to approximate the variance of the estimator. Standard errors are calculated from the linearised residuals using the survey design information, including survey weights, PSUs and strata.
Table 2 presents estimates of trips per person per year by main mode in England in 2025, together with associated standard errors, 95% confidence intervals and design factors.
Table 2: Standard errors of trips per person per year by mode: 2025 (England)
| Main mode | Average number of trips | Standard error | 95% lower confidence interval | 95% upper confidence interval | Relative standard error (%) | Design factor |
|---|---|---|---|---|---|---|
| Walk | 243.29 | 4.91 | 233.66 | 252.92 | 2.02 | 1.66 |
| Walks of a mile or more | 79.09 | 1.92 | 75.31 | 82.86 | 2.43 | 1.57 |
| Pedal cycle | 15.41 | 0.93 | 13.58 | 17.23 | 6.04 | 1.54 |
| Car or van driver | 323.43 | 3.97 | 315.66 | 331.21 | 1.23 | 1.34 |
| Car or van passenger | 166.23 | 2.59 | 161.15 | 171.32 | 1.56 | 1.54 |
| Motorcycle | 1.85 | 0.25 | 1.36 | 2.35 | 13.62 | 1.21 |
| Other private transport | 6.47 | 0.52 | 5.46 | 7.49 | 7.98 | 1.25 |
| Bus in London | 14.70 | 0.88 | 12.98 | 16.42 | 5.97 | 1.77 |
| Other local bus | 27.72 | 1.12 | 25.51 | 29.92 | 4.06 | 1.62 |
| Non-local bus | 0.32 | 0.07 | 0.19 | 0.46 | 20.70 | 1.47 |
| London Underground | 10.96 | 0.81 | 9.37 | 12.56 | 7.43 | 1.92 |
| Surface Rail | 18.36 | 0.77 | 16.85 | 19.86 | 4.19 | 1.66 |
| Taxi or minicab | 9.85 | 0.52 | 8.83 | 10.87 | 5.28 | 1.49 |
| Other public transport | 1.99 | 0.33 | 1.34 | 2.64 | 16.68 | 2.08 |
| All modes | 840.58 | 6.59 | 827.66 | 853.50 | 0.78 | 1.65 |
R and its survey package was used to produce the standard errors. For further information see:
R Core Team (2018). R: A language and environment for statistical computing. R Foundation for Statistical Computing, Vienna, Austria. R project
T. Lumley (2017) “survey: analysis of complex survey samples”. R package version 3.32.
T. Lumley (2004) Analysis of complex survey samples. Journal of Statistical Software 9(1): 1-19
3. Timeliness and punctuality
Timeliness: the time between the date of publication and the date to which the data refers.
Punctuality: the time between the actual publication and the planned publication of a statistic.
Timing of fieldwork and data processing
Data collection runs continuously but is organised into survey years which are aligned to calendar years. Fieldwork is allocated to interviewers for each month, and allocated travel weeks start from around the middle of the month. An additional fifth travel week is allowed where the scheduling of interviews means that the travel weeks might be missed. Additional time is then allowed for the collection and return of paper travel diaries. Example of timescales for a survey year:
| Task Description | Timeline |
|---|---|
| Allocation of points to interviewers | December-January |
| Data collection begins | Mid-January |
| Data processing and validation | Throughout the year |
| Final diaries received from interviewers | Following April |
| Final data processing, validation, parameterisation, imputation and weighting | April to May |
| Delivery of annual data to DfT | End May |
Publication timetable
Upon receipt, data is ingested into DfT’s cloud database system, where it is merged with previous years. The data then undergoes a further series of validation checks, and any issues flagged by the checks are resolved or raised with the contractor. Further fields for analysis are derived and added. Annual statistics are typically released at the end of August.
The NTS data is then processed further for release to the UK Data Service in the Autumn, no later than November.
4. Accessibility and clarity
Accessibility: the ease with which users are able to access the data, also reflecting the format in which the data are available and the availability of supporting information.
Clarity: the quality and sufficiency of the metadata, illustrations and accompanying advice.
Accessibility
Outputs are published in accessible formats on gov.uk:
- annual statistical releases are available as HTML reports, accessible with assistive technologies
- data tables are available in Open Spreadsheet (ODS) file format which can be accessed by using free available software. These tables include filters which work through ODS formatting, allowing users to find the data they desire
- methodological reports are published in html, or in the case of the technical report, a bookdown format hosted on Github which makes the questionnaire scripts accessible and more easily navigable.
Clarity
The statistical releases use plain language, in which technical terms, acronyms and definitions are defined where appropriate. The main findings are presented using a series of text and charts. It is intended that any information that relates to the interpretation of the particular aspects of the bulletin is provided alongside the figures, for example, the disability chapter and tables state the definition of disability used in those tables.
In addition to the statistical releases, further technical documentation is published, describing the data collection process (and how it has changed), and the validation, processing and weighting procedures.
5. Comparability and coherence
Comparability: the degree to which data can be compared over time and domain.
Coherence: the degree to which data that are derived from different sources or methods, but refer to the same topic, are similar.
Comparability
The core methodology of the NTS is largely unchanged since the first survey in 1965, operating as a face-to-face household survey comprising interviews and a self-completed seven-day travel diary. Many of the key terms and definitions (for example trips, stages, boardings, which types of trips should be included) are unchanged over time. This allows users to understand how travel has changed over time. Data has been collected on a continuous basis since 1988, with the exception of a pause of six weeks in 2020 following the announcement of restrictions associated with the covid-19 pandemic. For approximately two years following this, data was collected using a combination of knock-to-nudge and telephone data collection. The response rate fell considerably and there were some differences in the composition of the responding population. This remains the biggest disruption to NTS data collection for many years and users are advised to interpret the statistics from 2020 to 2022 with caution. More details can be found in the 2022 technical report.
One notable change occurred in 2013 when the NTS changed from covering Great Britain to covering only England. Over the years other aspects of data collection and processing have changed, such as changes to coding procedures in 2002, when weighting was first introduced in 2005, and the introduction of the digital diary in 2025. Key changes are detailed in the technical reports and any changes affecting specific statistical series over time are noted within the relevant tables.
Coherence
The NTS statistics cover a range of topics relating to personal travel in England. Where possible and relevant, NTS uses Government Analysis Function harmonised standards to ensure coherence with other data sources on the concepts being measured, such as geographical indicators and personal characteristics.
A range of other statistical resources exist covering various aspects of the transport system.
Travel by mode of transport These statistics tend to focus on one or more modes of transport, unlike the NTS which focuses on people and their use of transport. NTS trends in bus travel broadly tracks long term trends observed in these other sources, however they can differ year-on-year due to fundamental differences in data sources and methods, plus the measurement error inherent within all statistical sources.
Road traffic statistics are based primarily on counts of vehicles passing a number of points on the road network of Great Britain. These include all vehicles including commercial vehicles, travel for purposes excluded from the NTS, and travel by people who are not resident of England. Bus statistics are compiled from a range of sources but primarily the Public Service Vehicle survey which gathers data form operators, including counts of passenger journeys. Vehicle licensing statistics are derived from extracts of the Driver and Vehicle Licensing Agency (DVLA) vehicle database. The main purpose of the database is to administer vehicle registration and licensing records in the United Kingdom. Statistics on the fuel types and transmission of vehicles in the NTS vehicle samples tend to match well with the incidence of car fuel types in the DVLA database. DVLA data is also used as validation and as a source for vehicle details for the household vehicles in the NTS sample.
Driving licence data is a record of full and provisional driving licences issued by the DVLA. The DVLA acknowledges that the data includes licences where the holder may have deceased, moved overseas or stopped driving, and the NTS is considered a more robust source for the number of current licence holders and associated demographic breakdowns.
Other data sources for England
The Census asks a number of questions covering similar ground to NTS statistics, including car availability, licence holding and travel to work. However as it is collected only once per 10 years it is not usually checked for coherence with NTS statistics.
The Active Lives Survey asks whether people have walked or cycled for the purpose of travel over a given period of time. Broad trends in this indicator tend to match NTS fairly well, however there is no further detail within the data which reduces the coherence of the two sources.
The Labour Force Survey asks its respondents about their travel to work in a similar way to the NTS. The LFS sample is much larger overall, however the NTS captures data on a higher number of trips for the purpose of commuting. A comparison of the two sources was made using data from 2019 and they were found to broadly agree about the proportions of travel to work for each transport mode, with only minor differences.
Data for other UK nations
Since 2013, the NTS has collected data for residents of England only. The other nations of the UK have varying approaches to collecting personal travel data.
The Travel Survey for Northern Ireland was introduced in 1999 and has always operated independently from the England NTS. It was, however, based on the NTS design and therefore produces a similar set of key statistics for the residents of Northern Ireland.
The Scottish Household Survey includes a travel diary and other travel measures. The concepts regarding travel captured by this survey are similar to the NTS, however recent developments have reduced the amount of travel information collected with some questions dropped and some asked only two years. This is likely to reduce its coherence with NTS data.
The Wales National Travel Survey was introduced in 2025, representing the first time this type of data has been collected for Wales since it was excluded from the NTS in 2013. The WNTS is an individual and web-led survey which means there are a number of methodological differences between it and the NTS. Top-line estimates of travel by mode, however, appear reasonably in line with comparable parts of England.
The following 4 sections cover additional principles which Eurostat asks official statistics producers to comment on when reporting on quality, and we are including for completeness.
6. Trade-offs between output quality components
Respondent burden versus questionnaire length The NTS is a relatively long survey which aims for whole-household response, meaning that initial interviews take on average 49 minutes. Respondents must then complete journey details over a 7-day period. The questionnaire has grown over time in response to new needs for data. The depth and richness of the NTS data is highly valued by users, however it represents a relatively high burden on respondents. One aim of the NTS modernisation programme commencing in 2026 is to identify ways in which the burden may be reduced.
Detail versus response rates The household-level design provides a greatly detailed dataset which captures the travel behaviour of people of all ages, but it also presents a challenge to maintaining the overall response rate, with feedback from some non-respondents that it is too hard to find the time to be interviewed. The richness of the data, and its ability to meet a wide range of needs, has been prioritised within NTS, however in an increasingly challenging context for household surveys, there is an increasing imperative to ensure the survey only aims to capture data that is really needed.
Sample size versus cost face-to-face interviewing is a relatively high-cost method of data collection, requiring a considerably sized and skilled field force. It is also true that increasing demand for more granular data requires a large responding sample. In recent years, DfT has increased its investment in the NTS, resulting in increasing sample sizes year-on-year, but it is not expected that there is scope for further significant increases on the achieved sample sizes in 2025. If more responses are required to generate more granular data, then there will need to be changes in the design of the survey or in data collection methods to enable this, with resulting trade-offs between coverage and quality.
7. Assessment of user needs and perceptions
Assessment of user needs and perception covers the processes for finding out about users and uses, and their views on the statistical products.
The ways in which the department engages with users to determine their views is covered as part of the ‘relevance’ section above.
8. Performance, cost and respondent burden
Performance, cost and respondent burden describes the effectiveness, efficiency and economy of the statistical output.
The design of the NTS as a face-to-face household survey means that there is a relatively high cost associated with data collection, as discussed in section 6.
9. Confidentiality, transparency and security
Confidentiality, transparency and security refers to the procedures and policy used to ensure sound confidentiality, security and transparent practices.
All data is stored, accessed and analysed using DfT secure IT systems. Data protection regulations are adhered to throughout the data collection and NTS statistics production process, and any information provided directly or indirectly to DfT by members of the public will be kept securely where access to data is controlled in accordance with departmental policy. Data collection, processing and transfer procedures have been designed to minimise any risk to personal data and confidentiality.
Data collection is undertaken by third party contractors on behalf of DfT. Suppliers must conform to information security and data protection standards mandated by the relevant Crown Commercial framework.
The complex nature of the NTS data collection means that data must be transferred between third party suppliers and DfT at different stages. The key data transfers are detailed below:
Figure 1: Data transfer steps
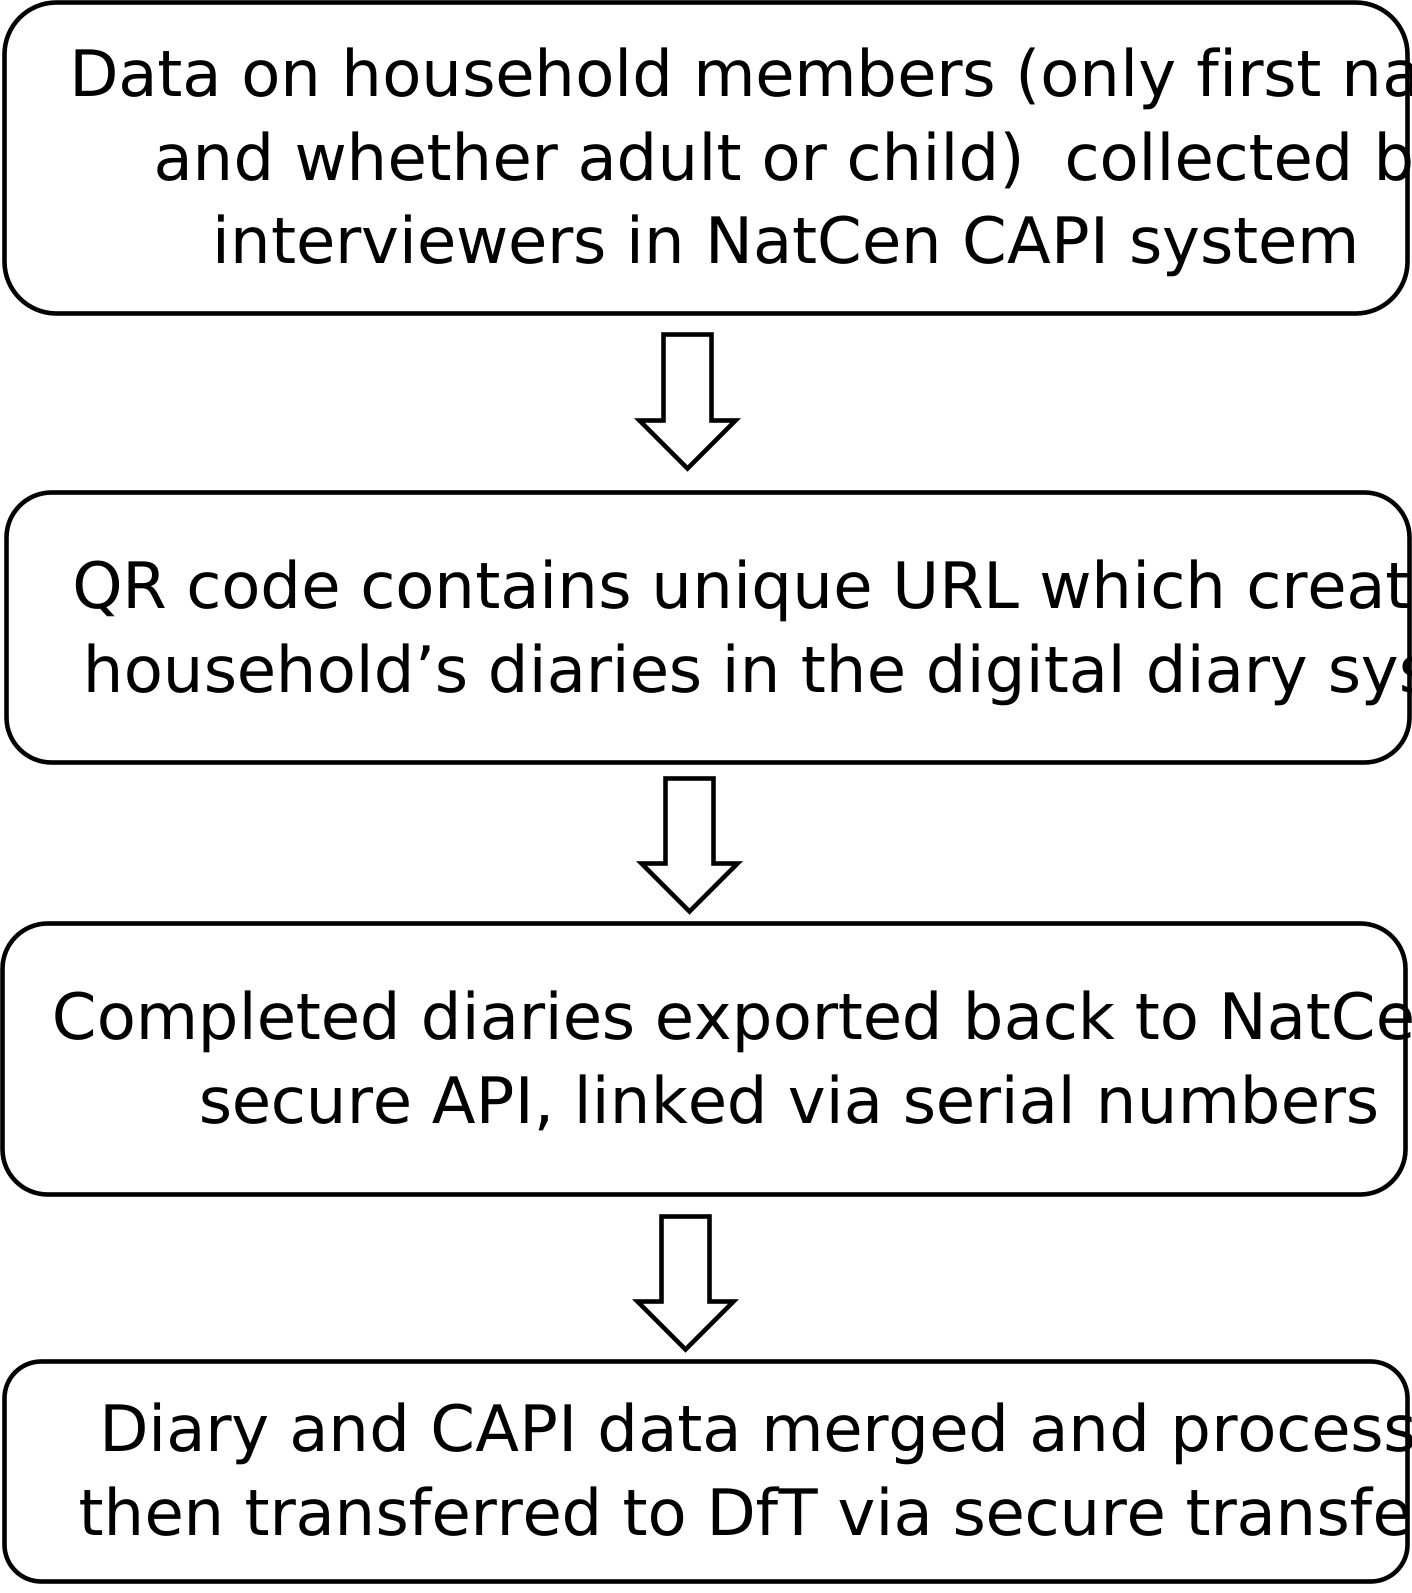
Personal data is collected as part of the NTS process. Direct identifiers such as full names and addresses are removed before transfer to DfT. There remains a small residual risk that data from DfT could be linked back to NatCen’s system via the unique serial numbers, and a small risk that households could be identified using a combination of information held across a number of variables, and for this reason the NTS full data is considered pseudonymous and must be safeguarded as personal data. The NTS privacy statement is available to respondents to understand how their data is collected and managed, and additional information is provided to households via letters and leaflets provided during the fieldwork process. All respondent materials are available as appendices within the technical reports for each year.
DfT aims to publish as much data as is possible whilst ensuring that confidentiality is maintained. Full data containing partial postcodes and Gazetteer locations is held within DfT and is not made available via the UK Data Service licensing. Partial postcodes are made available to a small number of projects which meet strict confidentiality and security requirements via the ONS Secure Data Service. Other versions of the data (special licence and end-user licence) contain less detailed and more aggregated variables.
The published statistics are based primarily on aggregated population and subgroup averages and do not reveal any private information about any individual or household.
DfT adheres to the principles and protocols laid out in the Code of Practice for Statistics and comply with pre-release access arrangements. The pre-release access lists are available on the DfT website.
Section 3: Impact of the digital diary
In January 2025, the NTS digital diary was introduced as the primary tool for travel data collection for the NTS, following a programme of testing and development. The research protocol is digital-first, with households first invited to complete the diary digitally. If a household is unwilling or unable to compete their diaries digitally, the existing paper diaries are offered as a back-up. In 2025, 74% of responding households opted to complete the diary digitally, representing 79% of completed individual diaries.
The introduction of the digital diary appears to be associated with a lower rate of recording for some types of trips. The year-on-year changes in average trips by some modes of travel are outside the expected margins of error and not in line with recent trends, or those observed in other statistical series. Similar changes have been observed in other travel surveys which have changed their data collection modes, therefor this kind of change is not entirely unexpected. This section of the report describes the development of the digital diary and work undertaken to understand the impacts of this change in mode of data collection.
Descriptive statistics
In 2025, the overall recorded trip rate (average number of trips per person, per year) has fallen by 9%, with average distance falling by 8% and time spent travelling by 6%.
The changes are not uniform in size by mode of travel. In 2025, trip rates for walking have decreased by 9%. For car drivers and car passengers trip rates have fallen by 9% and 12% respectively, compared to 2024, which is the lowest on record since 2002 (excluding the years of the COVID-19 pandemic between 2020 and 2022). Walking and car trips account for the majority of personal travel (87% of trips) so the changes in headline trip rates are driven by changes in these modes.
Recorded trip rates for public transport modes in London such as buses in London (12%) and London Underground (15%) have increased in 2025 compared to 2024. Trip rates for buses outside London are similar to 2024, rail has fallen 11% and taxis are up 12%.
Similarly when looking at purpose of travel, the impacts are not uniform across all purposes. Trip rates for selected purposes in 2025 compared to 2024:
- shopping -13%
- personal business -11%
- visiting friends at home -14%
- day trip -15%
- just walk -6%
- commuting +1%
- education +0%
Walking trip rates have fallen across all trip purposes in 2025 compared to 2024 apart from other escort which has increased and education or escort education which has remained similar. The largest decreases in walking trip rates were for leisure purposes, which includes visiting friends at home and elsewhere, entertainment, sport, holiday and day trips.
Car driver trip rates have declined in 2025 compared to 2024 for all trip purposes apart from commuting and education or escort education which has remained similar. Car passenger trips have declined across all trip purposes.
Trip rates for buses in London have increased for the purposes of commuting, education or escort education, shopping and other escort in 2025 compared to 2024. Trip rates for London Underground have increased for all purposes apart from education or escort education and leisure which has remained similar.
Statistics on the average trip length, and trip duration by mode are fairly similar to 2024, with individual changes in line with normal NTS variation. There is no observable disruption to the rate of recording of multi-modal trips, which suggests that the digital diary appears to present no additional barriers to recording complex trips that require more input from respondents.
The observed changes as described in this section suggest that the unexpected changes in trip rates, annual distance and time travelling may be associated with lower rates of recording of certain types of trips, rather than a change to the quality or type of data recorded.
Coherence with other official statistics
Within the NTS, trip rates have been increasing since the lows observed during the covid-19 pandemic (2020 to 2022.) There is a range of alternative statistics for modal usage, drawing on different sources and methods and primarily published by the Department for Transport. Headline NTS trends have been broadly consistent with those observed in other statistical series, however the changes in 2025 are a departure from this. This lends support to the conclusion that the changes for 2025 are associated with the change in data collection mode rather than ‘real’ changes in travel behaviour.
The latest available road traffic statistics show minor increases in car and taxi traffic, with no change in bus and coach traffic:
| Mode | Change 24/25 |
|---|---|
| All motor vehicles | 2% |
| Cars & taxis | 2% |
| LGVs | 1% |
| HGVs | -2% |
| Pedal cycles | 6% |
| Motorcycles | 0% |
| Buses & coaches | 0% |
Rail stats show 6% growth in passenger rail journeys between 2024 and 2025.
The Active Lives Survey measures the percentage of people aged 16 or over who have walked for travel or cycled for travel at least twice in last 28 days. The latest results show no change in either mode between 2024 and 2025.
Bus statistics, year to March 2025
| Area | Passenger journeys (billions) | Percentage change compared to previous year |
|---|---|---|
| London | 1.82 | -1% |
| England | 3.67 | 1% |
| England outside London | 1.85 | 4% |
Background – digital travel diary
Introduction
Development of the digital travel diary began in 2019 following a discovery study that identified the diary as the element of NTS data collection most suited to digitisation. A prototype was created with the overarching aim to replicate the paper diary as closely as possible. The digital diary must collect the same data, following the same definitions and instructions as used in data collection on paper. The diary is designed to collect data from, and share data between, all members of a household. It also allows interviewers to see their households and check and amend data, and also to ‘impersonate’ a respondent (referred to as a diary keeper) to directly enter trip data.
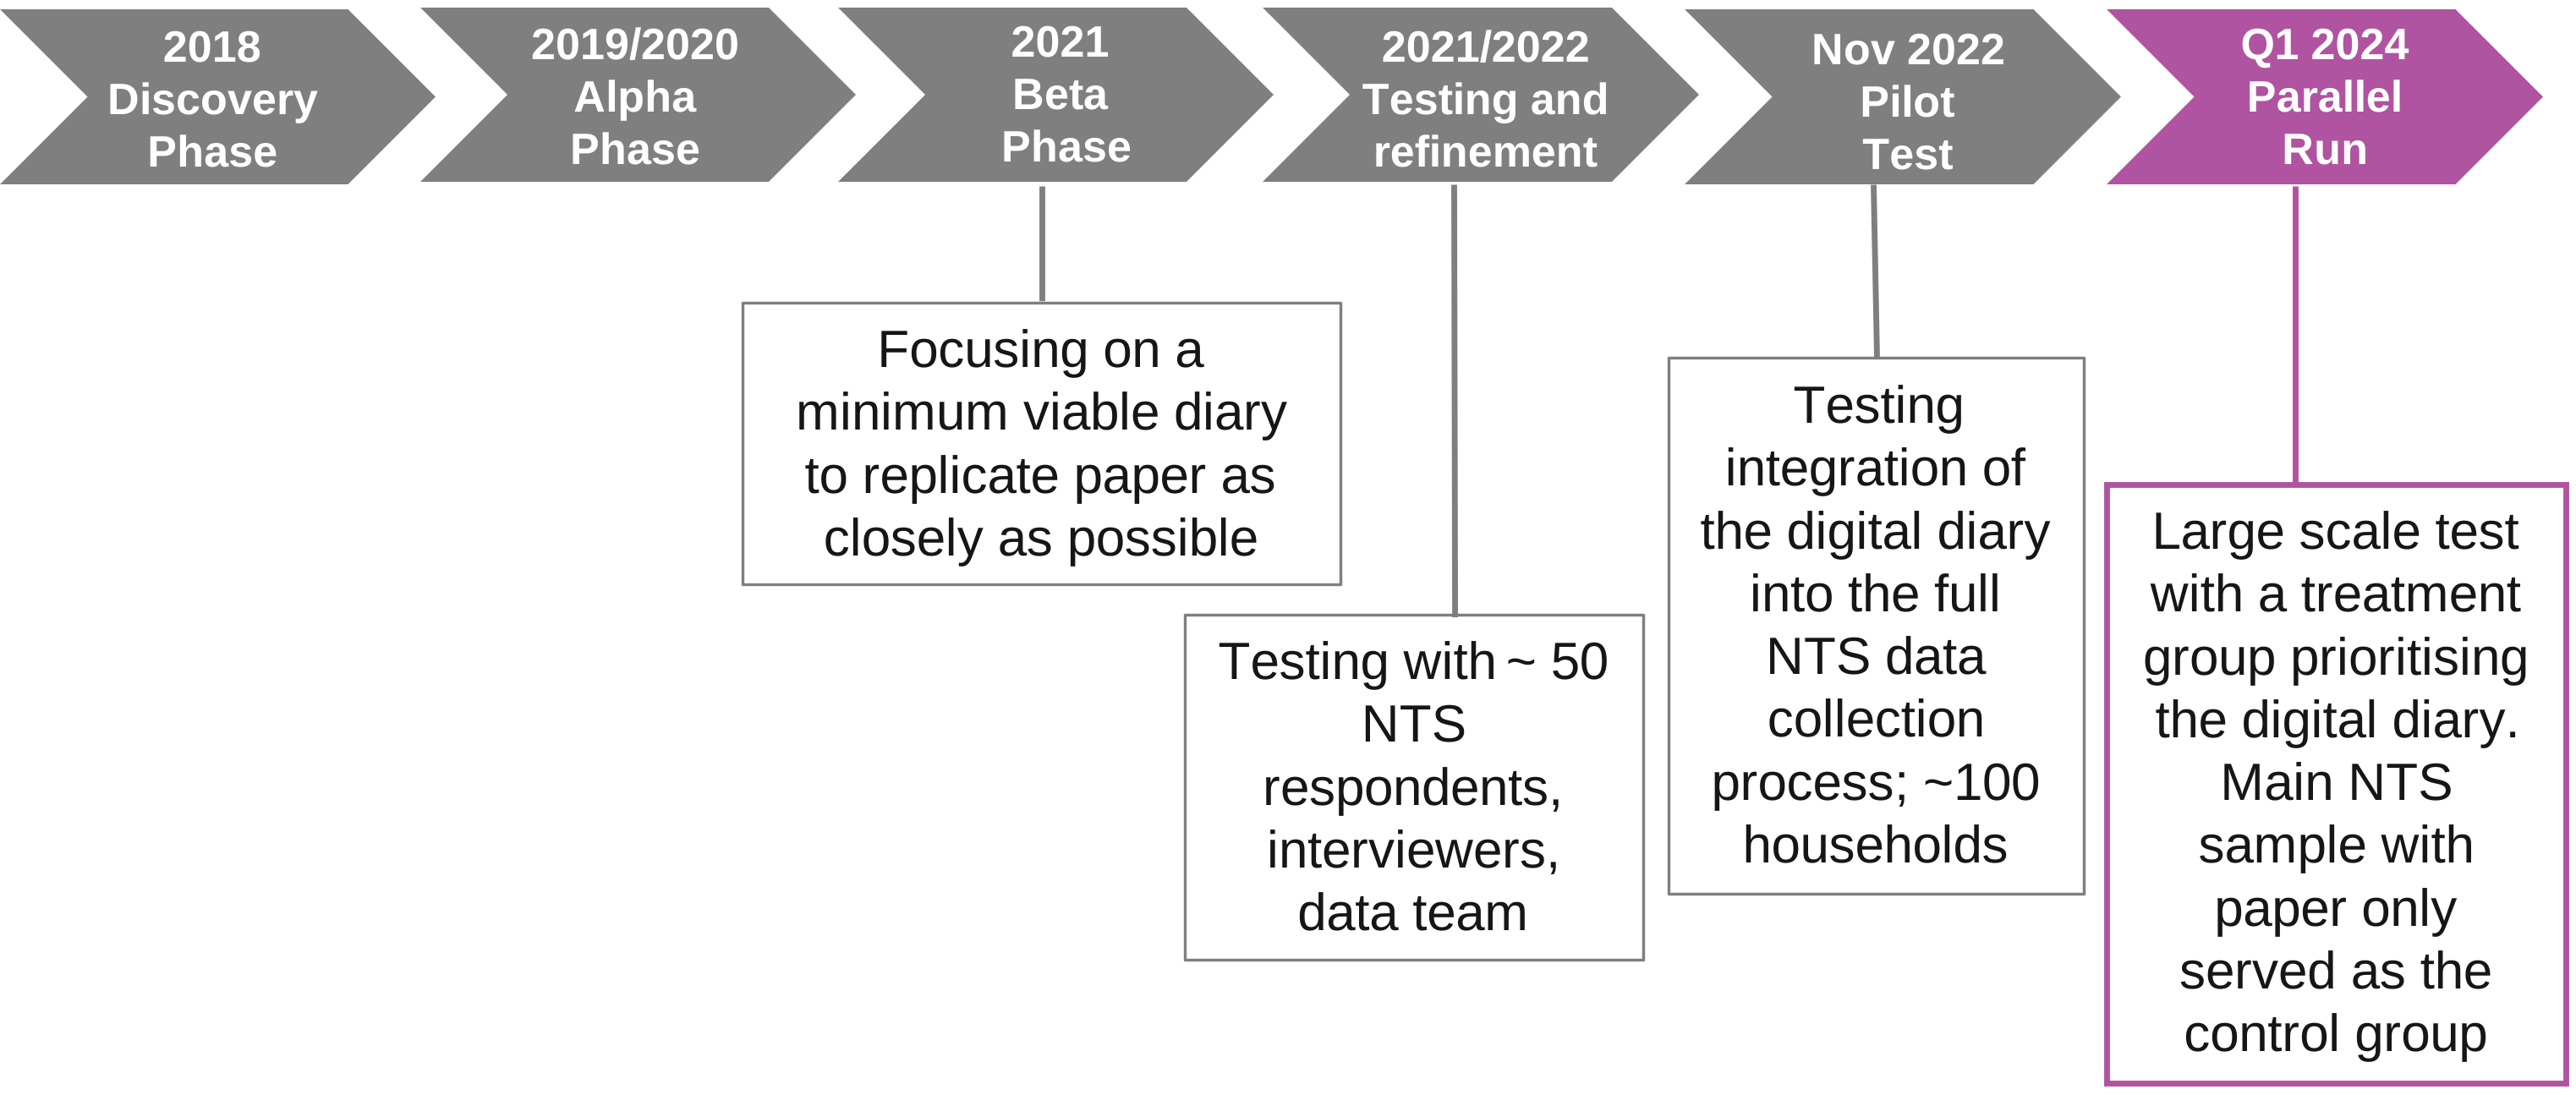
In line with Agile methodology, the digital diary has been tested at each stage of development with user feedback informing the next phase. Features introduced along the way include sharing between households, pre-filled data for return and repeat trips, choice of time and distance measures and pre-coding of transport mode. The following diagram shows the timeline of development, including the increasing scale and complexity of testing which culminated in the parallel run on quarter one of 2024.
Figure 2: digital diary development timeline
User feedback has been largely positive at all stages, with the majority of users able to enter details of their trips, particularly when there is instruction and support from interviwers. Specific points of feedback have been acted on where possible and reasonable, whilst maintaining the standards for security, accessibility and design that are required of any service operating within the gov.uk system. One example is repeated feedback on allowing the ability to choose enter times in either a 12-hour or 24-hour format. The original design allowed only 12 hour format, as per gov.uk requirements, however the frequency of feedback led to the introduction of a toggle to set the format of entry as a preference.
The parallel run was the first test designed to be capable of determining whether the data collected would be different in the digital diaries when compared to paper, attempting to use the digital diary as part of the full NTS survey in a random sample of approximately 2,000 households operating at the same time as the normal NTS fieldwork. Around 1,100 individuals completed diaries in the parallel run, with approximately 70% of these using the digital diary.
The parallel run indicated that short walks may be recorded less frequently in the digital format, which has been replicated in the live survey. There is an observed fall in walks of under a mile, but not in walks of a mile or more. However, the parallel run found no clear effect on recorded trip rates overall or for other modes, therefore the observed effects in the live survey were somewhat unexpected. It has since been suggested that the parallel run was too small in scale to be able to reliably detect differences by travel mode between the digital and paper conditions.
Changes post parallel run
One of the key findings of the parallel run was a strong interviewer effect in the likelihood of a household opting for digital. Development during 2024 therefore focused on introducing and improving interviewer features in the digital diary system. Interviewer training was updated and enhanced ahead of the rollout in 2025. These efforts proved successful with no interviewer effect detected in results from the live survey.
Mode effect analysis - comparing 2025 to 2024
Analysis undertaken by the National Centre for Social Research investigated the impact of a range of factors which may explain differences in recorded trip rates in 2024 with only paper diaries, and 2025 with the paper digital mix.
For an average observed change of -1.2 trips per person per week, the analysis identified factors explaining 35% of the decline, or -0.42 trips. The majority of the explained variation was due to a single factor, which was an increased rate of proxying in digital households (accounting for -0.4 trips per person per week). Proxying is where a person’s travel diary is completed by either another household member or by the interviewer on their behalf.
Proxying has long been considered to be associated with lower data quality due to the increased burden on the person completing the additional diary, and possible lack of knowledge or recall of the trips made by others. The analysis suggests proxying is associated with lower numbers of reported trips in digital diaries compared to paper diaries from 2024.
Internal discussions with field staff have indicated that the need to provide an email address for each individual to complete their own diary might be contributing to increased proxying. This could be due to not all household members having an email address, or being unwilling to provide it, or that it is not known by the person or people present at the time of diary onboarding. It is also theorised that the ready availability of proxying in the digital diary onboarding may lead to some choosing this as the fastest way to complete the task of onboarding the household.
The remaining fall of 0.78 trips per person per week was unexplained by that analysis and may be associated with factors that could not be tested directly, for example a range of small differences in presentation in the digital format compared to paper, a potential perceived increase in burden, including from the need to go to the gov.uk site to enter details of each trip over the 7 day period, or differences in interviewer engagement with diaries in the two different modes.
Lessons from international experience – is this to be expected?
A number of countries internationally conduct personal travel surveys with comparable methodology and intent to the National Travel Survey for England. During the twenty-first century, many of these surveys have changed modes of data collection, therefore there is a range of experience to draw on when understanding whether the changes observed in the England NTS are to be expected.
The evidence is substantial and largely consistent: the transition to self-completion CAWI (computer assisted web interviewing) increases the risk of trip underreporting, particularly for low-salience short trips. This is well documented in the Netherlands, US, German and New Zealand survey literature. The evidence and general survey methodology literature supports the theory that active data entry via a digital form is more cognitively burdensome than paper, causing respondents to drop out or truncate their diary. Several surveys have also found that the design of the digital tool itself is a significant moderator of this effect.
Most surveys have made weighting adjustments when changing data collection mode, though approaches vary. Few have attempted to weight specifically for trip-level underreporting (as opposed to demographic non-response bias). The Netherlands is a notable exception in publishing systematic time-series modelling that explicitly corrects for mode-induced discontinuities.
Where diary mode choice has been offered, mode selection is not random: age is the strongest and most consistently documented predictor, with older respondents preferring paper. Education, income and digital literacy also emerge as significant in some studies.
It should be noted that the international surveys, whilst similar to the England NTS, are not identical in design and operation. In particular, of the above examples, face-to-face interviewing is used only in New Zealand. In England, interviewers play a role in explaining the diary and supporting respondents, therefore their understanding of the required task is not solely dependent on the tool’s design.
Conclusion
The introduction of the digital diary was the most significant methodological change to the NTS in many years, and there remains scope for improvement in the design and operation of the digital diary and in fieldwork protocols and practices to support its use.
Current understanding is that use of the digital diary does seem to be associated with lower rates of trip recording, but this is not uniformly observed across all travel methods or purposes. At the England level, many of the statistics show trends that are expected or fall within the standard margins of error for the NTS. No statistics based on interview questions (such as satisfaction with transport modes) are affected by these changes.
Much of the observed change associated with digital diary use is unexplained and may best be understood as a result of the myriad small and large differences in the experience of filling in a digital as opposed to a paper travel diary. Falls seem to be greater for trips of lower salience (short walks, trips for shopping and leisure purposes) which is consistent with the observation of increased proxying and observations from other studies and international surveys that digitisation often leads to lower recording of such trips.
There are some precedents for sudden falls in trip rates in the NTS, the first of which a fall of 6% resulting from a significant redesign of the paper diary for 2007. There was a similar pattern of a fall in short walks and car trips with public transport trips less affected. Pedal cycle trips also fell, something which has not occurred in 2025. Analysis at the time was unable to isolate contributing factors and concluded the changes resulted from a multitude of small changes. The second notable fall, a 22% drop in trip rates, was during the period of travel restrictions associated with the covid-19 pandemic in 2020. Whilst there were genuine and sudden changes in travel behaviour, confirmed by observed changes in other statistics, some of the change was undoubtedly due to the change in fieldwork operation, sample composition and data collection mode (telephone travel diaries).
Neither of the previous disruptions to the series are regarded as breaks in series, as the fundamental structure of the NTS and the way in which travel behaviour is measured has not changed, although caution is always advised when considering data from 2020-2022. There does appear to be an effect on certain aspects of the data recorded for 2025 resulting from the change in data collection mode, however work to date has not fully explained this. The current discontinuity is not considered to be a greater disruption than either of the previous changes and therefore data for 2025 are not presented as a break in series, although users are advised to be aware of the impact of the change in data collection method, and that some types of trips may be under-reported.
What we are doing about it
Digital development
The digital diary was always intended for further development following its introduction, to explore utilising more features available to web-based services, such as inline validation and geographic services, and refine user experience based on real-world feedback and evidence.
Based on respondent feedback, some of the respondent-facing screens have been re-designed and as of the time of publication are being tested. This:
- increases the prominence of features designed to reduce burden, i.e. auto-completion for return and repeat trips
- reduces the overall required number of clicks per trip
- simplifies language and increases contextual indicators to help users stay on track
Further planned developments include improving the mobile phone experience, utilising mapping or other geographic services to assist with trip origins and destinations and automatically calculate distances and exploring the use of AI and other technologies to reduce the burden on respondents.
Measurement error adjustment
The current weighting design adjusts the weighting for trips entered on days 2-7, as it is well established that fewer trips for some purposes are entered over the course of the week regardless of the day of the week on which the diary was started. Work is planned to explore adjustment of the weighting design to account for the use of different data collection modes, however this will depend on whether differences in data between the modes prove to be enduring.
NTS modernisation programme
The long-standing design of the NTS means that making changes to data collection or other aspects of the survey is slow and challenging. The questionnaire has grown in length over time as the NTS has adapted to evolving policy needs and data requirements. There is also an ever-increasing demand for faster and more granular data. From autumn 2026, the NTS is therefore embarking on a modernisation programme designed to make the survey more flexible and scalable, and utilise modern technologies.
The experience of the digital diary has highlighted further needs for change and created an imperative to explore the reduction of proxying, to simplify data entry and to reduce the amount of data collected to ensure the NTS of the future continues to be a high quality survey delivering robust and reliable data.
We are always happy to discuss the methodology and operation of the NTS with our users. If you have any feedback or wish to contribute to our stakeholder engagement programme, please get in touch with us via email.
Instructions for printing and saving
Depending on which browser you use and the type of device you use (such as a mobile or laptop) these instructions may vary.
You will find your print and save options in your browser’s menu. You may also have other options available on your device. Tablets and mobile device instructions will be specific to the make and model of the device.
How to search
Select Ctrl and F on a Windows laptop or Command and F on a Mac
This will open a search box in the top right-hand corner of the page. Type the word you are looking for in the search bar and press enter.
Your browser will highlight the word, usually in yellow, wherever it appears on the page. Press enter to move to the next place it appears.
Contact details
National Travel Survey statistics
To hear more about DfT statistical publications as they are released, follow us on X (formerly known as Twitter) at DfTstats.