National Travel Survey 2025: Understanding changes in trip rate estimates under the digital-first approach
Updated 10 September 2026

© Crown copyright 2026
This publication is licensed under the terms of the Open Government Licence v3.0 except where otherwise stated. To view this licence, visit nationalarchives.gov.uk/doc/open-government-licence/version/3 or write to the Information Policy Team, The National Archives, Kew, London TW9 4DU, or email: psi@nationalarchives.gov.uk.
Where we have identified any third party copyright information you will need to obtain permission from the copyright holders concerned.
This publication is available at https://www.gov.uk/government/publications/future-developments-for-the-nts/national-travel-survey-2025-understanding-changes-in-trip-rate-estimates-under-the-digital-first-approach
Authors:
- Zac Marco Perera
- Joe Crowley
- Peter Cornick
from the National Centre for Social Research
Section 1 Executive summary
1.1 Background
In 2025, the National Travel Survey (NTS) introduced a digital-first approach after decades of paper-only travel diary collection. Following this transition, mean weekly trip rates were lower than in 2024 despite no evidence of a genuine decline in travel. This raised concerns about the comparability of estimates collected under the previous and new survey designs. Differences in measurement, processing and non-response errors were identified as plausible explanations. This report assesses how far observed indicators of these factors accounted for the decline and estimates their relative contributions to the lower trip rate in 2025.
1.2 Methods
NTS data from adults aged 16 and over collected between the January 2024 and December 2025 fieldwork months (n = 29,336) were analysed using weighted multilevel regression models. The analysis assessed how much of the difference in trip rates between 2024 and 2025 could be explained by 14 socio-demographic characteristics, 7 fieldwork indicators, fieldwork quarter selected interaction terms with diary mode, and random effects accounting for clustering at the PSU and household levels. Contributions were estimated by combining model coefficients with changes in the distribution of each factor across years.
1.3 Results
The observed difference in trip rates between 2024 and 2025 was -1.20 trips per week. After adjusting for observed socio-demographic and fieldwork factors, the estimated difference reduced to 0.75 trips in the final model. Together, the measured factors contributed to 35% of the decline (0.42 trips). Increased proxy reporting was the largest measured contributor, accounting for around 33% of the total decline (0.40 trips), while other factors had smaller positive or negative effects.
1.4 Discussion
There was no indication that respondents reported fewer trips on the digital diary compared to the paper diary. Instead, increased proxy reporting emerged as the largest observable contributor to lower trip rates in 2025. Reducing proxy completion should therefore be a priority for future survey years. Disability status was the only other factor that made a notable negative contribution and may warrant further review in the weighting strategy if trends persist.
Most of the decline (65%) remained unexplained but is unlikely to be driven by a single factor. Instead, it is likely attributable to a combination of:
- other sources of measurement, processing, and non-response errors that could not be observed and could not be captured by the model
- year-on-year sampling variation
- other, unidentified contributors associated with the transition to the digital-first approach
Section 2 Background
2.1 Summary of this chapter
In 2025, the NTS introduced a digital-first approach, after decades of paper-only travel diary collection. Following this transition, mean weekly trip rates fell compared with 2024, despite no evidence of a real decline in travel. This creates a challenge for users of NTS data as to how to interpret estimates under the new design and compare them with previous fieldwork years.
Differential measurement, processing, and non-response errors across the digital-first and paper-only designs were identified as plausible contributors of this difference.
This report, therefore, assesses how far observed indicators of these factors accounted for the decline in trip rates between 2024 and 2025, and estimates their individual relative contributions. This transparency for data users reflects good practice for time-series analyses and acts as a powerful step forward in understanding why trip rates were lower in 2025.
The Total Survey Error (TSE) framework highlights three plausible pathways – measurement error, processing error, and non-response error – through which the introduction of the digital-first approach might have affected trip estimates. The existing evidence helps to narrow the set of plausible explanations, as some mechanisms appear less influential than initially expected. However, others remain both plausible and insufficiently understood.
2.2 Context and motivation
The NTS is a well-established, probability-based household survey that has operated continuously since 1988. It provides the DfT with the primary source of information about personal travel in England. As part of the study, respondents complete a travel diary where they record their journeys over a seven-day period.
Over the past decade, many large-scale social surveys in the UK have moved towards mixed-mode designs. These shifts have leveraged recent technological developments in order to reduce logistical and environmental costs and maximise participation, against a backdrop of rising costs and declining response under face-to-face fieldwork.
In 2025, the NTS followed suit and implemented a new, digital-first approach to travel diary collection, replacing the paper-only approach that had been in place since the survey’s inception in 1965. Under the new design, respondents are offered a digital diary as the primary mode of completion, with a paper diary as a back-up available for those who are unable or unwilling to complete digitally. Under the previous, paper-only approach respondents could only fill out a paper diary. Detailed information about the new methodological approach can be found in the 2025 technical report.
Following this transition, estimates of the mean weekly trip rate, which is a key NTS survey statistic, were notably lower than in 2024 under the paper-only approach. The unweighted mean weekly trip rate across each fieldwork quarter for 2024 and 2025 is presented in Figure 2.1.
The weekly trip rate is defined as the number of trips made per person per week in England.
Figure 2.1: Mean weekly trip rate by fieldwork quarter
Base: fully responding sample, individual-level, unweighted
| Fieldwork quarter | 2024 | 2025 |
|---|---|---|
| Q1 | 13.5 | 12.8 |
| Q2 | 14.4 | 12.6 |
| Q3 | 13.7 | 12.9 |
| Q4 | 13.5 | 12.8 |
However, the DfT routine monitoring of other data sources found no evidence of reduced travel behaviour. Evidence from Department for Transport’s road traffic and bus statistics, Office of Rail and Road’s train passenger statistics and Active Lives walking and cycling statistics provides no evidence to suggest that there was a real decline in trip rates during 2025. This suggests that the observed difference is a methodological artefact rather than a ‘real-world’ effect.
This shift is not entirely unexpected, as changing survey mode designs has the potential to materially alter survey estimators. However, its magnitude is larger than might have been expected based on findings from the Pilot and Parallel Run, which were conducted before the digital-first approach was implemented at scale in 2025.
In the 2022 pilot, which used a small and purposive sample, the digital-first weekly trip rate estimate yielded by 74 individuals was closely aligned with the NTS estimate over a similar timeframe.
In the 2024 Parallel Run, which used a large sample drawn using the standard NTS sampling methodology, the digital-first weekly trip rate yielded by 1,170 individuals was, on average, 0.2 trips lower than that of the control group. However, the difference was not statistically significant at the 5% level.
Using data from the first half of 2025, internal analysis also assessed whether digital diary respondents were more likely than paper completers to report a ‘low’ trip rate, with the fully productive sample weights applied. A ‘low’ trip rate was defined as being below the average observed in the first half of 2024. The multi-level logistic regression model controlled for 14 socio-demographic characteristics and seven fieldwork indicators, and accounted for interviewer, PSU, and household level variation through random effects. After these adjustments, there was no statistically significant difference between the digital and paper modes in the odds of reporting a ‘low’ trip rate. There was also no significant difference in the interviewer effect on trip reporting by mode when extending the analysis to a random coefficient model.
These findings suggested that there was no fundamental measurement difference between the digital and paper diary instruments. However, they did not rule out that the digital-first approach influences trip rate reporting indirectly. For example, reported household member proxying rates were notably higher among digital diary completers than among paper diary completers, consistent with findings from the Parallel Run. As proxy reporting is generally associated with a greater risk of under-reporting, this is one of several mechanisms through which the digital-first approach may be indirectly contributing to the lower overall trip rate in 2025.
In light of this, robust evidence identifying and quantifying contributors to the decline is required, so that:
-
data users know how to interpret the 2025 data appropriately
-
statistical adjustments can be applied, if appropriate, to maintain the integrity of the time series
-
mitigations can be implemented for future fieldwork years to improve data quality
2.3 Potential mechanisms for the lower trip rate in 2025
In order to identify the mechanisms that may be driving the lower trip rate in 2025 under the digital-first approach, it is first important to assess how the survey design differs from the previous paper-only approach at each key stage of the survey lifecycle. The Total Survey Error (TSE) framework can provide a structured approach for this assessment.
The TSE framework conceptualises survey estimates as the product of multiple sources of error arising across the survey lifecycle. Even though not all of these components of error are quantifiable, by identifying the ones that could theoretically vary under the two designs, it is possible to develop well-founded hypotheses about why the NTS trip rate declined between 2024 and 2025.
Many elements of the NTS design remain unchanged across the two approaches, including the target population, weighting strategy, and underlying constructs being measured. As a result, several components of Total Survey Error – measurement validity, specification error, coverage error and sampling error – are likely to be consistent across both approaches and are unlikely to explain the observed difference in trip rate.
Measurement validity depends on how well survey indicators capture the underlying construct of interest. The same survey indicator (weekly trip rate) was used to measure the same underlying construct (amount of travel completed) across both years.
Specification error occurs when there is a conceptual misalignment between the inferential population (to which users wish to generalise the survey results) and the target population that is formally defined at the design phase. The inferential and target populations were equivalent in 2024 under the paper-only approach and in 2025 under the digital-first approach.
Coverage error occurs when the sampling frame does not accurately represent the defined target population, through underrepresentation (under-coverage) or overrepresentation (over-coverage) of eligible units. The same sampling frame was used in 2024 and 2025.
Sampling error is the difference between an estimate derived from a sample survey and the value that would have been obtained if a census had been conducted among the entire population. The key drivers of sampling error are sample size and the sample design. There were minor differences in the sampling approach between 2024 and 2025, as outlined in section 3.1 of this report. However, these are only anticipated to increase precision, rather than impact the value of estimators themselves.
The focus, therefore, turns to three components of error that could plausibly vary under the digital-first design: measurement error, processing error, and non-response error.
2.3.1 Measurement error
Measurement error refers to differences between the recorded response and the true value of the survey variable. Under the digital-first approach, several mechanisms could plausibly lead to changes in measurement.
Firstly, in principle, differences in the layout, navigation, and prompts between the digital and paper instruments could shape how respondents interpret and complete the diary. Similarly, interviewers may be less adept at supporting respondents with a novel digital tool, potentially affecting data quality. However, current evidence provides little support for these hypotheses, given that the internal analysis from the first half of 2025 found no fundamental difference in trip rate measurement between the digital and paper modes, and interviewer effects were low and consistent across both modes.
A more compelling explanation lies in proxy reporting of travel diary data, which is well-established as increasing the risk of trip under-reporting. As displayed by figure 2.2, trends across 2024, 2025 and early 2026 show a clear divergence between the interview and diary component: while interview self-completion rates remained stable, diary self-completion rates fell sharply following the introduction of the digital-first approach in January 2025. However, during the second half of 2025 rates of diary self-completion increased month-on-month, demonstrating the potential for improvement.
Figure 2.2: Self-completion rates for the interview and diary components (11+ only)
Base: check aged 11 and over, unweighted, individual-level
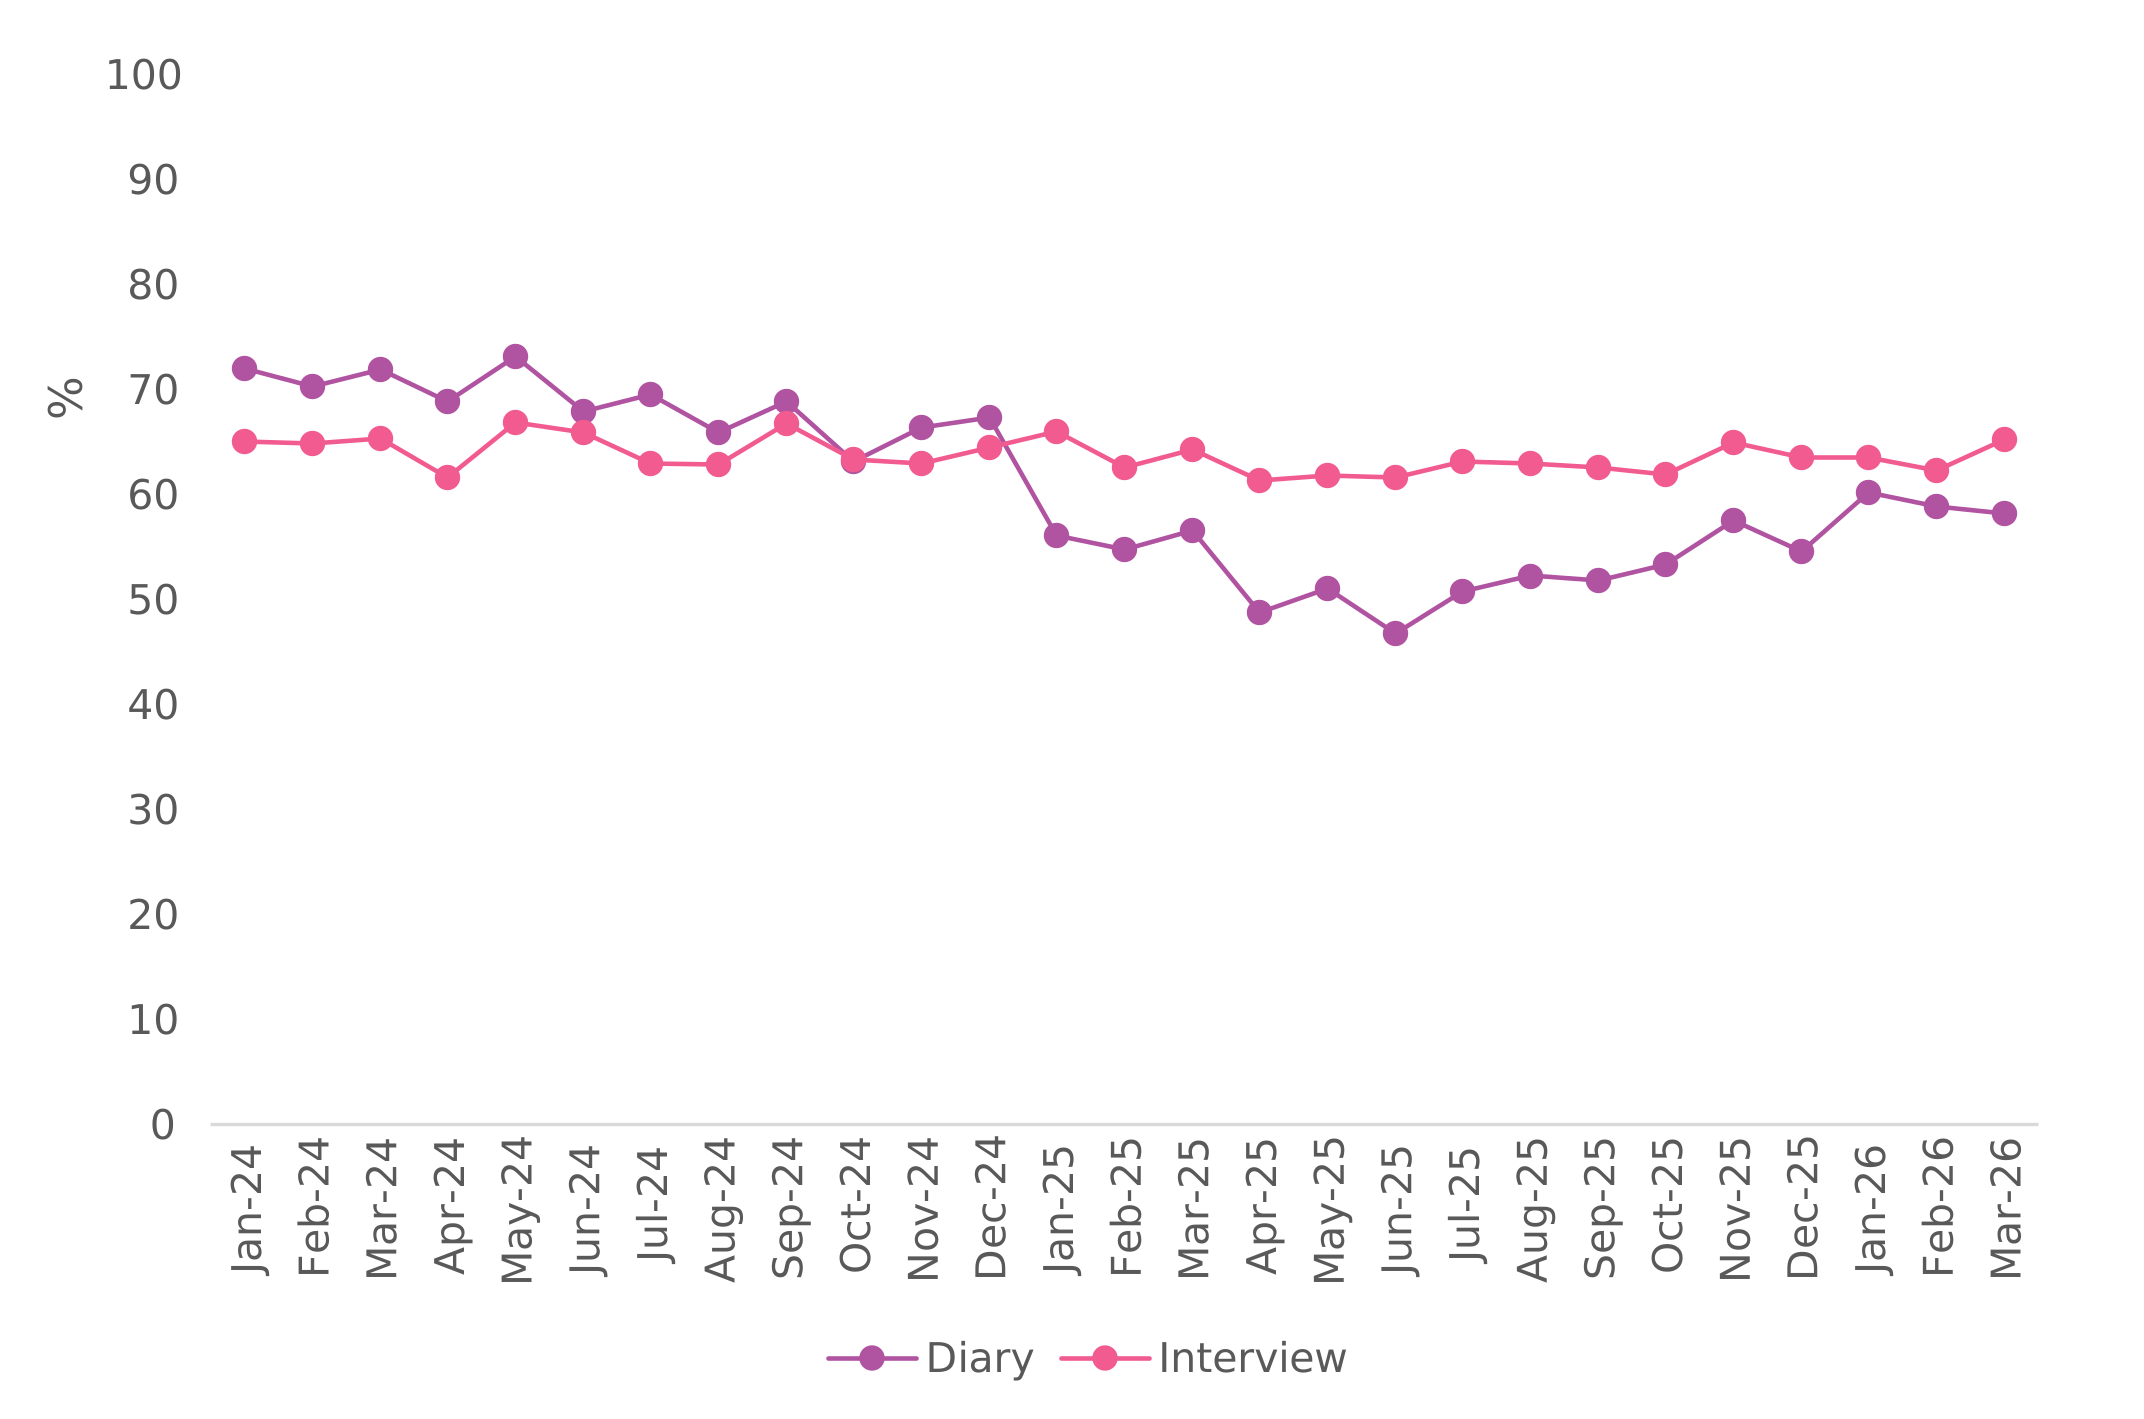
The image features two lines, showing the monthly self-completion rates for the interview and diary components respectively. The time period is January 2024 to March 2026, and figures are expressed as percentages. The interview self-completion rate remains relatively stable throughout the period, ranging from 61% to 67%. However, diary self-completion meaningfully varies over time. At the start of the time period, the diary self-completion rate is higher than the interview rate, at around 70% to 73% for most of 2024. However, it falls sharply at the start of 2025, dropping from 67% in December 2024 to 56% in January 2025. It reaches a low point of about 47% in June 2025 before gradually recovering during the second half of 2025. In the first quarter of 2026, the monthly diary self-completion rate ranges between 58% and 60%, well below 2024 levels. In summary, the chart shows that interview self-completion rates remain stable over time, whereas diary self-completion rates decline substantially following the introduction of the digital-first approach in 2025 before partially recovering during late 2025 and early 2026.
This contrast is notable given that both data collection components are subject to similar underlying survey pressures, suggesting that the increase in proxying was driven by aspects of the digital-first approach. This is reinforced by experimental evidence from the Parallel Run where proxying rates were much higher in the digital-first compared to paper-only group. The underlying mechanisms behind higher proxying under the digital-first approach are not yet fully understood but could be linked to the prominence and wording of proxying within the digital interface during set-up, or the 70% digital completion target set for interviewers, which may have promoted proxy completions in order to achieve digital completers.
Overall, while differences in respondent reporting or interviewer effects across modes appear unlikely to explain the lower 2025 trip rate, increased proxying represents a credible source of increased measurement error under the digital-first approach.
2.3.2 Processing error
Processing error arises during the handling and transformation of survey data after respondents have recorded their travel, including interviewer checking and editing activities and subsequent processing by data operators. The move to a digital-first diary introduced new systems and workflows that could plausibly affect these processes.
During the Digital Diary Parallel Run, it took around 3 minutes longer, on average, for interviewers to check and edit digital diaries than paper diaries, even when controlling for household size. Qualitative evidence from interviewers who worked on the Digital Diary Parallel Run and mainstage NTS in 2025 found that checking and editing digital diaries can require more effort than paper diaries. Internal analysis of data from the first quarter of 2025 also found that digital diaries were more likely to contain missing journeys or incomplete information. Together, these findings suggest that interviewer processing may operate differently across modes and could contribute to differences in reported trip rates. However, the available evidence does not currently allow the size of any such effect to be determined.
Importantly, evidence on processing differences remains more limited than evidence relating to proxy reporting. While detailed paradata are available for interviewer interactions with digital diaries, comparable information is not routinely collected for paper diaries. As a result, direct comparisons of interviewer checking and editing practices across modes are currently difficult. An ongoing sub-project examining interviewer editing practices is expected to provide further insight into whether these processes differ systematically between paper and digital diaries.
Beyond the interviewer stage, there is currently insufficient evidence to assess whether Data Operations processing differs meaningfully between the two approaches or whether any such differences affect final trip rate estimates. However, once data are entered into the Diary Entry System, they are processed in the same way regardless of collection mode. Consequently, there is currently no evidence to suggest that Data Operations processes are a major contributor to the lower trip rate observed in 2025.
2.3.3 Non-response error
Non-response error arises when respondents differ systematically from non-respondents in ways that are related to the outcomes of interest. Introducing multiple modes of administration is generally agreed to reduce non-response biases relative to single-mode designs. On this basis, the shift to a digital-first design may have improved representativeness among some groups, though the implications for key estimates are not straightforward.
Internal analysis of early data from the first quarter of 2025 indicated marginal improvements in representativeness with respect to sex, employment status, education, region and urbanicity relative to 2024. However, it has not yet been tested whether this has translated into shifts in estimates. Importantly, not all of these characteristics are incorporated in the weighting strategy, meaning that changes in sample composition could influence both unweighted and weighted trip rate estimates.
2.4 Purpose of this report
In order to address gaps in evidence identified in section 2.3, this report estimates the extent to which differences in weighted trip rates between 2024 and 2025 can be explained by a range of socio-demographic characteristics and fieldwork indicators. It also assesses the relative contribution of these variables to the observed decline.
The analysis does not attempt to fully capture nor isolate measurement, processing, and non-response errors. Instead, it works within the limits of the data, using observable indicators as partial and imperfect proxies for each mechanism.
Measurement error is examined using diary mode and proxy reporting, alongside indicators of fieldwork processes that serve as proxies for response quality. Interviewer effects on trip rate reporting are not modelled separately because their effect was previously shown to be low and consistent across modes under similar specifications during the internal analysis of data from the first half of 2025.
Processing error is assessed through measures of interviewer checking and editing time, including interactions with diary mode. Findings from a complementary sub-project on interviewer editing practices are expected to provide further insight into how interviewer behaviour varies across modes.
Non-response error is explored using a range of household- and individual-level socio-demographic characteristics, capturing potential shifts in sample composition that may not be fully addressed via weighting.
This transparency for data users reflects good practice for time-series analyses and acts as a powerful step forward in understanding why trip rates were lower in 2025.
2.5 Research questions
Specifically, this report addresses the following research questions:
Research question 1: Description: Did the distribution of key socio-demographic and fieldwork indicators change between 2024 and 2025, and to what extent were they associated with reported trip rates?
Research question 2: Explanation: To what extent did these factors explain the difference in reported trip rates between 2024 and 2025?
Research question 3: Contribution: Which factors contributed most to the lower reported trip rate in 2025, given changes in their distribution across years and their association with trip rate reporting?
Section 3 Methods
3.1 Summary
NTS data from January 2024 to December 2025 were analysed, focusing on individuals aged 16 and over from fully productive households, yielding a final sample size of 29,336.
Fully productive sample weights were applied to ensure representativeness of England’s residential population, accounting for the complex sampling design where possible.
The key variables of interest were weekly trip rate (dependent) and fieldwork year (independent), alongside 14 socio-demographic and 7 fieldwork variables (control covariates) that indicated measurement, processing, and non-response errors.
Multivariate, multilevel regression models were estimated, progressively adding controls and testing selected interactions with diary mode.
Finally, regression coefficients were scaled by changes in variable distributions between years to estimate the relative contribution of each factor to the lower trip rates observed in 2025.
3.2 Data
This report drew on data from all individuals aged 16 and over that belonged to fully productive households between the January 2024 and December 2025 fieldwork months. The analysis focused on adults (16 years or over) only, because some key covariates, such as employment and educational qualifications, are not asked of children.
3.3 Representation
The NTS sampling procedures across the 2024 and 2025 fieldwork years were designed to produce data that represented individuals living in residential addresses across England.
Summary of the NTS sampling methodology: The 2024 and 2025 NTS samples were drawn separately ahead of their respective fieldwork periods. In both years, a three-stage complex sampling design was followed to promote alignment between the issued sample and the target population (those living in residential addresses in England). The methodologies were identical, apart from two minor differences in stratification: in 2025, a quaternary stratifier based on commuting by car was introduced and the categories for ITL2 region (the primary stratifier) differed slightly between years. In the first sampling stage, postcode sectors were selected as Primary Sampling Units (PSUs) under a stratified quasi-panel design. Postcode sectors with 500 or fewer delivery points were grouped with adjacent sectors. To reduce temporal variance, half of the PSUs from the previous fieldwork year were retained, while the remaining PSUs were newly selected using stratification by ITL2 region, urbanicity, car ownership (and car commuting in 2025 only). In the second stage, 22 household addresses were systematically sampled within each PSU. Where multiple dwelling units or households were identified at a sampled address, interviewers followed a random selection procedure in the CAPI system to choose one. All individuals usually resident at each eligible address were eligible to participate, forming the unit of analysis.
The achieved sample size for those aged 16 and above was 30,189. However, the final, analysed sample size was 29,336 because individuals with missing values for any variables included in the analysis were removed. This is with the exception of highest educational qualification, whereby a ‘missing’ category was included in regression analyses due to the high rate of item non-response. Individuals with missing values needed to be removed because the linear predictor for that unit could not be estimated by the regression model.
All analyses were weighted using the fully productive sample weight, which adjusts for unequal selection and non-response probabilities. However, weights adjusting for measurement, such as travel week drop-off, were not applied in case they obscured measurement differences across the years.
Summary of the NTS fully productive sample weight methodology: Separate sets of weights were computed for the 2024 and 2025 NTS samples after the completion of fieldwork in each year, using identical methodologies. As with any survey data, across both years, the representativeness of the achieved sample was constrained by a combination of frame error, features of the complex sampling design, and non-response bias. Some sampled addresses were ineligible or contained multiple households, leading to unequal selection probabilities that were unknown at the point of sample selection. In addition, the multi-stage design introduced non-trivial clustering at both the postcode sector and household levels. Non-response further resulted in systematic differences in participation across those with different characteristics. Non-response adjustments were applied using region, urbanicity, 2021 Output Area Classification supergroups, and fieldwork month, and the final weights were calibrated to population totals for age, sex, and region, and to fieldwork quarter so that 25% of the total weights were assigned to each calendar quarter.
Removing individuals under 16 and those with missing covariate values increased both weighted and unweighted estimates of the mean trip rate in 2024 and 2025 by around half a trip. Figure 3.1 presents the change in the weighted and unweighted mean trip rate estimates for 2024 and 2025 due to this exclusion. Although this exclusion had a noticeable effect on the overall estimate, the impact was similar across both years, suggesting it is unlikely to affect the generalisability of the findings.
Figure 3.1: Change in mean trip rate estimate (analysed sample – achieved sample)
| Type | 2024 | 2025 |
|---|---|---|
| Unweighted | +0.48 | +0.42 |
| Weighted | +0.55 | +0.46 |
When producing summary statistics, precision was robustly estimated by treating adjusted postcode sectors as distinct sampling clusters and using Government Office Region as a stratification variable to account for the complex sampling design. This regional variable is less geographically granular than the original regional stratification variable, which had only one PSU for some stratum. This may mean 95% confidence intervals are slightly overly conservative.
When regression modelling, adjusted postcode sectors and households were included as random intercepts. This adjusted standard errors to account for interdependence introduced by the complex sampling design. However, stratification was not taken into account, meaning that p-values may be overly conservative. As a result, any coefficients with p-values close to the significance level (5%) were monitored.
3.4 Measurement
The independent variable was fieldwork year and the dependent variable was a scalar measure of the number of trips recorded per week. In addition, the following potential covariates were explored:
- fieldwork quarter in order to control for underlying seasonal variation in travel within year
- 14 socio-demographic characteristics: age, country of birth, disability status, ethnic background, employment status, government office region, highest educational qualification, household internet access, household size, household tenure, Index of Multiple Deprivation, marital status, person density, and sex
- 7 fieldwork indicators: checking and editing time, days backdated, diary mode, diary placement time, midweek check completion, proxy status, and reminder completion
Backdating occurs when a diary travel week starts at least 2 days before the placement interview date. This was computed by comparing the system date of the placement interview against the travel week start date inputted by the interviewer into the CAPI system. The midweek check is conducted during the travel week to assess how respondents are completing their diary and resolve any issues they encounter. The reminder call informs respondents that their travel week is about to start.
Table 3.1 lists the variables used to address the research questions, alongside:
- their source
- the rationale for their inclusion
- their analytical level
- their measurement type
Table 3.1: Summary of variables used to address the research questions
| Variable | Source | Reason for inclusion | Level | Type |
|---|---|---|---|---|
| Age | Respondent interview | Covariate – socio-demography | Individual | Scalar |
| Checking and editing time | Interviewer | Covariate - fieldwork | Household | Scalar |
| Country of birth | Respondent interview | Covariate – socio-demography | Individual | Nominal |
| Days travel diary backdated | Interviewer | Covariate - fieldwork | Household | Scalar |
| Diary mode | Interviewer | Covariate - fieldwork | Individual | Nominal |
| Diary placement time | Interviewer | Covariate - fieldwork | Household | Scalar |
| Disability status | Respondent interview | Covariate – socio-demography | Individual | Nominal |
| Ethnic background | Respondent interview | Covariate – socio-demography | Individual | Nominal |
| Employment status | Respondent interview | Covariate – socio-demography | Individual | Nominal |
| Fieldwork quarter | Pre-fieldwork | Covariate - time | Household | Ordinal |
| Fieldwork year (2024/2025) | Pre-fieldwork | Independent variable | Household | Ordinal |
| Fully responding weight | Post-fieldwork | Generalisability | Household | Scalar |
| Government office region | Pre-fieldwork | Covariate – socio-demography | Household | Nominal |
| Highest educational qualification | Respondent interview | Covariate – socio-demography | Individual | Ordinal |
| Household internet access | Respondent interview | Covariate – socio-demography | Household | Nominal |
| Household ID | Pre-fieldwork | Clustering | Household | Nominal |
| Household size | Respondent interview | Covariate – socio-demography | Household | Scalar |
| Household tenure | Respondent interview | Covariate – socio-demography | Household | Nominal |
| Index of multiple deprivation | Pre-fieldwork | Covariate – socio-demography | Household | Ordinal |
| Individual ID | Pre-fieldwork | Unit of analysis | Individual | Nominal |
| Marital status | Respondent interview | Covariate – socio-demography | Individual | Nominal |
| Midweek check completion | Interviewer | Covariate - fieldwork | Household | Nominal |
| Person density | Pre-fieldwork | Covariate – socio-demography | PSU | Scalar |
| Postcode sector (adjusted) ID | Pre-fieldwork | Clustering | PSU | Nominal |
| Proxy status | Interviewer | Covariate - proxying | Individual | Nominal |
| Reminder completion | Interviewer | Covariate - fieldwork | Household | Nominal |
| Sex | Respondent interview | Covariate – socio-demography | Individual | Nominal |
| Weekly trip rate | Respondent diary | Dependent variable | Individual | Scalar |
A key limitation of the fieldwork indicators is that they were reported by interviewers. As such, the interpretation of certain indicators might vary across modes, and consequently between years. For example, what interviewers consider a ‘proxied’ or ‘assisted’ diary could, in principle, differ between digital and paper modes due to inherent differences in their design.
Practice page completion was not included as an indicator of fieldwork performance because the design and features of the practice page differed substantially between the digital and paper modes. For instance, the digital practice page contained pre-filled example data, and transferring information from the practice page into the main travel diary required respondents to manage two webpages simultaneously. In contrast, paper respondents could simply flip between pages. From 2026 onwards, respondents can repeat journeys from the practice page into the travel record, which is expected to have an inflationary effect on trip reporting.
3.5 Analytical approach
3.5.1 Research question 1: description
To address research question 1, firstly, each covariate was obtained by deriving the raw variables into ones with categorical groups.
Secondly, weighted distributions and mean trip rates were computed overall, and for 2024 and 2025 separately.
Thirdly, each variable was assessed to check whether, for each stratified category, the distribution prevalence significantly varied across 2024 and 2025 and or it had a significant bivariate association with trip rate reporting overall. Statistical significance was assumed if the 95% confidence intervals did not overlap, which provides a conservative approximation to formal hypothesis testing at the 5% significance level.
3.5.2 Research question 2: explanation
To address research question 2, a set of multivariate, multi-level linear regression models were estimated with year as the independent variable and number of trips reported as the dependent variable.
Random intercepts for PSU and household levels were included across models. In practice, it is likely that the PSU residual intraclass coefficient reflects a combination of area- and interviewer- level clustering, because interviewers were assigned work at the PSU level. A separate interviewer random effect was not incorporated, as this would have required excluding individuals belonging to interviewers that had only worked in one PSU, reducing the generalisability of the results. Given that previous analysis on the first half of 2025 found interviewer effects on trip rates to be small under comparable model specifications (ICC = 0.03), retaining the full sample was prioritised.
Conditioning was introduced progressively. Model 1 included time as the sole fixed effect, model 2 added the 14 socio-demographic characteristics, and model 3 incorporated the 7 fieldwork indicators.
Finally, interaction effects were tested between the mode of diary completion (digital or paper) and three fieldwork factors:
- checking and editing time
- proxy status
- midweek check completion
The extent to which the ‘year’ coefficient attenuated to zero with the inclusion of further controls was monitored. The closer that it got to zero, the more of the annual change explained by the predictor variables.
3.5.5 Research question 3: contribution
The estimated associations of each control variable (that is, the regression coefficient) were scaled by the corresponding change in their distribution between 2024 and 2025. This produced an aggregate, distribution-adjusted contribution for each factor.
To achieve this, firstly, each coefficient for every stratified group, was multiplied by the change in the prevalence of the relevant category across years. To illustrate the process, consider the following example. Suppose the prevalence of those aged 16 to 24 increased by 10 percentage points between 2024 and 2025 and that being in this age group was associated with a decreased trip rate of 1 trip per week then the change in prevalence of 16 to 24 years old contributed to a decrease of 0.1 trips per week between 2024 and 2025. This 0.1 trip decrease accounts for 0.1 multiplied by 100 divided by 1.2 of the overall weighted mean decrease of 1.2 trips across years.
Secondly, these scaled values were summed across categories within each factor, providing an overall contribution for that factor. To illustrate the process, continuing with the previous example, suppose that, in addition to 16 to 24 year olds contributing to a 0.1 trip decrease, 25 to 34 year olds contributed to a 0.1 trip increase, and the other age categories individually contributed to no change in trips, then the net effect of age would be -0.1 + 0.1 + 0.0 + 0.0 + 0.0 + 0.0 + 0.0 = 0.0 overall.
Control variables that had significant coefficients in the regression model and had the largest negative scaled effects were judged to be the largest contributors to the decline in trip rate across 2024 and 2025.
For completeness, contributions were also summed across all variables, and separately for variables that were statistically significant, to assess the proportion of the change in trip rate that was explained by the collective distributional change of all the variables considered in this analysis
Interaction terms were included to allow the relationship between three fieldwork processes and trip rate reporting to vary by diary mode. This decision followed the results from the initial models which assumed uniform effects and appeared to misrepresent the underlying causal structure. In the original analysis, increased checking and editing time appeared to contribute to higher trip rates in 2025 than in 2024, reflecting both its positive association with reporting and its increase over time. However, this interpretation overlooked the transition to digital diaries in 2025, where checking and editing takes longer but may be less effective at minimising under-reporting than in paper modes, as outlined in section 2.3. This implies that its effect varies meaningfully by diary mode, justifying the inclusion of an interaction. Similar interactions were tested for proxying and midweek checking, as they had the largest contributions to the change in trip rate under the initial models, but were not statistically significant and were therefore excluded from the final specification. Interactions with other variables were not considered to avoid overfitting and unstable estimates.
Section 4 Results
4.1 Summary of this chapter
The distribution of eight of the 22 tested variables changed significantly across years and were associated with trip reporting:
- checking and editing time
- diary mode
- diary placement time
- disability status
- ethnic background
- midweek check completion
- proxy status
- reminder completion
Six of these variables remained statistically significant in the regression modelling. Diary mode and placement time were not. The estimated difference in trip rates between 2024 and 2025 reduced progressively as controls were added from -1.20 (unadjusted) to -1.08 (adjusting for fieldwork quarter and clustering), -0.97 (adding socio-demographic characteristics), and -0.75 (adding fieldwork indicators and the checking-mode interaction).
Changes in the 22 variables together accounted for a 0.42 trip reduction (35% of the total decline), with proxying making by far the largest contribution (-0.40 trips). Other factors, such as disability, had smaller negative effects, while some (for example, increased midweek check completions) had small and positive effects that partly offset the overall decline across the years.
4.2 Research question 1: Description
On average, the weighted trip rate was 1.20 lower in 2025 than in 2024.
Only 8 out of 22 of the predictors had both a significant bivariate association with trip rate reporting and a significant distributional change between 2024 and 2025:
- checking and editing time
- diary mode
- diary placement time
- disability status
- ethnic background
- midweek check completion
- proxy status
- reminder completion
Table 4.1 presents the weighted distribution of all 22 tested variables, overall and separately for the 2024 and 2025 fieldwork years.
Table 4.2 presents the weighted mean trip rate for all 22 tested variables, overall and separately for the 2024 and 2025 fieldwork years.
Table 4.1: Distribution of all tested variables by fieldwork year
Base: Fully productive sample, household and individual levels, weighted by diary sample household weight
| Variable | All (%) | 2024 (%) | 2025 (%) |
|---|---|---|---|
| Age: 16 to 24 years old | 12.2 [11.6, 12.9] | 11.8 [10.8, 12.8] | 12.6 [11.7, 13.4] |
| Age: 25 to 34 years old | 16.9 [16.2, 17.7] | 17.4 [16.2, 18.6] | 16.6 [15.6, 17.6] |
| Age: 35 to 44 years old | 16.7 [16.1, 17.3] | 16.7 [15.9, 17.7] | 16.7 [15.9, 17.5] |
| Age: 45 to 54 years old | 15.6 [15.1, 16.2] | 15.5 [14.7, 16.3] | 15.8 [15.1, 16.5] |
| Age: 55 to 64 years old | 15.8 [15.3, 16.4] | 16.0 [15.2, 16.9] | 15.7 [15.0, 16.4] |
| Age: 65 to 74 years old | 11.7 [11.3, 12.1] | 11.7 [11.1, 12.4] | 11.7 [11.2, 12.3] |
| Age: 75 years old or more | 11.0 [10.5, 11.4] | 10.9 [10.3, 11.6] | 11.0 [10.5, 11.6] |
| Check-edit time: 0 to 9 minutes | 23.6 [22.1, 25.2] | 28.3 [25.8, 31.0] | 19.8 [18.0, 21.8] |
| Check-edit time: 10 to 19 minutes | 40.6 [39.2, 42.1] | 45.5 [43.1, 47.9] | 36.7 [34.9, 38.5] |
| Check-edit time: 20 to 29 minutes | 18.0 [17.0, 19.1] | 15.2 [13.7, 16.8] | 20.3 [18.9, 21.8] |
| Check-edit time: 30 minutes or more | 17.7 [16.4, 19.0] | 11.0 [9.3, 13.0] | 23.2 [21.4, 25.0] |
| Country of birth: In the UK | 77.9 [76.9, 79.0] | 78.8 [77.1, 80.4] | 77.2 [75.8, 78.6] |
| Country of birth: Outside of the UK | 22.1 [21.0, 23.1] | 21.2 [19.6, 22.9] | 22.8 [21.4, 24.2] |
| Days backdated: In the future | 56.0 [54.3, 57.7] | 58.3 [55.6, 61.0] | 54.1 [51.8, 56.3] |
| Days backdated: Same day | 18.2 [17.2, 19.1] | 17.7 [16.4, 19.1] | 18.5 [17.3, 19.8] |
| Days backdated: One day | 13.3 [12.4, 14.3] | 12.6 [11.2, 14.0] | 14.0 [12.8, 15.3] |
| Days backdated: Two days | 10.6 [9.7, 11.5] | 9.6 [8.3, 11.1] | 11.3 [10.2, 12.6] |
| Days backdated: Three days or more | 2.0 [1.6, 2.5] | 1.8 [1.3, 2.6] | 2.1 [1.6, 2.8] |
| Diary mode: Digital | 44.3 [42.3, 46.3] | 0.0 [-] | 80.4 [79.0, 81.7] |
| Diary mode: Paper | 55.7 [53.7, 57.7] | 100.0 [-] | 19.6 [18.3, 21.0] |
| Diary placement time: 0 to 9 minutes | 20.3 [18.8, 21.9] | 24.2 [21.8, 26.9] | 17.1 [15.3, 19.0] |
| Diary placement time: 10 to 19 minutes | 53.9 [52.2, 55.6] | 52.6 [50.0, 55.2] | 55.0 [52.8, 57.2] |
| Diary placement time: 20 to 29 minutes | 18.0 [16.8, 19.2] | 16.1 [14.4, 18.1] | 19.4 [17.9, 21.1] |
| Diary placement time: 30 minutes or more | 7.8 [6.9, 8.8] | 7.1 [5.8, 8.5] | 8.4 [7.2, 9.8] |
| Disability status: No LTCs | 72.4 [71.6, 73.2] | 74.1 [72.9, 75.3] | 71.0 [70.0, 72.1] |
| Disability status: LTCs + activities not limited | 8.0 [7.6, 8.4] | 7.8 [7.2, 8.5] | 8.1 [7.6, 8.6] |
| Disability status: LTCs + activities limited a bit | 10.6 [10.1, 11.0] | 9.9 [9.3, 10.5] | 11.1 [10.5, 11.7] |
| Disability status: LTCs + activities limited a lot | 9.1 [8.6, 9.5] | 8.2 [7.6, 8.8] | 9.8 [9.2, 10.4] |
| Ethnic background: Asian or Arab | 12.0 [10.9, 13.2] | 11.6 [9.8, 13.5] | 12.3 [10.9, 13.8] |
| Ethnic background: Black | 4.2 [3.8, 4.7] | 4.0 [3.4, 4.7] | 4.5 [3.9, 5.1] |
| Ethnic background: Mixed or Other | 3.1 [2.7, 3.4] | 2.9 [2.5, 3.5] | 3.2 [2.7, 3.6] |
| Ethnic background: White British | 73.2 [71.9, 74.5] | 74.8 [72.6, 76.9] | 71.9 [70.1, 73.6] |
| Ethnic background: White Other | 7.5 [7.0, 8.0] | 6.7 [6.0, 7.4] | 8.2 [7.5, 8.9] |
| Employment status: Employed | 61.1 [60.3, 61.9] | 61.6 [60.3, 62.9] | 60.7 [59.7, 61.7] |
| Employment status: Unemployed | 1.5 [1.3, 1.7] | 1.4 [1.2, 1.7] | 1.5 [1.3, 1.8] |
| Employment status: Economically inactive | 37.4 [36.6, 38.2] | 37.0 [35.7, 38.3] | 37.7 [36.7, 38.8] |
| Fieldwork quarter: First quarter | 24.2 [22.2, 26.2] | 23.6 [20.6, 26.8] | 24.7 [22.2, 27.4] |
| Fieldwork quarter: Second quarter | 24.9 [22.9, 27.0] | 24.9 [21.9, 28.2] | 24.9 [22.4, 27.6] |
| Fieldwork quarter: Third quarter | 25.4 [23.6, 27.4] | 25.5 [22.6, 28.7] | 25.4 [23.0, 28.0] |
| Fieldwork quarter: Fourth quarter | 25.5 [23.6, 27.5] | 26.0 [23.0, 29.2] | 25.1 [22.6, 27.7] |
| Government office region: North East | 4.6 [4.2, 5.1] | 4.3 [3.3, 5.6] | 4.8 [4.0, 5.8] |
| Government office region: North West | 13.2 [12.2, 14.2] | 13.6 [11.3, 16.2] | 12.8 [11.4, 14.4] |
| Government office region: Yorkshire & the Humber | 9.6 [8.9, 10.3] | 9.5 [7.8, 11.4] | 9.7 [8.4, 11.0] |
| Government office region: East Midlands | 8.4 [7.9, 9.0] | 8.4 [6.9, 10.1] | 8.4 [7.3, 9.7] |
| Government office region: West Midlands | 10.2 [9.5, 11.0] | 10.1 [8.4, 12.0] | 10.4 [9.0, 11.9] |
| Government office region: East | 11.1 [10.4, 11.8] | 10.9 [9.2, 12.8] | 11.3 [10.0, 12.7] |
| Government office region: London | 15.8 [14.9, 16.8] | 15.6 [13.5, 17.9] | 16.0 [14.3, 17.8] |
| Government office region: South East | 16.8 [16.1, 17.6] | 17.1 [15.1, 19.4] | 16.6 [15.1, 18.2] |
| Government office region: South West | 10.3 [9.7, 11.0] | 10.6 [9.0, 12.4] | 10.1 [8.9, 11.4] |
| Education*: Higher degree or postgraduate | 14.9 [14.3, 15.5] | 14.8 [13.9, 15.8] | 15.0 [14.2, 15.9] |
| Education*: First degree | 23.2 [22.5, 23.9] | 23.1 [22.0, 24.2] | 23.3 [22.4, 24.3] |
| Education*: Diploma in higher education (OE) | 9.9 [9.4, 10.3] | 10.0 [9.4, 10.6] | 9.7 [9.2, 10.3] |
| Education*: A level, AS level, NVQ level 3 (OE) | 16.9 [16.3, 17.5] | 15.9 [15.1, 16.9] | 17.6 [16.8, 18.5] |
| Education: GCSE grade A to C | 16.1 [15.5, 16.6] | 16.1 [15.3, 17.0] | 16.0 [15.3, 16.7] |
| Education*: GCSE grade D to G | 4.0 [3.7, 4.4] | 4.0 [3.5, 4.5] | 4.0 [3.6, 4.5] |
| Education*: None | 4.5 [4.3, 4.9] | 4.9 [4.4, 5.4] | 4.3 [3.9, 4.7] |
| Education*: Missing | 10.5 [9.9, 11.2] | 11.2 [10.0, 12.4] | 10.0 [9.3, 10.7] |
| Household internet access: Yes | 96.5 [96.2, 96.8] | 96.6 [96.2, 97.0] | 96.4 [95.9, 96.8] |
| Household internet access: No | 3.5 [3.2, 3.8] | 3.4 [3.0, 3.8] | 3.6 [3.2, 4.1] |
| Household size: One | 15.5 [15.0, 16.1] | 14.9 [14.1, 15.7] | 16.1 [15.3, 16.9] |
| Household size: Two | 35.2 [34.2, 36.2] | 35.6 [34.1, 37.2] | 34.9 [33.6, 36.2] |
| Household size: Three | 17.8 [17.0, 18.6] | 18.0 [16.8, 19.2] | 17.7 [16.6, 18.7] |
| Household size: Four | 19.6 [18.7, 20.5] | 19.1 [17.8, 20.5] | 19.9 [18.7, 21.2] |
| Household size: Five or more | 11.9 [10.8, 13.0] | 12.4 [10.7, 14.3] | 11.4 [10.1, 12.9] |
| Household tenure: Owns outright | 36.2 [35.2, 37.2] | 36.8 [35.3, 38.4] | 35.7 [34.3, 37.1] |
| Household tenure: Part owns with mortgage | 31.7 [30.7, 32.7] | 32.4 [30.9, 34.0] | 31.1 [29.8, 32.5] |
| Household tenure: Does not own | 32.1 [30.9, 33.3] | 30.7 [28.9, 32.6] | 33.2 [31.6, 34.8] |
| IMD: 1st quintile (most deprived) | 18.7 [17.3, 20.1] | 18.6 [16.3, 21.0] | 18.8 [17.0, 20.6] |
| IMD: 2nd quintile | 19.3 [18.1, 20.5] | 18.6 [16.8, 20.5] | 19.8 [18.3, 21.4] |
| IMD: 3rd quintile | 21.2 [20.0, 22.4] | 21.8 [20.1, 23.7] | 20.6 [19.1, 22.2] |
| IMD: 4th quintile | 21.0 [19.9, 22.2] | 20.8 [19.2, 22.6] | 21.2 [19.7, 22.7] |
| IMD: 5th quintile (least deprived) | 19.9 [18.6, 21.2] | 20.2 [18.1, 22.3] | 19.7 [18.0, 21.4] |
| Midweek check: Telephone | 58.3 [56.3, 60.2] | 48.7 [45.6, 51.7] | 66.1 [63.6, 68.5] |
| Midweek check: In person | 31.0 [29.1, 32.9] | 30.0 [27.1, 33.1] | 31.7 [29.4, 34.2] |
| Midweek check: Not completed | 10.8 [9.7, 12.0] | 21.3 [19.1, 23.8] | 2.2 [1.8, 2.7] |
| Marital status: Single and never married | 36.5 [35.7, 37.4] | 35.9 [34.6, 37.2] | 37.1 [35.9, 38.2] |
| Marital status: Married or in a CP | 49.0 [48.2, 49.9] | 49.9 [48.5, 51.2] | 48.4 [47.2, 49.5] |
| Marital status: Separated, divorced or widowed | 14.4 [14.0, 14.9] | 14.3 [13.5, 15.0] | 14.6 [13.9, 15.2] |
| Proxy status: Self-completed without assistance | 61.4 [60.2, 62.6] | 70.0 [68.0, 71.9] | 54.5 [53.1, 55.8] |
| Proxy status: Household member assistance | 7.0 [6.5, 7.6] | 5.8 [5.0, 6.6] | 8.0 [7.2, 8.9] |
| Proxy status: Household member proxy | 11.5 [10.9, 12.2] | 8.0 [7.3, 8.8] | 14.4 [13.5, 15.3] |
| Proxy status: Interviewer assistance | 5.2 [4.8, 5.8] | 2.8 [2.4, 3.4] | 7.2 [6.5, 8.0] |
| Proxy status: Interviewer proxy | 14.8 [13.7, 15.9] | 13.4 [11.6, 15.4] | 15.9 [14.6, 17.2] |
| Reminder completion: Reminder call | 51.9 [49.9, 53.8] | 49.8 [46.7, 52.9] | 53.6 [51.0, 56.1] |
| Reminder completion: Reminder card | 8.6 [7.6, 9.6] | 7.5 [6.2, 9.1] | 9.5 [8.1, 11.0] |
| Reminder completion: Not completed | 39.6 [37.6, 41.5] | 42.7 [39.6, 45.9] | 37.0 [34.5, 39.5] |
| Sex: Female | 51.4 [51.0, 51.9] | 51.5 [50.8, 52.3] | 51.4 [50.8, 52.0] |
| Sex: Male | 48.6 [48.1, 49.0] | 48.5 [47.7, 49.2] | 48.6 [48.0, 49.2] |
| Density: Less than 5 pph | 21.0 [19.3, 22.7] | 21.3 [18.7, 24.2] | 20.7 [18.5, 23.0] |
| Density: 5 to 14 pph | 16.6 [15.0, 18.3] | 15.3 [13.0, 17.9] | 17.7 [15.6, 20.1] |
| Density: 15 to 29 pph | 22.2 [20.4, 24.2] | 21.8 [19.0, 24.9] | 22.6 [20.2, 25.1] |
| Density: 30 to 59 pph | 26.2 [24.2, 28.2] | 27.8 [24.7, 31.2] | 24.8 [22.3, 27.5] |
| Density: 60 to 119 pph | 10.4 [9.0, 12.0] | 10.0 [7.8, 12.6] | 10.8 [9.0, 12.9] |
| Density: 120 or more pph | 3.6 [3.0, 4.4] | 3.8 [2.8, 5.2] | 3.5 [2.6, 4.6] |
| Year: 2024 | 44.9 [42.6, 47.2] | 100.0 [-] | 0.0 [-] |
| Year: 2025 | 55.1 [52.8, 57.4] | 0.0 [-] | 100.0 [-] |
Note: Scalar variables are stratified into categories for illustrative purposes. *‘Education’ refers to highest educational qualification, and units for a missing value were included in regression models due to the high rate of item non-response to this variable. CP = Civil Partnership. IMD = Index of Multiple Deprivation. LTC = long-term health conditions. OE = or equivalent. pph = persons per hectare. Sample size = 29,336. Statistics in parentheses are 95% confidence intervals.
Table 4.2: Mean trip rate for all tested variables by fieldwork year
Base: Fully productive sample, household and individual levels, weighted by diary sample household weight
| Variable | All | 2024 | 2025 |
|---|---|---|---|
| Age: 16 to 24 years old | 10.5 [10.1, 10.8] | 11.3 [10.7, 11.9] | 9.9 [9.5, 10.2] |
| Age: 25 to 34 years old | 12.9 [12.5, 13.3] | 13.8 [13.2, 14.4] | 12.1 [11.7, 12.6] |
| Age: 35 to 44 years old | 15.2 [14.9, 15.5] | 15.6 [15.1, 16.1] | 14.9 [14.4, 15.3] |
| Age: 45 to 54 years old | 15.2 [14.9, 15.5] | 16.0 [15.5, 16.6] | 14.5 [14.1, 15.0] |
| Age: 55 to 64 years old | 14.6 [14.3, 14.9] | 15.4 [14.9, 15.9] | 13.9 [13.6, 14.3] |
| Age: 65 to 74 years old | 13.8 [13.6, 14.1] | 14.3 [13.8, 14.7] | 13.5 [13.1, 13.9] |
| Age: 75 years old or more | 10.6 [10.4, 10.9] | 10.9 [10.5, 11.3] | 10.4 [10.1, 10.8] |
| Check-edit time: 0 to 9 minutes | 12.4 [12.1, 12.8] | 12.8 [12.3, 13.3] | 12.0 [11.6, 12.4] |
| Check-edit time: 10 to 19 minutes | 13.5 [13.3, 13.8] | 14.4 [14.1, 14.8] | 12.6 [12.3, 12.9] |
| Check-edit time: 20 to 29 minutes | 13.8 [13.4, 14.1] | 14.7 [14.1, 15.3] | 13.2 [12.8, 13.6] |
| Check-edit time: 30 minutes or more | 14.5 [14.1, 14.9] | 15.6 [14.6, 16.7] | 14.1 [13.6, 14.5] |
| Country of birth: In the UK | 14.0 [13.8, 14.2] | 14.7 [14.4, 14.9] | 13.4 [13.2, 13.6] |
| Country of birth: Outside of the UK | 11.7 [11.4, 12.0] | 12.2 [11.7, 12.7] | 11.3 [11.0, 11.7] |
| Days backdated: In the future | 14.0 [13.8, 14.2] | 14.6 [14.3, 14.9] | 13.4 [13.1, 13.7] |
| Days backdated: Same day | 13.2 [12.8, 13.5] | 13.6 [13.1, 14.1] | 12.8 [12.4, 13.2] |
| Days backdated: One day | 13.0 [12.6, 13.4] | 13.7 [12.9, 14.5] | 12.5 [12.0, 13.0] |
| Days backdated: Two days | 12.3 [11.9, 12.7] | 13.0 [12.3, 13.7] | 11.8 [11.3, 12.4] |
| Days backdated: Three days or more | 12.6 [11.8, 13.4] | 14.0 [12.5, 15.4] | 11.6 [10.8, 12.4] |
| Diary mode: Digital | 13.2 [13.0, 13.5] | [x] | 13.2 [13.0, 13.5] |
| Diary mode: Paper | 13.7 [13.5, 13.9] | 14.1 [13.9, 14.4] | 11.8 [11.4, 12.2] |
| Diary placement time: 0 to 9 minutes | 12.7 [12.3, 13.0] | 13.2 [12.7, 13.8] | 12.0 [11.6, 12.5] |
| Diary placement time: 10 to 19 minutes | 13.4 [13.2, 13.6] | 14.2 [13.9, 14.5] | 12.8 [12.5, 13.0] |
| Diary placement time: 20 to 29 minutes | 14.3 [13.9, 14.6] | 14.8 [14.2, 15.4] | 13.9 [13.5, 14.4] |
| Diary placement time: 30 minutes or more | 14.2 [13.6, 14.9] | 15.2 [14.0, 16.3] | 13.6 [12.8, 14.4] |
| Disability status: No LTCs | 14.2 [14.0, 14.3] | 14.9 [14.6, 15.2] | 13.5 [13.3, 13.7] |
| Disability status: LTCs + activities not limited | 15.0 [14.6, 15.4] | 15.4 [14.8, 16.0] | 14.6 [14.1, 15.1] |
| Disability status: LTCs + activities limited a bit | 12.3 [12.0, 12.6] | 12.4 [11.9, 12.9] | 12.2 [11.8, 12.7] |
| Disability status: LTCs + activities limited a lot | 8.2 [7.8, 8.5] | 8.0 [7.5, 8.5] | 8.3 [7.9, 8.7] |
| Ethnic background: Asian or Arab | 11.1 [10.7, 11.6] | 11.6 [10.8, 12.4] | 10.8 [10.2, 11.3] |
| Ethnic background: Black | 11.1 [10.6, 11.6] | 11.5 [10.7, 12.3] | 10.8 [10.1, 11.5] |
| Ethnic background: Mixed or Other | 11.6 [10.9, 12.3] | 12.0 [10.9, 13.1] | 11.2 [10.3, 12.1] |
| Ethnic background: White British | 14.2 [14.0, 14.3] | 14.8 [14.6, 15.1] | 13.6 [13.4, 13.8] |
| Ethnic background: White Other | 12.7 [12.3, 13.2] | 13.3 [12.5, 14.1] | 12.4 [11.8, 12.9] |
| Employment status: Employed | 14.9 [14.7, 15.1] | 15.6 [15.3, 15.9] | 14.2 [14.0, 14.5] |
| Employment status: Unemployed | 10.6 [9.6, 11.5] | 10.9 [9.4, 12.5] | 10.3 [9.2, 11.4] |
| Employment status: Economically inactive | 11.3 [11.1, 11.5] | 11.8 [11.5, 12.1] | 11.0 [10.7, 11.2] |
| Fieldwork quarter: First quarter | 13.5 [13.1, 13.8] | 14.0 [13.5, 14.5] | 13.1 [12.6, 13.5] |
| Fieldwork quarter: Second quarter | 13.6 [13.2, 14.0] | 14.7 [14.1, 15.3] | 12.7 [12.3, 13.1] |
| Fieldwork quarter: Third quarter | 13.6 [13.2, 13.9] | 14.1 [13.7, 14.6] | 13.1 [12.7, 13.5] |
| Fieldwork quarter: Fourth quarter | 13.3 [13.0, 13.6] | 13.8 [13.2, 14.3] | 12.9 [12.5, 13.3] |
| Government office region: North East | 13.7 [13.1, 14.2] | 14.6 [13.7, 15.4] | 13.0 [12.3, 13.7] |
| Government office region: North West | 14.3 [13.7, 14.8] | 14.8 [13.9, 15.7] | 13.8 [13.1, 14.5] |
| Government office region: Yorkshire & the Humber | 13.3 [12.7, 13.9] | 14.5 [13.6, 15.5] | 12.3 [11.7, 12.9] |
| Government office region: East Midlands | 14.0 [13.5, 14.6] | 14.9 [14.0, 15.8] | 13.3 [12.6, 13.9] |
| Government office region: West Midlands | 13.6 [13.1, 14.1] | 14.4 [13.6, 15.2] | 12.9 [12.3, 13.5] |
| Government office region: East | 14.3 [13.8, 14.7] | 14.5 [13.8, 15.1] | 14.1 [13.6, 14.7] |
| Government office region: London | 10.6 [10.3, 10.9] | 10.9 [10.3, 11.4] | 10.4 [9.9, 10.8] |
| Government office region: South East | 13.9 [13.6, 14.3] | 14.6 [14.0, 15.1] | 13.4 [13.0, 13.9] |
| Government office region: South West | 14.9 [14.4, 15.3] | 15.7 [15.1, 16.4] | 14.1 [13.6, 14.7] |
| Education*: Higher degree or postgraduate | 14.7 [14.3, 15.0] | 15.5 [14.9, 16.1] | 14.0 [13.6, 14.4] |
| Education*: First degree | 14.9 [14.6, 15.2] | 15.6 [15.1, 16.1] | 14.3 [13.9, 14.7] |
| Education*: Diploma in higher education (OE) | 14.6 [14.2, 14.9] | 15.3 [14.7, 15.8] | 14.0 [13.5, 14.5] |
| Education*: A level, AS level, NVQ level 3 (OE) | 14.0 [13.7, 14.3] | 14.9 [14.4, 15.4] | 13.3 [12.9, 13.7] |
| Education: GCSE grade A to C | 13.1 [12.8, 13.4] | 13.9 [13.5, 14.4] | 12.4 [12.0, 12.8] |
| Education*: GCSE grade D to G | 11.9 [11.3, 12.5] | 12.5 [11.7, 13.3] | 11.5 [10.8, 12.2] |
| Education*: None | 10.8 [10.4, 11.3] | 11.3 [10.6, 11.9] | 10.4 [9.9, 11.0] |
| Education*: Missing | 9.2 [8.9, 9.6] | 9.5 [8.9, 10.1] | 9.0 [8.6, 9.4] |
| Household internet access: Yes | 13.7 [13.5, 13.8] | 14.3 [14.1, 14.6] | 13.1 [12.9, 13.3] |
| Household internet access: No | 8.4 [7.9, 8.9] | 8.2 [7.5, 8.9] | 8.6 [7.9, 9.3] |
| Household size: One | 11.9 [11.6, 12.1] | 12.2 [11.8, 12.6] | 11.6 [11.3, 11.9] |
| Household size: Two | 13.4 [13.2, 13.6] | 14.1 [13.7, 14.4] | 12.9 [12.6, 13.2] |
| Household size: Three | 13.9 [13.5, 14.2] | 14.5 [13.9, 15.0] | 13.3 [12.9, 13.8] |
| Household size: Four | 15.1 [14.7, 15.5] | 16.3 [15.7, 16.9] | 14.2 [13.7, 14.6] |
| Household size: Five or more | 12.5 [12.0, 13.1] | 12.9 [12.1, 13.7] | 12.2 [11.5, 12.9] |
| Household tenure: Owns outright | 13.8 [13.6, 14.0] | 14.2 [13.9, 14.6] | 13.4 [13.1, 13.7] |
| Household tenure: Part owns with mortgage | 15.6 [15.3, 15.8] | 16.5 [16.1, 16.9] | 14.7 [14.4, 15.1] |
| Household tenure: Does not own | 11.1 [10.8, 11.3] | 11.5 [11.1, 11.9] | 10.8 [10.5, 11.1] |
| IMD: 1st quintile (most deprived) | 11.8 [11.5, 12.2] | 12.3 [11.7, 12.9] | 11.5 [11.0, 11.9] |
| IMD: 2nd quintile | 12.4 [12.1, 12.8] | 13.0 [12.4, 13.5] | 12.0 [11.6, 12.5] |
| IMD: 3rd quintile | 13.4 [13.1, 13.7] | 14.0 [13.5, 14.5] | 12.8 [12.4, 13.2] |
| IMD: 4th quintile | 14.4 [14.1, 14.7] | 15.2 [14.7, 15.7] | 13.7 [13.3, 14.1] |
| IMD: 5th quintile (least deprived) | 15.2 [14.9, 15.5] | 16.0 [15.5, 16.5] | 14.5 [14.1, 14.9] |
| Midweek check: Telephone | 13.8 [13.5, 14.0] | 14.5 [14.1, 14.8] | 13.3 [13.1, 13.6] |
| Midweek check: In person | 12.6 [12.3, 12.9] | 13.1 [12.6, 13.5] | 12.3 [11.9, 12.6] |
| Midweek check: Not completed | 14.5 [14.0, 15.0] | 14.9 [14.3, 15.4] | 11.8 [10.7, 12.8] |
| Marital status: Single and never married | 11.9 [11.7, 12.2] | 12.7 [12.3, 13.1] | 11.3 [11.0, 11.6] |
| Marital status: Married or in a CP | 14.9 [14.7, 15.1] | 15.4 [15.1, 15.8] | 14.4 [14.2, 14.7] |
| Marital status: Separated, divorced or widowed | 12.6 [12.3, 12.9] | 13.2 [12.8, 13.7] | 12.1 [11.7, 12.4] |
| Proxy status: Self-completed without assistance | 14.9 [14.7, 15.1] | 15.3 [15.0, 15.6] | 14.5 [14.2, 14.7] |
| Proxy status: Household member assistance | 12.2 [11.8, 12.7] | 13.1 [12.3, 13.9] | 11.7 [11.1, 12.3] |
| Proxy status: Household member proxy | 11.6 [11.3, 11.9] | 12.0 [11.4, 12.7] | 11.4 [11.0, 11.8] |
| Proxy status: Interviewer assistance | 11.8 [11.3, 12.4] | 11.3 [10.3, 12.4] | 12.0 [11.4, 12.6] |
| Proxy status: Interviewer proxy | 10.3 [9.9, 10.7] | 10.5 [9.8, 11.3] | 10.1 [9.7, 10.5] |
| Reminder completion: Reminder call | 13.3 [13.1, 13.5] | 13.6 [13.3, 14.0] | 13.1 [12.8, 13.3] |
| Reminder completion: Reminder card | 13.0 [12.4, 13.6] | 14.5 [13.5, 15.6] | 12.0 [11.3, 12.6] |
| Reminder completion: Not completed | 13.8 [13.6, 14.1] | 14.7 [14.3, 15.1] | 13.0 [12.7, 13.3] |
| Sex: Female | 13.5 [13.3, 13.7] | 14.2 [13.9, 14.5] | 12.9 [12.7, 13.2] |
| Sex: Male | 13.5 [13.3, 13.7] | 14.1 [13.8, 14.4] | 13.0 [12.7, 13.2] |
| Density: Less than 5 pph | 14.7 [14.4, 15.0] | 15.1 [14.7, 15.6] | 14.3 [13.9, 14.7] |
| Density: 5 to 14 pph | 14.4 [14.1, 14.8] | 15.3 [14.7, 15.9] | 13.8 [13.4, 14.3] |
| Density: 15 to 29 pph | 13.9 [13.6, 14.3] | 14.8 [14.2, 15.4] | 13.3 [12.9, 13.7] |
| Density: 30 to 59 pph | 12.9 [12.6, 13.2] | 13.5 [13.1, 14.0] | 12.3 [11.9, 12.7] |
| Density: 60 to 119 pph | 11.2 [10.6, 11.7] | 12.1 [11.1, 13.1] | 10.4 [9.9, 11.0] |
| Density: 120+ pph | 10.0 [9.2, 10.9] | 10.0 [8.6, 11.4] | 10.1 [9.2, 11.1] |
| Year: 2024 | 14.1 [13.9, 14.4] | 14.1 [13.9, 14.4] | [x] |
| Year: 2025 | 12.9 [12.7, 13.1] | [x] | 12.9 [12.7, 13.1] |
Note: Scalar variables are stratified into categories for illustrative purposes. *‘Education’ refers to highest educational qualification, and units for a missing value were included in regression models due to the high rate of item non-response to this variable. CP = Civil Partnership. IMD = Index of Multiple Deprivation. LTC = long-term health conditions. OE = or equivalent. pph = persons per hectare. Sample size = 29,336. Statistics in parentheses are 95% confidence intervals.
Table 4.3 cross-classifies these variables by bivariate association with trip rate reporting and the distributional change between 2024 and 2025.
Bivariate associations do not signal that there is any real, direct relationship between the predictor variable and trip rate reporting.
Table 4.3: Cross-classification of variables by bivariate association with trip rate reporting and distributional change between 2024 and 2025
| Variable | Was there a significant distributional change between 2024 and 2025? | Was there a significant bivariate association with trip rate reporting overall? |
|---|---|---|
| Checking and editing time | Yes | Yes |
| Diary mode | Yes | Yes |
| Diary placement time | Yes | Yes |
| Disability status | Yes | Yes |
| Ethnic background | Yes | Yes |
| Midweek check completion | Yes | Yes |
| Proxy status | Yes | Yes |
| Reminder completion | Yes | Yes |
| Age | No | Yes |
| Country of birth | No | Yes |
| Days backdated | No | Yes |
| Employment status | No | Yes |
| Government office region | No | Yes |
| Highest educational qualification | No | Yes |
| Household internet access | No | Yes |
| Household size | No | Yes |
| Household tenure | No | Yes |
| Index of Multiple Deprivation | No | Yes |
| Marital status | No | Yes |
| Person density | No | Yes |
| Sex | No | No |
| Fieldwork quarter | No | No |
4.3 Research question 2: Explanation
This section assesses the extent to which the difference in trip rates between 2024 and 2025 reduced once socio-demographic characteristics and fieldwork conditions were taken into account.
Across all model specifications, the estimated coefficient for 2025 remained negative and statistically significant, but attenuated towards zero as additional controls were introduced.
The descriptive analysis in section 4.1 showed that respondents reported, on average, 1.20 fewer trips in 2025 than in 2024. The regression models then assessed how far this difference remained after accounting for fieldwork quarter, socio-demographic characteristics and fieldwork conditions. In the first model, which controlled for fieldwork quarter and included random intercepts at the PSU and household levels, the 2025 trip rate was estimated to be 1.08 trips lower than in 2024.
Adding socio-demographic characteristics reduced the estimated difference slightly, from 1.08 to 0.97 fewer trips. The further inclusion of fieldwork indicators led to a larger reduction, with the estimated difference falling to 0.72 fewer trips. This indicates that socio-demographic characteristics explained a modest share of the difference between years, while fieldwork conditions accounted for a larger, additional share.
Interaction terms were then tested to assess whether three fieldwork indicators were associated with trip rates differently depending on diary mode: checking and editing time, proxying status, and midweek check completion. Only the interaction between time spent checking and editing the diary and diary mode was statistically significant. This specification was therefore treated as the final model. In this model, the estimated year effect was very similar to the previous model, with respondents in 2025 estimated to report 0.75 fewer trips than respondents in 2024.
Overall, the inclusion of socio-demographic characteristics, fieldwork conditions, and the significant interaction term reduced the estimated year effect by approximately 38% under the regression approach. This suggests that the observed variables explain a meaningful share of the lower trip rate in 2025. However, a substantial and statistically significant difference between years remains, indicating that the model does not fully account for the decline.
Table 4.4 summarises the results of the multilevel models, showing the extent to which each model explained differences in mean trip rates between years.
Table 4.4: Summary of multi-level regression models
| Model | Fixed effects | Random effects | Interaction effects | Year beta coefficient | Observed difference explained (%) |
|---|---|---|---|---|---|
| Unadjusted | Year | None | None | -1.20*** | 0.0 |
| Model 1 | + Fieldwork quarter | Household, PSU | None | -1.08*** | 10.0 |
| Model 2 | + Socio-demographic characteristics | As above | None | -0.97*** | 19.2 |
| Model 3 | + Fieldwork indicators | As above | None | -0.72*** | 40.0 |
| Model 4 | As above | As above | Checking & editing time X Diary mode | -0.75*** | 37.5 |
Note: *p < .05; **p < .01; ***p < .001
Table 4.5 provides the beta coefficients for all fixed effects and intra-class coefficients for random effects included in the models.
Table 4.5: Multi-level linear regression model, showing predictors of trip rate reporting for the combined 2024 and 2025 fieldwork years
Base: Fully productive sample, individual-level, weighted by fully productive sample weight
| Variable | Model 1: Time | Model 2: + Socio-demographic characteristics | Model 3: + Fieldwork conditions | Model 4: + Check-mode interaction |
|---|---|---|---|---|
| Year: 2024 | ref | ref | ref | ref |
| Year: 2025 | -1.08*** [-1.38, -0.77] | -0.97*** [-1.22, -0.72] | -0.72*** [-1.10, -0.35] | -0.75*** [-1.13, -0.38] |
| Fieldwork quarter: Fourth quarter | ref | ref | ref | ref |
| Fieldwork quarter: First quarter | 0.20 [-0.23, 0.63] | 0.20 [-0.17, 0.58] | 0.25 [-0.12, 0.62] | 0.25 [-0.10, 0.61] |
| Fieldwork quarter: Second quarter | 0.08 [-0.33, 0.50] | 0.17 [-0.18, 0.52] | 0.24 [-0.11, 0.59] | 0.24 [-0.11, 0.59] |
| Fieldwork quarter: Third quarter | -0.13 [-0.56, 0.30] | -0.16 [-0.52, 0.20] | -0.12 [-0.48, 0.23] | -0.10 [-0.45, 0.26] |
| Sex: Female | ref | ref | ref | ref |
| Sex: Male | [x] | -0.16 [-0.34, 0.02] | -0.05 [-0.23, 0.12] | -0.05 [-0.23, 0.12] |
| Age: 16 to 24 years old | ref | ref | ref | ref |
| Age: 25 to 34 years old | [x] | 1.77*** [1.33, 2.20] | 1.41*** [0.98, 1.84] | 1.39*** [0.96, 1.82] |
| Age: 35 to 44 years old | [x] | 3.01*** [2.56, 3.46] | 2.55*** [2.11, 3.00] | 2.55*** [2.11, 3.00] |
| Age: 45 to 54 years old | [x] | 2.94*** [2.49, 3.39] | 2.48*** [2.04, 2.93] | 2.49*** [2.03, 2.94] |
| Age: 55 to 64 years old | [x] | 3.00*** [2.53, 3.48] | 2.50*** [2.04, 2.97] | 2.50*** [2.03, 2.98] |
| Age: 65 to 74 years old | [x] | 2.98*** [2.44, 3.52] | 2.48*** [1.94, 3.01] | 2.45*** [1.92, 2.98] |
| Age: 75 years old and above | [x] | 0.81** [0.24, 1.37] | 0.52 [-0.04, 1.09] | 0.51 [-0.05, 1.07] |
| Highest educational qualification: Higher | ref | ref | ref | ref |
| Highest educational qualification: First degree | [x] | 0.01 [-0.33, 0.35] | 0.13 [-0.21, 0.46] | 0.13 [-0.21, 0.47] |
| Highest educational qualification: Diploma in higher education | [x] | -0.46* [-0.88, -0.04] | -0.21 [-0.63, 0.21] | -0.22 [-0.64, 0.21] |
| Highest educational qualification: A level, AS level, NVQ level 3 | [x] | -0.71*** [-1.10, -0.33] | -0.46* [-0.85, -0.08] | -0.47* [-0.85, -0.08] |
| Highest educational qualification: GCSE grade A* to C | [x] | -1.40*** [-1.79, -1.02] | -1.02*** [-1.41, -0.64] | -1.03*** [-1.41, -0.64] |
| Highest educational qualification: GCSE grade D to G | [x] | -1.80*** [-2.37, -1.23] | -1.31*** [-1.87, -0.74] | -1.29*** [-1.85, -0.73] |
| Highest educational qualification: None | [x] | -2.14*** [-2.64, -1.64] | -1.62*** [-2.12, -1.12] | -1.64*** [-2.15, -1.13] |
| Ethnic background: White British | ref | ref | ref | ref |
| Ethnic background: Asian or Arab | [x] | -1.60*** [-2.09, -1.10] | -1.44*** [-1.93, -0.95] | -1.45*** [-1.94, -0.97] |
| Ethnic background: Black | [x] | -0.73* [-1.32, -0.13] | -0.59* [-1.17, -0.00] | -0.62* [-1.20, -0.04] |
| Ethnic background: Mixed or Other | [x] | -0.80* [-1.56, -0.03] | -0.75 [-1.52, 0.02] | -0.74 [-1.50, 0.01] |
| Ethnic background: White Other | [x] | 0.05 [-0.47, 0.58] | 0.06 [-0.46, 0.57] | 0.03 [-0.48, 0.53] |
| Marital status: Single and never married | ref | ref | ref | ref |
| Marital status: Married or in a Civil Partnership | [x] | 1.51*** [1.20, 1.83] | 1.35*** [1.04, 1.67] | 1.34*** [1.03, 1.66] |
| Marital status: Separated, divorced or widowed | [x] | 1.27*** [0.86, 1.67] | 1.22*** [0.82, 1.61] | 1.20*** [0.81, 1.59] |
| Employment status: In employment | ref | ref | ref | ref |
| Employment status: Unemployed | [x] | -2.08*** [-2.95, -1.21] | -2.30*** [-3.16, -1.43] | -2.29*** [-3.15, -1.44] |
| Employment status: Economically inactive | [x] | -1.40*** [-1.71, -1.09] | -1.44*** [-1.75, -1.14] | -1.43*** [-1.73, -1.13] |
| Disability status: No long-term conditions | ref | ref | ref | ref |
| Disability status: LTCs + day-to-day activities not limited | [x] | 0.25 [-0.11, 0.61] | 0.10 [-0.25, 0.46] | 0.09 [-0.26, 0.44] |
| Disability status: LTCs + day-to-day activities limited a bit | [x] | -1.06*** [-1.40, -0.71] | -1.07*** [-1.41, -0.74] | -1.09*** [-1.41, -0.77] |
| Disability status: LTCs + day-to-day activities limited a lot | [x] | -4.23*** [-4.57, -3.89] | -3.89*** [-4.23, -3.56] | -3.90*** [-4.24, -3.56] |
| Country of birth: Born in the UK | ref | ref | ref | ref |
| Country of birth: Not born in the UK | [x] | -1.49*** [-1.89, -1.09] | -1.28*** [-1.67, -0.89] | -1.26*** [-1.65, -0.87] |
| Region: North East | ref | ref | ref | ref |
| Region: North West | [x] | 0.25 [-0.37, 0.86] | -0.34 [-0.99, 0.31] | -0.23 [-0.88, 0.41] |
| Region: Yorkshire & the Humber | [x] | -0.92** [-1.53, -0.31] | -1.73*** [-2.35, -1.11] | -1.65*** [-2.27, -1.02] |
| Region: East Midlands | [x] | -0.72* [-1.38, -0.05] | -1.65*** [-2.35, -0.95] | -1.51*** [-2.19, -0.84] |
| Region: West Midlands | [x] | -0.61 [-1.24, 0.01] | -1.35*** [-2.00, -0.70] | -1.21*** [-1.86, -0.57] |
| Region: East | [x] | -0.59 [-1.20, 0.02] | -1.19*** [-1.83, -0.56] | -1.05** [-1.68, -0.42] |
| Region: London | [x] | -2.88*** [-3.49, -2.26] | -3.10*** [-3.76, -2.45] | -2.94*** [-3.58, -2.30] |
| Region: South East | [x] | -1.05*** [-1.60, -0.49] | -1.75*** [-2.34, -1.15] | -1.60*** [-2.19, -1.01] |
| Region: South West | [x] | -0.08 [-0.69, 0.53] | -1.01** [-1.66, -0.35] | -0.87** [-1.51, -0.23] |
| Index of Multiple Deprivation: 1st quintile | ref | ref | ref | ref |
| Index of Multiple Deprivation: 2nd quintile | [x] | 0.16 [-0.22, 0.54] | 0.22 [-0.16, 0.59] | 0.21 [-0.17, 0.59] |
| Index of Multiple Deprivation: 3rd quintile | [x] | 0.38* [0.00, 0.77] | 0.48* [0.10, 0.86] | 0.48* [0.09, 0.87] |
| Index of Multiple Deprivation: 4th quintile | [x] | 0.73*** [0.33, 1.14] | 0.81*** [0.41, 1.21] | 0.81*** [0.40, 1.22] |
| Index of Multiple Deprivation: 5th quintile (Least deprived) | [x] | 0.94*** [0.52, 1.36] | 1.18*** [0.77, 1.60] | 1.20*** [0.77, 1.63] |
| Household size: One | ref | ref | ref | ref |
| Household size: Two | [x] | -0.18 [-0.54, 0.18] | 0.05 [-0.31, 0.41] | 0.03 [-0.33, 0.39] |
| Household size: Three | [x] | 0.59** [0.15, 1.03] | 0.94*** [0.50, 1.39] | 0.91*** [0.46, 1.36] |
| Household size: Four | [x] | 1.52*** [1.03, 2.01] | 1.90*** [1.40, 2.40] | 1.88*** [1.38, 2.37] |
| Household size: Five or more | [x] | 1.11*** [0.54, 1.68] | 1.44*** [0.87, 2.01] | 1.42*** [0.84, 2.00] |
| Household tenure: Owns outright | ref | ref | ref | ref |
| Household tenure: Part owns with mortgage or part rent | [x] | 0.19 [-0.17, 0.54] | 0.11 [-0.24, 0.46] | 0.09 [-0.25, 0.44] |
| Household tenure: Does not own | [x] | -1.23*** [-1.54, -0.91] | -1.27*** [-1.59, -0.96] | -1.26*** [-1.58, -0.94] |
| Person density per hectare: Less than 5 | ref | ref | ref | ref |
| Person density per hectare: 5 to 14 | [x] | 0.40 [-0.02, 0.82] | 0.40 [-0.01, 0.81] | 0.40 [-0.00, 0.80] |
| Person density per hectare: 15 to 29 | [x] | 0.37 [-0.04, 0.78] | 0.36 [-0.05, 0.76] | 0.33 [-0.06, 0.72] |
| Person density per hectare: 30 to 59 | [x] | -0.24 [-0.64, 0.15] | -0.14 [-0.53, 0.26] | -0.15 [-0.53, 0.24] |
| Person density per hectare: 60 to 119 | [x] | -0.47 [-1.08, 0.13] | -0.36 [-0.97, 0.25] | -0.34 [-0.92, 0.24] |
| Person density per hectare: 120 or more | [x] | -0.45 [-1.30, 0.41] | -0.57 [-1.38, 0.25] | -0.58 [-1.39, 0.23] |
| Household internet access: No | ref | ref | ref | ref |
| Household internet access: Yes | [x] | 1.69*** [1.20, 2.19] | 1.36*** [0.86, 1.86] | 1.34*** [0.83, 1.85] |
| Proxy status: Self-completed | ref | ref | ref | ref |
| Proxy status: Assistance from another household member | [x] | [x] | -2.50*** [-2.88, -2.12] | -2.51*** [-2.89, -2.13] |
| Proxy status: Proxied by another household member | [x] | [x] | -3.26*** [-3.59, -2.94] | -3.27*** [-3.60, -2.95] |
| Proxy status: Assistance from the interviewer | [x] | [x] | -1.34*** [-1.84, -0.85] | -1.34*** [-1.83, -0.84] |
| Proxy status: Proxied by the interviewer | [x] | [x] | -2.96*** [-3.31, -2.61] | -2.99*** [-3.33, -2.65] |
| Digital diary mode: Paper | ref | ref | ref | ref |
| Digital diary mode: Digital | [x] | [x] | -0.26 [-0.63, 0.10] | 0.41 [-0.14, 0.96] |
| Placement time: 0 to 9 minutes | ref | ref | ref | ref |
| Placement time: 10 to 19 minutes | [x] | [x] | -0.22 [-0.54, 0.10] | -0.21 [-0.52, 0.11] |
| Placement time: 20 to 29 minutes | [x] | [x] | 0.31 [-0.13, 0.75] | 0.31 [-0.11, 0.73] |
| Placement time: 30 minutes or more | [x] | [x] | 0.41 [-0.14, 0.97] | 0.40 [-0.16, 0.96] |
| Reminder completion: Reminder call | ref | ref | ref | ref |
| Reminder completion: Reminder card | [x] | [x] | -0.37 [-0.81, 0.07] | -0.43 [-0.88, 0.02] |
| Reminder completion: No reminder call or card | [x] | [x] | 0.57*** [0.29, 0.85] | 0.57*** [0.29, 0.84] |
| Midweek check completion: By telephone | ref | ref | ref | ref |
| Midweek check completion: In person | [x] | [x] | -0.44** [-0.72, -0.17] | -0.43** [-0.71, -0.16] |
| Midweek check completion: Not completed | [x] | [x] | -0.71** [-1.15, -0.27] | -0.77*** [-1.21, -0.34] |
| Checking & editing time: 0 to 9 minutes | ref | ref | ref | ref |
| Checking & editing time: 10 to 19 minutes | [x] | [x] | 0.67*** [0.35, 1.00] | 1.03*** [0.63, 1.42] |
| Checking & editing time: 20 to 29 minutes | [x] | [x] | 1.02*** [0.61, 1.44] | 1.19*** [0.64, 1.74] |
| Checking & editing time: 30 minutes or more | [x] | [x] | 2.16*** [1.70, 2.61] | 2.83*** [2.20, 3.46] |
| Backdating: In the future | ref | ref | ref | ref |
| Backdating: Same day | [x] | [x] | -0.35* [-0.64, -0.06] | -0.36* [-0.66, -0.06] |
| Backdating: 1 day | [x] | [x] | -0.33 [-0.68, 0.02] | -0.36* [-0.71, -0.01] |
| Backdating: 2 days | [x] | [x] | -1.01*** [-1.39, -0.63] | -1.01*** [-1.39, -0.63] |
| Backdating: 3 days+ | [x] | [x] | -0.77 [-1.58, 0.04] | -0.74 [-1.53, 0.06] |
| Checking & editing time × Digital diary mode: Paper - 0 to 9 minutes | ref | ref | ref | ref |
| Checking & editing time × Digital diary mode: Digital × 10 to 19 minutes | [x] | [x] | [x] | -0.95** [-1.54, -0.35] |
| Checking & editing time × Digital diary mode: Digital × 20 to 29 minutes | [x] | [x] | [x] | -0.41 [-1.14, 0.32] |
| Checking & editing time × Digital diary mode: Digital × 30 minutes or more | [x] | [x] | [x] | -1.24** [-2.02, -0.46] |
Note: *p < .05; **p < .01; ***p < .001. Units with missing ‘highest educational qualification’ values were included in the model under a separate reference category due to high item non-response. For the final model, the coefficients for ‘checking and editing time’ should be interpreted for paper only. An additional adjustment is applied for digital in the ‘Checking & editing time X Digital diary mode’ row. Statistics in parentheses are 95% confidence intervals of beta coefficients. Sample size = 29,336.
Table 4.6 displays the intra-class correlation coefficients for the PSU and household random effects across the model specifications. In practice, the PSU intraclass correlation coefficient is likely to represent a mixture of interviewer and PSU variance because interviewers were assigned work at the PSU level.
Table 4.6: Intra-class correlation coefficients (ICC) for random effects across model specifications
| Level | Model 1: Time | Model 2: + Socio-demographic characteristics | Model 3: + Fieldwork conditions | Model 4: + Check-mode interaction |
|---|---|---|---|---|
| PSU | 0.06 [0.05, 0.07] | 0.02 [0.01, 0.03] | 0.02 [0.01, 0.02] | 0.03 [0.02, 0.04] |
| Household | 0.39 [0.37, 0.42] | 0.36 [0.34, 0.38] | 0.37 [0.34, 0.39] | 0.37 [0.34, 0.39] |
*Note: Statistics in parentheses are 95% confidence intervals of intra-class coefficients.
4.4 Research question 3: Contribution
4.4.1 Summary of the approach
In order to assess the relative contribution of each factor to the overall change in weighted trip rates between 2024 and 2025, two pieces of information were combined:
- the estimated association in the multivariate regression model
- the change in prevalence between 2024 and 2025
This produced a distribution-adjusted estimate of each group’s contribution to the overall average decrease of 1.2 trips between 2024 and 2025. Under this approach, the largest contributors to the observed change are those that were strongly associated with trip rate reporting and were more prevalent in 2025 than in 2024.
To illustrate this process, consider the variable age. Firstly, each age group’s regression coefficient (which estimates its effect on trip reporting) was multiplied (scaled) by the change in its prevalence between 2024 and 2025. Secondly, these category-level contributions were then summed to provide an aggregate contribution of each variable.
Table 4.7 illustrates this process for age. Because increases and decreases in each category offset each other, the total contribution of age on the lower trip rate is negligible overall (-0.01 trips).
Table 4.7: Calculation of estimated change in average trip rate from 2024 to 2025 attributed to a multi-category variable
| Age group | Regression coefficient | Weighted prevalence (2024) | Weighted prevalence (2025) | Change (pp) | Scaled change (in average number of trips) |
|---|---|---|---|---|---|
| 16 to 24 | 0 | 11.8% | 12.6% | 0.794 | 0.000 |
| 25 to 34 | 1.39*** | 17.4% | 16.6% | -0.793 | -0.011 |
| 35 to 44 | 2.56*** | 16.7% | 16.7% | -0.035 | -0.001 |
| 45 to 54 | 2.49*** | 15.5% | 15.8% | 0.252 | 0.006 |
| 55 to 64 | 2.5*** | 16.0% | 15.7% | -0.349 | -0.009 |
| 65 to 74 | 2.45*** | 11.7% | 11.7% | 0.016 | 0.000 |
| 75 or over | 0.509 | 10.9% | 11.0% | 0.115 | 0.001 |
| Total expected change in average trip rate due to age | [x] | [x] | [x] | [x] | -0.01 |
Note: [x] = Not applicable. ^ Note: *p < .05; **p < .01; ***p < .001
4.4.2 Findings
Overall, when considering all 22 variables, the summed contributions represented a decrease of 0.42 trips on average between 2024 and 2025. This means that taking into account both the direction of each effect (whether it increases or decreases trip rates) and the changes in their prevalence between years, the combined contribution of these variables was a net reduction of around 0.42 trips per person.
This accounts for 35% of the total decrease in average trip rate (of 1.20 fewer trips in 2025), indicating that a meaningful share of the explained variation was driven by changes in the prevalence of the predictors considered in this model. However, the majority of the observed fall of 1.2 trips remains unexplained.
Proxy status made the largest contribution to the decline in trip rates between years. By itself, the change in the distribution of this variable predicted a decrease in the average trip rate of 0.4 trips, accounting for 33% of the total decrease in trip rate across years.
Other variables contributed more modestly to the decline in trip rates. The two other most important factors, once taking into account changes in their distribution between 2024 and 2025, were disability (accounting for 6% of the fall in trip rates in 2025) and changes in reminder completion (accounting for a further 3%).
Some variables that had a positive effect on trip reporting and became more common between 2024 and 2025 predicted an increase in the average trip rate, rather than a fall. For example, increased prevalence of midweek checks was associated with an increase in trip rates of 0.14 trips between 2024 and 2025. Because some variables offered a positive contribution, when the total effect across all variables was summed, although the analysis predicted an overall decrease in the average trip rate, the decrease is smaller than might be expected when looking at each variable in isolation. For example, the share of the decrease in trip rates explained by proxying is 33%, very close to the 35% explained by all variables.
A summary of the results is presented in Table 4.8, which shows first the observed change in trip rate between 2024 and 2025, followed by the predicted change in average trip rate associated with different variables given the change in their prevalence between years.
Table 4.8: Decomposition of the change in average trip rate between 2024 and 2025 into explained and unexplained components
| Component | Change in mean trip rate (2025 vs 2024) |
|---|---|
| Year effect (unexplained) | -0.75 (62%) |
| Explained effect | -0.42 (35%) |
| Approximation residual | -0.04 (3%) |
| Raw difference | -1.20 (100%) |
Note: The approximation residual is the difference between the observed change in trip rates between years and the change that the model could either attribute to the explained differences or the unexplained year effect. The residual exists because the scaling approach made some assumptions, such as independence of effects and not fully accounting for covariance. However, an approximation residual of 3%, which represents less than 0.04 trips, is considered acceptable relative to the overall explanatory share that could be identified.
The interaction effect between diary mode and checking and editing time collectively contributed to a small increase in trip rate of 0.06 trips between 2024 and 2025. The estimated contribution of 0.06 trips reflects the combined effect of diary mode (+0.33), checking and editing time (+0.32), and their interaction (-0.59), taking into account changes in the distribution of both variables between 2024 and 2025.
Prior to including an interaction effect in the regression model, changes in how much time was spent on diary checking and editing appeared to have driven a meaningful increase in recorded trip rates between 2024 and 2025. Spending more time picking up and checking the diary is associated with a higher trip rate, as trips that otherwise might be missed are identified and correctly recorded by interviewers, between 2024 and 2025 more time was spent on this process, collectively predicting a 0.26 increase in the average trip rate. However, this was not expected to have a uniform effect across digital and paper diaries due to previous findings, justifying the inclusion of an interaction effect, as outlined in section 3.5.3.
Table 4.9 presents a summary of findings for all three research questions for each tested variable.
Table 4.9: Summary of findings from RQ1, RQ2 and RQ3
| Variable | RQ1: Did the distribution significantly change between 2024 and 2025 AND was there a significant bivariate association with trip rate reporting? | RQ2: Was there a significant residual association with trip rate reporting? | RQ3: What was the scaled contribution of the residual association on trip rate reporting? |
|---|---|---|---|
| Age | No | [x] | -0.01 |
| Checking and editing time | Yes | Yes | 0.32 |
| Diary mode | Yes | No | 0.33 |
| Checking & editing time X Diary mode interaction | [x] | Yes | -0.59 |
| Country of birth | No | [x] | -0.02 |
| Days backdated | No | [x] | -0.03 |
| Diary placement time | Yes | No | 0.01 |
| Disability status | Yes | Yes | -0.07 |
| Fieldwork quarter | No | [x] | 0.00 |
| Ethnic background | Yes | Yes | -0.01 |
| Employment status | No | [x] | -0.01 |
| Government office region | No | [x] | -0.01 |
| Highest educational qualification | No | [x] | 0.03 |
| Household internet access | No | [x] | 0.00 |
| Household size | No | [x] | 0.00 |
| Household tenure | No | [x] | -0.03 |
| Index of multiple deprivation | No | [x] | -0.01 |
| Midweek check | Yes | Yes | 0.14 |
| Marital status | No | [x] | -0.02 |
| Person density | No | [x] | 0.02 |
| Proxy status | Yes | Yes | -0.40 |
| Reminder completion | Yes | Yes | -0.04 |
| Sex | No | [x] | 0.00 |
Note: The estimated contribution of diary mode should be interpreted cautiously because the distribution of mode changed dramatically between 2024 (0% digital) and 2025 (80% digital). For research question 1, [x] denotes that descriptive finding was not explored. For research question 2, [x] denotes that the variable did not meet the RQ1 criteria (significant distributional change and significant bivariate association) and was therefore not considered further in this summary table.
Section 5 Discussion
5.1 Summary of this chapter
This report finds that, although the weekly trip rate estimate was notably lower in 2025 than in 2024, respondents did not report a different number of trips across the two diary modes when controlling for fieldwork quarter, 14 socio-demographic characteristics and seven fieldwork indicators.
These indicators, which served as proxies for measurement, processing and non-response errors, explained around 35% of the reduction in reported trip rates between the years.
Increased diary proxying emerged as the largest observable contributor, accounting for approximately 33% of the overall decline.
Disability status was the only other factor making a notable negative contribution (greater than 5%). Other tested factors had positive or negative effects that were below 5%.
The remaining 65% of the difference remained unexplained. This is likely to reflect a product of:
- additional unobserved sources of measurement, processing and non-response error
- natural year-on-year variation in trip rate estimates
- other unidentified contributors associated with the transition to the digital-first approach
5.2 Main reflections
This report extends previous internal research investigating why NTS estimates were lower in 2025 following the introduction of the digital-first approach. The previous analysis from the first half of 2025 found no evidence of a systematic difference between diary modes in the likelihood of reporting a trip rate below the mean in the first half of 2024, once key socio-demographic characteristics, fieldwork indicators, and interviewer, PSU and household effects had been controlled for. This suggested that the decline in the overall trip rate between 2024 and 2025 was unlikely to be driven by greater under-reporting among those using the digital diary.
At the same time, the previous analysis found that a range of socio-demographic characteristics and fieldwork conditions, such as proxying, were highly predictive of trip rate reporting. Building on this finding, the current analysis examined the extent to which those characteristics explained the reduction in reported trip rates between 2024 and 2025. Together, the tested factors accounted for around 35% of the observed decline, with increased diary proxying emerging as the largest observable contributor.
Most (65%) of the year-on-year difference remains unexplained. This suggests that relevant mechanisms are unmeasured or only partially captured by the available indicators. The unexplained portion is likely to reflect a combination of:
-
other sources of measurement, processing and non-response error that could not be directly observed
-
natural year-on-year variation in trip rate estimates
-
other unidentified contributors associated with the transition to the digital-first approach
5.3 Measurement error
The findings provide further evidence that the digital diary instrument itself does not reduce the number of trips recorded by respondents, relative to the paper diary. The previous internal analysis found no meaningful difference in trip reporting between digital and paper diaries, and the results presented here are consistent with that conclusion. Instead, the evidence increasingly suggests that the digital-first approach affects measurement indirectly through changes in how diaries are completed.
There is now strong evidence to suggest that the digital-first approach affects measurement indirectly through increased diary proxying. This report found that, given proxying’s large and negative effect on trip reporting, the decline in self-completion alone accounted for 33% of the fall in trip rate in 2025.
Some increase in diary proxying might be expected given broader challenges facing social surveys, including declining response rates and increasing pressures on respondents (Office for Statistics Regulation, 2025). However, both the timing and scale of the increase in diary proxying suggest that the digital-first approach may be amplifying this behaviour beyond what would be expected from wider survey trends alone. This interpretation is strengthened by the fact that diary self-completion rates declined markedly following the introduction of the digital-first approach, whereas self-completion rates for the interview component remained comparatively stable.
These findings reinforce the importance of reducing proxy completion within the digital-first design. A range of options are currently being explored, such as wording changes to how proxying is framed or reducing prominence during set-up, as well as amending the login model to reduce the number of e-mails required for household members to self-complete. This represents a sensible first step and potential impacts of adjustments should be closely monitored in future fieldwork years.
Other approaches could also be explored. For example, respondents could be offered greater flexibility in choosing their preferred diary mode, or aspects of the fieldwork sequence could be redesigned to encourage direct respondent engagement. However, further evidence would be required before such changes could be justified.
A further option would be to explore post hoc statistical adjustments for proxy-completed diaries. However, improvements at the point of data collection are likely to be preferable. Any adjustment strategy would represent a substantial methodological change to the survey and would need to be carefully evaluated given the implications for trend measurement, comparability and interpretation.
5.4 Processing error
The analysis found that longer interviewer checking and editing times were associated with higher reported trip rates. However, this relationship differed between digital and paper diaries, with additional checking and editing time appearing to have a weaker association with trip reporting in the digital environment. This suggests that the relationship between interviewer checking activity and diary quality may differ across modes.
This finding is consistent with ongoing interviewer feedback indicating that checking and editing digital diaries can be more burdensome than equivalent processes for paper diaries. Consequently, improving the usability and efficiency of the interviewer checking and editing dashboard should remain a priority for future development work. The digital platform may also create opportunities to prevent common respondent errors through automated checks and prompts, reducing the need for interviewer intervention later in the diary process.
Despite these findings, the available evidence relating to processing error remains considerably weaker than the evidence relating to proxying. The analysis cannot determine the extent to which differences in interviewer processing contributed to the decline in trip rates, and further work is required to better understand how checking and editing practices vary across diary modes. A sub-project comparing interviewer editing practices within the digital and paper diaries is ongoing and should provide valuable evidence in this area.
Beyond the interviewer stage, there is currently insufficient evidence to determine whether Data Operations processes differ meaningfully between the two approaches or whether any such differences affect final trip rate estimates. Once entered into the Diary Entry System, data are processed using the same downstream procedures regardless of collection mode, and there is currently no evidence to suggest that Data Operations processes are a major contributor to the lower trip rate observed in 2025. Nevertheless, this remains an evidence gap that could be explored further through targeted qualitative research with data operators.
5.5 Non-response error
Disability status was the only socio-demographic characteristic to make a notable negative contribution towards the reduction in trip rate across years. In 2025, a greater proportion of respondents reported that their day-to-day activities were limited a lot. These respondents have a substantially lower trip rate than other respondents, and so the change in distribution contributed to a lower overall estimate. If this pattern persists in future years, the next weighting review could consider incorporating disability status into the weighting calibration and assess the availability of suitable population estimates.
More broadly, the socio-demographic variables included in this analysis do not provide a complete picture of survey representativeness. Characteristics such as perceived financial wellbeing, social isolation, confidence using digital technologies, and concerns about personal safety may also influence both survey participation and travel behaviour. These factors are not routinely captured within the NTS and therefore could not be examined directly. As a result, changes in the distribution of such characteristics remain a plausible explanation for part of the remaining unexplained difference between 2024 and 2025.
5.6 Conclusions
Overall, the findings provide further evidence that the lower trip rate observed in 2025 was not principally a consequence of the digital diary instrument itself. Rather, increased diary proxying appears to be the largest observable contributor to the decline, highlighting a clear priority for future survey development. Although a substantial proportion of the year-on-year difference remains unexplained, this analysis represents an important step towards understanding the impact of the digital-first transition and identifying opportunities to improve data quality in future fieldwork years.