National Travel Survey: Digital Diary Parallel Run
Updated 10 September 2026

© Crown copyright 2026
This publication is licensed under the terms of the Open Government Licence v3.0 except where otherwise stated. To view this licence, visit nationalarchives.gov.uk/doc/open-government-licence/version/3 or write to the Information Policy Team, The National Archives, Kew, London TW9 4DU, or email: psi@nationalarchives.gov.uk.
Where we have identified any third party copyright information you will need to obtain permission from the copyright holders concerned.
This publication is available at https://www.gov.uk/government/publications/future-developments-for-the-nts/national-travel-survey-digital-diary-parallel-run
Authors:
- Zac Marco Perera
- Eva Aizpurua
- Mie Astrup Jensen
from the National Centre for Social Research
1. Executive summary
This report presents findings from the National Travel Survey (NTS) Digital Diary Parallel Run, a large-scale field experiment conducted in the first fieldwork quarter of 2024. The experiment assessed the impact of introducing a new, digital-first approach into the NTS with regards to:
- response rates
- digital uptake
- proxying
- sample composition
- substantive trip estimates
- fieldwork procedures
- processing procedures, such as weighting and imputation
In the treatment group, respondents were exposed to the digital-first approach, meaning they were offered a digital diary as the primary mode of completion, with a paper option available if they were unable or unwilling to complete the diary digitally. The control group, drawn from the concurrent mainstage NTS, only received the option of completing on paper.
Data from wave 10 of the National Travel Attitudes Study (NTAS) was also triangulated with the results of the parallel run to provide additional evidence on diary mode preferences.
1.1 Headline summary of findings
The digital-first approach did not substantially impact response rates, fieldwork performance, or processing procedures such as weighting and imputation.
Most substantive trip estimates were largely unaffected by the digital-first approach, although the prevalence of certain trips, such as those below 1 mile, was lower on the digital diary.
Digital diary uptake was relatively high, but lower than anticipated based on pilot findings and was potentially influenced by the interviewer.
The introduction of the digital-first approach increased proxying rates, which had a negative effect on data quality.
Certain socio-demographic factors were systematically related to digital uptake (such as age and ethnicity) and proxying rates (such as sex, disability, and education).
1.2 Response rates
Nationally, response rates were comparable between the experimental groups. The fully productive rate was 26% for the treatment group and 28% for the control group, with the partially productive rate at 6% for both groups.
In London, where NTS response rates have historically been lower than the rest of England, the fully productive rate was lower for the treatment group (14%) compared to the control group (23%). The sub-sample for London, however, was relatively small, meaning this difference should be interpreted with caution. The partially productive rate was broadly comparable, at 5% for the treatment group and 7% for the control group.
The fully productive rate is the unweighted proportion of households where everybody completed an interview and returned a diary, out of those assumed to be eligible. The partially productive rate is the unweighted proportion of households where at least one household member completed an interview and/or returned a diary, out of those assumed to be eligible.
1.3 Digital uptake
Digital diary uptake was relatively high but fell short of expectations based on previous results from the pilot. Among fully productive households exposed to the digital-first approach, 62% completed diaries digitally whilst 38% used the paper backup. At the individual-level, the distribution was similar. Approximately 2 in 3 (66%) diaries were completed digitally, with the remainder (34%) completing on paper.
The proportion of households completing digital versus paper diaries varied considerably across interviewers in the digital-first group. Around one third of interviewers’ households completed in one mode only.
For households that were exposed to the digital-first approach but opted not to complete online, the most common barriers included perceptions that the digital diary would be too difficult to use (42%) and a lack of confidence using technology (39%).
1.4 Proxying
The digital-first approach led to an increase in proxying. Respondents aged 11 and over were less likely to complete diaries by themselves in the treatment group (56%) compared to the control group (70%). Similarly, among the treatment group, individuals aged 11 and over were less likely to complete their own diary when using a digital diary (51%) than when using a paper diary (64%).
Proxying had a negative effect on data quality, as it was associated with lower trip rates across both groups. For example, the weighted average trip rate was 6 trips higher per week for individuals completing their own diaries compared to those being proxied, within the digital-first group.
Certain socio-demographic factors influenced the likelihood of being proxied. Proxying rates were higher among males, individuals with disabilities, and those with lower educational qualifications. Young adults and those aged 80 and above also had elevated rates of being proxied.
1.5 Sample composition
The digital-first approach did not substantially impact the representativeness of the NTS sample. The treatment group closely matched the control group with respect to household tenure, household size, age, sex, employment status, disability status, and marital status. Whilst the treatment group was slightly less representative with respect to ethnic background and deprivation, it was slightly more representative in terms of education. Urbanicity was the only socio-demographic characteristic with substantial differences in representativeness between the groups, with the control group showing better alignment with the population.
Although sex, education, and disability status did not affect respondents’ likelihood of completing digitally, other socio-demographic factors were predictive of digital uptake. Younger respondents, aged 16 to 25, had almost 4 times the odds of completing digitally compared to those aged 60 to 69. White respondents had around 3 times the odds of completing digitally than respondents from other ethnic groups. Additionally, single, never-married individuals had about half the odds of completing digitally compared to those who were married or in a civil partnership.
1.6 Substantive trip estimates
The unweighted average number of trips per week was similar between the treatment group (M = 13.3) and the control group (M = 13.6). Day 1 trip rates were also comparable (M = 2.4 and M = 2.5 respectively), while the mean unweighted day 7 trip rate was 1.7 in both groups. The proportion reporting no travel (4%) and the tendency to round distances (75%) were also consistent across groups.
Weighted estimates for trip purposes, trip distances, travel mode, and number of stages per journey were broadly comparable. However, for certain categories, differences were notable and should be monitored when the digital-first approach is launched at scale.
A slightly lower proportion of walking stages were less than 1 mile for those in the treatment (21%) compared to the control (25%), suggesting that the digital-first approach may reduce respondents’ propensity to report short walks.
1.7 Fieldwork procedures
Fieldwork performance was largely consistent across the experimental groups, with no significant differences in the average number of calls made (M = 4 for both groups), time taken to set up travel diaries (treatment M = 14 minutes, control M = 13 minutes), prevalence of midweek checks (treatment = 78%, control = 77%) or administration of the memory jogger (treatment = 43%, control = 44%).
However, the digital-first approach impacted some fieldwork procedures. Even after controlling for household size, checking and editing diaries took over three minutes longer for paper diaries in the treatment group on average. Additionally, practice page usage was lower for digital cases (71%) compared to paper ones (87%) within the treatment group.
Among households willing to complete digitally, respondents’ devices were used for digital diary set-up in about a quarter (23%) of cases, and technical difficulties related to the digital system or a National Centre for Social Research (NatCen) device were reported in 11% of cases. Interviewers generally regarded the digital diary system easy to use (70%), with only a small minority of cases being described as difficult (16%).
1.8 Weighting
The weighting efficiencies of the key NTS weights were broadly comparable between digital and paper diaries, with some weights showing slightly higher efficiency for digital diaries.
1.9 Imputation
Imputation rates were similar across the experimental groups. Of the 49 variables eligible for imputation, 37 showed no significant differences between the groups. For variables with significant differences, the mode effect was very small, and the statistical significance was largely attributed to large sample sizes of more granular units, such as stages.
1.10 Mode preference
Web surveys were the preferred mode of administration for most NTAS respondents. However, there was also substantial interest in newer data collection technologies, such as passive data collection via smartphone applications.
Few socio-demographic characteristics predicted mode preference. However, older respondents and females were less likely to prefer online modes over paper. The diversity of activities performed on smartphones was also a stronger predictor of preference for online modes than the frequency of smartphone use.
2. Background
This report presents findings from the NTS Digital Diary Parallel Run.
The NTS is a well-established, probability-based household survey that serves as the primary source of information about personal travel in England for the DfT. The study consists of two main components:
- a face-to-face interview (with a telephone option as backup), conducted with all household members
- a travel diary, where household members record their journeys over a seven-day period
Since its inception in 1965, the travel diary has been administered via a paper format. Large-scale social surveys are increasingly shifting to mixed-mode designs to accommodate technological advances, reduce logistical and environmental costs, and increase participation. Starting in 2025, the NTS will follow suit and adopt a digital-first approach, offering respondents a digital diary as the primary mode of completion. A paper back-up will still be available for those who are unable or unwilling to use the digital format.
Figure 2.1 provides the example page of the paper diary, demonstrating how it is structured.
Figure 2.1: Example page of the NTS paper diary
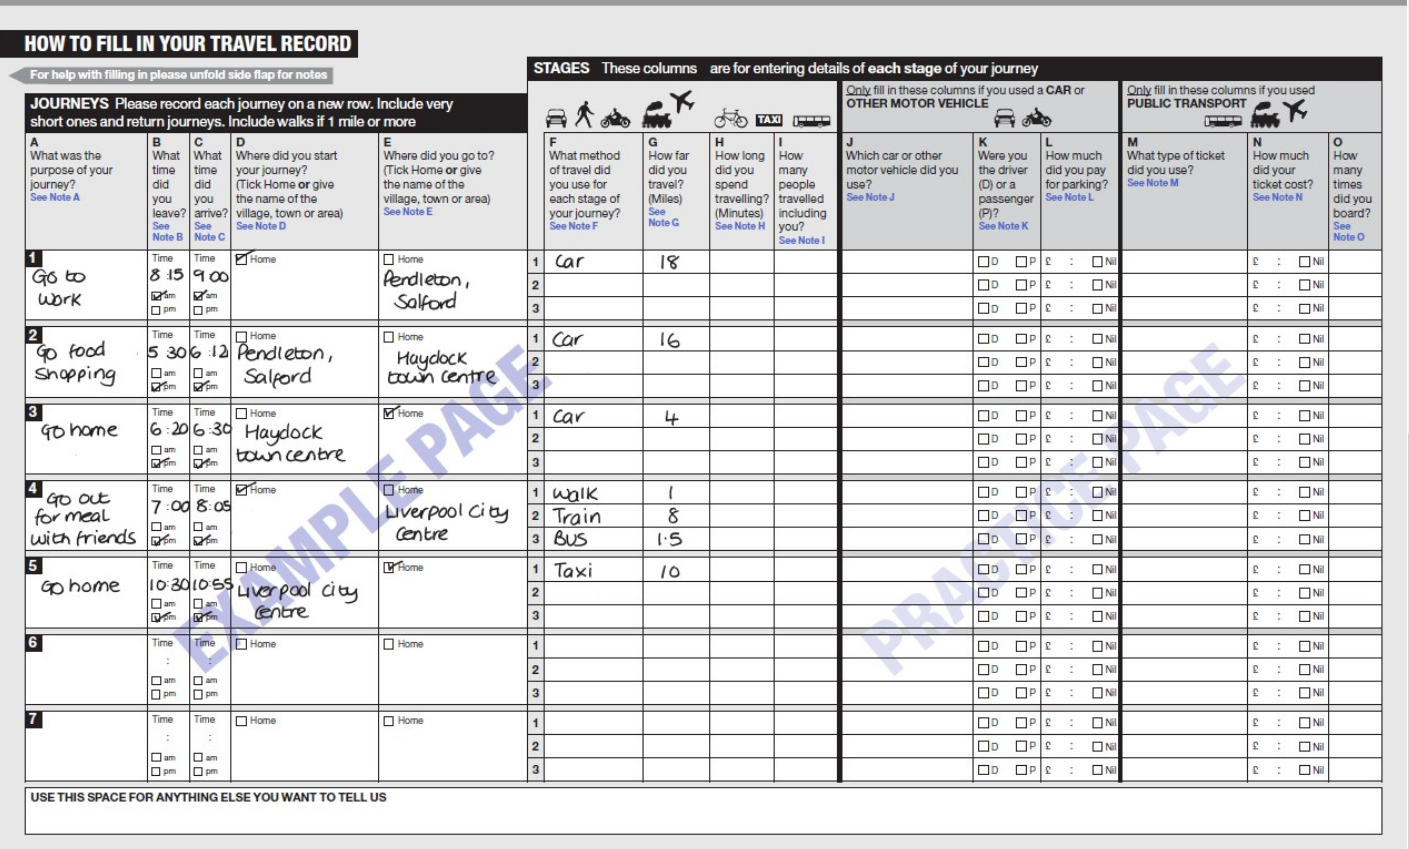
Figure 2.1 shows an example page from the NTS paper travel diary. The page contains seven rows for the respondent to fill in journeys on a given day. For each journey, they record information pertaining to journey purpose (column A), leaving time (column B), arrival time (column C), start location (column D), end location (column E), travel method (such as car, walk or bus, column F), distance travelled (column G), time spent travelling (column H) and number of people travelling (column I). The following further information is only recorded if a car or motor vehicle is used: which car or motor vehicle was used (column J), whether the respondent was the driver or a passenger (column K) and parking costs (column L). The following further information is only recorded if public transport is used: ticket type (column M), ticket price (column N) and number of times boarding specific during each stage (column O). In the example page, multiple journeys are exemplified. For example, for the first row: Column A = “Go to work”, B = “8:15 am”, C = “9:00am”, D = “Home”, E = “Pendleton, Salford”, F1 = “car” and G1 = “18”.
To assess feasibility, the digital diary underwent a series of testing phases between 2018 and 2023. During the discovery (Digital diary discovery report, 2018) and alpha (Digital diary alpha report, 2020) phases, a minimum viable product of the digital diary was developed and tested with interviewers. Feedback from this testing informed further refinements during the beta phase (Digital diary beta report, 2021). In this phase, the diary was tested with a small number of respondents who had previously used the paper version of the diary. After further adjustments based on both interviewer and respondent feedback, the digital diary passed its Government Digital Standards assessment, confirming that it met technical requirements, fulfilled its technical brief, and handled data securely. A small-scale pilot was then conducted in late 2022, using a purposive sample of 100 addresses. Additional adjustments were made based on findings from this pilot.
To then evaluate the impact of the digital-first approach on key trip estimates and fieldwork and processing procedures, a Parallel Run was proposed. In this randomised field experiment, the treatment group was exposed to the digital-first approach, replicating how the NTS might operate in the future. The traditional, paper-only approach ran concurrently and formed the control group.
2.1 Overview of the NTS Digital Diary Parallel Run
The NTS Digital Diary Parallel Run was a large-scale, quantitative field experiment conducted in the first quarter of 2024. The samples for the treatment and control groups were independently drawn using a two-stage stratified design (see chapter 3.2). The treatment group consisted of 2,178 issued households, and the control group consisted of 6,402 issued households.
The treatment group was exposed to the digital-first approach, where respondents were invited to complete a digital travel diary, with a paper option available for those who were unable or unwilling to complete the diary digitally. Respondents were classified as compliant if they completed the digital diary, and non-compliant if they opted for the paper backup. The control group was formed by respondents to the mainstage 2024 NTS, which ran simultaneously and followed the conventional, paper-only approach.
Figure 2.2: Summary of the fieldwork sequence for the experimental groups
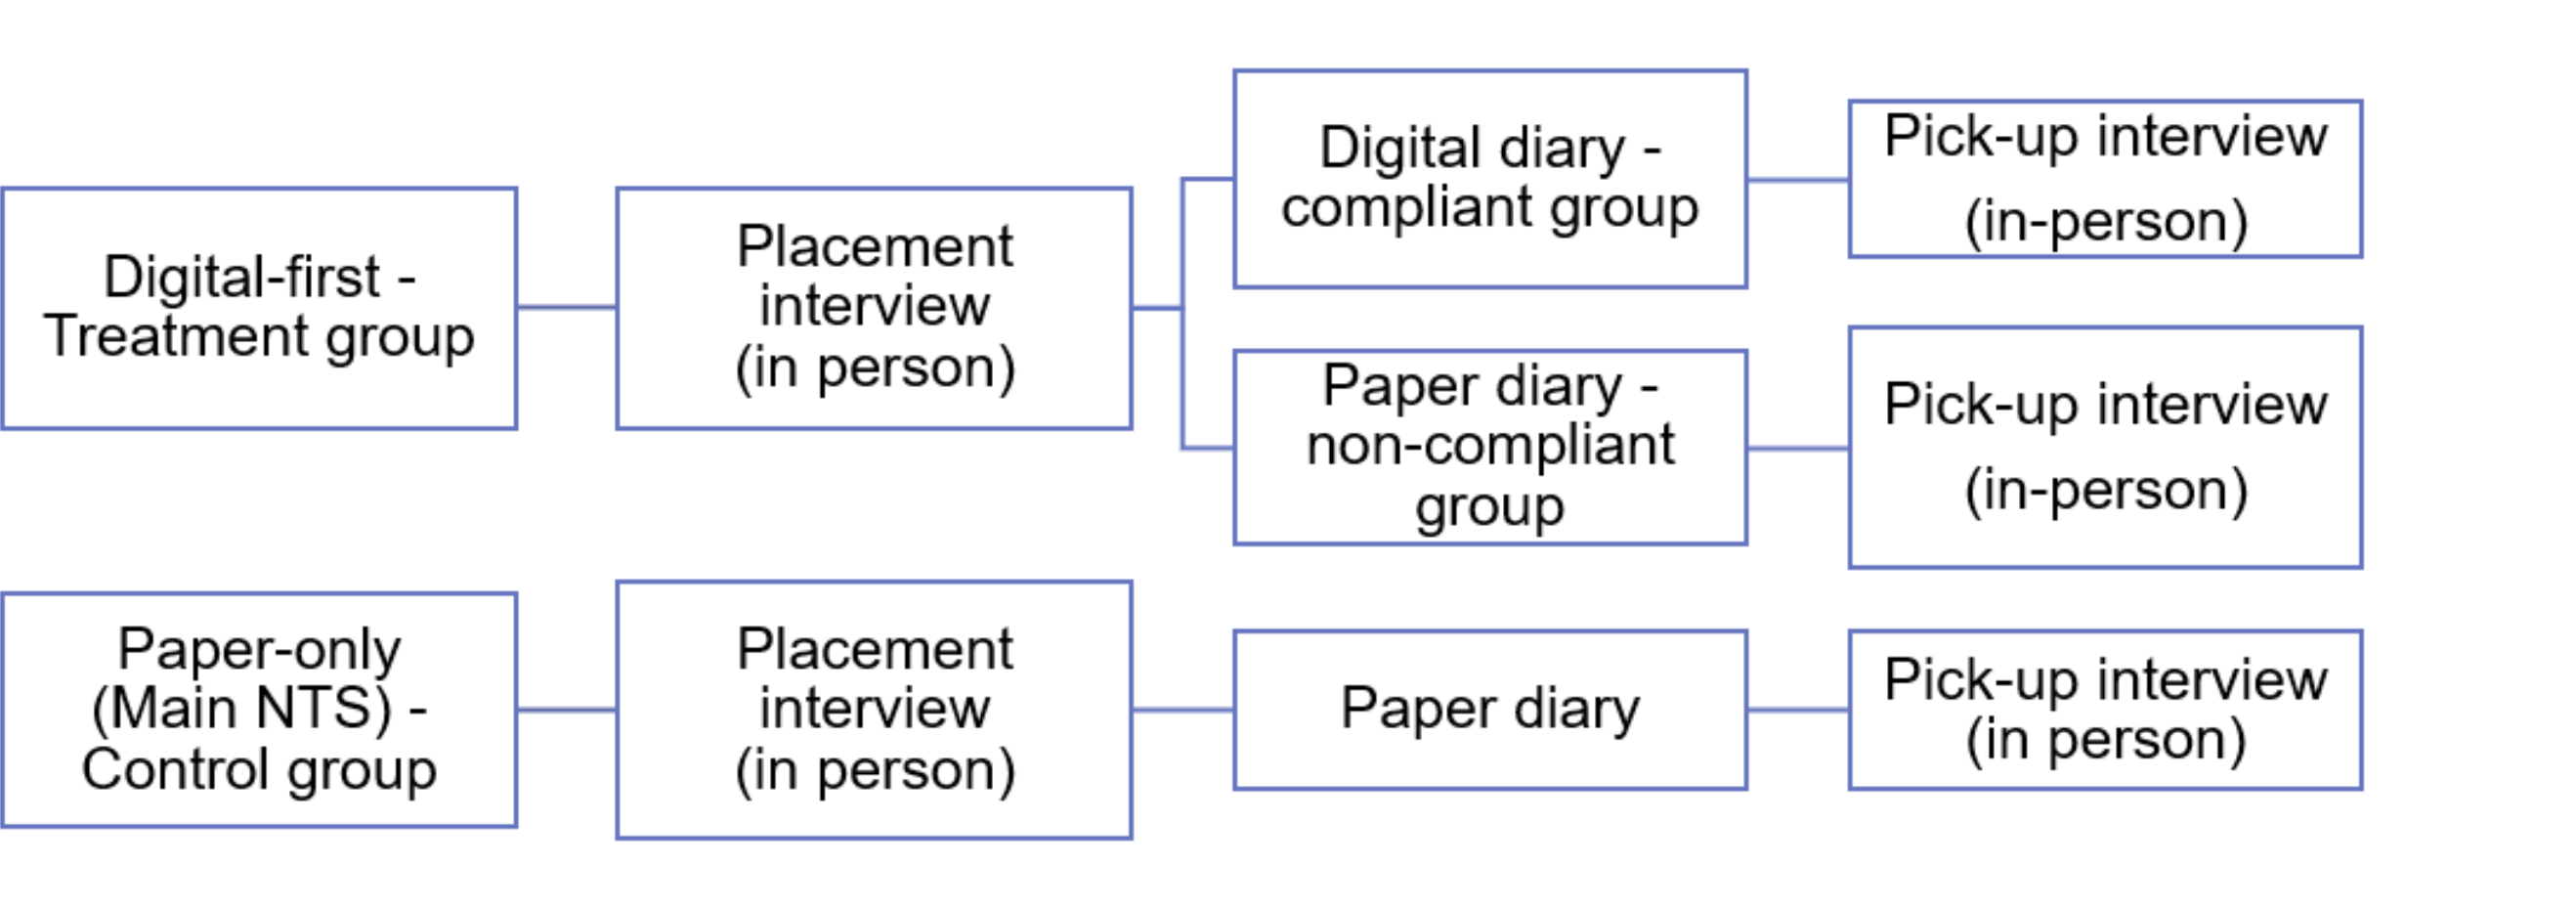
Figure 2.2 shows the fieldwork sequence for the digital-first treatment group and the paper-only control group in how the placement interview, diary, and pick-up was administered. For both groups, a placement interview was carried out in person, and at the end of the travel week, a pick up interview was carried out in person. The sequence differed between the groups at end of the placement interview. In the control group a paper diary was placed, while in the treatment group a digital diary was placed as the primary mode of completion, with a paper back-up available if this was not possible. Out of those in the treatment group, digital completers were classed as ‘compliant’ and paper completers were classed as ‘non-compliant’.
Throughout this report, digital-first and treatment are used interchangeably, and paper-only and control are used interchangeably.
2.2 Research questions
The Digital Diary Parallel Run explored how the introduction of the digital-first approach might impact 8 key areas of the NTS:
- response rates
- propensity to complete digital diaries
- proxying
- sample composition
- substantive estimates
- fieldwork sequence
- weighting efficiency
- imputation
The following research questions guided the experiment:
- How do response rates compare between the digital-first (treatment) and paper-only (control) groups?
- How likely are respondents to complete a digital diary, when exposed to the digital-first approach?
- What socio-demographic characteristics influence respondents’ likelihood of completing a digital diary versus a paper one?
- How does the level of proxy reporting compare between digital and paper diaries, and what impact does this have on recorded trips?
- What factors influence respondents’ likelihood of being proxied?
- How do the demographic and socio-economic profiles of respondents differ between the digital-first and paper-only approaches?
- How do key substantive trip estimates compare between the digital-first and paper-only approaches?
- What operational differences arise from the integration of digital diaries, such as differences in diary checking and editing time?
- How does the weighting efficiency vary between the digital and paper diaries?
- How does the rate of imputation vary between the digital and paper diaries?
In addition, data from the NTAS was used to answer:
- How does diary mode preference vary based on socio-demographic characteristics, use of online modes and attitudes towards the internet?
2.3 Purpose of this report
This report presents the results from the experiment, using both weighted and unweighted data (where applicable), to answer each research question. Drawing on these findings, along with qualitative insights from a small group of respondents and interviewers, a series of recommendations are also proposed in order to refine the approach before its full-scale integration in 2025.
3. Methods
This chapter outlines:
- the experimental design of the Parallel Run and how respondent exposure differed between the groups
- the sampling design
- the data collection and weighting procedures
- the qualitative component used to refine recommendations
- the analytical approaches chosen to answer each research question
3.1 Design
The NTS consists of two sequential data collection components:
- the placement interview
- the 7-day travel diary
Both the treatment and control groups received an identically structured placement interview. As is standard on the NTS, the interview collected information about the household, household members, and vehicles. Further information about the questionnaire content can be found in the 2024 technical report.
The primary mode of administration for the household section of the placement interview was Computer-Assisted Personal Interviewing (CAPI), with one randomly selected household member completing a section via CASI (Computer-Assisted Self-Interviewing). Following standard NTS procedures, in certain health-related cases, the interview could also be conducted over the telephone. Whenever possible, each eligible household member should have completed their own individual section of the interview. However, if a household member was unavailable, another member could provide proxied responses on their behalf.
For the 7-day travel diary, the treatment and control groups followed different procedures. The treatment group was exposed to the digital-first approach, where the interviewer initially offered a digital diary. A paper alternative should only have been provided if the respondent declined to use the digital format. Household members who completed the digital diary were categorised as the compliant treatment group, whilst those who completed a paper diary formed the non-compliant treatment group. In contrast, the control group was only offered a paper diary option.
In addition to these core components, interviewers recorded various aspects about the fieldwork process at multiple stages throughout the fieldwork sequence. This included information typically recorded on the NTS, such as time taken to place travel diaries, as well as information specific to the Parallel Run, such as perceived difficulty using the digital diary system. Data from the pick-up interview, the travel diary, and interviewer observations were transmitted, combined, and processed for analysis.
3.2 Sample
The treatment and control samples were selected separately using a two-stage stratified design. The Postcode Address File for England served as the sampling frame, with postcode sectors serving as the Primary Sampling Unit (PSU) and household addresses as the sampling unit of interest. The selection of PSUs for the treatment and control groups was mutually exclusive. In Inner and Outer London, PSUs were over-sampled due to historical patterns of lower rates of response.
This sampling design promoted that both issued groups were nationally representative of all private households in England during the first quarter of 2024. During interviewer fieldwork, non-residential sampled addresses were deemed eligible to participate. Where multiple dwelling units or households were found within a sampled address, a random selection procedure was followed to sample one household only. Further details of what is classed as ineligible, and the selection procedure for multiple dwelling units or households can be found in the 2024 technical report.
Table 3.1 summarises the data collection modes, diary modes, dates of data collection, target population, sampling frame and sample design for both experimental groups.
Table 3.1: Summary of the treatment and control groups
| Design characteristic | Digital-first approach (treatment) | Paper-only approach (control) |
|---|---|---|
| Data collection mode(s) for non-diary elements | CAPI with CASI or CAPI section, Telephone back-up for immunosuppressed respondents | CAPI with CASI or CAPI section, Telephone back-up for immunosuppressed respondents |
| Diary mode(s) | Digital-first with paper back-up | Paper only |
| Dates of data collection | January to June 2024 | January to June 2024 |
| Target population | All people living in private households in England | All people living in private households in England |
| Sampling frame | Postcode Address File | Postcode Address File |
| Sample design | Multi-stage, stratified cluster | Multi-stage, stratified cluster |
Table 3.2 shows the number of postcode sectors, issued households, and achieved households for each group. For the treatment group, 99 postcode sectors were randomly selected, resulting in 2,178 issued addresses and 524 fully productive households. For the control group, 291 postcode sectors were randomly selected, yielding 6,402 issued addresses and 1,640 fully productive households. Each interviewer was assigned to at least one Primary Sampling Unit, with each sector containing 22 addresses.
Table 3.2: Issued and achieved sample sizes by experimental group
| Experimental group | Issued postcode sectors | Issued households | Attempted households | Achieved households (fully productive) |
|---|---|---|---|---|
| Treatment | 99 | 2,178 | 1,938 | 524 |
| Control | 291 | 6,402 | 5,618 | 1,640 |
| Total | 390 | 8,580 | 7,556 | 2,164 |
Note: Postcode sectors served as the Primary Sampling Unit and households served as the sampling unit of interest. Attempted households are defined as those contacted by interviewers, and achieved fully productive households are defined as those where all household members completed both the interview and the diary.
3.3 Quantitative data
To answer the research questions, combined quantitative data from the CAPI and diary was used, primarily comparing the treatment and control groups and, where relevant, the compliant and non-compliant treatment groups (see chapter 3.6).
In addition, data from wave 10 of the NTAS (conducted in February and March 2024) was used to provide additional evidence on diary mode preferences. The NTAS sample is drawn from individuals aged 16 and over who completed the NTS and agreed to be recontacted for follow-up studies. Of the 3,842 issued cases, 1,584 completed the survey (response rate = 41%). The study followed a sequential mixed-mode design. Initially, respondents were invited to participate online, with invitations sent via postal mail, e-mail, and text messages, depending on the available contact information. After 2 weeks, non-respondents were contacted by telephone. The mode of administration was predominantly web-based (86%), with 14% of respondents completing the survey via telephone.
3.4 Survey weights
The NTS uses a series of weights to adjust for the complex sampling design and non-response. The weights for both experimental groups were constructed following the standard NTS weighting strategy, treating the combined treatment and control groups as a single responding sample. Information on the NTS weighting methodology can be found in the 2024 technical report. Table 3.3 summarises each NTS weight used in this analysis.
Table 3.3: Description of NTS survey weights used in the Parallel Run analysis
| Weight | Description |
|---|---|
| W2 - Diary sample household Weight | Computed for households that were fully productive, used to estimate the number of individuals who made specific trips. |
| W3 - Interview sample household weight | Computed for households where all members completed an interview and applied to variables at the household or individual level. |
Source: NTS Data Extract User Guide.
For all hypothesis testing on weighted data, NTS data, a primary strata variable was applied to take the complex sampling design into account, except for:
- the ANOVA and post hoc tests exploring the relationship between proxy status and trip under-reporting
- the median regression analysis for placement interview length
Government Office Region (GOR), with Inner and Outer London, disaggregated, served as the stratification variable in the analysis. This was chosen over reflecting the original NTS stratification because several strata contained only a single PSU in the treatment group. This would have hindered variance estimation, as strata with a single PSU do not provide sufficient information to estimate within-stratum sampling variance and, therefore, standard errors of estimates.
For the analysis using NTAS data, the NTAS weights were applied, which account for:
- non-response to the NTS recruitment survey
- ineligibility for the NTAS panel survey
- refusal to join the NTAS panel at the end of the NTS interview
- non-response of panel members to individual waves of the NTAS
Further information about the methodology for the NTAS weights can be found in the technical report for wave 1 of NTAS.
3.5 Qualitative component
To complement the quantitative findings, qualitative research was conducted with interviewers and researchers involved in the Parallel Run. A total of 18 semi-structured interviews were completed with 12 respondents and 6 interviewers, as well as one focus group with an additional 6 interviewers.
These interviews and the focus group provided additional context on existing challenges associated with the digital-first approach and informed recommendations for mitigating them.
Qualitative interviews with respondents explored experiences such as:
- interacting with the digital diary system
- household member proxying in the digital diary system
- barriers preventing digital diary completion
- requesting and receiving help during the fieldwork sequence
Qualitative interviews with interviewers explored experiences such as:
- interviewer training
- digital diary set-up, including using the digital diary system and CAPI system simultaneously
- hardware and technical skills, such as tethering using the mobile
- respondents that opted for a paper diary
- interviewer proxying on respondents’ behalf
- requesting and receiving support
To obtain a diverse pool of participants, selection quotas were applied. Respondents were chosen to reflect variation in English region, age, employment status, highest educational qualification, diary mode, and proxying status. Interviewer selection was based on years of NTS experience, proportion of achieved digital diary cases, and the mode of pre-fieldwork training they attended.
To recruit participants, 57 respondents from the treatment group that had consented to participate in future research were contacted via e-mail. A total of 49 interviewers who had worked on the Digital Diary Parallel Run were approached via e-mail to participate in interviews, and 14 were invited to participate in the focus group. Respondents and interviewers who responded to the e-mail invitations were selected until the established quotas were achieved.
Topic guide documents were produced, which set out the key themes and indicative questions to be covered with respondents and interviewers during the semi-structured interviews and focus group. All sessions were held online via video calls, except for two interviews conducted by telephone. Interviews lasted between 20 and 60 minutes, whilst the focus group ran for approximately 90 minutes.
Researchers who conducted the interviews and focus groups systematically captured participants’ responses by charting. Charting involves noting information into a grid that follows the structure of the topic guides.
Once all the interviews and the focus group were completed, the researchers participated in debrief sessions. During these sessions, they presented extracted findings with stakeholders from the Department for Transport, the digital diary developers, and the wider NatCen research team. All parties had an opportunity to ask questions and provide feedback about the findings.
An internal report was produced presenting the findings from the qualitative component, which helped to refine the recommendations outlined in chapter 14 of this report.
3.6 Analytical approach
The primary method of answering the research questions was through quantitative evaluation of differences in substantive estimates and fieldwork and processing indicators between:
- the experimental groups: those exposed to the digital-first approach (treatment group) and the paper-only approach (control group)
- the intra-treatment groups: within the treatment group, those who completed a digital diary (compliant) and those who completed a paper diary (non-compliant)
The results of the qualitative interviews and focus group supplemented these findings by providing context on some existing challenges with the digital-first approach and helping to refine recommendations on how they can be mitigated.
To understand the impact on response rates, unweighted data was used to compute and compare the unweighted proportions of fully and partially productive cases between the experimental groups, both nationally and in London, for each month and across the full quarter, using two-proportion two-tailed hypothesis tests.
The 6 standard AAPOR response rates were also computed and compared between the experimental groups.
To assess digital uptake, the diary sample household weight (W2) was applied to:
- compute the proportion of households where at least one member completed a digital diary versus those where all members used paper, among fully productive households in the treatment group
- compute the proportion of individuals who completed a digital versus paper diary, among fully productive households in the treatment group
- compute the proportion of digitally-completing households by interviewer, among fully productive households in the treatment group
- compute the distribution of interviewer-reported barriers to digital completion for non-compliant households in the treatment group
To understand the impact on proxying, the diary sample household weight (W2) was applied to:
- compare the proportions of diaries completed by respondent themselves, with help, or via proxy, across experimental and intra-treatment groups, using a Chi-squared test (for respondents aged 11 and over)
- present paradata results on the proportion of digitally completing households where diaries were completed by full or partial proxy, by an interviewer or another household member, and the proportion of those who used the ‘share journey’ feature
- estimate the association between proxy status and under-reporting of trips, using analysis of variance (ANOVA) tests (for those aged 11 and over)
- explore how the effect size of proxy status on trip under-reporting varied by experimental and intra-treatment groups, via post hoc Tukey tests with Bonferroni correction (for those aged 11 and over)
- identify socio-demographic predictors of proxy status using a multinomial regression model (for respondents aged 16 and over)
To understand the impact on sample composition, unweighted data was used to assess the representativeness of achieved fully productive treatment and control samples, by comparing each experimental group’s unweighted distributions against benchmark population estimates, and computing dissimilarity indices, with respect to:
- deprivation
- household tenure
- household size
- age
- sex
- disability status
- employment status
- ethnic background
- urbanicity
Additionally, the diary sample household weight (W2) was applied to identify socio-demographic factors that predicted compliance, for respondents aged 16 and over in the digital-first group, via a multivariate logistic regression model.
To understand the impact on substantive trip estimates, unweighted data was used to:
- compare weekly trip rates between experimental and intra-treatment groups using a two-tailed independent-samples t-test
- compare day 1 trip rates between experimental and intra-treatment groups using a two-tailed independent-samples t-test
- compare day 7 trip rates between experimental and intra-treatment groups using a two-tailed independent-samples t-test
- compare the proportion of respondents reporting no travel between experimental and intra-treatment groups using a Chi-squared test
Additionally, the diary sample household weight (W2) was applied to:
- compare trip purposes between the experimental and intra-treatment groups descriptively
- compare distances between the experimental and intra-treatment groups using a Wald F test
- compare the distance of walking stages between the experimental and intra-treatment groups using a design-based Chi-squared test
- compare the propensity to round distances between the experimental and intra-treatment groups descriptively
- compare travel modes between the experimental and intra-treatment groups descriptively
- compare the number of stages between the experimental and intra-treatment groups using a Wald F test
To understand the impact on fieldwork processes, the interview sample household weights (W3) were applied to households where all household members completed an interview and at least one diary was returned to:
- compare the total number of calls between the experimental and intra-treatment groups using a two-tailed independent-samples t-test
- compare the proportion of reminder calls between the experimental and intra-treatment groups using a Chi-squared test
- identify the effect of experimental and intra-treatment group membership on receiving reminder calls using a Chi-squared test
- compare the length of the placement interview between the experimental and intra treatment groups using a median regression model
- compare the time taken to place travel diaries between the experimental and intra treatment groups using a two-tailed independent-samples t-test
- identify the effect of experimental and intra-treatment groups on the time taken to place travel diaries, while controlling for household size, via a multivariate linear regression model
- compare the mode and prevalence of midweek checks between the experimental and intra-treatment groups using a Chi-squared test
- compare the time taken to check and edit diaries between the experimental and intra treatment groups using a two-tailed independent-samples t-test
- compare the proportion of households that were received a memory jogger between the experimental and intra-treatment groups using Chi-squared tests
- compare the proportion of households that used a memory jogger, out of those that received it, between the experimental and intra-treatment groups descriptively
- compute the proportion of cases where interviewer (versus respondent) devices were used for onboarding (among those in the treatment group)
- report the prevalence of technical issues during onboarding (among those who agreed to complete digitally) and present the distribution of these technical issues
- present the distribution of interviewer-reported ease of using the digital diary system (among those in the treatment group)
In addition, the diary sample household weight (W2) was applied to:
- compare the extent of back-dating (defined as the difference between date of placement interview and start of travel week) between the experimental and intra-treatment groups using a Chi-squared test, among fully productive households
- compare the distribution of walking stages that were below 1 mile versus 1 mile or above by extent of back-dating, among fully productive households
The interview sample household weights (W3) were applied to households where everybody completed an interview to estimate the association between completing a practice page and the likelihood of being fully productive (versus partially productive), using a Chi-squared test.
To understand the impact on weighting efficiency, the efficiencies and design effects of the eight NTS weights were compared between the two diary modes via inspection only.
To understand the impact on imputation rate, the imputation rate across 49 eligible variables were compared between the experimental groups, via a two-tailed, two-proportion hypothesis test.
To understand how diary mode preference varies by socio-demographic factors, data from wave 10 of the NTAS 2024 was used to identify the extent to which various socio-demographic factors, frequency of electronic device, and attitudes towards the internet (regarding privacy and use for research purposes) predicted mode preference, via a multivariate multinomial logistic regression model.
A 5% significance level was used for all hypothesis testing.
3.7 Limitations
The findings from the NTS Digital Diary Parallel Run provide valuable insights into how transitioning from paper to digital diaries may affect response rates, sample composition, and parameter estimates. However, several limitations may impact the internal and external validity of this experiment.
There were three key design-based limitations.
Limitation 1: For logistical reasons, each interviewer was assigned to one Primary Sampling Unit, which was the adjusted postcode sector. This limited the ability to disentangle interviewer effects from geographical factors such as the Index of Multiple Deprivation.
Limitation 2: Although the sample sizes for the treatment and control groups were relatively large, the small number of primary sampling units for the treatment group, combined with the clustered sample design, meaningfully reduced the statistical power for some disaggregated analyses when applying survey weights.
Limitation 3: The support channels offered to those who completed digital and paper diaries differed. Respondents completing digital diaries had access to built-in support features that allowed them to log issues directly within the system, whereas no equivalent mechanism was available for those completing paper diaries.
Additionally, there were seven key fieldwork-based limitations.
Limitation 1: As figure 3.1 shows, the proportion of non-attempted cases for both the treatment and control groups was substantially higher in January and February 2024 compared to the first quarter of 2023. To mitigate this and increase the statistical power of the experiment, a £20 interviewer incentive was introduced for all cases issued in March for both groups. Although this analysis assumes that the incentive had a uniform effect across both groups and did not alter the size of the treatment effects, this assumption was not empirically tested.
Figure 3.1: Proportion of issued cases that were not attempted by mainstage NTS and treatment group (January 2023 to March 2024)
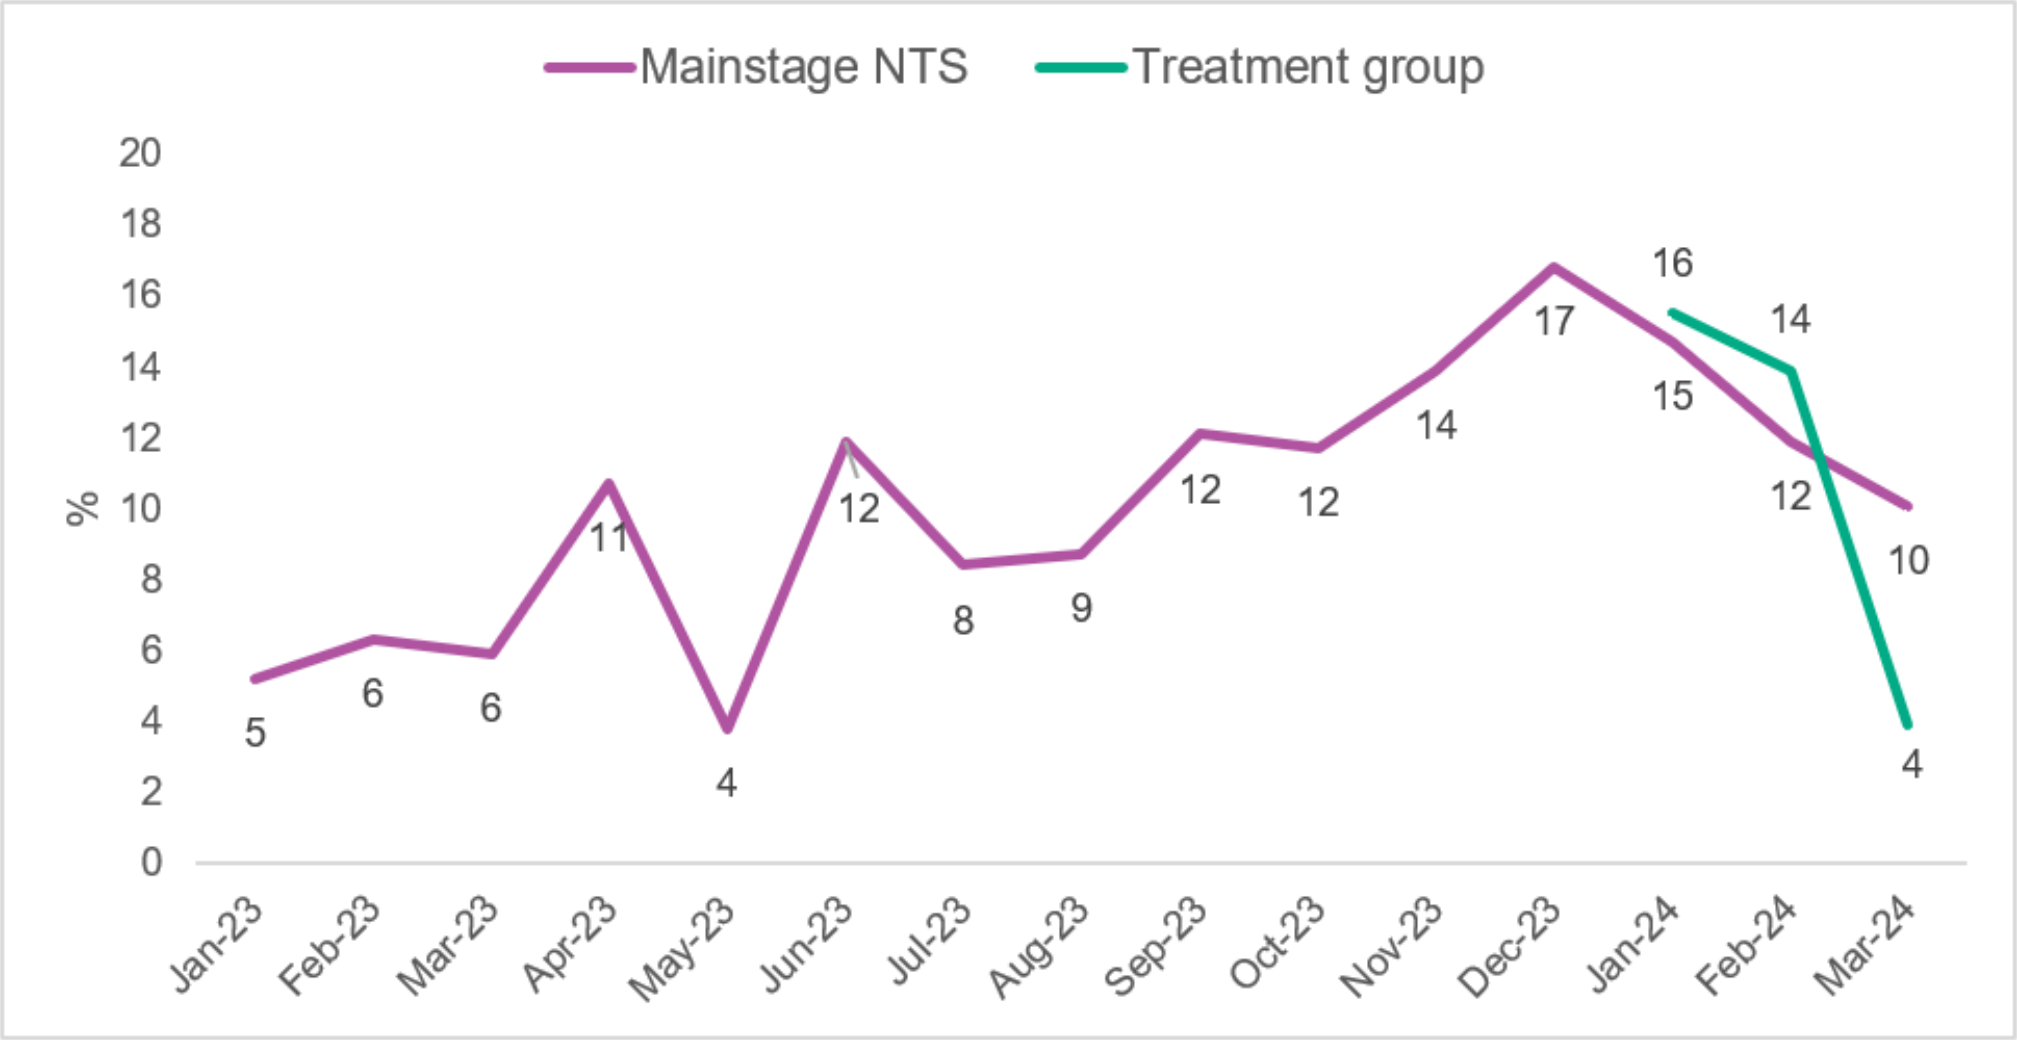
Between January and March 2024, the mainstage NTS formed the control group. The graph presents the proportion of issued cases that were not attempted by interviewers for the mainstage NTS group between January 2023 and March 2024 and the treatment, digital-first group between January and March 2024. In the first quarter of 2023, around 1 in 20 issued cases were not attempted for mainstage NTS. In the second quarter of 2023, the rate fluctuated markedly, rising to 11% in April, falling to 4% in May, and increasing again to 12% in June. In the second half of 2023, the proportion of non-attempted cases steadily increased from 8% in July 2023 to a peak of 17% in December 2023. In the first quarter of 2024, the rate declined consistently month-on-month, dropping from 15% in January 2024 to 10% in March. Comparing groups in early 2024, the treatment group had slightly higher non-attempted rates than mainstage NTS in January (16%) and February (14%). However, in March, the treatment group rate fell sharply to 4%, substantially below the mainstage level.
Limitation 2: As table 3.4 shows, the proportion of non-attempted cases varied substantially across government office regions, and the proportion was not uniform across the experimental groups. This variation may impact the extent to which socio-demographic differences between the experimental groups can be attributed to the effect of the digital-first approach, rather than varying fieldwork performance between the groups.
Table 3.4: Proportion of cases that were not attempted by government office region for each experimental group
Base: issued sample, household-level, unweighted
| Government office region | Control Group | Treatment group |
|---|---|---|
| North East | 1.8% | 0.0% |
| North West | 42.1% | 26.6% |
| Yorkshire and the Humber | 17.2% | 10.0% |
| East Midlands | 9.3% | 12.5% |
| West Midlands | 8.0% | 14.5% |
| East | 2.3% | 10.0% |
| South West | 0.3% | 1.4% |
| South East | 4.9% | 6.5% |
| London | 10.6% | 9.1% |
Limitation 3: There was a relatively high non-response rate (greater than 5%) to the variable measuring households’ initially chosen diary mode in the treatment group, along with the follow-up questions contingent on it. This limited the ability to assess the proportion of households that switched from digital to paper diaries due to factors unrelated to members’ attitudes towards the digital diary system or ability to engage with it. Whilst NTS survey weights adjusted for overall non-response, they did not adjust for item-level non-response such as this.
Limitation 4: To address issues posed by non-response to the chosen household mode, an alternative household-level variable was created based on individual diary mode. While households were intended to use a single mode, with all members completing either digital or paper diaries, a small number of households used both modes. This may result in inconsistencies between the individual-level and household-level measures of mode that cannot be explained by varying household size between modes. However, given the very low prevalence of mixed-mode households (less than 10), this is expected to have a negligible impact on the conclusions drawn from the derived variable measuring household compliance.
Limitation 5: Interviewer effects were not taken into account in any of the analysis. However, qualitative evidence, combined with large variation in mode choice by interviewer suggests that interviewers may have sometimes selected the mode on behalf of respondents, bypassing the digital-first process. This is contrary to the design of the experiment: all units in the treatment group were supposed to follow a digital-first approach, offering a digital diary initially with a paper option as a backup.
Limitation 6: The observed effects may exceed what would be expected once the digital-first approach is implemented into mainstage NTS, due to the novelty of the process during the Parallel Run.
Limitation 7: The variable used to measure marital status may be subject to processing error. Although steps were taken to address this issue, it was not confirmed that the issue was fully resolved at the time of analysis.
Finally, the hypothesis tests used to answer the research questions assume independence of observations. However, this assumption is violated due to the hierarchical nature of the data: individuals are clustered within households, journeys are clustered within individuals, and stages are clustered within journeys. Additionally, households themselves are clustered by interviewer assignment. Ignoring these clustering effects can lead to underestimated standard errors, which may result in overly narrow confidence intervals and a higher likelihood of Type I errors, overstating differences between the mainstage NTS and the Parallel Run. Therefore, when statistically significant differences are observed they should be interpreted within this context.
4. Results: response rates
This chapter compares the response rates between households exposed to the digital-first and paper-only approaches. Since the NTS is a household-based survey, response rates are calculated at the household level. For a household to be considered fully productive, all members must complete both the interview and the travel diary. A household is considered partially productive if any household member completes a placement interview or a travel diary.
In summary, as shown in Table 4.1, response rates were broadly comparable between the digital-first and paper-only groups, suggesting that the introduction of the digital-first approach does not have an inflationary nor deflationary effect on response.
Table 4.1: Summary of outcome codes for experimental groups
Base: issued sample, household-level, unweighted
| Outcome | Treatment group % | Control group % | Difference (Treatment – Control) |
|---|---|---|---|
| Fully cooperating | 24.1% | 25.6% | -1.5pp |
| Partially cooperating | 5.4% | 5.5% | -0.1pp |
| Ineligible or deadwood | 7.1% | 7.2% | -0.1pp |
| Unknown eligibility | 14.6% | 15.7% | -1.1pp |
| Refusal to cooperate and other unproductive | 39.1% | 36.5% | +2.6pp |
| Non-contact | 9.8% | 9.6% | +0.2pp |
| Base (households) | 2,178 | 6,402 | [x] |
Table 4.2 shows that response rates across both groups were also similar according to all six American Association for Public Opinion Research (AAPOR) Response Rate computations, with the treatment group’s response rates being between 1 and 3 percentage points lower than the control group.
Table 4.2: AAPOR Response Rates 1 to 6 by experimental group
Base: Variable (see Response Rate computations in the Notes section), household-level, unweighted.
| Response Rate computation | Treatment group | Control group | Difference (Treatment – Control) |
|---|---|---|---|
| 1 | 25.9% | 27.6% | -1.7pp |
| 2 | 31.7% | 33.5% | -1.8pp |
| 3 | 26.2% | 28.0% | -1.8pp |
| 4 | 32.1% | 34.0% | -1.9pp |
| 5 | 30.7% | 33.2% | -2.5pp |
| 6 | 37.6% | 40.3% | -2.7pp |
Note: Response rate 1 = I/((I+P)+(R+NC+O)+(UH+UO)). Response rate 2 = (I+P)/((I+P)+(R+NC+O)+(UH+UO)). Response rate 3 = I/((I+P)+(R+NC+O)+e(UH+UO). Response Rate 4 = (I+P)/((I+P)+(R+NC+O)+e(UH+UO)). Response Rate 5 = I/((I+P)+(R+NC+O)). Response Rate 6 = (I+P)/((I+P)+(R+NC+O)). I = number of complete interviews, P = number of partial interviews, R = number of refusal and breakoff, NC = number of non-contacts, O = number of others, e = estimated proportion of unknown cases that are eligible, UH = number of unknown households, and UO = number of unknown respondent eligibility cases.
4.1 Fully productive response in England
Nationally, the proportion of fully productive cases was broadly comparable between the digital-first (26%) and paper-only (28%) groups. In London, however, the proportion was substantially lower for the digital-first group compared to the paper-only group.
The proportion of fully productive cases, out of those assumed to be eligible, was comparable between the two groups in England (z = -1.49, p = 0.14).
Table 4.3 presents the fully productive rate by experimental group for each fieldwork month and for the whole quarter.
Table 4.3: Fully productive rate by experimental group
Base: Issued sample assumed eligible, household-level, unweighted.
| Fieldwork period | Treatment Group (%) | Control group (%) | z-statistic |
|---|---|---|---|
| January | 23.3% | 25.5% | -1.16 |
| February | 22.3% | 27.6% | -2.65** |
| March | 31.9% | 29.7% | 1.08 |
| Full quarter | 25.9% | 27.6% | -1.49 |
| Base (households) | 2,024 | 5,944 | [x] |
Note: **p < 0.01. All other differences were insignificant (p > 0.05).
After excluding points that were unallocated or unworked by interviewers, the response rates between the treatment (26%) and control groups (28%) remained non-significant (z = -1.52, p = .13). This suggests that transitioning to a digital-first approach is unlikely to increase or decrease NTS response rates if the rate of non-attempted cases remains constant.
Table 4.4 presents response rates by experimental group, out of issued points, allocated points, and allocated and worked points only.
Table 4.4: Response rates by experimental group, by allocation status
Base: Variable, household-level, unweighted
| Response rate | Treatment group (%) | Control group (%) | z-statistic | Base (households) |
|---|---|---|---|---|
| Out of issued points | 24.1% | 25.6% | -1.39 | 8,580 |
| Out of allocated points | 25.3% | 26.7% | -1.25 | 8,280 |
| Out of allocated and worked points | 26.4% | 28.2% | -1.52 | 7,788 |
Note: Differences were insignificant (p > 0.05) for between-group tests for issued points, allocated points, and allocated and worked points.
4.2 Fully productive response in London only
In London, the proportion of fully productive cases was substantially lower for the digital-first group compared to the paper-only group.
Historically, response rates in London have been lower than the national average, which is corrected for by oversampling on the NTS. As Figure 4.1 shows, this gap has persisted over time. In 2023, the median difference in monthly response rates between London and the rest of England was lower by 5 percentage points. Therefore, assessing response rates in London separately is beneficial, as the outcome may impact sampling strategies.
Figure 4.1: Monthly response rates for London and the rest of England (2017 to 2023)
Base: Issued sample assumed eligible, household-level, unweighted
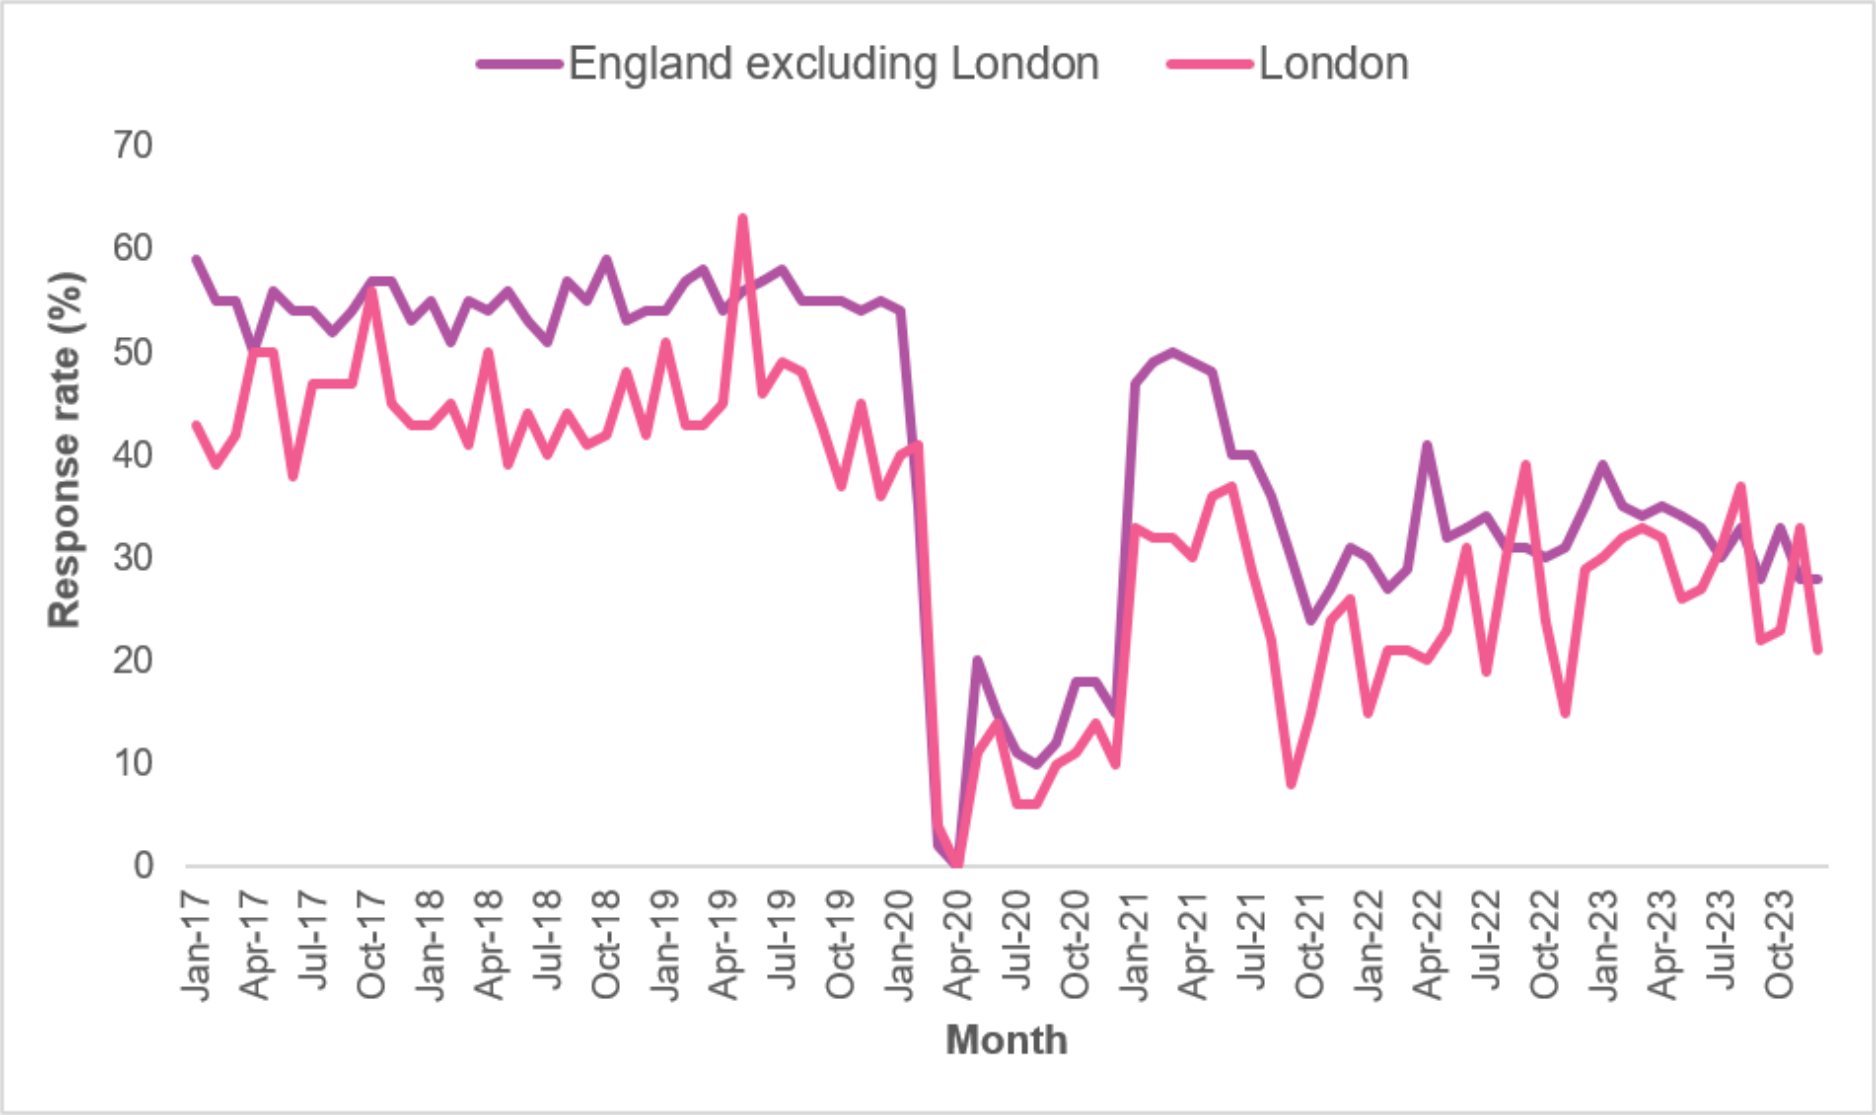
From January 2017 to January 2020, response rates were relatively stable in both groups. London ranged between 36% and 63%, while the rest of England was more tightly clustered between 50% and 59%. The wider range in London (27 percentage points, compared with 9pp in the rest of England) likely reflects greater volatility due to the smaller sample size. During this period, response rates in London were lower in almost every month, with only two exceptions: April 2017 (equal) and May 2019 (7pp higher in London). A sharp disruption occurred in early 2020. Between February and March, response rates fell dramatically in the rest of England (from 35% to 2%). London initially remained stable (40% in January and 41% in February) before also dropping to 4% in March. In April 2020, response rates fell to 0% in both groups due to the COVID-19 pandemic. From May to December 2020, response rates partially recovered but remained well below pre-pandemic levels. London ranged from 6% to 14%, while the rest of England was slightly higher at 10% to 20%, maintaining the persistent gap. In the first half of 2021, response rates improved further but still did not return to pre-pandemic levels. London ranged from 30% to 37%, compared with 40% to 50% in the rest of England. From the second half of 2021 through 2022, response rates declined again, particularly in London. Rates ranged from 8% to 39% in London and 24% to 41% in the rest of England, with London continuing to show greater variability. By 2023, response rates had stabilised somewhat, with London ranging from 21% to 33% and the rest of England from 28% to 39%. Notably, the gap began to close, with London recording higher response rates in 3 out of 12 months.
In London, the proportion of fully productive cases, out of those assumed to be eligible, was lower for the digital-first group (14%) compared to the paper-only group (23%), with significant differences (z = -3.84, p < 0.001). This difference occurred despite broadly similar non-attempted rates between the treatment (9%) and control (11%) groups in London.
This trend of lower response rates in London compared to the rest of England persisted for both the treatment group (z = -4.94, p < 0.001) and the control group (z = -2.72, p < 0.01). However, the gap between London and the national response rate was larger for the treatment group (12 percentage points) than for the control group (5 percentage points).
4.3 Partially productive response
The proportion of partially productive cases was broadly similar across the digital-first and paper-only groups, both nationally and in London.
Nationally, the proportion of partially productive cases was around 6% for both groups (z = -0.17, p = 0.87). Similarly, in London only, there were no significant differences in the proportion of partially productive households between the digital-first (5%) and paper-only (7%) approaches (z = -1.25, p = 0.21).
Table 4.5 presents the partially productive rate by experimental group for each fieldwork month and for the whole quarter nationally. Table 4.6 presents this for London only.
Table 4.5: Proportion of partially productive cases, out of those assumed to be eligible, by experimental group and month
Base: Issued sample assumed eligible, household-level, unweighted.
| Fieldwork period | Treatment group % (n) | Control group % (n) | z |
|---|---|---|---|
| January | 4.8% | 5.9% | [x] |
| February | 6.5% | 5.7% | [x] |
| March | 6.3% | 6.1% | [x] |
| Full quarter | 5.8% | 5.9% | -0.17 |
| Base (households) | 2,024 | 5,944 | -0.17 |
Table 4.6: Partially productive rate in London, by experimental group and month
Base: Issued sample in London assumed eligible, household-level, unweighted.
| Fieldwork period | Treatment group % | Control group % | z |
|---|---|---|---|
| January | 3.9% | 5.7% | [x] |
| February | 7.0% | 7.0% | [x] |
| March | 0.0% | 7.8% | [x] |
| Full quarter | 4.9% | 6.8% | -1.25 |
| Base (households) | 345 | 957 | [x] |
Unlike for fully productive cases, there were no significant differences in the partially productive rate in London compared to England as a whole, for either the treatment (z = -0.67, p = 0.50) or the control group (z = 1.09, p = 0.28).
5. Results: digital diary uptake
In this chapter, the diary sample household weight (W2) is applied to estimate the propensity to complete digital diaries at the household and individual levels, out of fully productive cases. In addition, the interviewer-level distribution of household mode choice is presented, and the prevalence of different barriers to digital completion are explored.
5.1 What proportion of households exposed to the digital-first approach complete their travel diaries digitally?
Among fully productive households exposed to the digital-first approach, 62% had at least one household member complete a digital diary. In the remaining 38% of households, all members completed their diaries on paper.
The proportion of households completing diaries digitally was substantially higher in February and March compared to January (+17 pp). The lower proportion of digital households in January may reflect interviewers adjusting to new fieldwork procedures during the initial phase of the study.
Table 5.1 shows the mode of diary completion for fully productive households at the household-level.
Table 5.1: Mode of diary completion
Base: Fully productive treatment sample, household-level, weighted by diary sample household weight (W2).
| Fieldwork period | Digital | Paper | Base (households) |
|---|---|---|---|
| January | 50.3% | 49.7% | 162 |
| February | 66.7% | 33.3% | 144 |
| March | 67.1% | 32.9% | 218 |
| Full quarter | 61.6% | 38.4% | 524 |
Note: ‘Digital’ indicates that at least one household member completing a digital diary. Paper indicates that all household members completed their diaries on paper.
5.2 What proportion of individuals exposed to the digital-first approach complete their travel diaries digitally?
For individuals in the treatment group, 2 in 3 diaries (66%) were completed digitally, with 1 in 3 diaries (34%) completed on paper. Consistent with the household-level results, the proportion of digital completions was substantially higher in February and March (19pp and 12pp respectively), which may reflect interviewers adapting to new fieldwork procedures during the first fieldwork month.
Table 5.2 shows the mode of diary completion for fully productive at the individual level.
Table 5.2: Mode of diary completion
Base: Fully productive treatment sample, individual-level, weighted by diary sample household weight (W2).
| Fieldwork period | Digital diary | Paper diary | Base (households) |
|---|---|---|---|
| January | 56.3% | 43.7% | 378 |
| February | 74.8% | 25.2% | 294 |
| March | 68.0% | 32.0% | 498 |
| Full quarter | 66.0% | 34.0% | 1,170 |
5.3 What role did interviewers play in household mode choice?
The proportion of households completing digital versus paper diaries varied substantially between interviewers in the treatment group. Whilst the median proportion of digital completions was 68%, the range spanned from 0% to 100%. Additionally, about one-third of interviewers’ cases completed in one mode only. 19% (12 out of 62) of interviewers had only paper-completing households, whilst 16% (10 out of 62) of interviewers had only digital-completing households. The digital completion rates of the remaining 40 interviewers ranged from 13% to 96%.
Table 5.3 shows the number and proportion of fully productive digital households per interviewer in the digital-first group.
Table 5.3: Proportion of digital cases out of fully productive households in the treatment group by interviewer.
Base: Fully productive treatment sample, household-level, frequencies unweighted and percentages weighted by diary sample household weight (W2).
| Interviewer | Number of fully productive households (unweighted) | % of households completing digital diaries (weighted) |
|---|---|---|
| 1 | 2 | 0.0 |
| 2 | 3 | 0.0 |
| 3 | 9 | 0.0 |
| 4 | 10 | 0.0 |
| 5 | 5 | 0.0 |
| 6 | 2 | 0.0 |
| 7 | 4 | 0.0 |
| 8 | 1 | 0.0 |
| 9 | 2 | 0.0 |
| 10 | 1 | 0.0 |
| 11 | 4 | 0.0 |
| 12 | 8 | 0.0 |
| 13 | 10 | 13.4 |
| 14 | 7 | 17.0 |
| 15 | 9 | 21.6 |
| 16 | 8 | 24.3 |
| 17 | 10 | 30.0 |
| 18 | 10 | 31.6 |
| 19 | 3 | 34.8 |
| 20 | 7 | 42.0 |
| 21 | 20 | 47.9 |
| 22 | 4 | 48.2 |
| 23 | 8 | 49.3 |
| 24 | 34 | 49.9 |
| 25 | 10 | 53.5 |
| 26 | 4 | 54.0 |
| 27 | 9 | 56.0 |
| 28 | 4 | 56.2 |
| 29 | 6 | 60.3 |
| 30 | 19 | 62.1 |
| 31 | 7 | 68.1 |
| 32 | 15 | 68.8 |
| 33 | 12 | 69.4 |
| 34 | 23 | 72.5 |
| 35 | 4 | 75.2 |
| 36 | 18 | 75.8 |
| 37 | 8 | 75.9 |
| 38 | 5 | 78.7 |
| 39 | 4 | 79.8 |
| 40 | 5 | 80.0 |
| 41 | 13 | 80.7 |
| 42 | 8 | 81.2 |
| 43 | 9 | 81.8 |
| 44 | 4 | 81.9 |
| 45 | 11 | 86.8 |
| 46 | 19 | 91.8 |
| 47 | 11 | 91.9 |
| 48 | 8 | 92.2 |
| 49 | 13 | 93.0 |
| 50 | 15 | 93.8 |
| 51 | 22 | 95.5 |
| 52 | 2 | 100.0 |
| 53 | 3 | 100.0 |
| 54 | 3 | 100.0 |
| 55 | 2 | 100.0 |
| 56 | 2 | 100.0 |
| 57 | 4 | 100.0 |
| 58 | 8 | 100.0 |
| 59 | 27 | 100.0 |
| 60 | 2 | 100.0 |
| 61 | 3 | 100.0 |
| 62 | 1 | 100.0 |
Note: Interviewer IDs do not correspond to true interviewer numbers to ensure anonymity.
Some systematic variation in household mode choice at the interviewer level is expected, as interviewers were allocated based on geographic regions. These regions may differ in socio-demographic composition, contributing to variations in the proportion of households completing digitally at the interviewer-level.
5.4 What were the other barriers to digital completion?
Among households exposed to the digital-first approach that did not complete a digital diary, interviewers most commonly reported that household members faced barriers such as perceived difficulty with the digital system and a general lack of confidence in using technology. Figure 5.1 represents this and other key reasons respondents opted for paper completion over the digital diary.
Figure 5.1: Reasons for not completing a digital diary among those who opted for a paper backup
Base: Fully productive treatment sample that requested paper back-up, household-level, weighted by diary sample household weight (W2)
| Reason for not completing a digital diary | Interviewer-reported prevalence (%) |
|---|---|
| Digital diary set-up was unsuccessful | 4.5 |
| Concerned about data security when online | 5.6 |
| Does not have a stable internet connection | 7.7 |
| Does not have access to internet-connecting devices | 7.8 |
| Does not have an e-mail address | 13.2 |
| Does not have internet access | 19.3 |
| Is not confident using technology | 38.5 |
| Perceived it to be too difficult to complete online | 41.5 |
| Other | 16.7 |
6. Results: proxying
A respondent’s travel diary can be completed by another household member or the interviewer (proxied) in exceptional circumstances, meaning their journeys are recorded on their behalf. Exceptional circumstances include lacking the capacity to provide relevant information, such as due to mental illness, or being exceptionally difficult to reach, such as those in hospital. Those aged below 11 years old should always be proxied by another household member.
This chapter:
- compares the interviewer-reported measure of proxy status by experimental and intra-treatment group, with the diary sample household weight (W2) applied
- presents results from the Digital Diary System paradata, showing the proportion of digital diaries that were fully or partially proxied, or involved journey sharing
- estimates the association between proxy status and under-reporting of trips, with the diary sample household weight (W2) applied
- assesses whether any socio-demographic characteristics predict the likelihood of being proxied, with the diary sample household weight (W2) applied
6.1 What is the proportion of diaries that are proxied?
For respondents aged 11 and over, proxy status significantly varied between the digital-first and paper-only groups (F = 6.68, p < 0.001). The difference was primarily due to a much higher proportion of diaries being proxied by the interviewer or another household member in the treatment group (35%) compared to the control group (21%). A similar proportion of diaries were completed with assistance from another household member or the interviewer across both groups (9% for the treatment group and 10% for the control group).
Within the digital-first group, the distributions of proxy status also differed significantly between respondents completing digital and paper diaries (F = 3.94, p < 0.01). Again, this difference was largely driven by a higher proportion of digital diaries being proxied (40%) compared to paper diaries (26%).
Table 6.1 presents the distribution of proxy status by experimental and intra-treatment group.
Table 6.1: Diary proxy status by experimental and intra-treatment group
Base: Fully productive sample aged 11 and over, individual-level, weighted by diary sample household weight (W2).
| Who filled in the diary? | Treatment group (%) | Control group (%) | Compliant treatment (%) | Non-compliant treatment (%) |
|---|---|---|---|---|
| Respondent filled it in themselves | 55.6% | 69.5% | 50.8% | 64.7% |
| Respondent filled it in with help from another household member | 3.9% | 6.5% | 3.6% | 4.4% |
| Respondent was proxied by another household member | 20.1% | 10.2% | 26.7% | 7.5% |
| Respondent filled it in with help from the interviewer | 5.4% | 3.1% | 5.7% | 5.0% |
| Respondent was proxied by an interviewer | 15.0% | 10.7% | 13.1% | 18.5% |
| Base (individuals) | 1,051 | 3,229 | 674 | 377 |
The developers of the digital diary system extracted unweighted paradata for the full quarter to uncover the proportion of households successfully completing digital diaries (n = 360) that were proxied or used the ‘share journeys’ feature. Unlike the interviewer-reported measure, the paradata measure is at the household-level and does not take the age of respondents into account.
Out of the submitted digital diary households:
- in 39% of cases, one household member proxied for the rest of the household
- in 5% of cases, at least one household member proxied for another, whilst others in the household completed their own diaries
- in 11% of cases, the interviewer proxied for all members of the household
- in 9% of cases, at least one household member shared a journey with another household member, but no proxying occurred
Proxying rates for digital diaries were highly variable by interviewer, with two interviewers accounting for 40% of all digital households that were fully proxied by the interviewer.
6.2 What is the association between proxy status and trip under-reporting?
The average numbers of trips reported varied significantly by proxy status for the digital-first, paper-only, compliant and non-compliant groups, both weighted and unweighted. The weighted findings are displayed in table 6.2 and the unweighted findings are shown in table 6.3.
For both weighted and unweighted analyses, across all four groups, respondents that filled in their own diaries reported the highest number of trips. This was followed by those who completed the diary with assistance from another household member or the interviewer. Proxied diaries consistently recorded the fewest trips per week.
Table 6.2: Mean weekly trip rates by proxy status
Base: Fully productive sample aged 11 and over, individual-level, weighted by diary sample household weight (W2).
| Who filled in diary? | Treatment group (%) | Control group (%) | Compliant treatment (%) | Non-compliant treatment (%) |
|---|---|---|---|---|
| Respondent filled it in themselves | 14.2 | 14.7 | 15.0 | 13.0 |
| Respondent filled it in with help from another household member or the interviewer | 11.2 | 9.8 | 12.6 | 8.3 |
| Respondent was proxied by another household member or the interviewer | 8.4 | 7.2 | 8.3 | 8.8 |
| F | 38.71*** | 101.10*** | 32.57*** | 16.38*** |
Note: ***p < 0.001. F statistics are for one-way ANOVA tests. Diary sample household weight (W2) applied without strata variable.
Table 6.3: Mean weekly trip rates by proxy status
Base: Fully productive sample aged 11 and over, individual-level, unweighted.
| Who filled in diary? | Treatment group | Control group | Compliant treatment | Non-compliant treatment |
|---|---|---|---|---|
| Respondent filled it in themselves | 15.0 | 14.8 | 15.75 | 14.3 |
| Respondent filled it in with help from another household member or the interviewer | 13.2 | 12.7 | 14.1 | 11.3 |
| Respondent was proxied by another household member or the interviewer | 11.0 | 10.7 | 11.1 | 10.4 |
| F | 56.88*** | 24.59*** | 17.65*** | 8.97*** |
Note: ***p < 0.001. F statistics are for one-way ANOVA tests.
Proxied diaries had a notably lower weighted trip rate estimate than the unweighted estimates. The weighted trip rate ranged from 7.2 to 8.8 trips per week across the four groups, compared to 10.4 to 11.1 trips per week when unweighted.
Post hoc Tukey’s tests were conducted to assess how the effect of proxy status on trip reporting varied by experimental and intra-treatment groups. For the weighted data, the effect on the groups was small to medium (η² treatment = 0.06, control = 0.05, compliant treatment = 0.07, non-compliant treatment = 0.05). The effect size for the unweighted data was small (η² treatment = 0.03, control = 0.05, compliant treatment = 0.05, non-compliant treatment = 0.05).
Tables 6.4 and 6.5 present the weighted and unweighted results, respectively, of the post hoc Tukey ANOVA tests (with Bonferroni correction) comparing trip rates by proxy status within each experimental group.
Table 6.4: Post hoc Tukey’s ANOVA test with Bonferroni correction for weighted trip rates by proxy status by experimental group
Base: Fully productive sample aged 11 and over, individual-level, weighted by diary sample household weight (W2).
| Completion method comparison | Mean difference | Standard error |
|---|---|---|
| Treatment group: themselves-helped | 2.97* | 1.11 |
| Treatment group: themselves-proxied | 5.76*** | 0.66 |
| Treatment group: helped-proxied | 2.79* | 1.13 |
| Control group: themselves-helped | 4.50*** | 0.74 |
| Control group: themselves-proxied | 7.06*** | 0.51 |
| Control group: helped-proxied | 2.57** | 0.80 |
| Compliant treatment group: themselves-helped | 2.38 | 1.45 |
| Compliant treatment group: themselves-proxied | 6.71*** | 0.83 |
| Compliant treatment group: helped-proxied | 4.33** | 1.44 |
| Non-compliant treatment group: themselves-helped | 4.71*** | 0.83 |
| Non-compliant treatment group: themselves-proxied | 0.56 | 1.72 |
| Non-compliant treatment group: helped-proxied | 4.15* | 1.75 |
Note: *p < 0.05; *p < 0.01; **p < 0.001. Diary sample household weights (W2) applied without strata variable.
Table 6.5: Post hoc Tukey’s ANOVA test with Bonferroni correction for unweighted trip rates by proxy status by experimental group
Base: Fully productive sample aged 11 and over, individual-level, unweighted.
| Completion method comparison | Mean difference | Standard error |
|---|---|---|
| Treatment group: themselves-helped | 1.79 | 0.91 |
| Treatment group: themselves-proxied | 4.06*** | 0.58 |
| Treatment group: helped-proxied | 2.27* | 0.96 |
| Control group: themselves-helped | 2.11*** | 0.53 |
| Control group: themselves-proxied | 4.08*** | 0.39 |
| Control group: helped-proxied | 1.97** | 0.60 |
| Compliant treatment group: themselves-helped | 1.36 | 1.14 |
| Compliant treatment group: themselves-proxied | 4.31*** | 0.73 |
| Compliant treatment group: helped-proxied | 2.95* | 1.19 |
| Non-compliant treatment group: themselves-helped | 3.04 | 1.50 |
| Non-compliant treatment group: themselves-proxied | 3.96*** | 0.98 |
| Non-compliant treatment group: helped-proxied | 0.92 | 1.64 |
Note: *p < 0.05; *p < 0.01; **p < 0.001. Diary sample household weights (W2) applied without strata variable.
6.3 Are there differences in the characteristics of respondents that are proxied?
To examine which socio-demographic factors influenced respondents’ likelihood of being proxied or receiving help to complete a diary, a multinomial regression was conducted. The outcome variable was completion status (self-completed, completed with help, or proxied), and the explanatory variables were seven socio-demographic factors.
Sex, age, education, disability status, and marital status were significantly associated with completion status, whereas ethnic background and employment status were not. Table 6.6 presents the full multinomial regression results.
Males were more likely to be proxied than females (RRR = 1.38, p < 0.001), although there was no significant difference in their likelihood of receiving help completing their own diary (RRR = 1.13, p = 0.37).
Younger respondents were generally more likely to be proxied than older people, although there was an increase in proxying for those aged 80 and above (RRR = 1.67, p = 0.03, compared to those aged 60 to 69 years old). Age was not a significant predictor of whether an individual received help completing a diary.
Respondents with lower formal qualifications (below Level 4) were more likely to be proxied (RRR = 1.58, p < 0.001) and more likely to receive help (RRR = 1.72, p < 0.001) compared to those with higher qualifications (Level 4 and above).
Respondents whose daily activities were limited a lot were more likely to be proxied compared to those with no long-term health conditions (RRR = 1.70, p = 0.01). They were also more likely to receive help completing their diary (RRR = 2.61, p < 0.001), as were those whose activities were limited a little (RRR = 1.91, p < 0.01).
Marital status was not associated with being proxied. However, respondents who were single and had never married were less likely to receive help completing their diary compared to those who were married or in a civil partnership (RRR = 0.64, p = 0.04).
Table 6.6: Multivariate multinomial regression model showing the effect of socio-demographic factors on proxy status (reference category: self-completion)
Base: Fully productive sample aged 16 and over, individual-level, weighted by diary sample household weight (W2).
| Socio-demographic characteristic | Received help versus completed themselves RRR [95% CI] | Proxied versus completed themselves RRR [95% CI] |
|---|---|---|
| Sex: Female | ref | ref |
| Sex: Male | 1.13 [0.86, 1.48] | 1.38*** [1.15, 1.66] |
| Age: 16 to 25 years old | 1.31 [0.67, 2.56] | 2.91*** [1.80, 4.72] |
| Age: 26 to 39 years old | 1.02 [0.64, 1.65] | 1.56* [1.05, 2.34] |
| Age: 40 to 49 years old | 1.26 [0.80, 1.97] | 1.72** [1.14, 2.60] |
| Age: 50 to 59 years old | 0.81 [0.50, 1.31] | 1.34 [0.93, 1.94] |
| Age: 60 to 69 years old | ref | ref |
| Age: 70 to 79 years old | 0.77 [0.47, 1.26] | 0.99 [0.67, 1.46] |
| Age: 80 years old and over | 1.06 [0.55, 2.06] | 1.67* [1.06, 2.65] |
| Highest educational qualification: Level 4 and above | ref | ref. |
| Highest educational qualification: Below Level 4 | 1.72*** [1.29, 2.31] | 1.58*** [1.25, 2.00] |
| Ethnic background: White | ref | ref |
| Ethnic background: Not White | 1.45 [0.94, 2.26] | 1.14 [0.78, 1.66] |
| Marital status: Married or in CP | ref | ref |
| Marital status: Single and never married | 0.64* [0.42, 0.97] | 0.86 [0.65, 1.15] |
| Marital status: Separated, divorced or widowed | 0.92 [0.60, 1.42] | 0.93 [0.70, 1.24] |
| Employment status: in employment | ref | ref |
| Employment status: Unemployed | 0.73 [0.22, 2.41] | 1.04 [0.51, 2.15] |
| Employment status: Economically inactive | 1.02 [0.71, 1.46] | 1.21 [0.90, 1.62] |
| Disability status: No long-term conditions | ref | ref |
| Disability status: LTCs but day-to-day activities not limited | 0.85 [0.49, 1.48] | 0.66 [0.42, 1.04] |
| Disability status: LTCs and day-to-day activities limited a bit | 1.91** [1.24, 2.93] | 1.17 [0.81, 1.67] |
| Disability status: LTCs and day-to-day activities limited a lot | 2.61*** [1.61, 4.23] | 1.70** [1.14, 2.54] |
Note: *p < 0.05; *p < 0.01; **p < 0.001. RRR = Relative Risk Ratio; CI = Confidence Interval. CP = Civil Partnership. Diary sample household weights (W2) applied with GOR as strata variable.
7. Results: sample composition
The first part of this chapter aims to determine which experimental group most accurately represented the target population before applying any post-survey adjustments. To do so, the unweighted distributions of key socio-demographic variables between the achieved treatment and control samples are compared, using 2021 Census data as a benchmark. This is with the exception of the Index of Multiple Deprivation and Urban-Rural Classification which are not included in the Census.
Dissimilarity indices were computed to assess the relative representativeness of each sample. For each socio-demographic factor, d was computed as the sum of the absolute difference between the sample proportion and the benchmark proportion, divided by half. The dissimilarity index is interpreted as the proportion of observations that would need to change categories in the experimental conditions to achieve perfect agreement with the benchmark data. A value of d ≤ 0.10 suggests ‘good’ agreement, while d ≤ 0.05 denotes ‘very good’ agreement.
The second part of this chapter applies a multivariate logistic regression model to estimate which socio-demographic factors, if any, predicted individuals’ propensity to complete digital (versus paper) diaries, within the treatment group.
7.1 How does the representativeness of the achieved treatment and control samples compare?
The digital-first approach was not associated with a substantial improvement or decline in the overall representativeness of the NTS sample. The treatment and control groups were similarly representative in terms of household tenure, household size, age, sex, disability status, marital status, and employment status. There were small differences between the experimental groups with respect to some other key characteristics. The treatment group was slightly less representative than the control with respect to ethnic background and deprivation but slightly more representative with respect to education. Urbanicity was the only socio-demographic factor where substantial differences were observed between the groups. Table 7.1 provides the unweighted distributions of socio-demographic factors such as deprivation, household tenure and age.
Table 7.1 displays the unweighted distribution of key socio-demographic characteristics for the digital-first and paper-only groups, against population benchmarks. Table 7.2 presents the dissimilarity index for each characteristic for both experimental groups.
Table 7.1: Distribution of socio-demographic characteristic by experimental group
Base: Fully productive sample, household- and individual-level (depending on characteristic, see Table 7.1 notes), unweighted.
| Socio-demographic characteristic | Population estimate | Treatment group | Control group |
|---|---|---|---|
| Index of multiple deprivation: 1st decile (Most deprived) | 10% | 7.8% | 6.5% |
| Index of multiple deprivation: 2nd decile | 10.0% | 6.1% | 9.6% |
| Index of multiple deprivation: 3rd decile | 10.0% | 8.6% | 7.1% |
| Index of multiple deprivation: 4th decile | 10.0% | 10.1% | 9.5% |
| Index of multiple deprivation: 5th decile | 10.0% | 7.1% | 9.7% |
| Index of multiple deprivation: 6th decile | 10.0% | 12.8% | 11.5% |
| Index of multiple deprivation: 7th decile | 10.0% | 11.3% | 11.8% |
| Index of multiple deprivation: 8th decile | 10.0% | 9.9% | 12.1% |
| Index of multiple deprivation: 9th decile | 10.0% | 13.2% | 10.3% |
| Index of multiple deprivation: 10th decile (Least deprived) | 10% | 13.2% | 11.8% |
| Household size: One | 30.1% | 32.3% | 30.1% |
| Household size: Two | 34.0% | 38.0% | 41.0% |
| Household size: Three | 16.0% | 13.2% | 12.9% |
| Household size: Four | 12.9% | 10.7% | 11.3% |
| Household size: Five or more | 6.9% | 5.9% | 4.8% |
| Household tenure: Owns or part owns | 62.3% | 74.2% | 73.9% |
| Household tenure: Does not own or part own | 37.7% | 25.8% | 26.1% |
| Urbanicity: Lives in an urban area | 82.9% | 74.5% | 80.5% |
| Urbanicity: Lives in an rural area | 17.1% | 25.5% | 19.5% |
| Age: 0 to 9 years old | 11.3% | 9.1% | 9.9% |
| Age: 10 to 19 years old | 11.7% | 11.8% | 9.7% |
| Age: 20 to 29 years old | 12.6% | 8.0% | 7.4% |
| Age: 30 to 39 years old | 13.7% | 10.8% | 10.3% |
| Age: 40 to 49 years old | 12.7% | 12.2% | 12.3% |
| Age: 50 to 59 years old | 13.6% | 12.8% | 13.7% |
| Age: 60 to 69 years old | 10.7% | 15.5% | 16.1% |
| Age: 70 to 79 years old | 8.6% | 14.5% | 14.0% |
| Age: 80 years old and over | 4.9% | 5.4% | 6.7% |
| Sex: Female | 51.0% | 51.2% | 50.5% |
| Sex: Male | 49.0% | 48.9% | 49.5% |
| Disability status: No long term conditions (LTCs) | 75.9% | 73.4% | 74.7% |
| Disability status: LTCs but day to day activities not limited | 6.8% | 8.7% | 8.3% |
| Disability status: LTCs but day to day activities limited a bit | 10.0% | 10.1% | 9.6% |
| Disability status: LTCs but day to day activities limited a lot | 7.3% | 7.8% | 7.4% |
| Highest educational qualification[footnote 1]: Level 4 or equivalent and above | 33.9% | 49.9% | 53.2% |
| Highest educational qualification[footnote 1]: Below Level 4 or equivalent | 66.1% | 50.1% | 46.9% |
| Employment status: Employed[footnote 1] | 57.4% | 54.2% | 53.2% |
| Employment status: Unemployed[footnote 1] | 3.5% | 0.5% | 1.4% |
| Employment status: Economically[footnote 1] inactive | 39.1% | 45.3% | 45.5% |
| Marital status: Divorced, widowed or separated[footnote 1] | 17.4% | 16.1% | 16.2% |
| Marital status: Married or in civil partnership[footnote 1] | 44.7% | 56.2% | 55.7% |
| Marital status: Never married or in civil partnership[footnote 1] | 37.9% | 27.7% | 28.2% |
| Ethnic background: Not White | 19.0% | 13.3% | 16.9% |
| Ethnic background: White | 81.0% | 86.7% | 83.1% |
Note: Index of multiple deprivation, household size, and household tenure were recorded at the household level, whilst all other variables were recorded at the individual level (see Appendix 1 for more information). Percentages may not sum to 100% due to rounding discrepancies.
Table 7.2: Unweighted dissimilarity indices by experimental group for fully productive households
Base: Fully productive sample, household- and individual-level (depending on characteristic, see Table 7.1 notes), unweighted.
| Socio-demographic characteristic | Treatment group | Control group |
|---|---|---|
| Index of multiple deprivation | 0.11 (Not good) | 0.08 (Good) |
| Household size | 0.06 (Good) | 0.07 (Good) |
| Household tenure | 0.12 (Not good) | 0.12 (Not good) |
| Urbanicity | 0.10 (Good) | 0.03 (Very good) |
| Age | 0.11 (Not good) | 0.13 (Not good) |
| Sex | 0.00 (Very good) | 0.01 (Very good) |
| Disability status | 0.03 (Very good) | 0.02 (Very good) |
| Highest educational qualification[footnote 1] | 0.16 (Not good) | 0.19 (Not good) |
| Employment status[footnote 1] | 0.06 (Good) | 0.06 (Good) |
| Marital status[footnote 1] | 0.12 (Not good) | 0.11 (Not good) |
| Ethnic background | 0.06 (Good) | 0.02 (Very good) |
Note: Dissimilarity indices computed for each socio-demographic characteristics, using the categories presented in Table 7.1. For highest educational qualification, the reported index should be interpreted with some caution due to a known issue in the underlying calculation. However, this does not affect the substantive conclusions drawn.
7.2 Which socio-demographic characteristics predict digital response?
The multivariate logistic regression model, for those aged 16 and over, suggests that age, ethnic background and marital status were associated with the likelihood of respondents completing digital (versus paper) diaries, whilst sex, education, and disability status had no effect. Table 7.3 presents the full results of this model.
Table 7.3: Multivariate logistic regression model showing the effect of socio-demographic variables on the likelihood of completing a digital (versus paper) diary
Base: Fully productive treatment sample aged 16 and over, individual-level, weighted by diary sample household weight (W2).
| Socio-demographic characteristic | Odds ratio [95% CI] |
|---|---|
| Sex: Female | ref |
| Sex: Male | 0.92 [0.75, 1.14] |
| Age: 16 to 25 years old | 3.79* [1.38, 10.35] |
| Age: 26 to 39 years old | 2.27* [1.02, 5.08] |
| Age: 40 to 49 years old | 1.81 [0.95, 3.44] |
| Age: 50 to 59 years old | 1.23 [0.67, 2.24] |
| Age: 60 to 69 years old | ref |
| Age: 70 to 79 years old | 0.66 [0.37,1.17] |
| Age: 80 years old and over | 0.54 [0.25, 1.14] |
| Highest educational qualification: Below Level 4 | 0.69 [0.44, 1.08] |
| Highest educational qualification: Level 4 or above | ref |
| Ethnic background: White | ref |
| Ethnic background: Not White | 0.31* [0.12, 0.81] |
| Marital status: Married or in Civil Partnership | ref |
| Marital status: Single and never married | 0.51* [0.27, 0.98] |
| Marital status: Separated, divorced or widowed | 0.67 [0.35, 1.26] |
| Employment status: In employment | ref |
| Employment status: Unemployed | 0.23 [0.05, 1.05] |
| Employment status: Economically inactive | 0.79 [0.46, 1.35] |
| Disability status: No long-term conditions | ref |
| Disability status: LTCs but day-to-day activities not limited | 0.66 [0.30, 1.45] |
| Disability status: LTCs and day-to-day activities limited a bit | 0.67 [0.37, 1.20] |
| Disability status: LTCs and day-to-day activities limited a lot | 0.70 [0.38, 1.30] |
Note: *p < 0.05; *p < 0.01; **p < 0.001. Statistics in parentheses are 95% confidence intervals of odds ratios. Diary sample household weights (W2) applied with GOR as strata variable. Unweighted sample size = 849. F = 2.11, p < 0.01.
Respondents aged 16 to 25 and 26 to 39 were significantly more likely to complete diaries digitally compared to those aged 60 to 69 (OR = 3.79, p < 0.01 and OR = 2.27, p = 0.05 respectively), after controlling for other socio-demographic factors.
Respondents who were single and had never married were less likely to complete digitally compared to those who were married or in a civil partnership (OR = 0.51, p = 0.04). No significant differences were observed for those who were separated, divorced or widowed (OR = 0.67, p = 0.21).
Non-White respondents were significantly less likely to complete digital diaries than White respondents (OR = 0.31, p = 0.02).
8. Results: substantive estimates
In this chapter, key substantive trip estimates are compared between the experimental and intra-treatment groups.
Weekly trip rates, day 1 trip rates, day 7 trip rates and no travel rates are compared using unweighted data to facilitate comparisons with internal NTS interim figures. As a result, differences between groups may be smaller or larger than they would have been if survey weights had been applied. Statistical significance was assessed using two-tailed independent samples t-tests for trip rates and a Chi-squared test for no travel rates.
Trip purpose and travel mode are compared using weighted distributions. Given the relatively small effective sample size of the treatment group and the very low prevalence of some categories across both groups, comparisons were made on a descriptive basis. Emphasis was placed on assessing the magnitude and pattern of differences between groups, with any notable similarities or differences discussed.
Mean distances travelled and the number of stages were compared using weighted data. Differences between groups were assessed using Wald F tests.
Short walk distance distributions were compared using weighted data. Differences between groups were assessed using a design-based Chi-squared test.
Finally, the propensity to round distances was compared using weighted data.
8.1 Weekly trip rates
A key metric on the NTS is the average number of trips made per week by residents of England. The unweighted average number of trips for those exposed to the digital-first approach (M = 13.3) was slightly lower than those exposed to the paper-only approach (M = 13.6) but the difference was not statistically significant across the quarter (t = 0.78, p = 0.44).
Out of the treatment group, there was no significant difference in the unweighted weekly trip rate between those who completed digital (M = 13.5) or paper diaries (M = 12.8) (t = 1.38, p = 0.17). These differences may also reflect differences in the sample profile between those completing digital and paper diaries, and should not be inferred as estimates of differential trip reporting.
Table 8.1 presents the unweighted mean weekly trip rates for the experimental and intra-treatment groups, for each fieldwork month and for the full quarter.
Table 8.1. Mean weekly trip rates by experimental and intra-treatment group
Base: Fully productive sample, individual-level, unweighted.
| Fieldwork period | Treatment group trip rate | Control group trip rate | Compliant treatment group trip rate | Non-compliant treatment group trip rate |
|---|---|---|---|---|
| January | 13.55 | 13.55 | 13.59 | 13.49 |
| February | 14.07* | 12.83 | 14.08 | 14.07 |
| March | 12.60*** | 14.05 | 13.12* | 11.57* |
| Full quarter | 13.28 | 13.50 | 13.53 | 12.83 |
| Base (individuals) | 1,170 | 3,632 | 755 | 415 |
Note: Unweighted number of respondents and mean weekly trip rates. *p < 0.05, *p < 0.01, **p < 0.001. Asterisks in the treatment group column denote the significance of two-tailed independent-samples t-tests comparing the mean of the treatment group with that of the control group. Asterisks in the compliant treatment group column denote the significance of two-tailed independent-samples t-tests comparing the mean of the compliant treatment group with that of the non-compliant treatment group.
The trip rate estimates across both groups were broadly in line with 2023 survey estimates. Figure 8.1 presents the monthly unweighted trip rate for the digital-first and paper-only groups for the first quarter of 2024 against those in 2023.
Figure 8.1. Mean weekly trip rates by experimental group (January 2023 to March 2024)
Base: Fully productive sample, individual-level, unweighted.
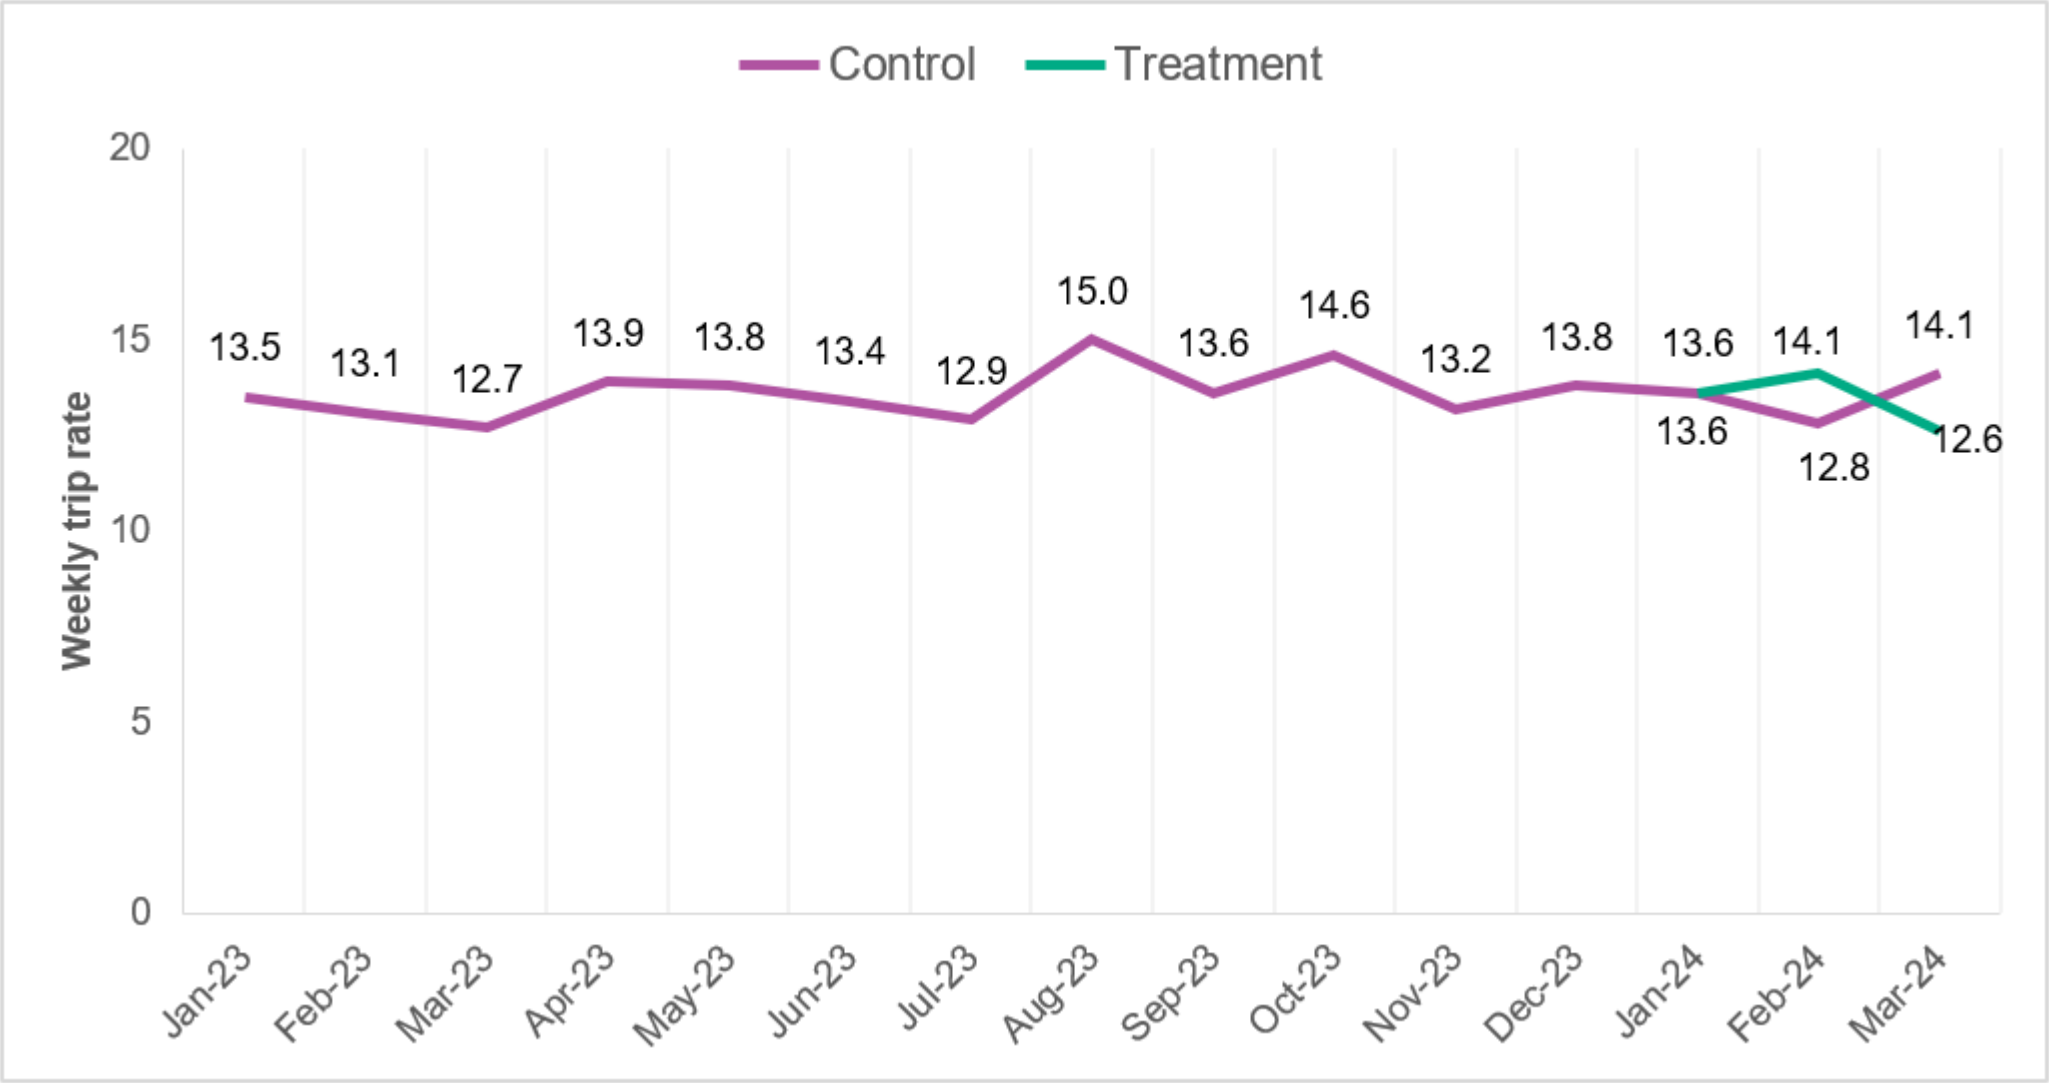
Figure 8.1 is a line graph representing the unweighted number of weekly recorded trip rates from January 2023 to March 2024. One line represents the control (paper-only) group which has monthly values for the entire period. The other line represents the treatment group (digital-first) which has monthly values for January, February and March 2024 only. Both groups have broadly stable trip rates across the period. The treatment group’s weekly trips range from 12.6 to 14.1 trips per week. The control group’s range from 12.6 to 15.0 trips per week.
8.2 Day 1 trip rates
The day 1 trip rate is the number of trips recorded on the first day of the respondent’s travel week. The unweighted day 1 trip rate was broadly comparable across the digital-first (M = 2.4) and paper-only (M = 2.5) approaches, with no significant difference for the full quarter (t = 1.60, p = 0.11).
Within the treatment group, there was also no significant difference in the day 1 trip rate between those who completed digital or paper diaries (t = 0.08, p = 0.93). This comparison, however, does not isolate differences across modes arising to measurement or selection differences.
Table 8.2 presents the unweighted mean weekly trip rates for the experimental and intra-treatment groups, for each fieldwork month and for the full quarter. There were no significant differences within each month between either the experimental or intra-treatment groups. This is with the exception of the March fieldwork month, where the digital-first approach produced a mean day 1 trip rate around 0.3 trips lower than the paper-first approach, representing a significant difference (t = 3.38, p < 0.001).
Table 8.2. Mean day 1 trip rates by experimental and intra-treatment group for each month and the full quarter
Base: Fully productive sample, individual-level, unweighted.
| Fieldwork period | Treatment group trip rate | Control group trip rate | Compliant treatment group trip rate | Non-compliant treatment group trip rate |
|---|---|---|---|---|
| January | 2.39 | 2.42 | 2.31 | 2.49 |
| February | 2.55 | 2.42 | 2.51 | 2.68 |
| March | 2.21*** | 2.53 | 2.29 | 2.05 |
| Full quarter | 2.36 | 2.46 | 2.36 | 2.35 |
| Base (individuals) | 1,170 | 3,632 | 755 | 415 |
Note: Unweighted number of respondents and mean average day 1 trip rates. * p <0.05, ** p <0.01, *** p <0.001. Asterisks in the treatment group column denote the significance of two-tailed independent-samples t-tests comparing the mean of the treatment group with that of the control group. Asterisks in the compliant treatment group column denote the significance of two-tailed independent-samples t-tests comparing the mean of the compliant treatment group with that of the non-compliant treatment group.
The day 1 trip rate estimates across both approaches were also broadly in line with 2023 survey estimates. Figure 8.2 presents the monthly mean unweighted day 1 trip rate for the digital-first and paper-only groups for the first quarter of 2024 against those in 2023. The digital-first group shows greater month-on-month volatility than the comparative paper-only group, likely due to its smaller sub-sample size.
Figure 8.2: Mean day 1 trip rates by experimental group (January 2023 to March 2024)
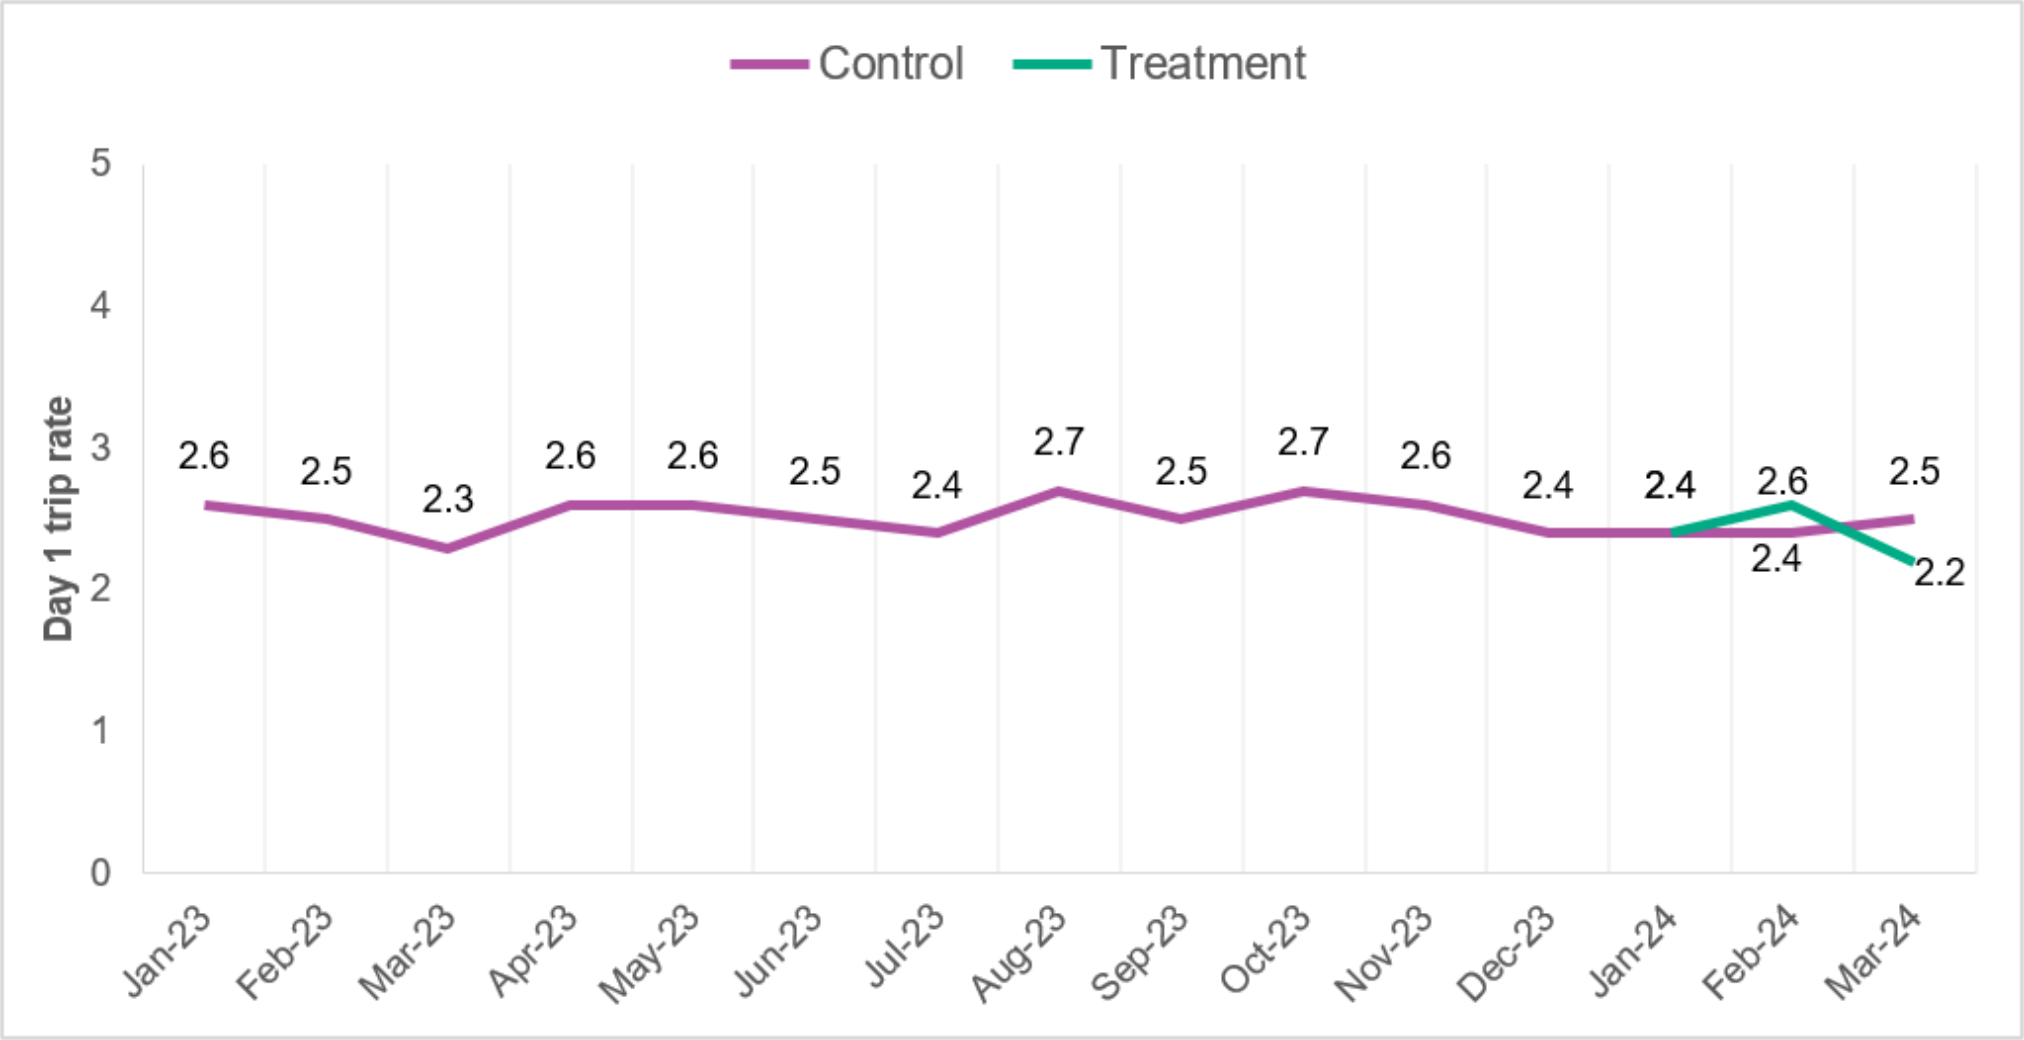
Figure 8.2 is a line graph representing the unweighted number of weekly recorded trip rates from January 2023 to March 2024. One line represents the control (paper-only) group which has monthly values for the entire period. The other line represents the treatment group (digital-first) which has monthly values for January, February and March 2024 only. Both groups are shown to have stable trip rates over time. The treatment group’s day 1 trip rate ranges from 2.2 to 2.6 day 1 trips, while the control group’s ranges from 2.3 to 2.7 day 1 trips.
8.3 Day 7 trip rates
The day 7 rate is the number of trips recorded on the final day of the respondent’s travel week. Again, the unweighted day 7 trip rate was broadly comparable across the digital-first (M = 1.7) and paper-only (M = 1.6) approaches, with no significant difference for the full quarter (t = -1.42, p = 0.16).
Within the treatment group, there was also no significant difference in the day 7 trip rate between those who completed digital (M = 1.8) or paper (M = 1.7) diaries (t = 1.01, p = 0.32). This comparison, however, does not isolate differences across modes arising to measurement or selection differences.
Table 8.3 presents the unweighted mean day 7 trip rates for the experimental and intra-treatment groups, for each fieldwork month and for the full quarter. For the January fieldwork month, there was no significant difference in the mean day 7 trip rate between the experimental or intra-treatment groups. For the February fieldwork month, there was a significant difference between the experimental groups (t = -2.95, p < 0.01), with the digital-first group reporting around 0.3 trips more, on average, than the paper-only group. For the March fieldwork month, there was a significant difference between the intra-treatment groups (t = 2.25, p = 0.03), with the digital group reporting around 0.4 trips more, on average, than the paper group.
Table 8.3. Mean day 7 trip rates by experimental and intra-treatment group for each month and the full quarter
Base: Fully productive sample, individual-level, unweighted.
| Fieldwork period | Treatment group trip rate | Control group trip rate | Compliant treatment group trip rate | Non-compliant treatment group trip rate |
|---|---|---|---|---|
| January | 1.81 | 1.66 | 1.73 | 1.91 |
| February | 1.90** | 1.57 | 1.94 | 1.81 |
| March | 1.60 | 1.75 | 1.71* | 1.37 |
| Full quarter | 1.74 | 1.66 | 1.78 | 1.68 |
| Base (individuals) | 1,170 | 3,632 | 755 | 415 |
Note: Unweighted number of respondents, and mean average day 7 trip rates. * p <0.05, ** p <0.01, *** p <0.001. Asterisks in the treatment group column denote the significance of two-tailed independent-samples t-tests comparing the mean of the treatment group with that of the control group. Asterisks in the compliant treatment group column denote the significance of two-tailed independent-samples t-tests comparing the mean of the compliant treatment group with that of the non-compliant treatment group.
The day 7 trip rate estimates across both approaches were also broadly in line with 2023 survey estimates. Figure 8.3 presents the monthly mean unweighted day 1 trip rate for the digital-first and paper-only groups for the first quarter of 2024 against those in 2023. The digital-first group shows greater month-on-month volatility than the comparative paper-only group, likely due to its smaller sub-sample size.
Figure 8.3. Unweighted day 7 trip rates by experimental group (January 2023 to March 2024
Base: Fully productive sample, individual-level, unweighted.
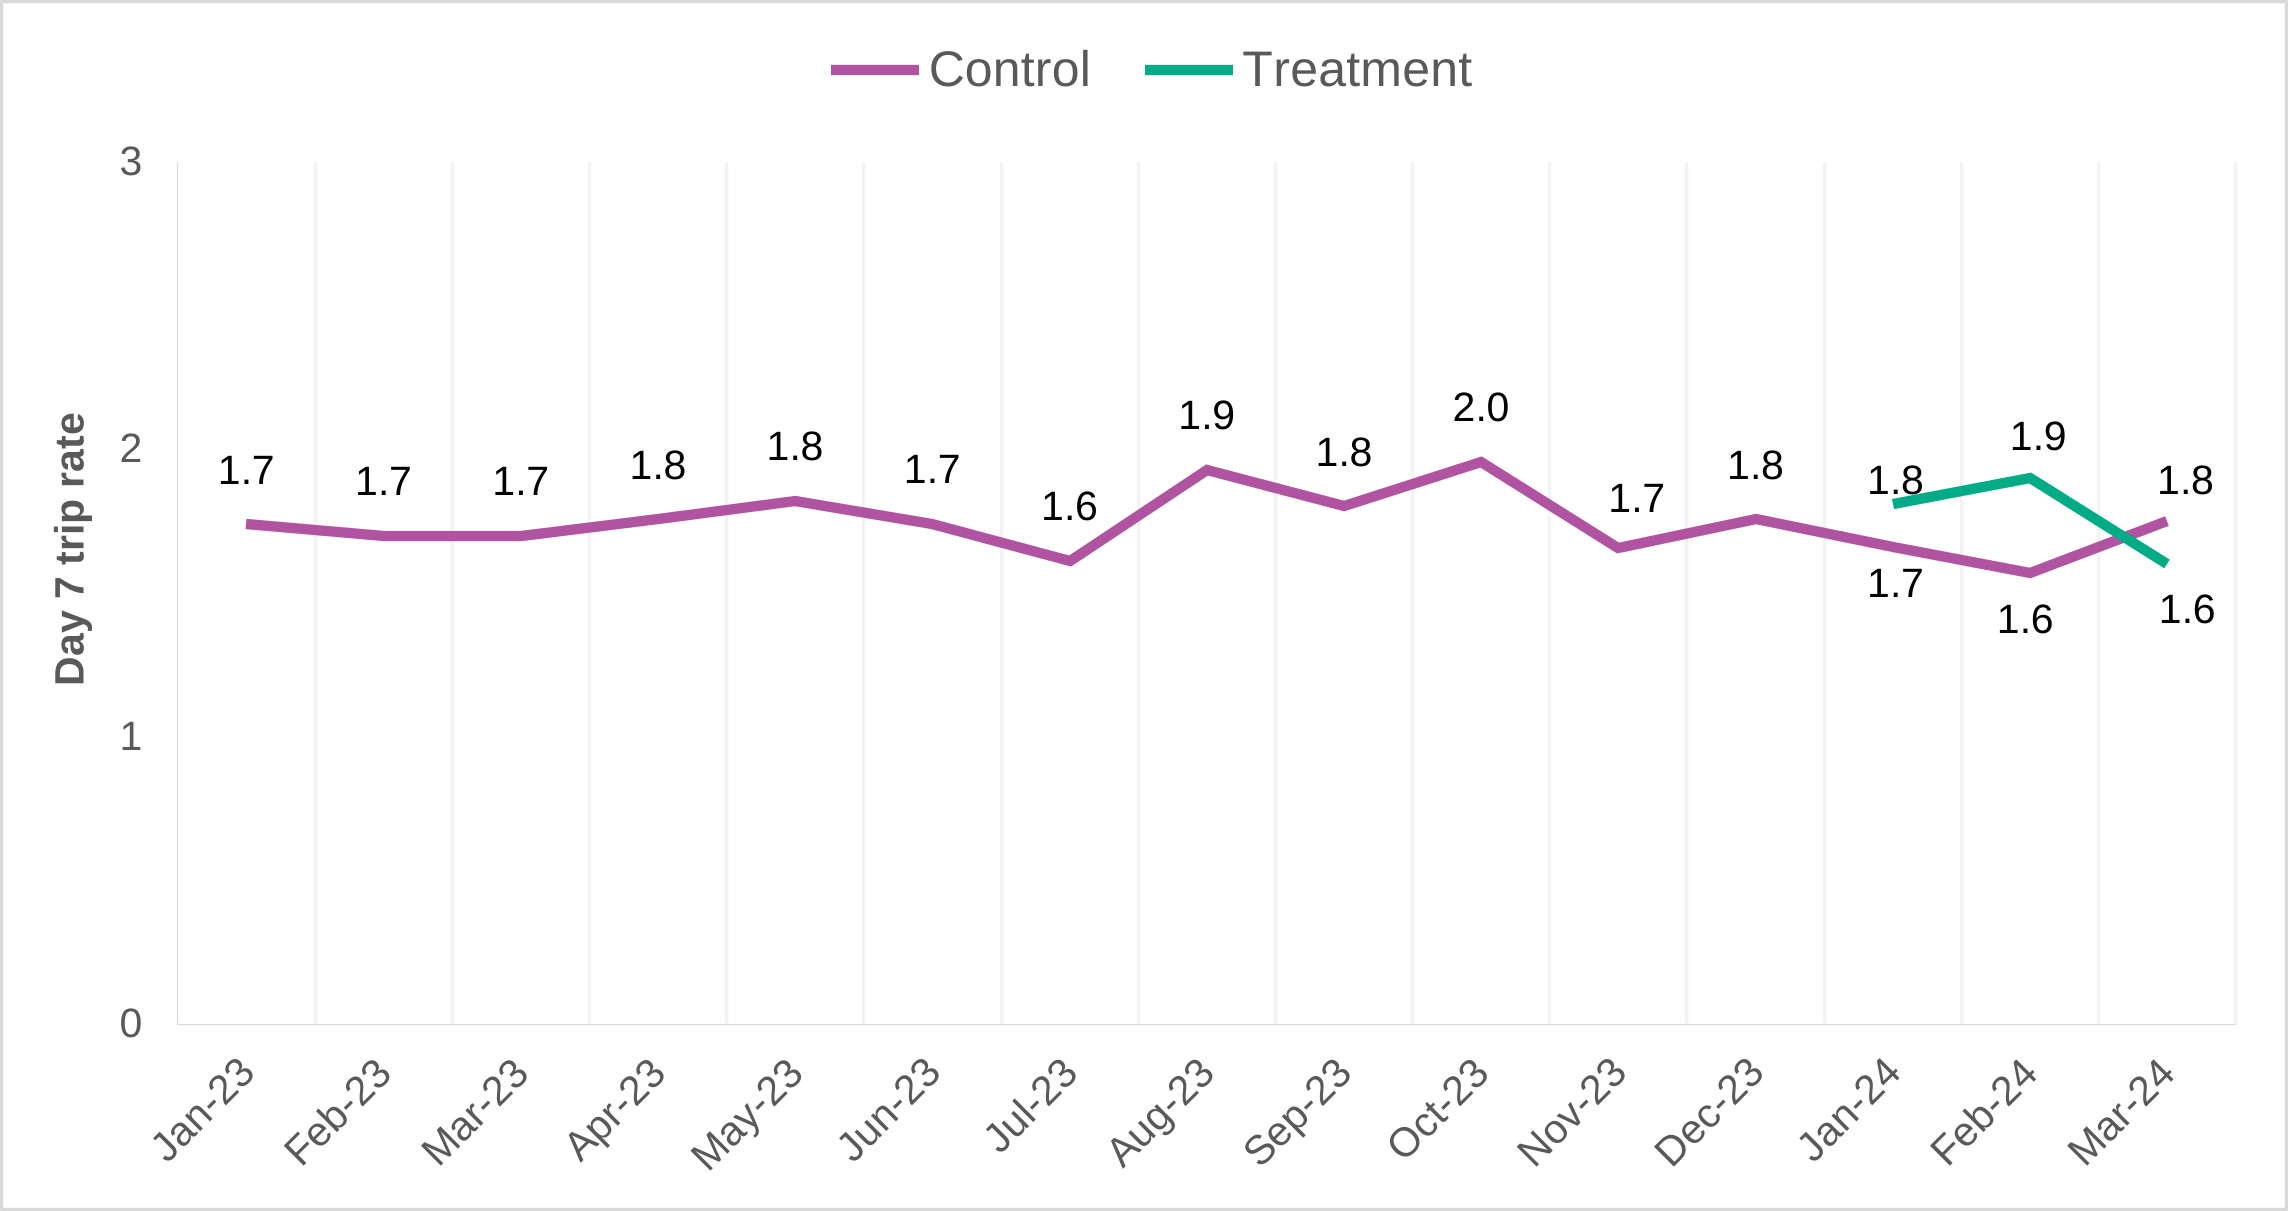
Figure 8.3 shows a line graph representing the unweighted number of day 7 recorded trip rates from January 2023 to March 2024. One line represents the control (paper only) group which continues across the entire period. The other line represents the treatment group (digital-first) which has monthly values for January, February and March 2024 only . Both groups have stable unweighted day 7 trip rates over time. The treatment group’s monthly figure ranges between 1.6 and 1.9. The control group’s monthly figure ranges between 1.6 and 2.0.
8.4 No travel rates
The no travel rate refers to the proportion of respondents that did not undertake any eligible trips during the travel week.
For the full quarter, there was no significant difference in the no travel rate between the digital-first (4.1%) and paper-only (4.0%) groups (Chi-squared = 0.04, p = 0.83).
Within the treatment group, there was also no significant difference (Chi-squared = 0.87, p = 0.35) in the no travel rate between the digital (4.5%) and paper (3.4%) groups.
Table 8.4 presents the unweighted no travel rates for the experimental and intra-treatment groups, for each fieldwork month and for the full quarter. In the January fieldwork month, the no travel rate was markedly lower for the treatment group (2.1%) compared to the control (4.6%), representing a significant difference (Chi-squared = 4.39, p = 0.04). However, in the March fieldwork month, it was markedly higher for the treatment group (5.0%) than the control (2.8%), again representing a significant difference (Chi-squared = 4.95, p = 0.03). There is, therefore, no clear pattern to suggest that the digital-first approach produces lower or higher no travel rates than the paper-only approach.
Among those in the digital-first approach, across each fieldwork month, and for the full quarter, there were no significant differences in the mean no travel rate between those completing digital and paper diaries.
Table 8.4. No travel rate by experimental and intra-treatment group for each month and the full quarter
Base: Fully productive sample, individual-level, unweighted.
| Fieldwork period | Treatment group (mean) | Control group (mean) | Compliant treatment group (mean) | Non-compliant treatment group (mean) |
|---|---|---|---|---|
| January | 2.1%** | 4.6% | 1.5% | 2.9% |
| February | 5.1% | 4.6% | 5.5% | 4.0% |
| March | 5.0%* | 2.8% | 5.7% | 3.6% |
| Full quarter | 4.1% | 4.0% | 4.5% | 3.4% |
| Base (individuals) | 1,170 | 3,632 | 755 | 415 |
Note: Unweighted frequency data of the number of respondents and no travel rate. * p < 0.05, ** p < 0.01, *** p < 0.001. Asterisks in the treatment group column denote the significance of Chi-squared tests comparing estimates for the experimental groups. Asterisks in the compliant treatment group column denote the significance of Chi-squared tests comparing estimates for the intra-treatment groups.
The no travel rate estimates across both approaches were also broadly in line with 2023 survey estimates. Figure 8.4 presents the monthly unweighted no travel rate for the digital-first and paper-only groups for the first quarter of 2024 against those in 2023. The digital-first group showed greater month-on-month volatility than the comparative paper-only group during the first half of 2024, likely due to its smaller sub-sample size.
Figure 8.4. Unweighted no travel rate by experimental group (January 2023 to March 2024)
Base: Fully productive sample, individual-level, unweighted.

Figure 8.4 shows a line graph representing the unweighted proportion of diaries with no travel recorded from January 2023 to March 2024. One line represents the control (paper only) group which continues across the entire period. The other line represents the treatment (digital-first) group which has monthly values for January, February and March 2024 only. For the control (paper-only) group, the monthly mean no travel rate is 4%. All months are within 1 percentage point of this value, apart from June and July 2023 where the value is notably higher at 5.5% and 7.1% respectively. For the treatment group, the monthly mean values in 2024 are 2.1%, 5.1% and 5.0%.
8.5 Trip purposes
A key metric collected by the NTS is the purpose of respondents’ trips.
As Figure 8.5 shows, the distribution of trip purposes was broadly comparable between the experimental groups, with going to work and commuting home being the most frequent reasons provided across both groups. Between-group differences for each category were small, at below 1.5 percentage points.
Figure 8.5: Trip purposes by experimental group
Base: Fully productive sample, individual-level, weighted by diary sample household weight (W2).
| Trip purpose | Control | Treatment |
|---|---|---|
| Home | 43.3% | 44.8% |
| Work | 8.5% | 10.0% |
| (Day) Trip/just walk | 6.0% | 5.1% |
| Visit friends | 5.4% | 4.6% |
| Food and grocery shopping | 4.9% | 4.0% |
| Entertainment/public activity | 3.8% | 3.9% |
| Education | 3.5% | 3.8% |
| Other types of shopping | 4.0% | 3.6% |
| Escort - education | 3.1% | 3.3% |
| Personal business - other | 3.3% | 3.0% |
| Eat/drink - other occasions | 2.3% | 2.3% |
| Other escort | 1.8% | 2.1% |
| Escort - shopping/personal | 2.2% | 1.9% |
| Sport (participate) | 1.1% | 1.4% |
| In course of work | 2.0% | 1.3% |
| Personal business - medical | 1.5% | 1.3% |
| Escort - work | 0.9% | 1.1% |
| Other social | 0.8% | 1.0% |
| Holiday base | 1.1% | 0.9% |
| Escort - home (not own) | 0.4% | 0.5% |
As Figure 8.6 shows, the distribution of trip purposes was also similar between the intra-treatment groups. Between-group differences for each category were also small. The largest difference was 1.6 percentage points in the work category.
Figure 8.6: Trip purposes by intra-treatment group
Base: Fully productive treatment sample, journey-level, weighted by diary sample household weight (W2).
| Category | Paper (non-compliant treatment) | Digital (compliant treatment) |
|---|---|---|
| Home | 44.9% | 44.8% |
| Work | 8.9% | 10.5% |
| (Day) Trip/just walk | 5.2% | 5.0% |
| Visit friends | 4.9% | 4.5% |
| Education | 3.7% | 3.9% |
| Entertainment/public activity | 4.0% | 3.8% |
| Food and grocery shopping | 4.9% | 3.5% |
| Escort - education | 3.1% | 3.4% |
| Other types of shopping | 4.2% | 3.3% |
| Personal business - other | 2.8% | 3.1% |
| Other escort | 1.4% | 2.5% |
| Escort - shopping/personal | 1.3% | 2.2% |
| Eat/drink - other occasions | 2.5% | 2.1% |
| Sport (participate) | 1.1% | 1.5% |
| In course of work | 1.3% | 1.2% |
| Escort - work | 1.2% | 1.0% |
| Holiday base | 0.7% | 1.0% |
| Other social | 1.0% | 1.0% |
| Personal business - medical | 2.3% | 0.9% |
| Escort - home (not own) | 0.4% | 0.6% |
8.6 Distances
Another important metric produced by the NTS is trip distance.
As Figure 8.7 shows, the reported distances were broadly comparable between the experimental groups. The mean distance was 7.7 miles for the digital-first group and 7.8 miles for the control group. The most common distance category was between 1 and less than 2 miles across both the digital-first (24.7%) and paper-only (23.9%) groups.
The digital-first group (7.5%) had a lower proportion of trips of less than 1 mile compared to the paper-only group (8.9%). This should be monitored when the digital-first approach is launched at full scale in 2025, in case the digital-first approach leads to under-reporting of shorter trips.
Figure 8.7: Trip distances by experimental group
Base: Fully productive treatment sample, weighted by diary sample household weight (W2).
| Distance | Control | Treatment |
|---|---|---|
| Under 1 mile | 8.9% | 7.5% |
| 1 to under 2 miles | 23.9% | 24.7% |
| 2 to under 3 miles | 14.1% | 13.2% |
| 3 to under 5 miles | 17.2% | 17.3% |
| 5 to under 10 miles | 17.1% | 18.8% |
| 10 to under 25 miles | 13.0% | 13.1% |
| 25 to under 50 miles | 3.5% | 3.4% |
| 50 to under 100 miles | 1.4% | 1.4% |
| 100 miles and over | 0.8% | 0.7% |
Note: Diary sample household weight (W2) applied with GOR as strata variable.
Among the digital-first group, digital diaries reported a higher average distance (M = 8.2 miles) than paper diaries (M = 6.8 miles). However, a smaller proportion were under 1 mile (digital = 6%, paper = 11%). Especially given the systematic differences in the profile of those completing digital and paper diaries established in the chapter which socio-demographic characteristics predict digital response, this suggests that those who completed digital diaries may have under-reported trips with shorter distances.
Figure 8.8: Trip distances by intra-treatment group
Base: Fully productive treatment sample, weighted by diary sample household weight (W2).
| Distance band | Paper (non-compliant) | Digital (compliant) |
|---|---|---|
| Under 1 mile | 10.8% | 5.9% |
| 1 to under 2 miles | 24.4% | 24.8% |
| 2 to under 3 miles | 14.9% | 12.4% |
| 3 to under 5 miles | 17.6% | 17.1% |
| 5 to under 10 miles | 14.9% | 20.7% |
| 10 to under 25 miles | 12.5% | 13.4% |
| 25 to under 50 miles | 3.3% | 3.5% |
| 50 to under 100 miles | 1.3% | 1.4% |
| 100 miles and over | 0.4% | 0.8% |
Note: Diary sample household weights (W2) applied with GOR as strata variable.
8.7 Short walks
On day 1 only, NTS respondents are asked to record short walks, defined as those 1 mile and below.
A slightly lower proportion of walking stages were below 1 mile for those exposed to the digital-first approach (20.9%) compared to the paper-only approach (24.9%), out of fully productive households. This difference was more pronounced between the intra-treatment groups: 17.9% of walking stages were below 1 mile for digital diaries, compared to 27.1% for paper diaries. Whilst these differences were insignificant between the experimental (F = 1.52, p = 0.22) and intra-treatment (F = 2.97, p = 0.09) groups, this suggests that the digital-first approach may reduce respondents’ propensity to report short walks.
Table 8.5 presents the proportion of walking stages that were below 1 mile versus equal to or above 1 mile for the experimental and intra-treatment groups.
Table 8.5: Distance distributions of walking stages by experimental and intra-treatment group
Base: Walking sample belonging to fully productive individuals, stage-level, weighted by diary sample household weight (W2).
| DV: Distance of walking stages | Treatment group | Control group | Compliant treatment group | Non-compliant treatment group |
|---|---|---|---|---|
| Below 1 mile | 20.9% | 24.9% | 17.9% | 27.1% |
| 1 mile or above | 79.1% | 75.2% | 82.2% | 72.9% |
| Base (stages) | 2,021 | 7,076 | 1,341 | 680 |
Note: *p < 0.05; *p < 0.01; **p < 0.001. Diary sample household weights (W2) applied with GOR as strata variable.
8.8 Distance rounding
Rounding refers to reporting trip distances that end in a 0 or 5. It is assumed that non-rounded distances generally provide more accurate trip information, which increases the validity and reliability of trip estimates.
Qualitative research from the Parallel Run illuminated that some respondents used applications such as Google Maps to judge journey distances when completing their diaries. The use of these applications may contribute to a lower prevalence of distance rounding in digital diaries, ultimately improving the precision of distance estimates. It is plausible to expect that digital respondents may be more likely to use these apps to report travel distances, given that they already engaging with an online device when completing their diary.
A similar proportion of stages were rounded in the treatment group (74.7%) compared to the control group (73.1%).
Within the digital-first approach, the proportion of stages with rounded distances was 6pp lower for the digital group (72.7%) compared to the paper group (78.8%). This suggests that digital diaries could improve the validity and reliability of distance estimates.
Table 8.6 shows the prevalence of rounding to zero, half, or either, for both the experimental and intra-treatment groups.
Table 8.6: Distance rounding by experimental and intra-treatment group
Base: Fully productive sample, stage-level, weighted by diary sample household weight (W2).
| Rounding type | Treatment group (%) | Control group (%) | Compliant treatment group (%) | Non-compliant treatment group (%) |
|---|---|---|---|---|
| To zero | 60.5 | 57.5 | 58.8 | 64.1 |
| To half | 14.1 | 15.6 | 13.9 | 14.6 |
| Either | 74.7 | 73.1 | 72.7 | 78.8 |
| Base (stages) | 15,526 | 48,998 | 10,203 | 5,323 |
Note: Diary sample household weight (W2) applied with GOR as strata variable.
8.9 Travel mode
The NTS also provides estimates on the travel modes, such as car or bus, used to complete trips.
As Figure 8.9 shows, the distribution of travel mode was broadly comparable between the experimental groups. Car and walking were the most common modes across both groups. Car was slightly more prevalent (2.2pp) and walk was slightly less prevalent (-1.2pp) for the digital-first approach compared to the paper-only approach. For other travel modes, differences between the groups were no greater than 0.9 percentage points.
As Figure 8.10 shows, the distribution of travel mode was also similar across the intra-treatment groups. Differences for most modes of travel were within 1 percentage point. However, car was 1.3 percentage points more prevalent for digital diaries, and van or lorry was 2.0 percentage points more prevalent (compared to paper diaries).
These differences may be driven a combination of measurement differences in how respondents reported their travel mode and differences in the sample profile of digital and paper completers. For example, the digital diary shows a list of response options whereas the paper diaries is an open-ended question, which may contribute to van or lorry being more commonly reported in the digital diaries.
Figure 8.9: Travel mode by experimental group
Base: Fully productive sample, weighted by diary sample household weight (W2).
| Travel mode | Control | Treatment |
|---|---|---|
| Car | 68.3% | 70.5% |
| Walk | 15.1% | 13.9% |
| Ordinary bus - elsewhere | 4.0% | 3.5% |
| Van, lorry | 1.6% | 2.4% |
| Train (formerly BR) | 3.1% | 2.5% |
| Bicycle / pedal cycle | 1.8% | 2.0% |
| Ordinary bus - in London | 2.3% | 1.5% |
| Taxi | 1.2% | 0.9% |
| LT underground | 1.4% | 1.0% |
Note: Diary sample household weight (W2) applied with GOR as strata variable.
Figure 8.10: Travel mode by intra-treatment group
Base: Fully productive treatment sample, weighted by diary sample household weight (W2).
| Mode of transport | Paper (non-compliant) | Digital (compliant) |
|---|---|---|
| Car | 69.8% | 71.1% |
| Walk | 14.1% | 13.9% |
| Ordinary bus - elsewhere | 3.7% | 3.4% |
| Van, lorry | 1.0% | 3.2% |
| Train (formerly BR) | 2.9% | 2.3% |
| Bicycle / pedal cycle | 2.3% | 1.8% |
| Ordinary bus - in London | 2.1% | 1.2% |
| LT underground | 1.2% | 0.8% |
| Taxi | 1.5% | 0.7% |
Note: Diary sample household weights (W2) applied with GOR as strata variable.
8.10 Number of stages per journey
The last analysed trip estimate is the number of stages per journey. A new stage is defined, within a journey, when there is a change in transport mode or when there is a change of vehicle requiring a separate ticket. For instance, a trip to work might involve walking to a bus stop, taking a bus journey to a rail station, travel on national rail, and then walk to work. This amounts to four stages (depending on the length of the walking stages and the day of the travel week). Further information on how stages are defined can be found in the NTS User Guide.
The weighted number of stages was highly similar across the treatment (M = 1.05), control (M = 1.06), compliant (M = 1.05) and non-compliant (M = 1.05) groups. There were no significant differences between the experimental groups (Wald F = 2.66, p = 0.10) or intra-treatment groups (Wald F = 0.77, p = 0.38).
In line with this, as Table 8.7 shows, the distributions of number of stages per journey were also highly comparable between the experimental and intra-treatment groups. 96% of reported journeys consisted of one stage across the treatment, control, compliant treatment and non-compliant treatment groups. This suggests that respondents predominantly completed their trips using a single transport mode, aligning with cars being the main transport mode (as car journeys rarely involve other modes).
Table 8.7: Number of stages reported by experimental group
Base: Fully productive treatment sample, stage-level, weighted by diary sample household weight (W2).
| Number of stages | Treatment group (%) | Control group (%) | Compliant treatment group (%) | Non-compliant treatment group (%) |
|---|---|---|---|---|
| 1 | 96.2% | 95.7% | 96.2% | 96.1% |
| 2 | 2.7% | 3.1% | 2.6% | 2.9% |
| 3 | 1.0% | 1.1% | 1.0% | 0.9% |
| 4 | 0.1% | 0.1% | 0.2% | 0.1% |
| 5 | 0.0% | 0.0% | 0.0% | 0.0% |
| 6 | 0.0% | 0.0% | 0.0% | 0.0% |
| Base (stages) | 15,353 | 49,041 | 10,212 | 5,323 |
Among the digital-first group, when comparing the digital and paper groups, it is noteworthy that, despite the small sub-sample sizes, non-compliant respondents reported between 1 and 4 stages per journeys, whilst compliant respondents reported between 1 and 6 stages. This may, however, only reflect differences in the sample profile of the two groups, rather than any measurement differences between the digital and paper instruments.
9. Results: fieldwork performance
The first part of this chapter (from chapter 9.1 to chapter 9.8) evaluates whether there were differences in the following key indicators of fieldwork performance between the experimental and intra-treatment groups:
- total number of calls
- reminder calls taking place
- time taken for the placement interview
- time taken to place travel diaries
- use of the practice page
- use of the memory jogger
- midweek check occurring
- time taken to check and edit diaries
- time taken for the pick-up interview
The second part of this chapter (from chapter 9.9 to chapter 9.11) descriptively presents the results of elements specific to those who agreed to complete the digital diary in the treatment group, including:
- the devices used for digital diary set-up
- technical issues encountered during digital diary set-up
- attitudes towards the digital diary system
The analysis focuses on households where everybody completed an interview and at least one person returned a diary. W3 weights were applied with government office region (disaggregating Inner and Outer London) as a stratification variable. Where applicable, household size was also included as a control covariate in the models. All of the indicators were interviewer-reported, in line with the measures historically used to monitor fieldwork on the NTS.
9.1 Total number of calls
During the NTS fieldwork sequence, after issuing the advance letters, interviewers are expected to contact respondents at multiple points, including:
- booking and conducting the placement interview
- the reminder call to let respondents know that their travel week is about to start
- the midweek check to follow up with respondents during their travel week
- the pick-up interview, when interviewers check, edit and submit diaries
The experimental or intra-treatment group had no effect on the average number of calls per household. There were no significant differences (t = -0.97, p = 0.335) in the average number of calls made to households exposed to the digital-first approach (M = 4.1) compared to the paper-only approach (M = 4.3). Similarly, within the treatment group, no significant differences were observed (t = -0.02, p = 0.99) between households that completed digital diaries (M = 4.1) and those that completed paper diaries (M = 4.1).
9.2 Reminder calls
Interviewers should either make a reminder call or leave a reminder card to inform respondents that their travel week is approaching.
Households exposed to the digital-first approach were less likely to receive a reminder call or card (49%) compared to those exposed to the paper-only approach (58%). However, this difference was not significant (F = 1.84, p = 0.18).
Within the treatment group, households that completed a digital diary were significantly less likely to receive a reminder call or card (F = 4.72, p = 0.03). Specifically, 43% of households that returned at least one digital diary received a reminder call or card, compared to 60% of households that returned paper diaries.
Table 9.1 presents reminder call or card prevalence by experimental and intra-treatment group.
Table 9.1 Reminder call or card prevalence by experimental and intra-treatment group, out of interview-completing households who returned at least 1 diary
Base: Interview sample that returned at least one diary, household-level, weighted by interview sample household weight (W3).
| Whether reminder call or card was issued (interviewer-reported) | Treatment group | Control group | Compliant treatment group | Non-compliant treatment group |
|---|---|---|---|---|
| Yes | 49.4% | 57.9% | 42.6% | 59.6% |
| No | 50.6% | 42.1% | 57.4% | 40.4% |
| Base (households) | 544 | 1,696 | 329 | 215 |
Note: GOR used as strata variable for robust variance estimation.
9.3 Length of placement interview
The length of the placement interview is the time taken to conduct the main interview with the household. The derived measure for this variable was highly susceptible to measurement error, with erroneous extreme values (minimum = 0, maximum = 1,422 minutes) and a very high variance (standard deviation = 165 minutes). Therefore, medians are used as the measure of central tendency to estimate treatment effects for the placement interview length.
The average length of a placement interview was slightly shorter for households exposed to the digital-first approach (mdn = 40 minutes) compared to the paper-only approach (mdn = 44 minutes), and this difference was significant (beta coefficient of median regression = -4, p = 0.01).
There were no significant differences between the average household size of the treatment (M = 2.4) and control (M = 2.4) groups (t = 0.22, p = 0.83) which is expected to increase the placement interview length, allowing for bivariate comparison.
The intra-treatment groups were not compared because the large amount of noise in the measure for the placement interview length variable makes it difficult to ascertain treatment effects at lower sub-sample sizes.
9.4 Length of time to set up travel diaries
There were no significant differences (t = 0.72, p = 0.47) in the time taken to set up the travel diaries between households exposed to the digital-first (M = 13.6 minutes) and the paper-only approaches (M = 12.9 minutes). However, within the digital-first approach, there was a significant difference between the intra-treatment groups (t = 2.65, p < 0.01). It took longer to place the travel diaries for digital (M = 14.6 minutes) than paper diaries (M = 11.9 minutes).
After controlling for household size, this pattern remained. The average time taken to place travel diaries was comparable between the experimental groups but, within the treatment group, completing a digital versus paper diary was associated with a longer time taken. Household size was not associated with a longer diary set-up time.
The results of the linear regression analyses are presented in Tables 9.2 and 9.3. Table 9.2 shows the association between experimental group assignment and the time to place diaries, while controlling for household size. Table 9.3 shows the association between intra-treatment group assignment and the time to place diaries, with the same adjustment for household size.
Table 9.2 Linear regression model showing the effect of experimental group and household size on the time taken to place travel diaries
Base: Interview sample that returned at least one diary, household-level, weighted by interview sample household weight (W3).
| Variable | Beta coefficient | 95% confidence interval |
|---|---|---|
| Experimental group: Digital-first approach | 0.70 | [-1.27, 2.67] |
| Experimental group: Paper-only approach | ref | ref |
| Household size | 0.36 | [-0.05, 0.77] |
Note: All coefficients were insignificant (p > 0.05). Sample size = 2,035. R-squared < 0.01. GOR used as strata variable for robust variance estimation.
Table 9.3 Linear regression model showing the effect of intra-treatment group and household size on the time taken to place travel diaries
Base: Interview treatment sample that returned at least one diary, household-level, weighted by interview sample household weight (W3).
| Variable | Beta coefficient | 95% confidence interval |
|---|---|---|
| Intra-treatment group: Digital | 2.76** | [0.72, 4.80] |
| Intra-treatment group: Paper | ref | ref |
| Household size | -0.15 | [-0.80, 0.50] |
Note: **p < 0.01. The household size coefficient was insignificant (p > 0.05). Sample size = 525. R-squared < 0.03. GOR used as strata variable for robust variance estimation.
9.5 Midweek checks
Interviewers are expected to carry out midweek checks during the travel week to assess how respondents are managing their diary completion and to resolve any issues they may encounter.
There was no significant difference between the proportion of households that received midweek checks (by telephone, in person, or not all), between the experimental groups (F = 0.09, p = 0.91). In both cases, about half of the households received midweek checks by telephone, a quarter received them in person, and a quarter did not receive midweek checks at all.
However, there was a significant difference between the intra-treatment groups (F = 3.40, p = 0.04) with respect to midweek checks. Although a comparable proportion of digital-completing (22%) and paper-completing (23%) households did not receive midweek checks, digital-completing households were more likely to receive these checks by telephone (62%) than paper-completing households (46%).
Table 9.4 presents midweek check prevalence by experimental and intra-treatment group.
Table 9.4 Midweek check occurrence, by experimental and intra-treatment group
Base: Interview treatment sample that returned at least one diary, household-level, weighted by interview sample household weight (W3).
| DV: Whether a midweek check occurred (interviewer-reported) | Treatment group | Control group | Compliant treatment group | Non-compliant treatment group |
|---|---|---|---|---|
| Yes – by telephone | 55.5% | 53.0% | 62.0% | 45.8% |
| Yes – in person | 22.3% | 23.7% | 16.3% | 31.2% |
| No | 22.2% | 23.3% | 21.7% | 23.0% |
| Base (households) | 544 | 1,696 | 329 | 215 |
Note: GOR used as strata variable for robust variance estimation.
9.6 Length to check and edit diaries
Interviewers are responsible for checking and editing respondents’ diaries to ensure they can be processed easily. Historically, this was only possible during the midweek checks and, especially, the pick-up interviews. The digital diary system, however, allows interviewers to check diaries at any time during the travel week, potentially reducing the overall time required by allowing earlier identification and resolution of issues.
According to interviewer’s self-reports, there was no significant difference (t = 1.01, p = 0.31) in the time taken to check and edit diaries between the treatment (M = 14.8 minutes) and the control (M = 13.6 minutes) groups.
However, among the digital-first group, the time taken to review diaries differed between the modes (t = 2.70, p < 0.01), with a longer time for those who completed digital (M = 16.4 minutes) compared to paper (M = 12.4 minutes) diaries.
This mode effect persisted even once household size was controlled for. As expected, the time taken to pick-up diaries increased with household size.
Tables 9.5 and 9.6 present the results from the linear regression models, estimating the association between the experimental groups, and the intra-treatment groups respectively, on the time to check and edit diaries.
The results of the linear regression analyses are presented in Tables 9.5 and 9.6. Table 9.5 shows the association between experimental group assignment and the time to check and edit diaries, while controlling for household size. Table 9.6 shows the association between intra-treatment group assignment and the time to check and edit diaries, with the same adjustment for household size.
Table 9.5: Linear regression models showing the effect of experimental group and household size on diary checking and editing time
Base: Interview sample that returned at least one diary, household-level, weighted by interview sample household weight (W3).
| Variable | Beta coefficient | 95% confidence interval |
|---|---|---|
| Experimental group: Digital-first approach | 1.22 | [-1.17, 3.62] |
| Experimental group: Paper-only approach | ref | ref |
| Household size | 1.88*** | [1.24, 2.52] |
Note: ***p < 0.001. The digital-first approach coefficient was statistically insignificant (p > 0.05). Sample size = 2,237. R-squared = 0.05. GOR used as strata variable for robust variance estimation.
Table 9.6: Linear regression models showing the effect of intra-treatment group and household size on diary checking and editing time
Base: Interview treatment sample that returned at least one diary, household-level, weighted by interview sample household weight (W3).
| Variable | Beta coefficient | 95% confidence interval |
|---|---|---|
| Intra-treatment group: Digital | 3.31* | [0.44, 6.19] |
| Intra-treatment group: Paper | ref | ref |
| Household size | 1.73** | [0.52, 2.94] |
Note: *p < 0.05; *p < 0.01; **p < 0.001. Sample size = 541. R-squared = 0.05. GOR used as strata variable for robust variance estimation.
9.7 Practice page completion
The practice page serves as a tool to guide respondents on how to accurately record their journeys. It introduces them to NTS rules on what types of journeys to record and how to input that information correctly.
As shown in Table 9.7, use of the practice page was associated with a higher rate of fully productive households. There was a significant difference (F = 9.11, p < 0.01) in the weighted proportion of cases that completed the practice page for fully productive (82.5%) versus partially productive (73.5%) households, although the effect of practice page completion was relatively small (Cramer’s V = 0.09).
Table 9.7 Practice page use by experimental and intra-treatment group, out of interview-completing households
Base: Interview sample, household-level, weighted by interview sample household weight (W3).
| DV: Whether practice page of the travel diary was completed (interviewer-reported) | Fully productive | Partially productive |
|---|---|---|
| Yes | 82.5% | 73.5% |
| No | 17.5% | 26.5% |
| Base (households) | 2,151 | 405 |
Note: Number of fully productive and partially productive observations lower than true amounts because of non-response to the dependent variable.
Households exposed to the digital-first approach were less likely to complete the practice page (78%) compared to those in the control group (84%), although this difference was not significant (F = 2.29, p = 0.13).
Among those exposed to the digital-first approach, there were significant differences in the proportion of households completing the practice page (F = 7.84, p < 0.01) for those who agreed to a digital diary (71%) compared to those who completed a paper diary (87%).
Qualitative work with interviewers found that some interviewers felt uncomfortable standing in close proximity with the respondent when the practice page was open on a device with a small screen. This may have contributed to the lower prevalence of practice page use for the digital diary.
Table 9.8 presents practice page use by experimental and intra-treatment group.
Table 9.8 Practice page use by experimental and intra-treatment group
Base: Interview treatment sample that returned at least one diary, household-level, weighted by interview sample household weight (W3).
| Whether practice page of the travel diary was completed (interviewer-reported) | Treatment group | Control group | Compliant treatment group | Non-compliant treatment group |
|---|---|---|---|---|
| Yes | 77.5% | 84.0% | 71.1% | 87.1% |
| No | 22.5% | 16.0% | 28.9% | 12.9% |
| Base (households) | 544 | 1,700 | 329 | 215 |
9.8 Administration and use of the memory jogger
Memory joggers are small paper documents that can be left with household members to summarise trips ‘on the go’ to mitigate under-reporting.
There was no significant difference in the proportion of cases that were issued a memory jogger between the experimental (F = 0.05, p = 0.83) or intra-treatment groups (F = 0.51, p = 0.48).
Table 9.9 presents memory jogger deployment by experimental and intra-treatment group, showing that across all four groups, under half of the households were issued a memory jogger.
Table 9.9 Memory jogger deployment, by experimental and intra-treatment group
Base: Interview treatment sample that returned at least one diary, household-level, weighted by interview sample household weight (W3).
| Whether memory jogger was issued (interviewer-reported) | Treatment group | Control group | Compliant treatment group | Non-compliant treatment group |
|---|---|---|---|---|
| Yes | 42.8% | 44.0% | 40.4% | 46.5% |
| No | 57.2% | 56.0% | 59.6% | 53.5% |
| Base (households) | 544 | 1,699 | 329 | 215 |
Among households issued a memory jogger in the digital-first group, digital-completing households were less likely to use all the memory joggers (30%) compared to paper-completing households (40%). It is unclear, however, whether this difference was driven by measurement error: the selection of ‘don’t know’ was approximately 2.5 times higher for digital completions.
Table 9.10 presents memory jogger use by experimental and intra-treatment group.
Table 9.10 Memory jogger usage by experimental and intra-treatment group
Base: Interview treatment sample that returned at least one diary and was issued with a memory jogger, household-level, weighted by interview sample household weight (W3).
| DV: Whether memory jogger was used (interviewer-reported) | Treatment group | Control group | Compliant treatment group | Non-compliant treatment group |
|---|---|---|---|---|
| Yes, all were used | 34.5% | 29.7% | 30.0% | 40.3% |
| Yes, some were used | 9.5% | 15.1% | 12.7% | 5.2% |
| No, none were used | 33.4% | 39.1% | 26.5% | 42.4% |
| Don’t know | 22.6% | 16.1% | 30.8% | 12.0% |
| Base (households) | 234 | 714 | 136 | 98 |
Note: Differences between experimental and between intra-treatment group were statistically insignificant (p > 0.05). GOR used as strata variable for robust variance estimation.
9.9 Back-dating travel weeks and association with short walk reporting
Back-dating occurs when a household’s travel week starts before the placement interview date. The NTS fieldwork sequence is designed to minimise back-dating, because when a travel week starts further in the past, it can become more difficult for respondents to remember and record trips accurately, ultimately impacting data quality.
For each NTS point, the interviewer is provided with a unique list of travel week start dates on a Travel Week Allocation Card (TWAC), which is used to allocate households’ travel week in a systematic way. This promotes an even spread of start dates throughout the week, month and year, and mitigates against biases that may arise from the respondent or interviewer selecting their own travel week. When interviewers begin their point on time (in line with each assignment’s unique start date) and make reasonable progress with booking interviews, allocated travel weeks should begin after the placement interview has taken place. However, when a point is started late, it increases the likelihood that back-dating occurs.
Due to fieldwork capacity issues, and the additional complexities that interviewers working on digital-first points faced (such as needing to attend an additional briefing session and getting to grips with the digital diary system), some of these interviewers began their points late, increasing the risk of back-dating.
As expected, the difference between the start of the travel week and the placement interview varied significantly (F = 5.87, p < 0.01) between the experimental groups, out of fully productive households. 65% of fully productive households exposed to the digital-first approach started their travel week on the same day or after the placement interview, compared to 77% of fully productive households exposed to the paper-only approach.
However, within the treatment group, there was no significant difference in back-dating between those who completed digital and paper diaries (F = 0.05, p = 0.95).
Table 9.11 shows the distribution of back-dating by experimental and intra-treatment group.
Table 9.11 Back-dating status by experimental and intra-treatment group, out of fully productive households
Base: Fully productive sample, household-level, weighted by diary sample household weight (W2).
| DV: Date travel week started in relation to placement interview date | Treatment group | Control group | Compliant treatment group | Non-compliant treatment group |
|---|---|---|---|---|
| On same day or in the future | 64.7% | 76.6% | 65.5% | 63.5% |
| One day before | 16.2% | 13.5% | 15.7% | 17.0% |
| Two or more days before | 19.1% | 9.9% | 18.9% | 19.5% |
| Base (households) | 524 | 1,640 | 322 | 202 |
Given that the introduction of the digital-first approach may reduce respondents’ propensity to report short walks and a greater proportion of households’ travel weeks were back-dated in the treatment group, the effect of back-dating on short walk reporting is explored.
The proportion of walking stages that were below 1 mile did not significantly differ by back-dating status (F = 0.13, p = 0.87). For those whose travel weeks were not back-dated, back-dated by one day, or back-dated by two or more days, around a quarter of walking stages were below 1 mile. Table 9.12 presents the distance distribution of walking stages by back-dating status.
Table 9.12 Distance distribution of walking stages by back-dating status
Base: Fully productive sample, stage-level (walking only), weighted by diary sample household weight (W2).
| DV: Distance distribution | On same day or in the future | One day before | Two or more days before |
|---|---|---|---|
| Walks below 1 mile | 23.9% | 25.4% | 23.0% |
| Walks 1 mile and above | 76.1% | 74.6% | 77.0% |
| Base (stages) | 7,134 | 1,136 | 827 |
9.10 Devices used for digital diary set up
In order to set respondents up on the digital diary system, information from the CAPI system was transferred to the digital diary system by the interviewer, such as the person number and travel week start date. Figure 9.1 shows a screenshot from the CAPI system and figure 9.2 shows a screenshot from the digital diary system at the set-up stage.
Screenshots of both systems are displayed in Figure 9.1.
Figure 9.1 Diary set-up screen in the CAPI system

The screenshot shows the set up screen in the CAPI program, which asked interviewers to input household-unique information, such as ‘Add’, ‘H’, ‘CL’ and travel week start date into the digital diary system.
Figure 9.2. Diary set-up screen in the digital diary system

The screenshot shows the page in the digital diary system where information from the CAPI program (exemplified in Figure 9.1), was inputted into the digital diary set-up screen. The interviewer accessed the CAPI program on their computer and the digital diary set up page on their mobile phone.
Although the protocol instructed interviewers to use their devices for this task and only refer to respondents’ devices if there was no internet connection, the interviewer’s device was used for diary set-up 77% of the time, whilst the respondent’s device was used 23% of the time.
9.11 Technical issues during digital diary set up
In 11% of interview-completing households that agreed to complete their diaries digitally, a technical issue was reported during digital diary set-up. These issues were reported by interviewers and were not cross-referenced with paradata measures.
Figure 9.3 outlines the prevalence of each issue reported by interviewers.
Figure 9.3: Prevalence of technical issues encountered, for interview
Base: Interview treatment sample that agreed to complete digital diaries, household-level, weighted by interview sample household weight (W3).
| Issue | Percentage |
|---|---|
| Login email was not received immediately | 0.6% |
| Digital Diary system was unavailable | 0.8% |
| Changes required after submitting household | 1.0% |
| Respondents did not receive login email | 1.5% |
| Internet connection issue with NatCen device | 3.7% |
| Other | 5.6% |
Note: Sample size = 382.
Although these are rightly perceived as technical issues, none of the problems encountered were caused by the system or the service, and therefore could not be controlled or managed by the development team. Connection issues are to do with network coverage and issues receiving emails are to do with local set-up of email provider and email clients, both of which are outside the sphere of development influence. The ability to change input after submitting a household for set-up is built into the system via an interviewer editing function, and was covered in training with video support in the training modules.
The service itself had high availability and stability during the parallel run. No downtime was recorded at Google Cloud Platform during the parallel run so issues with availability are likely to be network coverage issues rather than server problems. Only two technical support issues came through to the digital diary developers via the feedback centre, both of which were to do with input field behaviour on out of date and unsupported browsers. Both of those issues were fixed by the developers and the users who reported the issues were informed immediately allowing the field work to continue.
9.12 Perceived difficulty using the digital diary system
In 70% of households that agreed to complete digital diaries, interviewers described the digital diary system as easy to use. In 16% of cases, they described it as difficult, and in 14% of cases, they indicated it was neither easy nor difficult to use.
Figure 9.4 presents the interviewer-reported ease of using the digital diary system for interview-completing households.
Figure 9.4: Interviewer-reported difficulty of using the digital diary system for interview-completing households
Base: Interview treatment sample that agreed to complete digital diaries, household-level, weighted by interview sample household weight (W3).
| Response | Percentage |
|---|---|
| Very easy | 41.4% |
| Somewhat easy | 28.9% |
| Neither easy nor difficult | 14.1% |
| Somewhat difficult | 10.0% |
| Very difficult | 5.7% |
Note: Sample size = 329.
10. Results: weighting efficiency
The efficiencies of the following core NTS weights were compared between households with at least one digital completion and those fully completing via paper:
- int corrects for self-selection and non-response biases in households where all members completed an interview
- fully corrects for self-selection and non-response biases in households where all members completed a diary and an interview
- td1 adjusts for measurement error due to respondents’ tendency to omit journey information on later days of their travel week; td2 is td1 multiplied by the fully weight
- ldj1 corrects for measurement error by using CAPI data on respondent’s long-distance journeys from the previous week to weight journey data from the travel diary
- ldj2 is ldj1 multiplied by the fully weight
- sw1 adjusts for biases from respondents deviating from their randomly allocated travel week, by forcing the frequency of each day to be equal
- sw2 is sw1 multiplied by the fully weight
The efficiencies of these NTS weights were either slightly higher or comparable for the digital diary sample compared to the paper diary sample. This suggests that the introduction of the digital mode is not associated with an increased variance of weighted estimates compared to the paper mode.
For the household weights int and fully, the digital diary sample had slightly higher efficiencies than the paper diary sample. Correspondingly, the design effects for these weights were slightly lower for the digital sample than for the paper sample, indicating a modest reduction in variance.
For the trip weights td1 and sw1, the digital diary sample had efficiencies that were slightly higher, respectively, compared to the paper diary sample. For the remaining trip weights (td2, ldj1, ldj2 and sw2), the efficiencies and design effects between the two samples were comparable.
Table 10.1 shows the efficiency of weights by diary mode, within the digital-first group.
Table 10.1: Weighting efficiency (EFF) and design effect (DEFF) of NTS weights, by mode of diary completion
| Weight | Efficiency: Digital | Efficiency: Paper | Design effect: Digital | Design effect: Paper |
|---|---|---|---|---|
| int | 87% | 81% | 1.16 | 1.23 |
| fully | 80% | 76% | 1.25 | 1.32 |
| td1 | 81% | 75% | 1.24 | 1.33 |
| td2 | 99% | 99% | 1.01 | 1.01 |
| ldj1 | 70% | 70% | 1.43 | 1.43 |
| ldj2 | 90% | 89% | 1.12 | 1.12 |
| sw1 | 81% | 77% | 1.24 | 1.31 |
| sw2 | 100% | 100% | 1.00 | 1.00 |
Note: ‘Digital’ refers to the compliant treatment group, whilst ‘paper’ comprises both the non-compliant treatment group and the control group. For int, the ‘paper’ category also includes cases from the treatment group where all household members completed interviews, but did not return a complete set of diaries.
11. Results: imputation rate
Imputation is the process of replacing missing or invalid values with estimated values. A variable’s imputation rate is defined as the proportion of cases that were imputed within the fully productive sample.
Imputation rates were broadly similar between the digital-first and paper-only approaches. No significant differences were found for 37 of the 49 variables eligible for imputation. For the remaining 12 variables, differences were small, with imputation rates varying by less than 1.5 percentage points. Most significant differences were observed for stage-level variables, where the sample size was very large.
Table 11.1 presents the imputation rates for all eligible variables by experimental group, alongside the Z-statistic and p-value for hypothesis tests.
Table 11.1: Imputation rate of eligible variables by experimental group
Base: Fully productive sample, variable levels (see table), unweighted.
| Variable | Level | Treatment % | Control % | Treatment – Control (pp) | Z statistic |
|---|---|---|---|---|---|
| HHIncome | HHold | 35.94 | 39.94 | -4.00 | -1.78 |
| HHoldEmploy | HHold | 0.00 | 0.31 | -0.31 | -1.39 |
| HHoldFullTime | HHold | 0.00 | 0.31 | -0.31 | -1.39 |
| HHoldPartTime | HHold | 0.00 | 0.31 | -0.31 | -1.39 |
| HRPEmpStat | HHold | 0.00 | 0.05 | -0.05 | -0.57 |
| HRPWorkStat | HHold | 0.00 | 0.10 | -0.10 | -0.80 |
| EcoStat | Ind | 0.00 | 0.14 | -0.14 | -1.40 |
| IndIncome | Ind | 17.93 | 16.39 | +1.55 | 1.36 |
| IndWkCounty | Ind | 0.07 | 0.02 | +0.05 | 0.83 |
| IndWkGOR | Ind | 0.07 | 0.02 | +0.05 | 0.83 |
| IndWkUA1998 | Ind | 0.00 | 0.00 | 0.00 | 0.00 |
| IndWkUA2009 | Ind | 0.07 | 0.02 | +0.05 | 0.83 |
| Stat | Ind | 0.00 | 0.11 | -0.11 | -1.28 |
| WkPlace | Ind | 0.00 | 0.02 | -0.02 | -0.57 |
| IndTicketID | Stage | 0.00 | 0.05 | -0.05 | -2.81** |
| NumBoardings | Stage | 91.52 | 90.15 | +1.38 | 5.21*** |
| NumParty | Stage | 0.02 | 0.00 | +0.01 | 1.83 |
| StageDistance | Stage | 0.23 | 0.29 | -0.06 | -1.19 |
| StageMode | Stage | 0.10 | 0.03 | +0.07 | 3.29** |
| StageMode2 | Stage | 0.08 | 0.03 | +0.05 | 2.62** |
| StageOccupant | Stage | 0.51 | 0.20 | +0.31 | 6.58*** |
| StageShortWalk | Stage | 0.03 | 0.01 | +0.02 | 2.55* |
| StageTime | Stage | 0.44 | 0.57 | -0.14 | -2.06* |
| StageVehicle | Stage | 1.02 | 0.43 | +0.59 | 8.63*** |
| TicketNumber | Stage | 0.09 | 0.09 | 0.00 | 0.10 |
| TicketType | Stage | 0.09 | 0.09 | 0.00 | 0.10 |
| ShortWalkTrip | Trip | 0.00 | 0.00 | 0.00 | 0.00 |
| TripDestCounty | Trip | 0.11 | 0.06 | +0.05 | 1.84 |
| TripDestGOR | Trip | 0.11 | 0.06 | +0.05 | 1.84 |
| TripDestUA2009 | Trip | 0.11 | 0.06 | +0.05 | 1.84 |
| TripDis | Trip | 0.00 | 0.00 | 0.00 | 0.00 |
| TripOrigCounty | Trip | 0.10 | 0.06 | +0.04 | 1.81 |
| TripOrigGOR | Trip | 0.10 | 0.06 | +0.04 | 1.81 |
| TripOrigUA1998 | Trip | 0.00 | 0.00 | 0.00 | 0.00 |
| TripOrigUA2009 | Trip | 0.10 | 0.06 | +0.04 | 1.81 |
| TripPurpFrom | Trip | 0.10 | 0.05 | +0.06 | 2.48* |
| TripPurpose | Trip | 0.15 | 0.09 | +0.07 | 2.34* |
| TripPurpTo | Trip | 0.06 | 0.04 | +0.02 | 0.88 |
| TripTotalTime | Trip | 1.49 | 1.77 | -0.28 | -2.35* |
| TripTravTime | Trip | 0.37 | 0.56 | -0.20 | -3.00** |
| EngineCap | Vehicle | 8.70 | 8.98 | -0.29 | -0.25 |
| RegLetter | Vehicle | 6.93 | 8.34 | -1.41 | -1.31 |
| RegYear | Vehicle | 1.65 | 2.45 | -0.80 | -1.36 |
| VehAge | Vehicle | 1.53 | 2.13 | -0.60 | -1.08 |
| VehAnMileage | Vehicle | 4.35 | 3.69 | +0.66 | 0.86 |
| VehBusMile | Vehicle | 27.73 | 28.39 | -0.66 | -0.37 |
| VehComMile | Vehicle | 28.20 | 28.63 | -0.43 | -0.24 |
| VehPriMile | Vehicle | 29.61 | 29.75 | -0.14 | -0.08 |
| VehRank | Vehicle | 4.35 | 3.69 | +0.66 | 0.86 |
Note: There may be a rounding discrepancy in the Treatment – Control computation because all percentages are rounded to 2 decimal places. *p < 0.05; *p < 0.01; **p < 0.001 of two-tailed proportion tests.
12. Results: diary mode preference (NTAS)
This chapter presents analysis of data from wave 10 of the NTAS to understand what drives preferences to four types of diary mode: paper (the traditional mode on NTS), online, passive data collection, and applications with manual entry. Digital mode preference was regressed on a set of socio-demographic characteristics, alongside factors relating to technology use, concerns about online privacy, and conducting online activities for research purposes. A multinomial logistic regression was estimated, treating paper as the reference category and comparing the other three modes against it (online survey, passive data collection, and applications with manual entry).
12.1 Findings
Table 12.1 presents the findings of a multinomial regression model predicting preferred mode of data collection.
Table 12.1: Multinomial regression model predicting preferred mode of data collection
Base: NTAS responding sample aged 16 and over, individual-level, weighted by NTAS weight.
| Variable: category | Online survey versus paper | Passive data collection versus paper | App with manual entry versus paper |
|---|---|---|---|
| Sex: Female | ref | ref | ref |
| Sex: Male | 1.96* [1.17, 3.28] | 2.68** [1.41, 5.06] | 2.25* [1.10, 4.61] |
| Age: 16 to 29 years old | ref | ref | ref |
| Age: 30 to 39 years old | 0.45 [0.09, 2.14] | 0.36 [0.06, 2.00] | 0.27 [0.05, 1.49] |
| Age: 40 to 49 years old | 0.44 [0.10, 1.99] | 0.29 [0.05, 1.51] | 0.38 [0.07, 1.97] |
| Age: 50 to 59 years old | 0.45 [0.11, 1.83] | 0.42 [0.08, 2.14] | 0.31 [0.07, 1.46] |
| Age: 60 to 69 years old | 0.32 [0.07, 1.37] | 0.19* [0.04, 0.97] | 0.11** [0.02, 0.54] |
| Age: 70 to 79 years old | 0.25 [0.06, 1.10] | 0.17* [0.03, 0.91] | 0.03*** [0.00, 0.23] |
| Age: 80 years old and over | 0.15* [0.03, 0.78] | 0.05** [0.01, 0.43] | 0.02** [0.00, 2.26] |
| Education: GCSE grade A to C | ref | ref | ref |
| Education: GCSE grade D to G or below | 1.08 [0.46, 2.54] | 0.37 [0.10, 1.39] | 3.28 [0.79, 13.54] |
| Education: A level | 0.96 [0.45, 2.08] | 1.06 [0.38, 2.94] | 1.85 [0.57, 6.00] |
| Education: Diploma in higher education | 1.16 [0.52, 2.58] | 0.79 [0.28, 2.24] | 1.03 [0.32, 3.32] |
| Education: First degree qualification | 1.48 [0.64, 3.39] | 1.78 [0.66, 4.79] | 2.75 [0.97, 7.78] |
| Education: Higher or post-graduate degree | 1.97 [0.80, 4.85] | 1.75 [0.61, 5.03] | 3.28 [1.04, 10.34] |
| Marital status: married or in a Civil Partnership | ref | ref | ref |
| Marital status: Single | 0.69 [0.31, 1.55] | 0.86 [0.33, 2.25] | 0.85 [0.32, 2.28] |
| Marital status: Separated, divorced, widowed | 1.04 [0.52, 2.08] | 1.40 [0.57, 3.39] | 0.97 [0.33, 2.87] |
| Children in the household | 1.46 [0.48, 4.42] | 2.69 [0.89, 8.16] | 0.99 [0.31, 3.17] |
| Urban habitat | 1.37 [0.73, 2.60] | 0.86 [0.40, 1.86] | 0.73 [0.31, 1.68] |
| Income: less than £25,000 | ref | ref | ref |
| Income: £25,000 to £49,999 | 0.68 [0.38, 1.20] | 1.09 [0.46, 2.54] | 3.27* [1.18, 9.06] |
| Income: £50,000 and over | 0.92 [0.41, 2.03] | 0.73 [0.27, 1.92] | 2.84 [0.82, 9.77] |
| Completed an NTS paper diary | 0.37 [0.10, 1.41] | 0.54 [0.11, 2.61] | 0.29 [0.06, 1.35] |
| Mode of completion: web | ref | ref | ref |
| Mode of completion: telephone | 0.40** [0.20, 0.80] | 0.36* [0.14, 0.93] | 0.41 [0.16, 1.03] |
| Overall health | 0.99 [0.71, 1.38] | 1.03 [0.69, 1.55] | 0.98 [0.59, 1.61] |
| Disability | 0.64 [0.36, 1.14] | 1.20 [0.55, 2.61] | 1.13 [0.49, 2.60] |
| Smartphone use | 0.66* [0.44, 0.99] | 1.18 [0.62, 2.23] | 0.43* [0.21, 0.87] |
| Computer use | 1.13 [0.93, 1.35] | 1.05 [0.84, 1.33] | 1.00 [0.79, 1.27] |
| Tablet use | 1.22* [1.01, 1.46] | 1.21 [0.98, 1.49] | 1.00 [0.79, 1.28] |
| e-book use | 1.13 [0.89, 1.44] | 1.19 [0.91, 1.57] | 1.20 [0.87, 1.64] |
| Wearable use | 1.04 [0.83, 1.30] | 1.04 [0.82, 1.32] | 1.18 [0.93, 1.51] |
| Gaming console use | 0.54* [0.36, 0.80] | 0.48** [0.30, 0.76] | 0.41*** [0.24, 0.70] |
| Smart speakers use | 0.92 [0.77, 1.10] | 1.04 [0.84, 1.29] | 0.87 [0.69, 1.10] |
| Phone activities (count) | 1.10* [1.01, 1.19] | 1.24*** [1.12, 1.38] | 1.42*** [1.25, 1.61] |
| Concern over phone activities for research purposes | 0.79 [0.44, 1.39] | 0.32*** [0.17, 0.61] | 0.59 [0.30, 1.16] |
| Online privacy concern | 0.91 [0.62, 1.34] | 1.22 [0.77, 1.95] | 1.23 [0.73, 2.07] |
Note: *p < 0.05; *p < 0.01; **p < 0.001. Statistics presented are relative risk ratios. Statistics in parentheses are 95% confidence intervals. 1.03 ≤ Variance Inflation Factors (VIF) ≤ 1.85; M = 1.31, suggesting that multicollinearity is not present. Results from Little’s MCAR test indicate that the data is missing at random (Chi-squared = 1,227.77, df = 2926, p = 1.00). Education refers to highest educational qualification obtained. NTAS weights were used for the analysis.
Males were more likely than females to prefer online surveys, applications that automatically collect data, and applications with manual entry over paper surveys for completing a seven-day travel diary. In contrast, respondents aged 60 and above were less likely to prefer passive data collection and manual entry via an app compared to the youngest age group (16 to 29 years). This age-related effect was less pronounced among respondents choosing online surveys, where only the group aged 80 and over was significantly less likely to choose this mode over paper (RRR = 0.15, p = 0.02).
Income was significant only for the manual entry app, where respondents with household incomes of £25,000 to £50,000 were more likely to indicate a preference for this mode over those with incomes below this level (RRR = 3.27, p = 0.02).
Other socio-demographic characteristics, such as education level, marital status and urbanicity, as well as health-related variables, did not consistently predict the preferred mode of response. This is likely due to differences between groups becoming non-significant after accounting for other factors related to technology use or concerns.
While having completed a paper diary as part of the NTS was not predictive of mode preference, the mode in which respondents participated in the NTAS wave 10 was. Those who completed the survey by phone, rather than via the web, were less likely to prefer online surveys and passive data collection over paper surveys.
Respondents who used their smartphone more frequently were less likely to prefer online surveys or manual entry via an app over paper surveys. However, the more diverse the activities respondents undertook with their smartphones, the more likely they were to prefer modes other than paper. This finding suggests that preference for online-based modes of data collection is more strongly influenced by the variety of activities performed on smartphones than by the frequency of use, especially when high-frequency use is common (79% of respondents used their mobile phones multiple times a day).
Respondents who used tablets more frequently were more likely to prefer completing the diary using an online survey rather than paper (RRR = 1,22, p = 0.03). In contrast, more frequent use of gaming consoles was associated with a preference for paper over other modes. Finally, increased concerns about using the phone for research activities was linked with a lower probability of selecting passive data collection to complete the seven-day travel diary (RRR = 0.32, p = 0.001).
12.2 Reflections
The findings of the NTAS study suggest that, whilst web surveys are the preferred mode of administration for most respondents, there is substantial interest in newer data collection technologies, including passive data collection through smartphone applications.
Although few socio-demographic factors predicted mode preference, older respondents and females were consistently less likely to prefer online modes over paper. Whilst the regression model predicting mode preference using Parallel Run data found that sex was not a significant predictor, the findings related to age were consistent, showing that younger respondents in the treatment group were more likely to complete their diaries digitally.
In addition, the NTAS data reveals that the diversity of activities performed on smartphones is a stronger predictor of preference for online modes than the frequency of smartphone use itself. This finding suggests that as people engage in a wider range of activities on their devices, they become more comfortable using these technologies for research purposes. It is anticipated that this will continue to improve over time, given rise in smartphone ownership and use over the past decades. This, along with log analyses of January data conducted by DfT showing that respondents primarily completed their diaries on smartphones, highlights the need to continue optimising the digital diary for smartphone use.
13. Learnings for data processing
Introducing a new, digital-first approach required adjustments to complex data processing systems and workflows.
During a review of the pre-published datasets, 2 processing issues were identified:
- inaccurate journey sequencing, which was rectified for the final data delivery
- missing transport modes and household vehicles, which was not rectified because the prevalence was low
13.1 Journey sequencing
Historically, journey records from paper diaries have been ordered using a computed ‘minutes since midnight’ variable. This variable is automatically derived when journey times are entered into the Digital Entry System (DES) by data coders, meaning it is present for all journeys.
For digital diaries, however, the variable was only generated for journeys that required coder intervention, such as journeys that were split during data processing. As a result, the sequencing of journeys within some respondents’ digital diaries was incorrect.
The issue was corrected and the data was re-submitted to the Department for Transport. The correction applied will be standard when the digital-first approach is launched at scale in 2025.
The incorrect journey sequencing did not affect any quantitative analyses in this report, as it did not compare the ordering of journeys between the experimental or intra-treatment groups.
13.2 Travel modes
For transport modes such as walking, cycling and taxi, the mode selected by the respondent in the digital diary was automatically transmitted to the DES. No further intervention was required by data operators.
For the following transport modes, the following interventions, however, were required:
-
for coach and coach transport modes, selecting the specific type of bus or coach used (such as London bus)
-
for car modes, selecting the household vehicle used
This is in contrast to the approach required for paper diaries, where all transport modes were manually inputted into the DES.
For a small number of records, data for transport mode and the household vehicle used were missing due to coding omissions during data processing. Given the low number of affected records, the impact on estimates of the treatment effect is expected to be negligible.
When the digital-first approach is launched at scale in 2025, an additional validation check will be incorporated into the reconciliation process. This will identify records with missing bus, coach or household vehicle information and ensure they are reviewed and coded during data processing.
14. Recommendations
Based on findings from this Parallel Run, recommendations are proposed to enhance the integration of the digital-first approach into NTS. These interventions have the following overarching aims:
- strengthen interviewer confidence with digital diary placement
- reduce diary proxying
- increase the accuracy of trip reporting
- streamline digital-first fieldwork procedures
- improve monitoring systems of fieldwork performance and data quality
14.1 Strengthen interviewer confidence with digital diary placement
In order to strengthen interviewer confidence with digital diary placement the process should be automated and standardised. Training should equip interviewers with the specific skills required for successful digital placement, and support mechanisms should be tailored to align with the new, digital-first approach.
To automate the procedure, a non-manual diary set-up process should be introduced, which directly transfers data that was collected during the placement interview into the digital diary system. For this to be rolled out, all interviewer phones will require the functionality to scan QR codes. Automated monitoring systems could also be implemented to prompt interviewers to complete pre-briefing training, ensuring that all interviewers attend the briefing having already practised diary set-up and developed familiarity with the process from the outset.
To standardise the procedure, scripts should be implemented into the CAPI program for more consistent respondent exposure to digital diary placement, emphasising its ease of use. Where respondent concerns are raised, the CAPI program should guide the interviewer through potential reassurances. A mixed-mode approach should also be introduced to permit household members to choose different diary completion modes, ensuring that those who decline digital participation do not force the entire household to switch to paper.
To equip interviewers with specific skills required for successful digital placement, they should, firstly, be taught techniques on how to address common respondent concerns with completing digital diaries. This should be guided by future research that seeks to identify common barriers and facilitators, and how these vary by different socio-demographic groups. Mandatory technical literacy sessions should also be introduced, covering basic digital skills such as tethering.
To tailor interviewer support, decision support charts should be presented to interviewers, detailing who they should contact when different types of queries arise during the fieldwork sequence. A specialised team of Project Champions should be recruited to assist interviewers with field queries, alongside a dedicated helpline that resolves common sources of confusion during the manual set-up procedure. Greater flexibility in the digital diary training dashboard should also be provided, allowing interviewers to retake modules as and when they see fit.
14.2 Reduce diary proxying
To reduce digital diary proxying, the digital diary interface, fieldwork protocols, and monitoring processes should be adjusted.
To adjust the diary interface, the proxying option should be made less prominent during digital diary set-up, particularly when respondents’ devices are being used.
As part of revising fieldwork protocols, interviewers should receive reinforced guidance on the exceptional circumstances in which proxying is permissible, to ensure that it is not over-used. Whenever diary proxying occurs, interviewers should leave physical memory joggers to minimise under-reporting. When interviewers proxy on behalf of respondents, they should make additional follow-up calls during the travel week, to minimise recall errors.
To refine monitoring processes surrounding proxying, additional administrative questions should be added to the interview questionnaire to capture the reasons behind proxying occurring. Rates of proxying should also be treated as a key metric of data quality.
14.3 Increase the accuracy of trip reporting
To increase the accuracy of trip reporting, interventions should make interviewer training more practical, amend the diary interface, and monitor the weighting design.
To make interviewer training more practical, more practical diary exercises should be included during interviewer briefings, focusing on how to record complex trips. Briefings should also emphasise the diary’s time-saving and burden-reducing functions, such as the ability to repeat and share journeys. Interviewers should be reminded that respondents should complete the practice page during placement, and that leaving physical memory joggers may be helpful for reducing recall errors.
To amend the diary interface, prompts should be added to remind respondents to include short walks, and to leave a note if no short walks are completed on the first day of the travel week. The example page should exemplify more complex scenarios and also include short walks. It may also be effective to embed more NTS rules and definitions into the diary, and to introduce hard checks for impossible diary entries such as those that are logically inconsistent, although user testing would be required to assess this.
To monitor the effectiveness of the weighting design, once the digital-first approach has been launched at scale, the current NTS weighting approach should be assessed to evaluate whether it remains fit for purpose. If mode measurement effects are present, they may need to be adjusted for via statistical weights in order to reduce bias, and ensure that NTS remains reliably comparable over time.
14.4 Streamline digital-first fieldwork procedures
To streamline digital-first fieldwork procedures, approaches should reduce complexity and increase efficiency for interviewers and respondents wherever possible. To reduce complexity, the navigation for entering interviewer notes should be simplified and individual-level checks prior to diary submission should be consolidated into one, singular household-level check.
To increase efficiency, midweek checks could be permitted over the phone rather than requiring an in-person visit. Two types of automated reminders should be implemented: one for respondents shortly before their travel week begins, and another for interviewers after all diaries are approved, prompting them to submit the diary data. Furthermore, interviewers should be encouraged to view the digital diary via electronic devices with larger screens (such as laptops or tablets), rather than mobiles for greater usability.
14.5 Improve monitoring systems of fieldwork performance and data quality
To improve monitoring systems of both fieldwork performance and data quality, interventions should systematically track fieldwork quality, and provide clearer benchmarks on what constitutes poorer performance.
To systematically track fieldwork quality, non-attempted cases and response rates should be monitored by area to signal non-response bias. Questions capturing barriers to digital completion should be retained and analysed, and a reliable variable capturing a respondent’s intended, rather than actual, mode of completion should be introduced. Interviewers should also be reminded to complete all fieldwork variables to minimise item non-response.
To provide clearer benchmarks on what constitutes poorer performance, individualised targets of digital diaries per interviewer should be introduced, to take into account regional variations in respondents’ propensity to take up the digital diary. The accuracy of existing timestamp indicators should also be reviewed, and adjustments should be made to better detect performance issues.
Appendix 1
Recoding information for Table 7.1:
-
‘Owns or part owns’ combines the following categories:
- (1) Owns outright
- (2) Owns with a mortgage or loan
- (3) Shared ownership
-
‘Does not own or part own’ combines the following categories:
- (1) Rents
- (2) Lives rent free
-
‘Divorced, widowed or separated’ incorporates the following categories:
- (1) separated, but still legally married
- (2) separated, but still in a civil partnership
- (3) divorced
- (4) civil partnership now legally dissolved
- (5) widowed
- (6) surviving partner from a registered civil partnership
-
‘White’ combines the following categories:
- (1) English, Welsh, Scottish or Northern Irish
- (2) Irish
- (3) Gypsy or Irish Traveller
- (4) Roma
- (5) Any other White background
-
‘Not White’ combines the following categories:
- (1) Caribbean
- (2) African
- (3) Any other Black, Black British or Caribbean
- (4) Indian
- (5) Pakistani
- (6) Bangladeshi
- (7) Chinese
- (8) Any other Asian background
- (9) White and Black Caribbean
- (10) White and Black African
- (11) White and Asian
- (12) Any other Mixed or multiple ethnic background
- (13) Arab
- (14) Any other ethnic group