About the UK House Price Index
Updated 16 December 2025

© Crown copyright 2025
This publication is licensed under the terms of the Open Government Licence v3.0 except where otherwise stated. To view this licence, visit nationalarchives.gov.uk/doc/open-government-licence/version/3 or write to the Information Policy Team, The National Archives, Kew, London TW9 4DU, or email: psi@nationalarchives.gov.uk.
Where we have identified any third party copyright information you will need to obtain permission from the copyright holders concerned.
This publication is available at https://www.gov.uk/government/publications/about-the-uk-house-price-index/about-the-uk-house-price-index
1. Introduction
The UK House Price Index (UK HPI) captures changes in the value of residential properties.
The UK HPI uses sales data collected on residential housing transactions, whether for cash or with a mortgage. Properties have been included:
- in England and Wales since January 1995
- in Scotland since January 2004
- in Northern Ireland since January 2005
Data is available at a national and regional level, as well as counties, local authorities and London boroughs.
1.1 National Statistic
The Office for Statistics Regulation designated the UK HPI as a National Statistic in September 2018. This means it meets the highest standards of trustworthiness, quality and value, compliant with the Code of Practice. A letter from the Director General for Regulation details the actions that were taken to meet the requirements as set out in the UK HPI assessment report.
The UK HPI is a joint production by HM Land Registry, Land and Property Services Northern Ireland, Office for National Statistics and Registers of Scotland.
The UK HPI, introduced in June 2016, includes all residential properties purchased for market value in the UK. However, as sales only appear in the UK HPI once the purchases have been registered, there can be a delay before transactions feed into the index. As such, caution is advised when interpreting price changes in the most recent periods as they can be revised. Further information is provided in our revision policy.
1.2 Strengths and limitations
The UK HPI is not as timely in publishing as other house price index measures published in the UK because it is based on completed sales at the end of the conveyancing process, rather than advertised or approved prices.
The UK HPI has wide coverage of both cash and mortgage transactions and a large data source (land registrations such as that maintained by HM Land Registry) allowing data to be published down to a local authority level with further breakdowns available by property type, buyer status, funding status and property status.
Estimates for the most recent months are provisional and are likely to be updated as more data is incorporated into the index. While changes to estimates are small at the headline level, these can be larger at lower geographies due to the fewer transactions used. Further details on why our estimates change can be found in our revisions policy.
2. Data sources
The main sources of price paid data used in the UK HPI are HM Land Registry for England and Wales, Registers of Scotland and His Majesty’s Revenue and Customs Stamp Duty Land Tax data for the Northern Ireland House Price Index.
Each data source has been assessed against the Quality Assurance of Administrative Data (QAAD) toolkit. Read our summary of UK HPI QAAD or see below for individual reports.
2.1 HM Land Registry for England and Wales
Information on residential property transactions for England and Wales, collected as part of the official registration process, will be provided by HM Land Registry for properties that are sold for full market value. The dataset contains the sale price of the property, the date when the sale was completed, full address details, the type of property (such as detached, semi-detached, terraced or flat), if it is a newly built property or an established residential building and a variable to indicate if the property has been purchased as a financed transaction (for example using a mortgage) or as a non-financed transaction (cash purchase).
All this information is currently published by HM Land Registry in its Price Paid Dataset (PPD), with the exception of the funding status indicator. This is not publicly available as this data is considered personal information and would breach data protection rules.
Access the quality assurance of administrative data used in the production of UK HPI – HM Land Registry data.
Data exclusions
There are a number of registrations excluded from the version of the Price Paid Data (PPD) used in the UK HPI. These are:
- all commercial transactions
- sales that were not for full market value
- transfers, conveyances, assignments or leases at a premium with nominal rent which are:
- ‘Right to buy’ sales at a discount
- subject to an existing mortgage
- to effect the sale of a share in a property
- by way of a gift
- under a Compulsory Purchase order
- under a court order
- to Trustees appointed under Deed of appointment
- Vesting Deeds Transmissions or Assents
- of more than one property
- leases for seven years or less
2.2 Registers of Scotland
Registers of Scotland (RoS) provides residential property sales for Scotland in the calculation of the new UK House Price Index (HPI). The Scotland data follows a similar process to the HM Land Registry Price Paid Data (PPD) where the data provided for the HPI is a by-product of the Scottish property registration process, whereby property sales are submitted to RoS on completion of a sale. Data is gathered from these applications and entered into the RoS Land Registration System (LRS). A weekly extract of all sales data is then taken from LRS and undergoes a quality assurance process to check the price paid, date of entry, property type (land, commercial, residential, forestry, agricultural and other) and to identify market value residential sales (as opposed to non-market sales similar to those detailed for PPD). This data is then combined with further details, such as full address and house type (detached, semi-detached, terrace or flat), using the RoS Geographical Information System database to provide a comprehensive source of data that can be provided each month for use in the new HPI.
In addition, a funding status indicator and a new build indicator are also added to the final dataset. The funding status indicator is identified by whether the application for registration of a market value residential sale also contaisn an application for registration of a standard security mortgage deed. All applications with a mortgage deed, or where the mortgage deed is submitted within three months of the sale, are mortgage sales, while all those without an accompanying mortgage deed, are marked as being a cash sale. The new build indicator is given to every sale of an individual property from a builder’s development title. The coverage of the RoS data differs to the PPD slightly in that transactions relating to residential properties where the buyer or seller is a corporate body, company or business are included within this dataset.
Access the quality assurance of administrative data used in the production of UK HPI – Registers of Scotland data.
2.3 Northern Ireland data
The Land & Property Services/Northern Ireland Statistics & Research Agency house price index will continue to be calculated and published quarterly. Northern Ireland data will be provided to the Office for National Statistics (ONS) quarterly, and will be combined with the Great Britain data to give overall figures for the UK. The overall UK figure will be calculated by keeping the house prices in Northern Ireland constant for the two months following the end of a quarter, when Northern Ireland results for the most recent quarter are not yet available. They will then be revised when the quarter is complete.
The quality assessment of Stamp Duty Land Tax data from HMRC is not yet complete. Details will be made available once the assessment is finalised.
2.4 UK Finance – Regulated Mortgage Survey
The Regulated Mortgage Survey (RMS) is UK Finance’s version of the Mortgage Product Sales Data (PSD) that all regulated lenders report to the Financial Conduct Authority (FCA). This is detailed transaction-level data on mortgage completions. Starting in April 2005, the RMS now contains over 12 million individual mortgage sale records.
It is collected electronically, with all reporting firms submitting according to FCA-defined data definitions, and in a standard xml format, ensuring consistent data structure. Data coverage is estimated to be around 95% of all regulated mortgages currently advanced. However, some lenders do not permit their data to be transferred to third parties, like ONS, so the share of the market covered by data received by ONS is about 70%.
Reporting fields include purchase price, completion date of property sale, type of borrower (first time buyer (FTB) or home mover) new or second hand property, type and size of dwelling. The RMS is the only comprehensive source of data available for the type of borrower and provides the necessary data to allow the new HPI to be produced according to whether the buyer is a first time buyer or an existing owner. The RMS is also a key source of data used in the production of house prices for inclusion in the Retail Price Index and will continue to be for the foreseeable future.
Access the quality assurance of administrative data used in the production of UK HPI – UK Finance.
3. Property attributes data
There is comprehensive data available on the price of transacted property across the UK; however, this price data is limited in terms of details regarding the physical characteristics of the property.
The use of price data alone is insufficient for the calculation of an inflationary index for house prices due to the fact the composition and type of property sold can differ vastly between periods. Therefore, in line with recognised international best practice, hedonic regression and mix-adjustment is used to account for the change in composition.
For a hedonic regression model to be work sufficient, details regarding the attributes of properties sold are required to supplement the price paid data. For the production of the UK HPI, these attributes are available from a number of official sources described below.
3.1 Valuation Office Agency Council Tax Valuation list
The main source of property attributes data that will be used to supplement Price Paid Data (PPD) for England and Wales is administrative data taken from the Council Tax Valuation list maintained by the Valuation Office Agency (VOA).
The VOA has been responsible for banding properties for Council Tax since the tax was first introduced in 1993; before then, the VOA was responsible for the earlier system of domestic rates. The Council Tax Valuation list is a robust source of property attributes (such as the size of the property) data that covers, in principle, all residential properties in England and Wales.
Access the quality assurance of administrative data used in the production of UK HPI – Valuations Office Agency Council Tax Valuations List.
3.2 Land and Property Services Northern Ireland Valuation List
Land and Property Services maintains the list of Northern Ireland properties which are valued for rating purposes. The data are maintained and validated similarly to the VOA data described above. The Valuation List database contains all the property attributes required for the hedonic regression used in the production of the Northern Ireland House Price Index (UK HPI).
Access the quality assurance of administrative data used in the production of UK HPI and Northern Ireland House Price Index – Land and Property Services Northern Ireland Valuation List.
3.3 Energy Performance Certificates Scotland
Scottish Energy Performance Certificates (EPC) is used to provide the floor area of the property and the number of habitable rooms required for calculation of the new UK HPI. This will be matched against the price paid data provided by RoS (using the address details of the property).
Access the quality assurance of administrative data used in the production of UK HPI – Scottish Energy Performance Certificates.
3.4 Acorn classification
A key determinant of house prices is the demographic characteristics of the area in which the property is located, such as the affluence of those people living in the area. A well-established geo-demographic segmentation of the UK is available through the Acorn dataset, produced and licensed by CACI Ltd. Acorn segments postcodes into categories and groups by analysing significant social factors and behaviours. The Acorn dataset is used in the calculation of both the NI House Price Index and the UK House Price Index.
Access the quality assurance of administrative data used in the production of UK HPI – Acorn (CACI Ltd).
4. Calculating the UK HPI
The calculation of the UK HPI is performed by the ONS. The Quality and methodology document contains important information on:
- the strengths and limitations of the data
- users
- uses of the data
- how the output was created
- the quality of the output including the accuracy of the data
4.1 Methodology
The UK HPI applies a hedonic regression model that utilises the various sources of data on property price (for example the Price Paid dataset) and attributes to produce up-to-date estimates of the change in house prices each period.
More details on this approach can be found in section 3 of our Quality and methodology document.
4.2 Geometric mean explained
There are different ways of calculating average prices. These include the arithmetic mean (simple mean), the geometric mean and the median.
The arithmetic mean is greatly influenced by the few high value properties and will therefore not give a true reflection of the average price of a standardised property.
The geometric mean reduces the weighting given to high value properties when compared to the arithmetic mean and is typically lower, usually closer to that of the median.
For the UK HPI, the standard average house price is calculated by taking the average (geometric mean) price in January 2015 and then recalculating it in accordance with the index change back in time and forward to the present day.
A 3 month moving average has been applied to estimates below the regional level. For example, at the local authority level, the published estimate for March is a simple average of the calculated estimates for January, February and March. This helps remove some of the volatility in the series at this level. Volatility still remains in estimates for local authorities with fewer transactions, such as Shetland, Orkney City of London and Na h-Eileanan. Northern Ireland estimates are unaffected by this as they are only available on a quarterly basis.
4.3 Monthly and annual price changes
The ‘annual’ percentage change in house prices is simply the price change relative to the same month twelve months earlier. For example, if the HPI release is for February, then the ‘annual’ price change reports the percentage change in values relative to February in the previous year.
This annual rate of price change reflects the best estimate for how much the value of a typical property has changed over the preceding twelve months. Similar to the ‘annual’ change, the ‘monthly’ percentage change estimates the percentage change in average house prices relative to the previous month.
4.4 Revisions to the UK HPI data
The amount of time between the sale of a property and the registration of this information varies. It typically ranges between 2 weeks and 2 months. Occasionally the interval between sale and registration is longer than two months; this is particularly true for new builds. For example, our provisional (first) estimate for a particular month is calculated on around 40% of the transactions that will ultimately get registered with the second and third estimates calculated based on around 80% and 85% of the final registered transactions. Revisions to the UK HPI estimates arise as the index is re-calculated to incorporate these additional transactions.
Transactions involving the creation of a new register, such as new builds, are more complex and an increase in applications has created a backlog. As a result, processing takes longer. Read about what we’ve done to reduce our backlog, our service standards and our future plans.
The following table summarises the revision policy for the UK House Price Index.
| Frequency of publication | Frequency of revisions | Period revision covered | Reason |
|---|---|---|---|
| Monthly | Monthly (Quarterly for Northern Ireland data) | Previous 12 months (4 quarters for Northern Ireland) | Inclusion of additional registered transactions |
| Ad hoc or other revisions | The entire dataset | - Improvements in methodology - Large scale revisions to historical data series - Processing errors |
Monthly revision
As an example, in the June 2017 release, which contained data up to April 2017, average prices, indices, growth rates and sales volumes previously published for all months between April 2016 and March 2017 were revised. Northern Ireland quarterly data was revised back to Q2 (April to June) 2016. This may differ to the revision policy of the Northern Ireland House Price Index published by the Land and Property Services Northern Ireland
Other revisions
From time to time revisions will need to be made outside of the usual. Examples of such revisions include improvements to methodology, revisions to data and the discovery of incorrect data through extensive quality assurance procedures. Each of these revisions will be examined to see if the effects are significant in terms of the degree of change or whether the changes affect the story the data portray. If revisions arising through improvements to methodology or changes to source data are found to be insignificant, they will be introduced in the next planned set of revisions according to the timetable above.
However, if these revisions are thought to affect analysis or are sufficiently large, they will be introduced more quickly.
If incorrect data are discovered after publication, these too will be examined for their impact. Where the changes are significant, a correction notice will be issued as soon as is practicable, while minor corrections will be included in the next planned release. In all cases a full explanation will be included as part of the release.
To view the most recent monthly or ad-hoc revisions to previous data, see the tables provided on the data downloads pages.
4.5 Seasonal adjustments
Seasonally adjusted series are calculated at the regional and national level only. These data can be found within the data tables.
4.6 Inflation
The UK HPI measures nominal house price changes and is not adjusted for inflation. Users of the UK HPI can make their own inflation assumptions and adjust the UK HPI accordingly.
4.7 Small local authority districts not shown on the UK HPI
Due to the small volume of sales for these local authority districts, the UK HPI would not always provide a reliable measure of price movement. For example, the Isles of Scilly is excluded from the UK HPI due to very low monthly sales volumes.
4.8 Recent volumes not reported
There are partial sales volume data for the months immediately preceding the UK HPI release. However this is not published because the data is not complete. We aim to report on accurate and reliable information and therefore do not want to release sales volume data that has the potential to be misleading if quoted out of context.
4.9 Improvements to UK HPI estimates
Improvements in 2017
In May 2017 (March 2017 data), a temporary adjustment factor was introduced, based on observed revisions in previous periods, to help control for the volatility of estimates for new build transactions. While this approach did slightly improve UK HPI revisions, a better long-term solution was investigated and implemented from 12 December 2017.
From 12 December 2017, the new/existing build breakdown has been suppressed for the latest two months (latest two quarters for Northern Ireland) to reflect the greater uncertainty in provisional estimates of the new build breakdown. Other breakdowns for UK HPI statistics are not suppressed for the latest two periods due to sufficient total transactions volumes and the relatively small weight (around 9%) for new builds in the headline series.
From 12 December 2017, we better accounted for the low number of new build transactions available for inclusion in the UK HPI model for the first estimate by introducing a reduced regression model for calculation of the first estimate only. This model improvement increased the accuracy of our first estimates.
From 22 April 2026, we have introduced these same linkage improvements to our annual processing; in addition, we have made a minor improvement to the calculation of the weights used for properties with missing characteristics in the regression model.
More detail of this reduced regression model improvement is available in our blog and in the subsection “Calculating first estimates” of section 3.2 of our Quality and methodology document. The impact of this improvement is discussed further below.
Figure 1: 12-month growth rate for first and final estimate of UK HPI, Great Britain
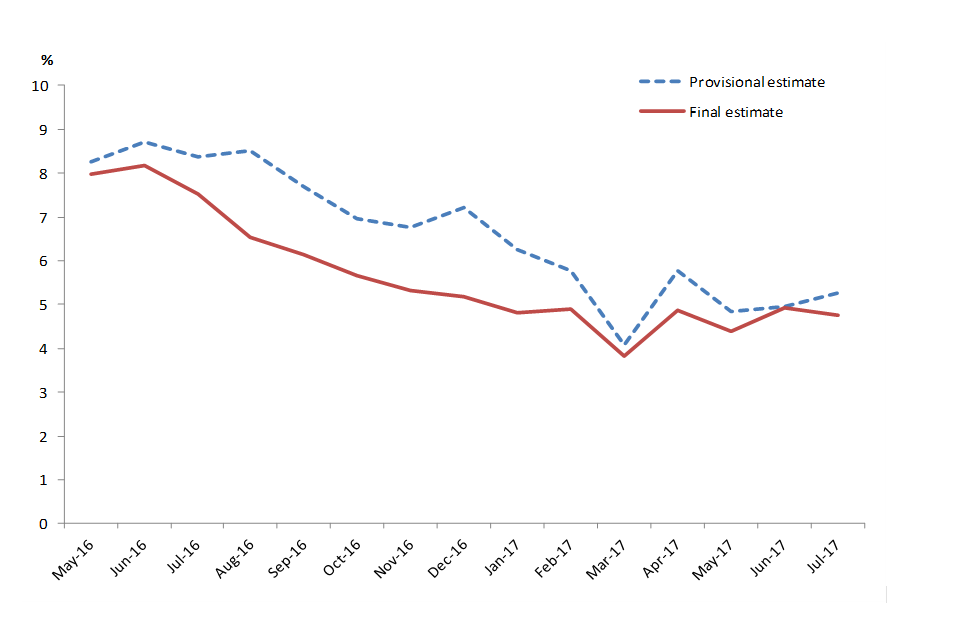
Notes:
1. UK HPI has a 12 month revision policy; data within this period are still subject to revision.
2. Great Britain data is presented here only as Northern Ireland data is processed separately by LPSNI.
The UK HPI has a standard policy of a 12-month revision period to reflect the time needed for property transactions to be processed and become available in price data and property attributes data for inclusion in the UK HPI calculations. However, while one might expect revisions to be both upwards and downwards, UK HPI estimates tend to be predominantly revised downwards between the provisional (1st) estimate for a given month and the final (13th) revised estimate for the same month.
In 2017, analysis of historic UK HPI revisions (particularly those towards the end of 2016, presented in Figure 1) confirmed that historic downwards revisions were mainly driven by the first provisional estimate for the new build breakdown being too high. While new builds ultimately make up around 9% of all transactions, they contributed to over 80% of the revision at the end of 2016.
Transactions involving the creation of a new register, such as new builds, are more complex and need more time to process. This means they can take longer to appear in HM Land Registry’s register and results in a lower proportion of new build sales being available to calculate the initial price and index estimates, than for existing builds. This leads to there being fewer new build transactions available to us when constructing our first estimate which impacts the reliability of our first estimate for this breakdown.
The fewer new build transactions available for the first estimate is highlighted in Table 1, which presents the number of transactions used in the first estimate during 2016 for England and Wales.
Table 1: Number of transactions in first estimate, England and Wales
| Time | New build | Existing property |
|---|---|---|
| July 2016 | 131 | 26,930 |
| August 2016 | 128 | 30,213 |
| September 2016 | 85 | 29,988 |
| October 2016 | 96 | 28,634 |
| November 2016 | 138 | 24,438 |
| December 2016 | 131 | 28,189 |
Note: data for Scotland and Northern Ireland are not presented here.
The 2017 analysis showed that while the number of new build transactions reported in the first estimate was small, by the third estimate they accounted for around one tenth of all transactions (around 7,000 to 8,000 transactions).
We also found evidence that more expensive properties are registered slightly quicker than other properties, explaining why new build estimates were subsequently revised down, as less expensive new build transactions were incorporated into the index at a later point.
The 2017 analysis concluded that new build data volumes for the first monthly estimate are not representative of new build transactions which are registered slightly later, and that new build data volumes are too low for the full hedonic regression model (Equation 1 in our Quality and methodology document) to produce reliable results for the first estimate. Combined, this led to downwards revisions in the new build price in subsequent revised estimates.
In May 2017 (data up to March 2017) we introduced a temporary adjustment factor, based on observed revisions in previous periods, to help control for the volatility of estimates for new build transactions. As seen in Figure 1, this approach did improve UK HPI revisions since from around March 2017 the difference between the first and final estimate reduced.
Investigation continued and from 12 December 2017 (data up to October 2017), a better long-term solution was implemented. Several approaches were tested before choosing this longer-term solution. These included:
- calculating bias adjustment factors using a time series approach
- calculating a bias adjustment factor based on observed revisions in previous periods
- a reduced estimation model when calculating the first estimate
The implemented solution (reduced estimation model; Equation 2 in our Quality and methodology document) was selected as it resulted in the smallest revisions over time for countries of Great Britain. It also resulted in both positive and negative revisions for the periods tested. Two additional benefits we found for the reduced estimation model over a bias adjustment factor approach were:
- it was easier to implement it into our production process
- it responded more quickly to changes in the structure of the transaction data over time (such as a reduction in the backlog)
Our implemented methodological improvement and its impact (if it had been applied historically) are presented in more detail below.
The full hedonic regression model (Equation 1 in our Quality and methodology document) contains the following variables:
- local authority district in Great Britain and housing market area in Northern Ireland
- Acorn area classification variable (groups)
- property type (detached, semi-detached, terraced, flat or maisonette)
- floor space (metres squared)
- number of rooms
- new or existing property
For the reduced regression model, the ‘new or existing property’ variable is excluded from the estimation model. From the 12 December 2017 release (data up to October 2017), this reduced regression model has been used to calculate the first estimate only. The estimation model for other periods continue to use the full regression model (Equation 1 in our Quality and methodology document).
The number of new build transactions available for inclusion in the UK HPI is higher for the second estimate for a given month. The 2017 analysis concluded the new build transaction volumes were high enough by the second estimate to be sufficient for the ‘new or existing property’ variable to be included in the estimation model, so the second estimate onwards continues to use the full regression model.
Figure 2: 12-month growth rate for first, final and first estimate under new method, Great Britain
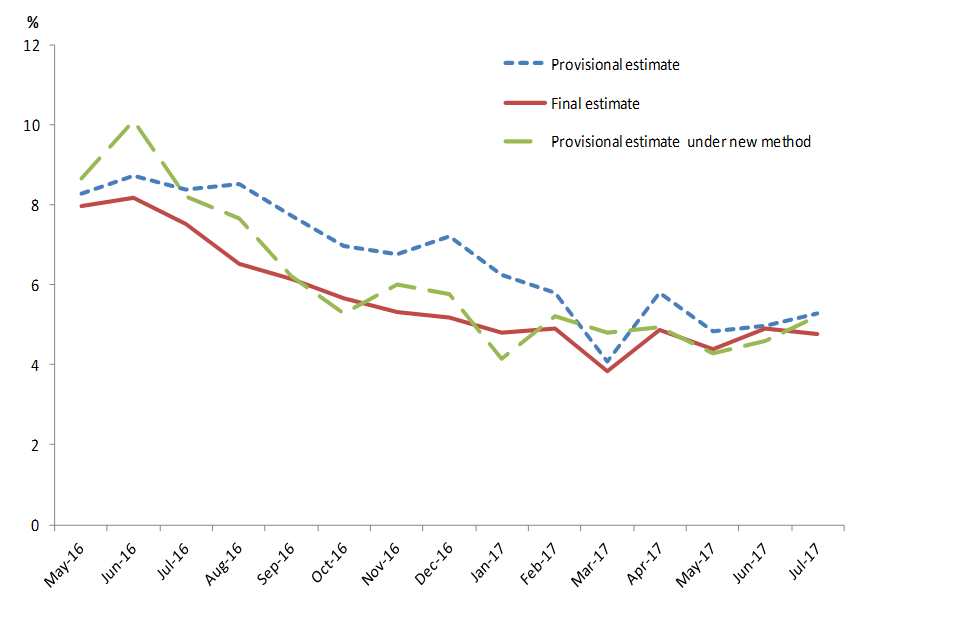
Notes:
1. UK HPI has a 12 month revision policy; data within this period are still subject to revision.
2. Great Britain data is presented here only as Northern Ireland data is processed separately by LPSNI.
The impact of applying this improvement historically is presented in Figure 2 above. While revisions would have still been observed, under the improved approach, they would have been smaller and both positive and negative. Our intention to implement this improvement was published in 2017 within the About the UK House Price Index document and improved the accuracy of our first estimates.
Improvements in 2020
The coronavirus pandemic in 2020 and 2021 impacted the housing market significantly. Introduction of temporary government health protection measures to reduce the spread of the coronavirus led to significantly reduced property transactions and timeliness of price transactions data available to calculate the UK HPI in 2020.
The UK HPI release was temporarily suspended between 20 May 2020 to 19 August 2020. Following a series of interim publications, the usual UK HPI release timetable resumed from 21 October 2020.
The transactions data registration process was affected in this period, with the processing of new build properties being more affected than the processing of existing properties.
To account for the reduced new build transaction volumes in recent periods available for the UK HPI calculations, a temporary “new build pooling” approach was introduced for England and Wales transactions from the 19 August 2020 release.
The “new build pooling” approach combined new build transactions (England and Wales only) from the previous month with all transactions in Great Britain (new and existing property transactions) for the current month. This “pooling” was applied for specific estimates in each UK HPI release (usually the 2nd to 7th estimate for each release). The UK HPI reports page and each monthly UK HPI release since 19 August 2020 reported for which months “new build pooling” was applied in the latest release.
The temporary new build pooling approach has been kept under regular review and will be discontinued from the 22 October 2025 release (data up to August 2025). More details are available in the subsection Improvements in 2025.
Improvements in 2023
One of the key determinants of house price is the demographic characteristics of the area in which the property is located. The UK HPI uses the socio-demographic classification, known as Acorn (produced and licensed by CACI Ltd), in the hedonic regression model to measure the affluence of the area.
Prior to 20 December 2023’s publication, property transactions in Great Britain were excluded from the regression model if their Acorn classification was missing. From 20 December 2023’s publication, these properties are included in the regression model from January 2023’s data onwards, but are given less weight in the calculations, as described in section 3.2 of our Quality and methodology document.
This methodology improvement aligns how transactions with missing Acorn classification are used in the Great Britain model and Northern Ireland model, increasing coherence across the UK and improving the quality of UK HPI statistics.
Improvements in 2024
Following the coronavirus pandemic and stamp duty land tax changes in 2020 and 2021, short-term changes in market behaviour and high variation in monthly transaction volumes were observed. This, combined with a fall in total transaction volumes in England and Wales (HMRC reported a 22% fall in 2023) and a reduction in the proportion of transactions processed by HM Land Registry in time for UK HPI’s first estimates, led to lower total transaction volumes available to calculate UK HPI estimates for recent periods. The availability of new build property data was particularly affected.
The Office for National Statistics (ONS) and HM Land Registry worked collaboratively to improve transactions volumes available for use in the UK HPI and reduce the size of revisions.
HM Land Registry significantly reduced the time taken to process 95% of transactions data, decreasing from 17.5 months to 11.9 months during the 2024/25 year, reported in HM Land Registry’s 2024/25 performance report.
The UK House Price Index Working Group jointly agreed to conduct extended revision periods in 2024 to incorporate the additional price transactions data which was now available for older time periods into the UK HPI calculations, to improve the accuracy of historical UK HPI estimates in affected periods.
On 20 March 2024 and 17 April 2024, UK HPI estimates were revised from January 2021 to present, to make use of price data processed outside the UK HPI’s normal 12-month revision period. In the 20 March 2024 release, the counts of cash and mortgage transactions were incorrect for January 2021 to December 2022. These were corrected in the 17 April 2024 release.
On 18 September 2024, UK HPI estimates were revised from January 2022 to present, to make use of further price data processed outside the UK HPI’s normal 12-month revision period.
By late 2024, HM Land Registry successfully returned to processing over 40% of HMRC’s provisional sales estimate for the UK HPI’s first estimate (the target for the first estimate). HM Land Registry’s speed of service provides detailed information on average completion times for new applications and existing applications. UK HPI sales volume estimates for older periods and new builds remain lower than historical averages, but continue to improve.
Improvements in 2025
Improvements in 2017 (see subsection Improvements in 2017) mitigated against over-estimation of early new build estimates driven by low new build transaction volumes in the most recent months. Although these 2017 improvements slightly reduced the size of downwards revisions, in recent years the UK HPI has continued to observe downwards revisions between the provisional (1st) estimate for a given month and the final (13th) revised estimate for the same month.
ONS’ January 2025 paper, which ONS presented to the Technical Advisory Panel for Consumer Prices (APCP-T), identified an additional driver behind over-estimation of early new build estimates: the increased time for new builds to become available in property attributes data for England and Wales. To target and eliminate this source of over-estimation of new build provisional estimates, ONS proposed an improvement to the Great Britain HPI monthly imputation.
ONS’ April 2025 paper presented preliminary analysis of several options for improving monthly imputation in the Great Britain HPI model. The paper proposed implementing (K nearest-neighbour imputation) to the number of rooms (for Great Britain) and floor area (England and Wales) variables. Table 2 summarises the improvement to methods.
Table 2: Imputation methods improvement for Great Britain
| Variable | Previous method | Improved method |
|---|---|---|
| Floor area | England & Wales: set to zero | England & Wales: imputed using 10 nearest-neighbour imputation |
| Floor area | Scotland: set to zero | Scotland: set to zero |
| Number of rooms | Great Britain: missing indicator | Great Britain: imputed using 10 nearest-neighbour imputation |
The analysis demonstrated that this methodological improvement would reduce over-estimation in early provisional estimates of new build prices in Great Britain, and thereby improve size of downwards revisions in the new build breakdown and headline UK HPI estimates.
The APCP-T gave support for implementing ONS’ proposed imputation improvement and for ONS’ plans for a wider review of UK HPI methods in future. On 28 May 2025, the UK HPI Working Group unanimously agreed to implement ONS’ proposed imputation improvement in UK HPI.
Figure 3 illustrates the impact this imputation improvement would have had on the UK annual inflation rate for new builds if this improvement had been implemented on 18 June 2025 (data up to April 2025).
Figure 3: UK new build annual inflation rate for the old vs improved method
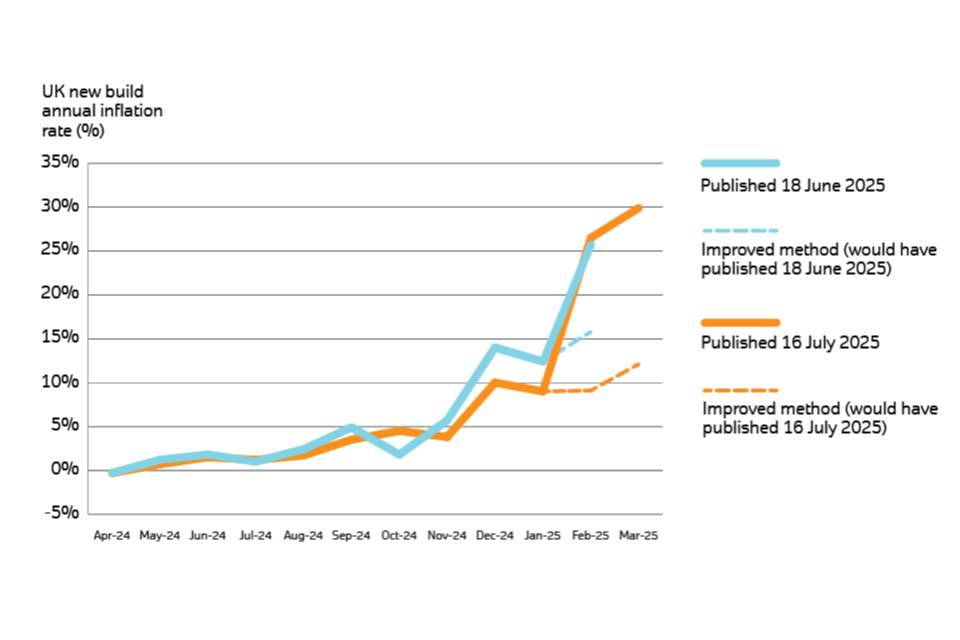
On 16 July 2025, UK new build annual inflation was reported to be 29.9% for March 2025 (3rd revised estimate) and 26.5% for February 2025 (4th revised estimate). These estimates of UK new build annual inflation are more than double the historical (data outside the UK HPI’s 12-month revision period) record-high of 13.1% in the 12 months to May 2016.
Since analysis of historical estimates of UK new build annual inflation shows that estimates have always been revised down between 1st and 13th (final) estimates, it is expected that these early provisional estimates of UK new build annual inflation would have been revised downwards in subsequent monthly releases under the old methodology.
Figure 3 shows that under the improved methodology, on 16 July 2025, UK new build annual inflation would have been reported to be 12.1% for March 2025 (3rd revised estimate) and 9.1% for February 2025 (4th revised estimate). These estimates would have been below the historical record-high of 13.1% in May 2016, and represent more realistic estimates of UK new build annual inflation than the provisional estimates published under the old methodology on 16 July 2025.
This improvement to the monthly imputation for Great Britain will be implemented from the 20 August 2025 release (data up to June 2025). The imputation improvement will be applied from the January 2025 estimate onwards to prevent a methodology step change mid-year. This improvement aims to reduce overall revision size in headline UK HPI estimates by reducing over-estimation of new build price in provisional estimates for the most recent months.
Having been introduced to mitigate against the impact of less timely registrations of property transactions, the need for the temporary ‘new build pooling’ approach (see subsection Improvements in 2020) reduced in 2024 following HM Land Registry’s return to processing over 40% of sales for UK HPI’s first estimate.
ONS’ April 2025 paper demonstrated that the imputation improvement was more effective at reducing over-estimation of provisional new build estimates than the temporary ‘new build pooling’ approach introduced in 2020.
Due to improved timeliness of transaction data and introduction of this imputation improvement, the temporary ‘new build pooling’ approach will be discontinued from the 22 October 2025 release (data up to August 2025).
In addition to this, from 17 December 2025, the work to move the UK HPI production system to a new platform has meant we can introduce a minor improvement in the way we link the datasets used in the production of the UK HPI. This means that on average, the new method has more robust information about property attributes such as floor area and number of rooms being used in the modelling process. This improvement has led to some small revisions back to January 2025.
We continue to monitor revisions to the UK HPI each month to ensure our first estimates remain accurate and reliable. Revisions tables are published alongside the UK HPI data downloads each month to provide further transparency to users.
5. Repossessions
Details of repossession sales are only available for England and Wales.
In August 2016, we began reporting on Repossession data for England and Wales for the month of April 2016.
For England, this is volumes of repossessions recorded by Government Office Region shown as a table and in a heat map. The data is also available to download as a .csv file.
For Wales, there is a headline figure for the number of repossessions recorded in Wales. This data is also included in the .csv file.
6. The difference between the UK HPI and others
Currently, there are a number of different sources of house price statistics published in addition to the UK HPI. There will be differences in the data published by each source, as there are differences in both the data and methodology used. For example, Rightmove use asking prices, sources such as Nationwide and Halifax use their own mortgage approvals data, while the UK HPI uses data at the end of the conveyancing process, calculated based on completed sales.
Find out about the difference between the various house price index measures and their strengths and limitations in our publication Comparing house price indices in the UK.
Property Transaction Statistics published by HM Revenue & Customs differ to those published as part of the UK HPI due to differences in coverage and timeliness of registration, although trends are similar.
High level summary
The UK HPI is calculated based on completed sales at the end of the conveyancing process. This means that while the UK HPI may not be as timely in publishing as the other measures, it is however ultimately more complete with coverage of both cash and mortgage transactions for the whole of the UK. The large data source used, land registrations (such as that maintained by HM Land Registry), allows data to be published down to a local authority level with further breakdowns available by property type, buyer status, funding status and property status.
Halifax house price index and Nationwide house price index
Both Halifax and Nationwide produce house price indices based on their own mortgage approvals only and therefore will not include any cash transactions. They both have UK-wide coverage, and since the Halifax and Nationwide use only their own in-house data they can process them immediately and do not have to await the receipt of data from other lenders. This means that they are timelier than the UK HPI.
LSL Acadata house price index
Similar to the UK HPI in data source. LSL Acadata (previously the LSL Property Services/Acadametrics) HPI is based on completed sales at the end of the conveyancing process using data from HM Land Registry for England and Wales. The HPI provides mix and seasonally adjusted results at national, regional and county or unitary district or London borough levels.
The index can be accessed at Acadata.
Rightmove house price index
The Rightmove index includes all property types that are advertised on its website. However it includes houses that do not subsequently sell and reports only asking prices. If house price movements are different between the non-selling and selling houses then this will affect the accuracy of estimates of house prices and changes in them.
Registers of Scotland official quarterly housing market statistics
Registers of Scotland will continue to produce unadjusted statistics based on these transactions.
House Price Statistics for Small Areas
House Price Statistics for Small Areas (HPSSAs) are published on a quarterly basis calculated based on HM Land Registry Price Paid data. HPSSA’s are not a house price index as they do not control for changes in the mix of properties over time (mix adjust), therefore they provide different figures to the UK HPI. They report non-adjusted average transaction values down to middle super output area.
HM Revenue & Customs Property Transaction Statistics
HM Revenue & Customs (HMRC) data are based on Stamp Duty Land Tax returns. Purchasers have 30 days from the date of completion to submit their land transaction return before incurring a penalty. This means that HMRC transaction volumes are more complete than those published in the UK HPI for recent months. Transaction volumes published by HMRC also differ in coverage to those published in the UK HPI.
We believe that the main reason for this difference is that residential properties where the buyer or seller is a corporate body, company or business are excluded from the HM Land Registry data in the UK HPI but included in HMRC property transaction statistics. UK HPI data exclusions can be found in section 2.
7. Republishing data
UK HPI data is published under Open Government Licence. When using or publishing data from the UK HPI reports, background tables in the statistical datatset: UK House Price Index: data downloads or search tool, you will need to add the following attribution statement:
Contains HM Land Registry data © Crown copyright and database right 2020. This data is licensed under the Open Government Licence v3.0.
When you publish the data, be sure to include information about the nature of the data and any relevant dates for the period of time covered.
Neither HM Land Registry nor any third party shall be liable for any loss or damage, direct, indirect or consequential, arising from:
- any inaccuracy or incompleteness of the data in the UK HPI
- any decision made or action taken in reliance upon the data
Neither shall HM Land Registry or any third party be liable for loss of business resources, lost profits or any punitive indirect, consequential, special or similar damages whatsoever, whether in contract or tort or otherwise, even if advised of the possibility of such damages being incurred.
8. Data tables
When the UK HPI data tables are published each month, they represent our best available view on historic house price movements at the time. As new information becomes available, the tables are revised to reflect any new data. Each month the new data will be added and the previous 12 months updated to reflect any additional sales added for those months.
As the NI House Price Index is published quarterly and sales data form the basis of future domestic revaluations, the NI price data series will be revised as and when necessary to take account of any new sales information received, therefore the most recently published data series from Jan 2005 should be used NI House Price Index from Q1 2005.
8.1 How this data is different to data available from the ‘Search the House Price Index’ tool
The Search the UK House Price Index tool allows customers to produce printable reports derived from the House Price Index data. The reports can also be downloaded in CSV (comma-separated values) on UK House Price Index data downloads, or Turtle (Terse RDF Triple Language) formats, and the SPARQL query generated in the background view. Real-time previews allow search options covering average prices, indices, sales volumes and property types ranging from January 1995 to the most recent available data to be changed easily.
The House Price Index data tables are for customers that would like to download the full dataset in a more usable format which incorporates data behind the UK House Price Index.
The tables are made up of:
- UK HPI full file
- Average price
- Average price by property type
- Sales
- Cash mortgage sales
- First time buyer and former owner occupier
- New build and existing resold property
- Index
- Index seasonally adjusted
- Average Price seasonally adjusted
- Repossessions
The following files are also available detailing revisions to data published in the previous 12 months:
- UK revisions
- England revisions
- Wales revisions
- Scotland revisions
- Northern Ireland revisions
To understand more about the data tables and the differences between the figures, read the following technical information.
8.2 Format of data
The data is available in CSV and linked data formats.
The data is published in columns in the order set out in the table, we do not supply column headers in the files. The acronyms detail as:
- FTB: first time buyer
- FOO: former owner occupier
| Column Header | Explanation |
|---|---|
| Date | The year and month to which the monthly statistics apply |
| RegionName | Name of geography (Country, Regional, County/Unitary/District Authority and London Borough) |
| AreaCode | Code of geography (Country, Regional, County/Unitary/District Authority and London Borough) |
| Average Price | Average house price for a geography in a particular period |
| Index | House price index for a geography in a particular period (January 2015=100). |
| IndexSA | Seasonally adjusted house price for a geography in a particular period (January 2015=100). |
| 1m%change | The percentage change in the Average Price compared to the previous month |
| 12m%change | The percentage change in the Average Price compared to the same period twelve months earlier. |
| AveragePricesSA | Seasonally adjusted Average Price for a geography in a particular period |
| Sales Volume | Number of registered transactions for a geography in a particular period |
| [Property Type]Price | Average house price for a particular property type (such as detached houses), for a geography in a particular period. |
| [Property Type]Index | House price index for a particular property type (such as detached houses), for a geography in a particular period (January 2015=100). |
| [Property Type]1m%change | The percentage change in the [Property Type] Price (such as detached houses) compared to the previous month |
| [Property Type]12m%change | The percentage change in the [Property Type] Price (such as detached houses) compared to the same period twelve months earlier. |
| [Cash/Mortgage]Price | Average house price by funding status (such as cash), for a geography in a particular period. |
| [Cash/Mortgage]Index | House price index by funding status (such as cash), for a geography in a particular period (January 2015=100). |
| [Cash/Mortgage]1m%change | The percentage change in the [Cash/Mortgage]Price compared to the previous month |
| [Cash/Mortgage]12m%change | The percentage change in the [Cash/Mortgage]Price compared to the same period twelve months earlier. |
| [Cash/Mortgage] Sales Volume | Number of registered transactions [Cash/Mortgage] for a geography in a particular period |
| [FTB/FOO]Price | Average house price by buyer status (such as first time buyer/former owner occupier), for a geography in a particular period. |
| [FTB/FOO]Index | House price index by buyer status (such as first time buyer/former owner occupier), for a geography in a particular period. (January 2015=100). |
| [FTB/FOO]1m%change | The percentage change in the [FTB/FOO]Price compared to the previous month |
| [FTB/FOO]12m%change | The percentage change in the [FTB/FOO]Price compared to the same period twelve months earlier. |
| [New/Old]Price | Average house price by property status (such as new or existing property), for a geography in a particular period. |
| [New/Old]Index | House price index by property status (such as new or existing property), for a geography in a particular period. (January 2015=100). |
| [New/Old]1m%change | The percentage change in the [New/Old]Price compared to the previous month |
| [New/Old]12m%change | The percentage change in the [New/Old]Price compared to the same period twelve months earlier. |
| [New/Old] Sales Volume | Number of registered transactions [New/Old] for a geography in a particular period |
8.3 How to access the data
UK HPI data is published monthly in CSV and linked data formats on data.gov.
8.4 Seasonal adjustment
The difference between the tables called Index and Index (Seasonally Adjusted):
- the Index table contains monthly residential property price index at regional, county/unitary authority and London borough level.
- the Index (SA) table contains seasonally adjusted monthly residential property price indices at regional and national level.
8.5 Monthly change and annual change
Data presented in the Monthly Change and Annual Change tables:
- the Monthly Change table contains monthly change figures which represent the month-to-month percentage change of the index.
- the Annual Change table contains annual change figures. These represent the percentage change in the index over the last 12 months.
8.6 Sales volumes table
This table contains counts of all sales included in the electronic register at the time of data extraction. The data collection delay mainly affects the most recent months. The two most recent months are therefore omitted from this data to avoid reporting misleading volumes.
Sales volume data is also available by property status (new build and existing property) and funding status (cash and mortgage) in our downloadable data tables. Transactions involving the creation of a new register, such as new builds, are more complex and require more time to process. Read Revisions to the UK HPI data for more information.
As we are not able to identify the funding status of every property transaction sales volumes for cash/mortgage may not equal the total.
8.7 Levels at which the data is presented
The data presentation is in:
- ‘Monthly Change’
- ‘Index’
- ‘Annual Change’
- ‘Average Prices’
- ‘Sales Volumes’ are provided at national, regional, county/unitary authority, local authority and London borough level
Data in ’Average Prices (SA)’ and ‘Index (SA)’ tables are presented at national and regional level.
9. Searching the UK House Price Index
9.1 About the search tool
The UK HPI search tool allows you to customise searches of the house price data, using specific areas, dates, house types and indicators.
9.2 Browser support
Since April 2014, HM Land Registry does not test new application software releases against Microsoft Windows XP and Microsoft Internet Explorer 8.
We support Microsoft Internet Explorer 9 onwards, Safari 7 onwards and the latest version of browsers that automatically update, such as Mozilla Firefox and Google Chrome.
9.3 Data items displayed
The UK House Price Index (UK HPI) is published by HM Land Registry using sales data collected on residential housing transactions.
The data available is by:
- property type – detached, semi-detached, terraced, flat or all property types
- buyer status – first time buyer or former owner occupier
- funding status – cash and mortgage
- property status – new builds and existing builds
| Data item | Description |
|---|---|
| House Price Indices | Captures changes in the value of residential properties from a base of 100 set in January 2015. |
| Monthly Change | The month-to-month percentage change of the index. |
| Yearly Change | The change in the index over the last 12 months. |
| Volume of Sales | The volume of sales on which the analysis is based. Figures include all sales captured in our Price Paid Dataset at the point of extraction. Sales in the most recent months may not reflect the actual number of sales due to the registration lag time. These are revised over 12 months. Sales data is not available for buyer status. |
| Average Price | Standardised average prices. These can be pulled for all properties or can be split into property type. |
9.4 How to view your results
Our UK HPI data is presented at national, regional, county and borough or metropolitan district level. When you start typing the name of an area a drop-down list of available locations will appear. Select the preferred location from the list to start your search.
If you are unsure of the areas available for reporting on, use the map icon to view the different areas available.
You can compare up to 5 locations using the comparison tool.
9.5 Viewing results
The search tool initially presents results for the UK for the previous 12 months showing the index, average price, volumes, percentage monthly and annual change in both tabular and graphic form. You can change the options (date, location, indicators and property types).
9.6 Available data
All available data is now included in the search tool but not all data is available for all countries. This means:
- Scotland and Northern Ireland data is not available at regional or county level
- historic data – between 1968 and 1995 – is available only at country and region level on a quarterly basis
- property status data does not include the most recent two months, as first estimates for new build are based on a small sample which can cause volatility in initial estimates
- volume data does not include the most recent two months because the data is not complete – we aim to report on accurate and reliable information and therefore do not want to release sales volume data that has the potential to be misleading if quoted out of context
- volume data for buyer status is not available
9.7 Differences between the Search the UK House Price Index tool and the data tables
The Search the UK House Price Index tool allows customers to produce downloadable reports derived from the House Price Index data. The reports can be downloaded in CSV or Turtle formats, and the SPARQL query generated in the background can be viewed. Real-time preview allows search options covering average prices, indices, sales volumes and property types from 1968 to the latest available data to be easily changed.
9.8 The significance of the beta status
The beta status allows us to review the service and make changes to the current format. We will collate feedback during the beta period and where appropriate make changes to the search tool.
10. Calendar release dates
The UK HPI is published on the second or third Wednesday of each month with Northern Ireland figures updated quarterly. There are occasions such as months including public holidays and the end of the financial year where the data is published on the fourth Wednesday or an alternative day.
10.1 Publication dates for the UK House Price Index (HPI)
| Month and year of the data | Publication time and date |
|---|---|
| February 2026 | 22 April 2026 (9:30am) |
| March 2026 | 20 May 2026 (9:30am) |
| April 2026 | 17 June 2026 (9:30am) |
| May 2026 | 22 July 2026 (9:30am) |
| June 2026 | 19 August 2026 (9:30am) |
| July 2026 | 16 September 2026 (9:30am) |
| August 2026 | 21 October 2026 (9:30am) |
| September 2026 | 18 November 2026 (9:30am) |
| October 2026 | 16 December 2026 (9:30am) |
11. Pre-release access
On 15 June 2017, the National Statistician announced that pre-release access to ONS statistics will stop with effect from 1 July 2017.
The UK HPI is a joint production by HM Land Registry, Land and Property Services Northern Ireland, the Office for National Statistics and Registers of Scotland. These departments will continue to work together to produce the release but ministers and those officials not directly involved in the production and release of statistics will not have access to them in advance of publication.
12. Contact
Eileen Morrison, Data Services Team Leader, HM Land Registry
Email eileen.morrison@landregistry.gov.uk
Telephone 0300 006 5288
Ian Boreham, Head of Housing Market Indices, Office for National Statistics
Email ian.boreham@ons.gov.uk
Telephone 01633 456228
Ciara Cunningham, Statistician for the Northern Ireland HPI
Email ciara.cunningham@finance-ni.gov.uk
Telephone 028 90 336035
Garreth Jones, Land & Property Data Team, Registers of Scotland
Email Garreth.Jones@ros.gov.uk
Telephone 0131 378 4114
13. Related articles
Read about changes made to the UK HPI and related articles:
- Comparing house price indices in the UK
- Quality assurance of administrative data in the UK House Price Index
- Improving the UK HPI: Summary of responses
- The UK House Price Index marks one year of publishing - 13 June 2017
- UK House Price Index: new data reveals number of cash buyers - 17 October 2017
- Our UK HPI changes: greater accuracy, fewer revisions - 15 November 2017
- New features for the UK House Price Index search tool and reports - 16 January 2018