Quality and methodology
Updated 16 December 2025

© Crown copyright 2025
This publication is licensed under the terms of the Open Government Licence v3.0 except where otherwise stated. To view this licence, visit nationalarchives.gov.uk/doc/open-government-licence/version/3 or write to the Information Policy Team, The National Archives, Kew, London TW9 4DU, or email: psi@nationalarchives.gov.uk.
Where we have identified any third party copyright information you will need to obtain permission from the copyright holders concerned.
This publication is available at https://www.gov.uk/government/publications/about-the-uk-house-price-index/quality-and-methodology
1. Quality summary
1.1 Important points about the UK House Price Index (UK HPI) data
It is important to note that:
- to allow only pure price change to feed into the measurement of house price inflation, the UK HPI is mix adjusted to allow for differences between houses sold in different periods, for example the type or size of property
- house price inflation is the rate at which the prices of residential property purchased in the UK rise and fall
- the UK HPI is a joint production by HM Land Registry, Land and Property Services Northern Ireland (LPSNI), Office for National Statistics (ONS) and Registers of Scotland
- UK HPI data is published monthly with historical data available from 1968 (the data is quarterly prior to 1995)
- low number of sales transactions in some local authorities and London boroughs (such as Orkney Islands, Na h-Eileanan Siar, Shetland Islands and City of London) can lead to volatility at these levels (geographies with low number of sales transactions should be analysed in the context of their longer-term trends rather than focusing on monthly movements)
- the Isles of Scilly is excluded from the UK HPI due to very low numbers of sales transactions
1.2 Overview of the UK HPI
The UK HPI captures changes in the value of residential properties and uses sales data collected on residential housing transactions, whether for cash or with a mortgage. Monthly UK HPI data are available:
- in England and Wales since January 1995
- in Scotland since January 2004
- in Northern Ireland (NI) since January 2005
UK HPI data is published at national, regional, county and local authority level, including for London boroughs. UK HPI data breakdowns are available for:
- Property type; available for the UK
- New build status; available for the UK
- Mortgage status (bought with or without a mortgage); available for Great Britain
- Buyer status (first time buyer or former owner-occupier); available for Great Britain
In the UK HPI, Northern Ireland data is available on a quarterly basis. House prices, transaction volumes and growth rates are held constant for each month within the quarter. In the 2 months following the end of a quarter, when Northern Ireland results for the most recent quarter are not yet available, indices, house prices and growth rates for Northern Ireland are carried forward from the previous quarter. They are subsequently revised when the quarter is complete.
For a given month, the reported number of sales in Northern Ireland represents the monthly average for the quarter that month lies within. For example, if there were 6,000 sales in Northern Ireland in Q1 (January to March) of a given year, then the number of sales in Northern Ireland for January would be reported as 2,000 (6,000 divided by 3). Similarly, the number of sales in February and March of that year would also be reported as 2,000 so that the total sum of transactions over that quarter would be 6,000.
A longer historical series has been derived back to 1968 by chain-linking the monthly UK HPI series with the discontinued quarterly “old ONS HPI” series. The “old ONS HPI” data is available at a national and regional level only. The “old ONS HPI” series was calculated using different data sources and different methodology to the UK HPI and has different coverage (for example it is based on mortgage transactions only and excludes cash sales). This means that the old-method data are not directly comparable with the more recent new-method UK HPI data due to the methodology step change.
1.3 Uses and users of the UK HPI
The production of house price statistics is relevant for many purposes and has a variety of users who make use of housing market statistics to make a wide variety of decisions including provision of housing, whether to buy, and whether to lend. Main users and their uses of housing market statistics include:
- central government – monitoring economic performance, policy making and regulation
- local authorities – monitoring and developing housing policies
- financial institutions – making decisions on whether to lend, how much to lend and setting interest rates
- housing associations – assessing the number of people in housing need and making decisions on whether to purchase or build property to meet that need
- housebuilders – assessing whether and where demand for new housing exists, and the returns received on homes built or converted
- estate agents and letting agencies – tracking the number of properties sold and the price for which they were sold, as well as the types of properties and their location, and advising potential sellers on the achievable selling price of their property
1.4 Strengths and limitations of the UK HPI
The UK HPI is not as timely in publishing as other house price index measures published in the UK because it is based on completed sales at the end of the conveyancing process, rather than advertised or approved prices.
The strength of the UK HPI is that it has wide coverage of both cash and mortgage transactions and a large data source (land registrations such as that maintained by HM Land Registry) allowing data to be published down to a local authority level with further breakdowns available by property type, buyer status, funding status and property status.
Estimates for the most recent months are provisional and are likely to be updated as more data is incorporated into the index. While changes to estimates are small at the headline level, these can be larger at lower geographies due to the fewer transactions used. Further details on why our estimates change can be found in our revisions policy.
1.5 Recent improvements to the UK HPI
Section 4.9 of our About the UK House Price Index document describes the work that has been done to improve UK HPI estimates since its initial launch.
The most recent improvement to the UK HPI is the introduction of improved monthly imputation methodology for Great Britain from the 20 August 2025 release (data up to June 2025). This improvement aims to reduce initial over-estimation of new build estimates in provisional estimates for the most recent months, and hence aims to reduce the downwards revisions generally observed between provisional (1st) and final revised (13th) UK HPI estimates. More detail about this methods improvement is available in Section 4.9 of our About the UK House Price Index document.
We will continue to monitor UK HPI revisions and seek to identify potential further methods improvements in the future.
2. Quality characteristics of the UK HPI
2.1 Relevance
The UK HPI was developed in response to the National Statistician’s Review of House Price Statistics (2010) and built on the October 2014 consultation on the development of a definitive house price index (PDF, 280KB) and subsequent published response.
We continue to seek feedback on how we can develop the UK HPI further. Through our LinkedIn UK HPI group we are working with users, stakeholders and our partners to enhance the information and data supplied to ensure the index continues to offer maximum public value.
If you would like to share your feedback on the UK HPI, you can register your interest to join the UK HPI group or contact us for more information.
2.2 Accuracy and reliability
We have several checks in place to minimise processing and data input errors, these include validation checks on data and data cleaning to remove erroneous data.
Find out more detail on our procedures in place to quality assure our data sources in our Quality Assurance of Administrative Data.
The amount of time between the sale of a property and the registration of this information varies. It typically ranges between 2 weeks and 2 months. Occasionally the interval between sale and registration is longer than 2 months.
Transactions involving the creation of a new register, such as new builds, are more complex. As a result, processing takes longer, particularly in England and Wales, and a backlog can build. Read about HM Land Registry’s actions to reduce the backlog, service standards and future plans. HM Land Registry’s speed of service provides detailed information on average completion times for new applications and existing applications.
Because of the lags involved in registering properties, when the first (provisional) estimate is published for a given month, the UK HPI first estimate is based on around 40% of the total volume of transactions that will ultimately get registered for that month. As more data becomes available for inclusion in UK HPI calculations, in subsequent monthly releases, estimates for older periods are based on an increasing proportion of transactions that will ultimately get registered.
Consequently, revisions in the UK HPI are unavoidable given the nature of the data sources. The latest 12 months of UK HPI estimates are subject to revision in subsequent publications in line with the official UK HPI revision period policy.
Section 4.9 of our About the UK House Price Index document describes the strategies employed and improvements made to the UK HPI methodology to optimise the quality of UK HPI estimates.
We will continue to monitor revisions to the UK HPI, especially the impact of new builds taking longer to process than existing build properties. Revisions tables are published alongside the UK HPI data downloads each month to provide further transparency to users.
2.3 Output quality
The UK HPI represents growth in average house prices within a geographic area, this may differ to the growth of individual properties within that geography.
While average prices and growth rates at higher geographies are robust, low sales transactions in some local authorities can lead to volatility at these levels. While efforts are made to account for this volatility, the change in the price in these local levels can be influenced by the type and number of properties sold in any given period. Geographies with low number of sales transactions should be considered in the context of their longer-term trends rather than focusing on monthly movements.
2.4 Coherence and comparability
Currently, there are many different sources of house price statistics published in addition to the UK HPI. There will be differences in the data published by each source, as there are differences in both the data and methodology used. For example, Rightmove use asking prices, sources such as Nationwide and Halifax use their own mortgage approvals data, while the UK HPI uses data at the end of the conveyancing process, calculated based on completed sales. This means that the UK HPI is generally more complete than the other measures with coverage of both cash and mortgage transactions for the whole of the UK and available at a more granular level, however the consequence of this is that its publication is not as timely.
You can also read about the difference between the various house price index measures and their strengths and limitations in our publication Comparing house price indices in the UK.
2.5 Concepts and definitions
The UK HPI is calculated following recommended international best practice as defined in the Eurostat Residential Property Price Index handbook.
In December 2016 we commissioned an additional phase of expert peer review of the methods by a senior economist at the International Monetary Fund. This review confirmed that the UK HPI meets international standards and proposed some additional enhancements. These potential enhancements are summarised in a International Monetary Fund Working (IMF) Paper. We will investigate these proposed enhancements as part of our development plan.
2.6 Geography
Property postcodes are mapped to higher level geographies using the National Statistics Postcode Lookup and the Postcode Directory which can be accessed through the Open Geography portal from the Office for National Statistics.
2.7 Accessibility and clarity
The UK HPI data is published under Open Government Licence. Data is made available in several formats each month:
- reports are provided for the UK, England, Scotland and Wales, with a separate link to the Northern Ireland House Price Index report which is published quarterly
- the underlying UK HPI data can be downloaded in comma-separated values (CSV) format through UK HPI data downloads, or Terse RDF Triple Language (Turtle) formats, and the SPARQL query generated in the background view
- the Search the UK House Price Index tool allows customers to produce printable reports derived from the UK House Price Index data
More details on related releases can be found on the announcements on GOV.UK. If there are any changes to the pre-announced release schedule, public attention will be drawn to the change and the reasons for the change will be explained fully.
2.8 Timeliness and punctuality
The UK HPI follows a monthly publication schedule and is lagged by 2 months. This lag is due mainly to the time it takes to collect and process the data.
The exact time of publication of the HPI depends on data availability and delivery, that’ why the HPI statistical bulletin is published either on the second or third Wednesday of the second month after the reference period.
Calendar release dates are available on the website and provide 12 months’ advance notice of release dates. In the unlikely event of a change to the pre-announced release schedule, public attention will be drawn to the change and the reasons for the change will be explained fully at the same time, as set out in the Code of Practice for Statistics.
2.9 The trustworthiness of our data
We commit to the pillars, principles and practices of the Code of Practice for Statistics in producing the UK HPI.
The Office for Statistics Regulation has designated the UK House Price Index as a National Statistic. A letter from the Director General for Regulation details the actions that were taken to meet the requirements as set out in the UK HPI assessment report.
3. Methods used to produce the UK HPI
The UK HPI brings together several comprehensive administrative data sources. There is an increasing reliance on the use of administrative data in the production of official statistics. This has been recognised by the Office for Statistics Regulation, who published a Regulatory Standard for the quality assurance of administrative data. While the data sources used in the UK HPI are summarized in this section, more comprehensive information on these data sources and how we have assessed the quality of them can be found in our Quality Assurance of Administrative data.
The data sources used to produce the UK HPI fall into 2 distinct categories; price data or property attributes data.
The price data provides details of the final transaction price at which a residential property has been sold (this source of data does include limited property attributes data) whilst the property attributes data provides details regarding the actual property, such as the type of property (for example detached, semi-detached), the size of the property (number or rooms or floor space) and the location of the property. Combining the detailed property attributes data with the price data provides a comprehensive and robust dataset required for use in a hedonic regression model, which is defined in section 3.2.
3.1 Main data sources
Price Data: HM Land Registry for England & Wales
Data on residential property transactions for England and Wales, collected as part of the official registration process are provided by HM Land Registry for properties that are sold for value.
There are a few registrations excluded from the data used in the UK HPI. These include sales of residential property not sold for value such as the sale of part of a property, a transfer between parties on divorce, ‘Right to buy’ sales at a discount, remortgages etc. In addition, all commercial transactions of residential properties are excluded from the dataset (where transactions of residential properties involve a transfer to a corporate body, company or business).
Access the quality assurance of administrative data used in the production of UK HPI – HM Land Registry data.
Price Data: Registers of Scotland house price data
Similar to HM Land Registry data, residential property sales for Scotland are provided by Registers of Scotland (RoS) for use in the calculation of the UK HPI. The Scotland price data provided for the UK HPI is a by-product of the Scottish property registration process, whereby property sales are submitted to RoS on completion of a sale.
The coverage of the RoS data differs to the Price Paid Data slightly in that transactions relating to residential properties where the buyer or seller is a corporate body, company or business are included within this dataset. Its coverage is like that of the LPSNI as these transactions cannot be separately identified on the dataset.
Access the quality assurance of administrative data used in the production of UK HPI – Registers of Scotland data.
Price Data: Northern Ireland price data
Land and Property Services/Northern Ireland Statistics & Research Agency calculate the Northern Ireland House Price Index. This data is provided to the Office for National Statistics on a quarterly basis and combined with the Great Britain data to give overall figures for the UK.
Property attribute data: UK Finance – Regulated Mortgage Survey
The Regulated Mortgage Survey (RMS) is UK Finance’s version of the Mortgage Product Sales Data (PSD) that all regulated lenders report to the Financial Conduct Authority (FCA). This is detailed transaction level data on mortgage completions. Starting in April 2005, the RMS now contains over 12 million individual mortgage sale records.
The RMS is the only comprehensive source of data available for the type of borrower and provides the necessary data to allow the UK HPI to be produced according to whether the buyer is a first-time buyer or an existing owner.
Access the quality assurance of administrative data used in the production of UK HPI – UK Finance.
Property attribute data: Valuation Office Agency Council Tax Valuation list
The main source of property attributes data that is used to supplement house price data for England and Wales is administrative data taken from the Council Tax Valuation list maintained by the Valuation Office Agency (VOA). The VOA has been responsible for banding properties for Council Tax since the tax was first introduced in 1993; before then, the VOA was responsible for the earlier system of domestic rates. The Council Tax Valuation list is a robust source of property attributes (such as the size of the property) data that covers, in principle, all residential properties in England and Wales.
Access the quality assurance of administrative data used in the production of UK HPI – Valuation Office Agency Council Tax Valuation Lists.
Property attribute data: Land and Property Services Northern Ireland valuation vist
Land and Property Services maintain the list of Northern Ireland properties which are valued for rating purposes. The data are maintained and validated similarly to the VOA data described above. The valuation list database contains all the property attributes required for the hedonic regression used in the production of the NI Residential Property Price Index (RPPI).
Access the quality assurance of administrative data used in the production of UK HPI and Northern Ireland House Price Index – Land and Property Services Northern Ireland valuation list.
Property attribute data: Energy Performance Certificates Scotland
Scottish Energy Performance Certificates (EPC) are used to provide the floor area of the property and the number of habitable rooms required for calculation of the UK HPI for Scotland. This is matched against the price paid data provided by RoS (using the address details of the property).
EPCs were introduced to comply with European legislation which requires that an EPC be provided on construction, sale or rental of a building to a new tenant.
The legislation establishing the EPCs, The Energy Performance of Buildings (Scotland) Regulations 2008, came into force towards the end of 2008, meaning that EPCs exist for all residential property transactions that have taken place since January 2009.
Access the quality assurance of administrative data used in the production of UK HPI – Scottish Energy Performance Certificates.
Property attribute data: Acorn classification
A key determinant of house prices is the demographic characteristics of the area in which the property is located, such as the affluence of those people living in the area. A well-established geo-demographic segmentation of the UK is available through the Acorn dataset, produced and licensed by CACI Ltd. Acorn segments postcodes into categories and groups by analysing significant social factors and behaviours. Access the quality assurance of administrative data used in the production of UK HPI – Acorn (CACI Ltd).
3.2 How we process the data
Adjusting for the mix of properties
A house price index (HPI) is a series that tracks the changes in the price of property relative to the price it had at a reference period. Changes in the series represent increases and decreases in house prices. One of its main features is the mix-adjustment of the monthly transactions to remove the effect of changing composition of sold properties, to make sure we are comparing like with like. The index uses hedonic regression to perform the mix adjustment.
Valuing a property
In a hedonic regression, properties are defined in terms of a set of characteristics, each of which contributes to the price paid for a property. For example, the number of bedrooms, or the location of the property will contribute to the amount paid, but no features can be priced in isolation.
Each month our price data (for example, HM Land Registry) is matched to the property attribute data (for example VOA) data so that for each transaction we have a price and a set of characteristics.
A regression model is used to estimate the value of each characteristic from the set of properties during a period. For example, the model might estimate the effect that every additional room and each different location have in the sale price in a certain month. Then, the price of a property can be calculated by combining the values assigned to each of its features. This method allows us to estimate the prices of properties with every combination of features (such as number of rooms and regions), even if that combination did not trade in the period.
A fuller description of this method and other alternative methods for calculating house price indices can be found in the Handbook on Residential Property Price Index.
In the case of the UK HPI, the price-determining characteristics are as follows:
- local authority district in Great Britain and housing market area in Northern Ireland
- Acorn area classification variable (groups)
- property type (such as detached, semi-detached, terraced, flat)
- floor area (metres squared)
- number of rooms
- new or old property
Equation 1
Mathematically, a semi-log model is used, of the form:
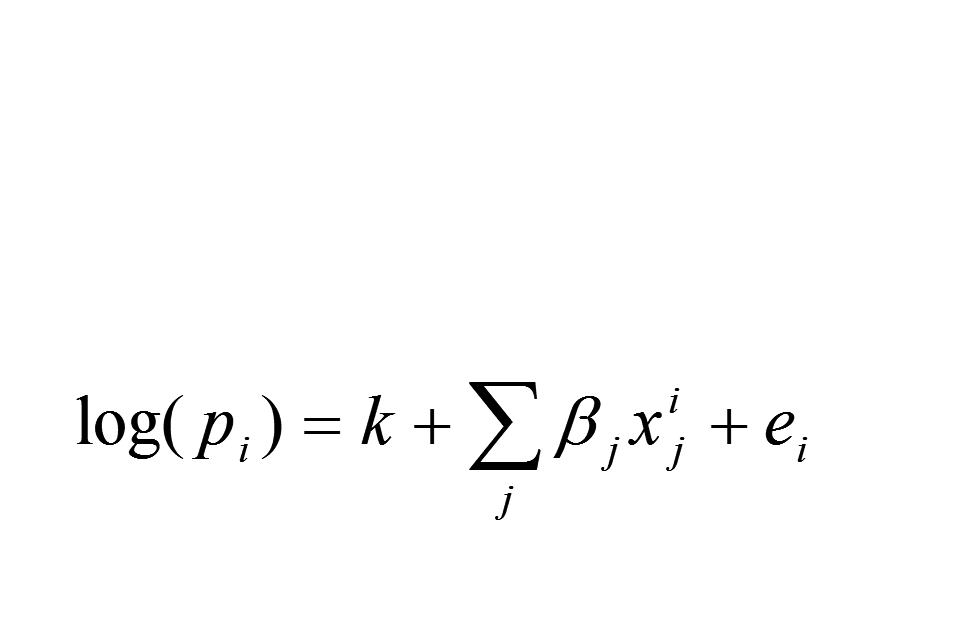
Equation 1, where:
pi is the price of property i
k is a constant
xij indicates whether property i has the characteristic j (such as detached property). If so, it takes the value 1, otherwise it takes the value 0 (except for floor area where it takes the floor area in m2)
βj is the coefficient associated with characteristic j
ej is the statistical error term
In this equation, the logarithm of the price paid is used because house prices tend to be log-normally distributed - meaning. the frequency distribution of the log of the price is bell-shaped.
The price determining characteristics are combined to give a predicted price for each property. These predicted prices are then averaged using a geometric mean, which involves multiplying the ‘n’ predicted prices together, and then taking the nth root. We consulted with international experts and the GSS Methodological Advisory Committee when deciding which was the most appropriate average to use. The general view was that the geometric mean was the preferred measure, as it is less distorted by high values. The ratio of the geometric mean average prices in successive time periods then gives the price index.
The Acorn area classification code is available at different levels of detail. The group level, comprising 18 groups, is used in the regression analysis for GB, whereas the 6 category level is used in NI due to the smaller population. The room’s variable is treated as a categorical variable, where a coefficient is calculated for each number of rooms in the property, up to a maximum of eight, rather than a rate per room. The quality of the rooms data in NI is insufficient to allow it to be included in the NI model.
It is not possible to measure all the characteristics that may influence prices. For example, qualitative factors relating to the condition of the properties, amount of traffic, distance to shopping or places of work etc are not measured. Consequently, it is not possible to explain all of the variation in prices that is observed. However, the characteristics used in the equations in this study generally explain around 80% of the variation.
A process flow of this can be found within the Summary of UK HPI production process within ONS (PDF, 315KB).
Missing characteristics
When running the hedonic regression model, some properties may be missing one or more of their price determining characteristics – for instance, floor area may not be available. These properties are still used in the regressions, but are given less weight in the calculations depending on the importance of the missing variable as a price determinant. For instance, floor area is found to have more of a bearing on price than whether the property is new or old and existing property, so a property with missing floor area will have a lower weight than one missing the new or old existing property indicator.
Calculating first estimates
As noted previously in this article; it typically takes between 2 weeks and 2 months to complete the registration process, with purchases of new properties taking longer than pre-existing properties. Further analysis also seemed to suggest that more expensive properties are registered slightly quicker than other properties. As the number of new build transactions in our first estimate is too low to enable us to produce reliable estimates for this breakdown the ‘new or old property’ variable has been removed from our estimation model when calculating our first estimates.
Equation 2
Since 12 December 2017 (October 2017 estimates) our first estimate is calculated as follows:
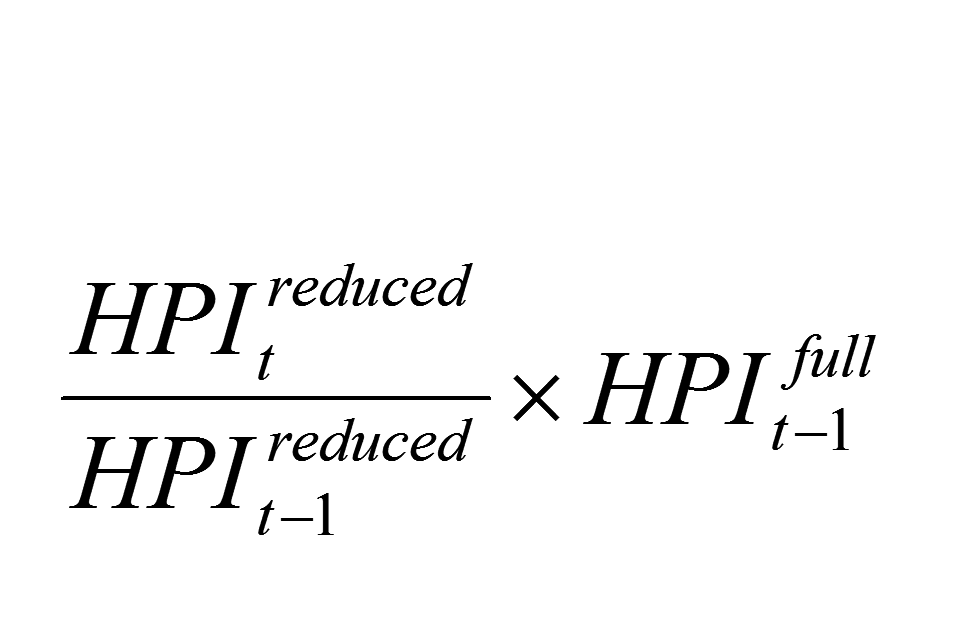
Equation 2, where:
HPI reduced (t) is the house price in the current period with the ‘new/existing property’ variable removed from the model
HPI reduced (t-1) is the house price in the previous period with the ‘new/existing property’ variable removed from the model
HPI full(t-1) is the house price in the previous period with all variables included in the model
For example, to produce the first estimate for June 2025 (so t in Equation 2 represents June 2025) we:
- Run the full regression model (with the six price-determining characteristics listed above Equation 1) on updated transactions data linked to updated attributes data for May 2025. This produces the second estimate for May 2025 and represents HPI full (t-1) in Equation 2.
- Run the reduced regression model (omitting the ‘new/existing property’ variable) on transactions data linked to attributes data for June 2025. This produces the raw predicted price for the first estimate for June 2025 and represents HPI reduced (t) in Equation 2.
- Use the raw predicted price for the first estimate for May 2025 which was produced in the previous month’s calculations using the reduced model for provisional May 2025 data, which represents HPI reduced (t-1) in Equation 2.
- Perform the calculation in Equation 2 to produce the model-predicted price used to publish the first estimate for June 2025.
This approach has only been applied in calculating the first estimate. The calculation of previous periods remains as stated in Equation 1. Further details on the reasons for this change and its impact can be found in Section 4.9 of our About the UK House Price Index document.
Weighting the price index
The UK HPI is mix-adjusted to allow for the fact that different houses are sold in different periods; by annually updating the weights (section 3.4.1 of ‘Official House Prices Explained (PDF,974KB)’ provides a useful worked example of the need for mix-adjustment). The mix-adjustment weights are calculated annually and are calculated using the latest complete years’ worth of transactions.
For example, the weights used in 2018 are calculated based on transactions in 2017. In constructing these weights all properties need to have a complete set of characteristics. This is achieved by imputing for missing values using a ‘nearest neighbour’ method, whereby the missing value is replaced by a non-missing value ‘donated’ from a randomly chosen property with the same values for the non-missing variables.
It should be noted that imputation also takes place for buyer status (for example first time or former owner-occupier) and cash or mortgage which means that average predicted prices, and hence price indices, can be calculated for these variables. Buyer status is obtained in the first instance by matching data from UK Finance with data from HM Land Registry and Registers of Scotland. This will, by definition, not cover cash purchases; for these, it is assumed that they are all purchases by former owner-occupiers.
Publication of average prices
The process of mix-adjustment requires that, in each January, a fixed basket of properties is updated to reflect changes in the composition of properties being sold. This basket is then used to produce modelled prices for the year, before the basket is then updated again in the subsequent January. This means that the average prices produced from a fixed basket in 2016 are not directly comparable with the average price produced using the 2017 basket as they will reflect a different mix of properties.
To produce comparable house prices over time, a base set of average prices is uprated with the price index. To ensure the base set of transactions remains representative, the base period for the price series will be updated every 5 years, and the whole of the average price series rescaled to align with the new base period.
Before the 19 February 2025 release, UK HPI used January 2015 as the base for average prices. If 2020 had reflected typical market conditions, this base would have been updated to January 2020 (adhering to the 5-year update policy). However, 2020 was not an appropriate base period due to short-term changes in housing market behaviour and activity in 2020 and 2021 following the coronavirus (COVID-19) pandemic and temporary changes to Stamp Duty Land Taxes across the UK.
In the 19 February 2025 release, UK HPI was re-referenced with January 2023 as the new base period. The UK HPI index values for January 2023 equal 100 and price levels are derived by taking the January 2023 average price of a reference set of properties and applying individual period inflation rates to produce the full time series. Read more in our blog Keeping average house prices up to date.
Re-referencing shifts the entire price level timeseries for each geography and breakdown by a constant percentage shift, but inflation rates are unaffected by re-referencing.
The UK HPI was re-referenced because the types of property being sold can change over time. Updating the UK HPI reference period from January 2015 to January 2023 allows the UK HPI to better reflect the observed change in the type of properties currently being sold.
Between 2015 and 2023, the proportion of UK property transactions relating to sales of smaller properties increased (for example, there were proportionately more sales of flats than detached properties) and sales in more expensive parts of the UK proportionately decreased (for example, there were proportionately more sales in Scotland than in London).
This shift in market behaviour towards increased sales of smaller properties at the less expensive end of the market distribution led to a decrease in the average UK property price when re-referencing from a 2015-based market to a 2023-based market. Hence re-referencing to January 2023 led to a 7.9% downwards shift for the entire historic average UK price level series but inflation rates were unaffected.
As an example, Table 1 illustrates the impact of re-referencing to January 2023 on the UK average price series.
Table 1: Example of re-referencing in the UK HPI
| Month | Index (January 2015=100) | 2015 base price (£) | Index (January 2023=100) | 2023 base price (£) | Monthly inflation rate, regardless of base period (%) | Percentage difference between 2023-base price and 2015-base price (%) |
|---|---|---|---|---|---|---|
| Jan 2015 | 100.0 | 190,665 | 67.3 | 175,636 | -0.5 | -7.9 |
| Feb 2015 | 100.1 | 190,827 | 67.4 | 175,785 | 0.1 | -7.9 |
| Mar 2015 | 100.5 | 191,537 | 67.6 | 176,439 | 0.4 | -7.9 |
| Apr 2015 | 101.3 | 193,225 | 68.2 | 177,994 | 0.9 | -7.9 |
| May 2015 | 102.4 | 195,313 | 68.9 | 179,917 | 1.1 | -7.9 |
| Jun 2015 | 103.2 | 196,802 | 69.5 | 181,289 | 0.8 | -7.9 |
| Jul 2015 | 105.0 | 200,142 | 70.7 | 184,365 | 1.7 | -7.9 |
| Aug 2015 | 105.9 | 201,973 | 71.3 | 186,053 | 0.9 | -7.9 |
| Sep 2015 | 106.1 | 202,389 | 71.4 | 186,435 | 0.2 | -7.9 |
| Oct 2015 | 106.3 | 202,664 | 71.5 | 186,689 | 0.1 | -7.9 |
| Nov 2015 | 107.1 | 204,223 | 72.1 | 188,125 | 0.8 | -7.9 |
| Dec 2015 | 107.5 | 204,920 | 72.3 | 188,767 | 0.3 | -7.9 |
| Jan 2023 | 148.6 | 283,270 | 100.0 | 260,941 | -0.9 | -7.9 |
| Feb 2023 | 147.3 | 280,933 | 99.2 | 258,788 | -0.8 | -7.9 |
| Mar 2023 | 145.7 | 277,782 | 98.1 | 255,885 | -1.1 | -7.9 |
| Apr 2023 | 146.0 | 278,426 | 98.3 | 256,479 | 0.2 | -7.9 |
| May 2023 | 146.5 | 279,350 | 98.6 | 257,330 | 0.3 | -7.9 |
| Jun 2023 | 147.1 | 280,376 | 99.0 | 258,275 | 0.4 | -7.9 |
| Jul 2023 | 148.7 | 283,532 | 100.1 | 261,182 | 1.1 | -7.9 |
| Aug 2023 | 149.5 | 285,073 | 100.6 | 262,602 | 0.5 | -7.9 |
| Sep 2023 | 148.8 | 283,680 | 100.1 | 261,318 | -0.5 | -7.9 |
| Oct 2023 | 148.1 | 282,389 | 99.7 | 260,129 | -0.5 | -7.9 |
| Nov 2023 | 147.1 | 280,476 | 99.0 | 258,368 | -0.7 | -7.9 |
| Dec 2023 | 145.9 | 278,099 | 98.2 | 256,177 | -0.8 | -7.9 |
Note: The data in Table 1 is real data, summarised to illustrate the impact of re-referencing on the price level series and index series, and to demonstrate how inflation rates are unaffected by re-referencing. Prices have been rounded to the nearest £1 and indices have been rounded to one decimal place.
The example in Table 1 shows that the inflation rate (price growth) remains unchanged by re-referencing. It also shows that the historical UK average prices were all shifted downwards by a constant factor of 7.9%, reflecting the observed shift in market behaviour between 2015 and 2023 towards more sales of smaller properties at the less expensive end of the market distribution. This negative 7.9% factor corresponds to the percentage difference between the 2023-based average price for January 2023 and the 2015-based average price for January 2023.
Re-referencing every 5 years ensures that published average prices continue to remain representative of the current market.
3.3 How we analyse the data
Once the data has been aggregated the resulting series are analysed by various breakdowns, over time, and against other published sources of house price growth. Any unexpected movements within the series are explored through the record level data. Monthly curiosity meetings are held to review the new data and discuss any long-term trends in the data and its drivers.
3.4 How we quality assure the data
Quality assurance of each of our data sources can be found in our published guidance Quality Assurance of Administrative Data.
In running our hedonic regression each month, test statistics are analysed to ensure the model has run correctly and fit successfully. This includes analysing the R squared of the model (model fit) and significance of the explanatory variables. An R squared of around 0.8 is achieved. This means that 80% of the variation in price is captured by the explanatory variables. An R squared of 0.8 is high. The old ONS HPI had an R squared of around 0.7.
Following the calculation of new estimates, revision analysis is conducted. This includes:
- revision analysis between first and subsequent estimates at a country and regional level
- revision analysis between new revised estimates and previous published estimates at all published geographical levels
Revisions tables at a country level are published alongside the UK HPI data downloads each month to provide further transparency to users.
3.5 How we present the data
The UK HPI release is published by HM Land Registry monthly on GOV.UK. Data is made available through:
- UK and country specific reports
- CSV downloadable data
- interactive tool
High level summaries are also published by the Office for National Statistics (ONS) and Registers of Scotland which direct users to the main release on GOV.UK.
The ONS also publishes a high level summary of the annual mix-adjusted weights used in the production of the UK HPI, and summarises the latest house and rent price statistics for local areas in the ONS Local housing statistics tool.
Data collected from HM Land Registry, Registers of Scotland and HMRC stamp duty land tax is available from 1995 for England and Wales, 2004 for Scotland and 2005 for Northern Ireland. A longer UK HPI back series has been derived by using the historic path in the (now discontinued) ONS HPI (Excel, 3.7MB). Through this, a derived series is available back to 1968 at the regional level and above.
Local authorities, boroughs, counties and metropolitan areas
A 3-month moving average has been applied to estimates below the regional level to reduce volatility caused by low sales transactions in some local authorities and London boroughs. For example, at the local authority level, the published estimate for March is a simple average of the calculated estimates for January, February and March.
Volatility remains in estimates for local authorities with fewer transactions, such as Shetland Islands, Orkney, City of London and Na h-Eileanan. These series should be considered in the context of their long-term trend rather than focusing on their monthly movements.
A 3-month moving average is not applied for Northern Ireland estimates as they are only available on a quarterly basis.
Seasonal adjustment
The purpose of seasonal adjustment is to remove systematic calendar-related variation associated with the time of the year; that is, seasonal effects.
This facilitates comparisons between consecutive time periods. While the headline index for the UK HPI is non-seasonally adjusted, seasonally adjusted series are made available within the downloadable data. Seasonally adjusted average prices and indices are available at a regional level and above.
Find out more detail on the process for seasonal adjustment on the Office for National Statistics website. Seasonal adjustment parameters are reviewed on an annual basis.