Comparing house price indices in the UK
Updated 23 July 2026

© Crown copyright 2026
This publication is licensed under the terms of the Open Government Licence v3.0 except where otherwise stated. To view this licence, visit nationalarchives.gov.uk/doc/open-government-licence/version/3 or write to the Information Policy Team, The National Archives, Kew, London TW9 4DU, or email: psi@nationalarchives.gov.uk.
Where we have identified any third party copyright information you will need to obtain permission from the copyright holders concerned.
This publication is available at https://www.gov.uk/government/publications/about-the-uk-house-price-index/comparing-house-price-indices-in-the-uk
1. Introduction
The UK House Price Index (UK HPI) is a joint production by HM Land Registry, Land and Property Services Northern Ireland, Office for National Statistics and Registers of Scotland. Launched in June 2016 the UK HPI replaced the previous house price indices separately published by HM Land Registry and the Office for National Statistics. While there is now one government house price index, there are a number of different sources of house price indices published in addition to the UK HPI.
This guide compares the source data, index and methods of the different house price index measures highlighting the strengths and limitations to aid users in choosing the most appropriate index for their requirements.
2. Comparing House Price Index measures
A number of private sector organisations publish their own house price indices. For each there are differences in the data sources and methods used to construct the index, which leads to differences in the indices published. This section reviews the methods and data sources used by the main house price indices and their producers within the UK, namely the UK House Price Index (UK HPI), LSL Acadata HPI, Halifax HPI, Nationwide HPI and the Rightmove HPI. A summary of the methods and data sources used to calculate the index can be found in Table 1.
Table 1: Summary table of HPI characteristics
| Index | Data source | Number of transactions | Coverage | Stage of recording transaction | Adjustment methodology | Weights |
|---|---|---|---|---|---|---|
| UK HPI | Registration data from HM Land Registry, Registers of Scotland and Land and Property Services Northern Ireland | Around 100,000 a month | UK – all transactions | Registration of sale | Hedonic regression | Updated annually |
| Nationwide | Nationwide mortgage lending | Around 12,000 a month | UK – mortgage transactions | Mortgage approval | Hedonic regression | Updated every 2 years |
| Halifax | Halifax mortgage lending | Around 15,000 a month | UK- mortgage transactions | Mortgage approval | Hedonic regression | Updated annually |
| LSL Acadata | HM Land Registry price paid data | Around 80,000 a month | England and Wales – all transactions | Registration of sale | Mix adjustment | Updated annually |
| Rightmove | Advertised properties on Rightmove portal | Around 100,000 a month | England and Wales – all transactions | Advertised date | Mix adjustment | Updated quarterly |
2.1 Coverage
While the data source for the UK House Price Index (UK HPI), LSL Acadata and Rightmove are based on both cash and mortgage transactions, both Halifax and Nationwide produce house price indices based on their own mortgage approvals and therefore will not include any cash transactions. Whilst the majority of property transactions are completed with a mortgage, 30% to 40% of sales are completed as cash purchases. If trends in cash and mortgage sales differ, this may lead to biases in measures that exclude cash sales.
The indices of Halifax and Nationwide are based on their own mortgage applications at the approval stage but after the corresponding valuation have been completed. This may differ to the final sale price as used by the UKHPI and LSL Acadata. Owner occupied properties only are used by Nationwide – buy to let properties are excluded. Buy to let properties are included for the UK HPI, LSL Acadata, Rightmove and Halifax.
From a geographical perspective, the UK HPI, Nationwide and Halifax all publish indices for the UK while LSL Acadata and Rightmove publish indices for England and Wales. LSL Acadata publishes a separate series for Scotland.
2.2 Timeliness
Table 2: Timeliness of index in relation to data availability
| Timeliness | House Price Index | Time published after reference period | Stage of recording transaction |
|---|---|---|---|
| Most Timely | Rightmove | Published during reference period | Advertised price |
| Nationwide | 1 week | Mortgage Approval | |
| Halifax | 1 week | Mortgage Approval | |
| LSL Acadata | 2-3 weeks (forecast) | Registration of sale | |
| Least Timely | UK HPI | 6 weeks | Registration of sale |
Source: Office for National Statistics, Nationwide, Halifax, LSL Acadata, Rightmove
Rightmove is the timeliest of all the indices, publishing estimates during the reference period. This is because its index is based on asking prices from advertised properties. While asking price may be a leading indicator of future sale prices, an advertised property may not ultimately sell for the price it was initially listed for.
Nationwide and Halifax indices are based on their own mortgage approvals, which mean they can process the mortgage data immediately and do not have to wait for the receipt of mortgage data from other lenders. This means they are able to publish around 1 week after the reference period. However, as not all approvals are necessarily completed, the Nationwide and Halifax indices may provide a biased estimate of sale prices.
UK HPI and LSL Acadata are the least timely as they use transaction data at the end of the conveyance process, calculated based on completed sales. Acadata attempt to overcome issues with timeliness through developing a model to forecast estimates for the latest month, based upon available prices and other indices. Although the UK HPI and LSL Acadata are the least timely house price indices they are more complete in ultimately capturing the entire market of transacted properties.
2.3 Weights
Weights are used to combine low-level estimates to higher-level aggregates. For example, individual transactions (house purchases) are aggregated to local authority, regional or national level. All the measures presented in this guide base their weights on transaction data; however, they can vary in how often their weights are updated.
The UK HPI updates its weights on an annual basis based on property transactions in the previous year. Halifax also update their weights annually, while the Nationwide index updates its weights every 2 years.
In updating weights, the indices are effectively updating the “bundle” of characteristics in the typical house to provide a snapshot of the average property currently being bought and sold in the UK. Regular updating weights ensure the index is reflecting the types and location of properties which are currently being transacted. As weights are determined using transaction data, these indices measure the prices of the subset of houses that are transacted, rather than of the entire housing stock.
Until the end of 2013, the LSL Acadata index used weights for property type and location based on the number of housing transactions that took place in England and Wales between January 2000 and December 2003. From January 2014 onwards, it has updated its weights annually based on the number of transactions for the previous four years
2.4 Average price
There are different ways of calculating average prices. These include the arithmetic mean (simple mean), the geometric mean and the median.
The arithmetic mean is generally understood by the general public to be the ‘average price’. However, given the distribution of domestic property prices the arithmetic mean can be influenced by the sale of high value properties. The geometric mean reduces the weighting given to high-value properties when compared to the arithmetic mean and hence is almost always lower, except when all prices are equal. The geometric mean is usually closer to the median than the arithmetic mean.
As a simple example, consider 5 properties, 4 of which are purchased for £100,000 while 1 is purchased for £1m.
The arithmetic mean of these would be calculated by summing the values of all the properties and dividing by the number of properties;
(£100k+£100k+£100k+£100k+£1m)/5= £280,000
The geometric mean of these would be calculated by multiplying the values of all the properties and taking the number of properties as the root of this
5 √(£100k x £100k x £100k x £100k x £1m) = £158,000
While the median is simply the middle number after sorting the data = £100,000
As mentioned in section 2.3 the house price indices referenced in this guide are all weighted average prices and so the example above is very much a simplification. LSL Acadata and Rightmove publish based on an (weighted) arithmetic mean, whilst the UK HPI publishes based on a (weighted) geometric mean. This implies estimates of average house prices for LSL Acadata and Rightmove will be higher than those of the UK HPI.
2.5 Number of transactions
Figure 1: Approximate monthly number of transactions for each index
Source: UK HPI, Nationwide, Halifax, LSL Acadata, Rightmove
There are many factors which impact the quality of statistics, one of which is how many observations (or transactions) an estimate is based on. Other things being equal, statistics based on larger, unbiased, number of observations (transactions) are likely to produce estimates closer to the true value (house price index/growth rate).
Halifax and Nationwide indices are based on their own mortgage data, so naturally have a smaller number of transactions. LSL Acadata use transaction data from HM Land Registry for England and Wales and so represent all registered transactions for this geography, although data from other independent sources are also used.
UK HPI has full UK coverage so its number of transactions is larger than LSL Acadata and is effectively a census of all housing transactions each month. Both the UK HPI and LSL Acadata use the same base transaction data for England and Wales but the UK HPI also includes transaction data for Scotland and Northern Ireland. LSL Acadata publishes a Scotland index separately using transaction data from Registers of Scotland.
Rightmove claim to have a similar number of transactions as reported by HM Land Registry but, as mentioned previously, its index is based on advertised sales, which ultimately might not sell in that period.
2.6 Adjustment methodology
Rightmove and LSL Acadata use an approach which calculates the average price for each property type in each postcode (Rightmove) or Unitary Authority Area/London Borough (LSL Acadata). This method is called ‘mix adjustment with a stratification matrix’. This method requires enough transactions within each property type and location each period. An alternative approach called ‘Hedonic regression’, is considered to be a more sophisticated adjustment methodology which is the method used by the UK HPI, Halifax and Nationwide.
Further information on the hedonic regression method
In a hedonic regression, properties are defined in terms of a set of features or characteristics, each of which contributes to the price paid for a property. For example, the presence of a garden, the number of bedrooms, or the location of the property will all contribute to the amount paid, but none of these features can be priced in isolation.
A regression model is used to estimate the value of each of these features from the set of properties during a particular period. For example, the model might estimate the effect that every additional bedroom and each different location have in the sale price in a certain month. Then, the price of a particular property can be calculated by combining the values assigned to each of its features. This method allows us to estimate the prices of properties with every combination of features (such as number of bedrooms and regions), even if that particular combination did not trade in the period.
A fuller description of this method and other alternative methods for calculating house price indices can be found in the Handbook on Residential Property Price Index.
While the adjustment methodology approach used by the UK HPI, Halifax and Nationwide is the same, the features (or characteristics) used by each in the model may contribute to differences between the indices.
- location (local authority)
- property type
- number of rooms
- floor area
- ACORN area classification
- new or old property
- location (region)
- property type
- number of bedrooms
- ACORN area classification
- new or old property
- location (region)
- property type
- number of bedrooms
- floor area
- area classification (developed by Halifax)
- new or old property
2.7 Revisions
In June 2016 the UK HPI was launched with a 2 months revision policy. This means that when new estimates for the latest month were published, estimates for the previous 2 months were also revised. The reason for this was that due to conveyance delays there can be a lag between the sale of a property and its subsequent appearance in the Land Register. UK HPI and LSL Acadata use transaction data at the end of the conveyance process, calculated based on completed sales. This means that they are ultimately more complete but are subject to revision as more transaction data is incorporated into the index.
Following the live running of the UK HPI we found that the period between the sale of a property and the subsequent registration of this information on the register can exceed 2 months, particularly for new builds. Responding to these findings, from 13 June 2017 the UK HPI extended its revision policy from 2 months to 12 months to ensure all relevant transactions are now reflected in the UK HPI. Further detail on the UK HPI revision policy can be found in Section 4.4 of About the UK House Price Index. LSL Acadata revises its full back series as more transaction data are incorporated into the index.
The indices of Rightmove, Nationwide and Halifax do not publish revisions to their non-seasonally adjusted series. However the seasonally adjusted indices of Halifax and Nationwide are subject to revision as the seasonal adjustment process is re-run each period.
3. Comparing different house price index series
This section presents the various house price index series and associated growth rates as a time series against each other.
Figure 2 presents the average price time series for the various releases. The impact of the use of a different average on the resulting price can be seen with the average price levels of the UK HPI, Halifax and Nationwide, which are relatively consistent with each other over time but much lower than those of LSL Acadata and Rightmove. The volatility in the Rightmove series appears to be impacted more by seasonality, with large peaks during the summer months and troughs during the winter months.
The UK HPI and Rightmove headline with the non-seasonally adjusted index. LSL Acadata, Halifax and Nationwide headline with the seasonally adjusted index. The UK HPI seasonally adjusted index is published as part of our suite of associated datasets.
Figure 2: Average house prices, January 2005 to December 2018
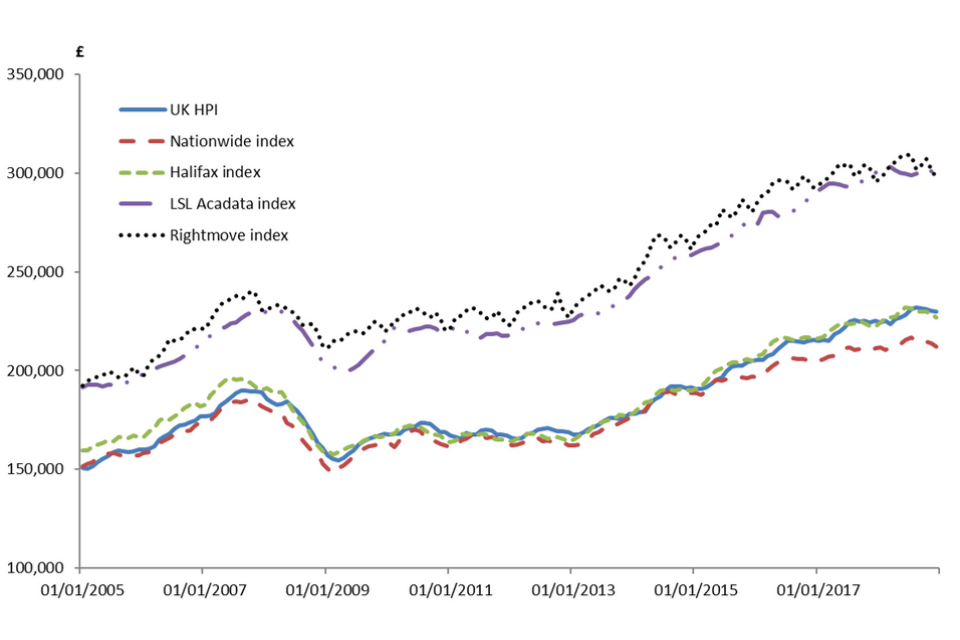
Source: UK HPI, Nationwide, Halifax, LSL Acadata, Rightmove
Note: LSL Acadata and Rightmove are England and Wales only, the others are UK coverage.
As house price indices are used to measure inflation in house prices, what may be of more interest is the growth in house prices, rather than the level (£s). From a growth perspective, over longer periods all the series follow broadly the same trend, as shown in Figure 3. In the short term, such as growth from month to month, there can be some deviation between the series, which is driven by differences in coverage and methodology of the series, as explained in this guide.
During some periods, like 2017, there is a divergence in the annual growth levels of the indices, particularly between those of the UK HPI and LSL Acadata against the other measures. To identify what was driving this difference, ONS conducted some additional analysis using Regulated Mortgage Survey data and found 2 main drivers.
Stage of recording transactions
It can take time (2 to 3 months) for effects in a mortgage approval series to be reflected in series based on completed sales. The indices of Halifax and Nationwide are based on their own mortgage applications at the approval stage while the UK HPI and LSL Acadata use data at the end of the conveyancing process, calculated based on completed sales.
Coverage
While estimation methodology and weights do have some impact, we found that the main reason for differences between the UK HPI and the Nationwide HPI is coverage of transactions. Nationwide produces house price indices based on its own mortgage approvals and therefore will not include any cash transactions. Buy to let transactions are also excluded.
While annual growth rates of the house price indices diverged during 2017, they have converged again during 2018 they have begun to converge once more. So, while they can diverge in the shorter term, due to the reasons noted in this article, over the longer term they all move in a similar way.
Figure 3: Annual house price rate of change, January 2006 to December 2018
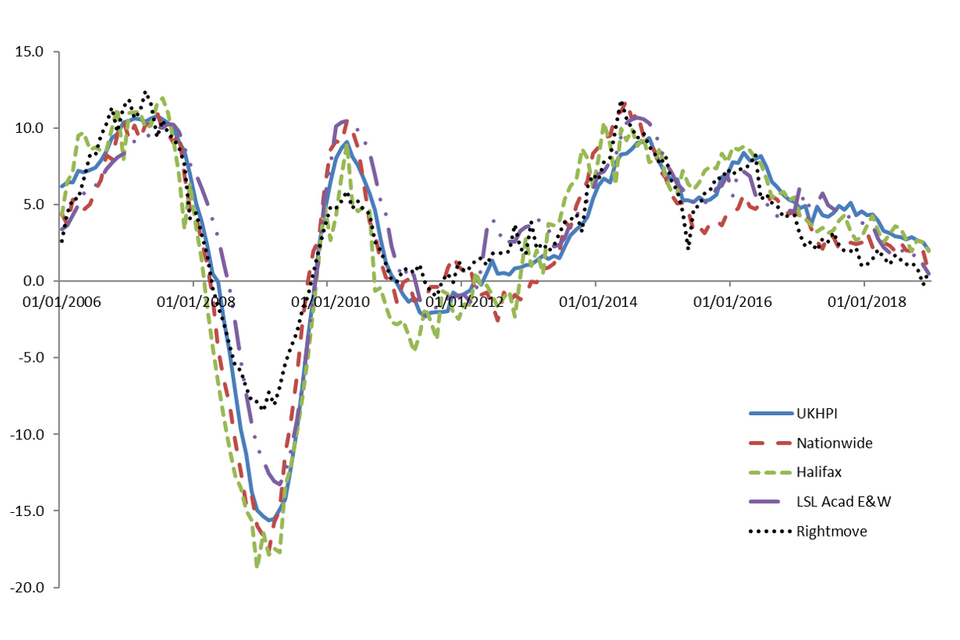
Source: UK HPI, Nationwide, Halifax, LSL Acadata, Rightmove
Note: LSL Acadata and Rightmove are England and Wales only, the others are UK coverage.
4. Conclusion
As we have seen, there are a number of reasons why the indices might differ. In part, they can be interpreted as measuring slightly different things; even when they purport to be measuring the same thing, they employ slightly different methodologies and use different underlying data.
When considered over the long term, the trends in the series are broadly similar, which provides additional confidence in the UK HPI being a robust measure of house price inflation. While the UK HPI is not as timely as the other measures, given the nature of the data used, it is more complete with coverage of both cash and mortgage sales for the whole of the UK.
With regard to the data made available, the UK HPI publishes average house price estimates, indices and associated growth rates down to a local authority level, with further breakdowns available by:
- property type
- buyer status
- funding status and
- property status
This is more granularity than the other house price indices. In addition, the UK HPI (and that of LSL Acadata) are based on completed sales (rather than advertised or approved) which may better reflect true house price trends, albeit with a publishing lag.
This guide summarises the data and methods of the various house price indices. Section 3 of this guide will be updated on an annual basis with an extension to the time series presented in Figure 2 and Figure 3.