Quarterly epidemiological commentary: mandatory MRSA, MSSA and Gram-negative bacteraemia, and C. difficile infection data (up to January to March 2022)
Updated 9 July 2026
Applies to England

© Crown copyright 2026
This publication is licensed under the terms of the Open Government Licence v3.0 except where otherwise stated. To view this licence, visit nationalarchives.gov.uk/doc/open-government-licence/version/3 or write to the Information Policy Team, The National Archives, Kew, London TW9 4DU, or email: psi@nationalarchives.gov.uk.
Where we have identified any third party copyright information you will need to obtain permission from the copyright holders concerned.
This publication is available at https://www.gov.uk/government/statistics/mrsa-mssa-gram-negative-bacteraemia-and-cdi-quarterly-report/quarterly-epidemiological-commentary-mandatory-mrsa-mssa-and-gram-negative-bacteraemia-and-c-difficile-infection-data-up-to-january-to-march-2022
Data included in this quarterly epidemiological commentary
This document contains quarterly, national-level epidemiological commentaries for Meticillin-resistant Staphylococcus aureus (MRSA), Meticillin-sensitive Staphylococcus aureus (MSSA), Escherichia coli (E. coli), Klebsiella spp. and Pseudomonas aeruginosa (P. aeruginosa) bacteraemia and Clostridioides difficile infection (CDI). This includes analyses on counts and incidence rates of all reported, hospital-onset (previously referred to as trust-apportioned) and community-onset (previously referred to as non trust-apportioned) cases of MRSA, MSSA, E. coli, Klebsiella spp. and P. aeruginosa bacteraemia and CDI. All data tables associated with this report are included in an OpenDocument spreadsheet.
Revisions to data included are covered by a data-specific revisions and correction policy.
Citation to UK Health Security Agency (UKHSA), healthcare associated infections (HCAI) and antimicrobial resistance (AMR) division is required.
Citation: UK Health Security Agency. Quarterly epidemiology commentary: mandatory MRSA, MSSA and Gram-negative bacteraemia and C. difficile infection in England (up to January to March 2022) London: UK Health Security Agency, July 2022.
COVID-19 and this data
The coronavirus (COVID-19) pandemic appears to have impacted the number of cases of both bacteraemia and CDI observed during this period. In general, counts of all reported cases during the financial year April 2020 to March 2021 were lower than would be expected, while counts of hospital-onset Klebsiella spp. and P. aeruginosa cases increased and exceeded previous counts of cases observed in this setting. Analysis of voluntary laboratory surveillance data also showed a reduction in the total number of cases of other bloodstream infections during this period, so the phenomenon was not limited to the species covered by the mandatory surveillance. As the voluntary laboratory surveillance shows similar trends to the mandatory surveillance scheme, these changes do not appear to be a specific ascertainment problem in the mandatory programme.
In response to the pandemic, elective procedures in hospitals were initially cancelled or delayed, although some activity resumed between COVID-19 waves. As a result, the number of beds occupied overnight – the denominator used for hospital-onset infection rates – was much lower than would otherwise be expected during these periods. Therefore, in some instances increased incidence rates of hospital-onset infection have been reported, despite a decrease in the counts of infections.
Further information
This publication forms part of the range of National Statistics outputs routinely published by UKHSA which include monthly and annual reports on the mandatory surveillance of MRSA, MSSA and E. coli, Klebsiella spp. and P. aeruginosa bacteraemia and CDI.
Annual report output
Further epidemiological analyses by financial year can be found in UKHSA’s annual epidemiological commentary.
Monthly report outputs
The following reports are produced by UKHSA monthly.
MRSA bacteraemia – counts of all reported, hospital-onset cases, community-onset cases, healthcare associated and community associated MRSA bacteraemia by organisation.
MSSA bacteraemia – counts of all reported, hospital-onset cases, community-onset cases, healthcare associated and community associated MSSA bacteraemia by organisation.
E. coli bacteraemia – counts of all reported, hospital-onset cases, community-onset cases, healthcare associated and community associated E. coli bacteraemia by organisation.
Klebsiella spp. bacteraemia – counts of all reported, hospital-onset cases, community-onset cases, healthcare associated and community associated Klebsiella spp. bacteraemia by organisation.
P. aeruginosa bacteraemia – counts of all reported, hospital-onset cases, community-onset cases, healthcare associated and community associated P. aeruginosa bacteraemia by organisation.
CDI – counts of all reported, hospital-onset cases, community-onset cases, healthcare associated and community associated CDI by organisation.
Data for this report was extracted from UKHSA’s HCAI data capture system (DCS) on 19 May 2022.
Epidemiological analyses of Gram-negative bacteraemia data
E. coli bacteraemia
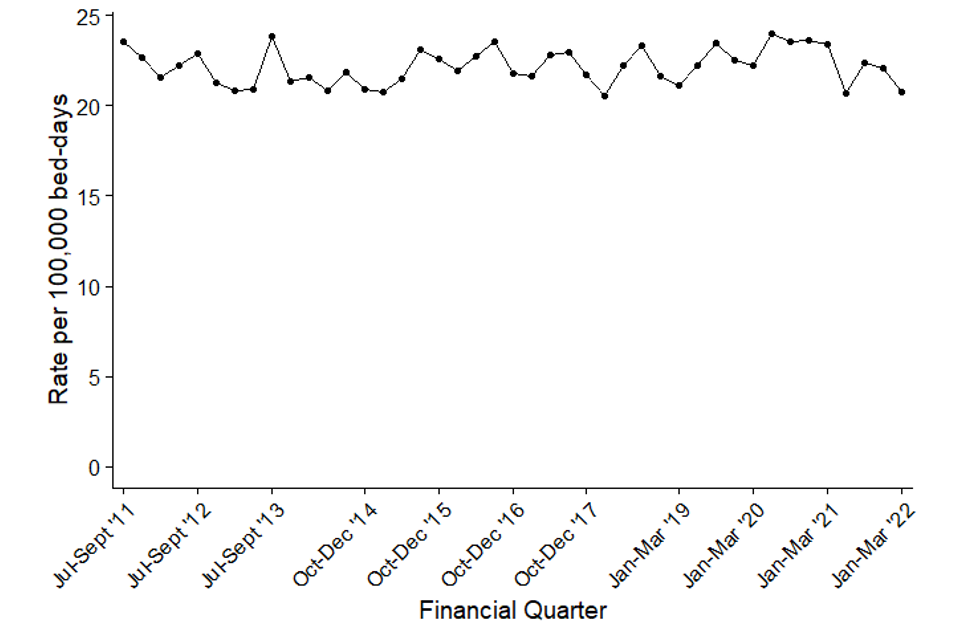
The incidence rate of all reported E. coli bacteraemia increased each year between the initiation of the mandatory surveillance of E. coli bacteraemia in July 2011 and the start of the COVID-19 pandemic (January to March 2020, Figure 1a). This increase was primarily driven by community-onset cases (Table S1). The number and incidence rates of all reported and community-onset cases declined after the start of the pandemic but remain higher than observed at the start of E. coli surveillance (Figure 1a). In contrast, the incidence rate of hospital-onset cases remained relatively stable during the same period, except for a sharp reduction observed in April to June 2021 (Figure 1b).
Between July to September 2011 and January to March 2022, the count and the incidence rate of all reported cases of E. coli bacteraemia increased by 8.4% from 8,275 cases to 8,972 and from 61.8 to 63.8 cases per 100,000 population, respectively. Similarly, over the same period, the count of community-onset cases increased by 14.9% from 6,279 to 7,213, while the incidence rate increased by 9.4% from 46.9 to 51.3 cases per 100,000 population. Concurrently, the count of hospital-onset cases decreased by 11.9% from 1,996 to 1,759 cases. This corresponded to a decrease in the incidence rate of hospital-onset cases by 11.8% from 23.6 per 100,000 bed-days to 20.8 per 100,000 bed-days.
When comparing the most recent quarter (January to March 2022) to the same period in the previous year (January to March 2021) there was a 1.6% increase in both the count and incidence rate of all reported cases from 8,829 to 8,972 and 62.8 to 63.8 per 100,000 population, respectively (Figure 1a). Community-onset E. coli bacteraemia cases increased by 1.8% from 7,088 to 7,213, with the community-onset incidence rate increasing by the same percentage (1.8% from 50.4 to 51.3 per 100,000 population, Table S1).
In January to March 2022, hospital-onset E. coli bacteraemia cases increased by 1.0% from 1,741 to 1,759 compared to January to March 2021 (Figure 1b). However, over the same period the incidence rate decreased by 11.1% from 23.4 to 20.8 per 100,000 bed-days. It is important that these figures are interpreted with caution. Fluctuations in the level of hospital admissions during the pandemic has affected the total count of overnight patient bed-days in 2021, which as the denominator for the calculation of hospital-onset rates. Overnight bed-days were 15.2% lower in January to March 2021 when compared to the same quarter in 2019. There has been a slow return to more typical counts of overnight bed-days in the current quarter (January to March 2022), which is 13.6% higher than the same quarter in 2021. The decline in incidence rates but not counts of cases is due to a steady return to the typical number of overnight bed-days in January to March 2022 compared to the unusually low levels in January to March 2021. While hospital admissions were lower during the pandemic, over the same period, between January to March 2021 and January to March 2022, there has been a slow increase in hospital admissions. However, this is happening at a greater magnitude than the increase in cases, which is why a decline in incidence rate is observed.
In the period since January to March 2020, the total count of hospital-onset E. coli bacteraemia cases has been lower than that observed in the pre-pandemic period, most obviously in April to June 2020 (n= 1,337). During this period the incidence rate of hospital-onset cases remained relatively stable, suggesting the rate of declines in the numbers of both overnight bed-days (hospital activity) and hospital-onset cases was similar.
When comparing the most recent quarter with January to March 2019, which is a more typical period prior to the COVID-19 pandemic, there is a 12.5% decrease in total cases from 10,248 to 8,972 with a corresponding decrease of 13.6% in the incidence rate from 73.8 to 63.8 cases per 100,000 population (Figure 1a). Community-onset cases decreased by 14.1% from 8,394 to 7,213; similarly, the incidence rate of community-onset cases also declined by 15.2% from 60.5 to 51.3 cases per 100,000 population. Finally, hospital-onset cases decreased by 5.1% compared to the same period from 1,854 to 1,759, while the hospital-onset incidence rate fell by 1.6% from 21.1 to 20.8 cases per 100,000 bed-days (Figure 1b). These highlight the decline in reports of E. coli bacteraemia cases since the start of the COVID-19 pandemic.
There appears to be a seasonality to the incidence of all-reported E. coli bacteraemia cases, with the highest rates observed between July to September of each year, although care is required in interpreting data for financial years April 2020 to March 2021 and April 2021 to March 2022 due to the reduction in cases and hospital activity during the pandemic.
Figure 1a. Quarterly rates of all reported E. coli bacteraemia: July to September 2011, to January to March 2022
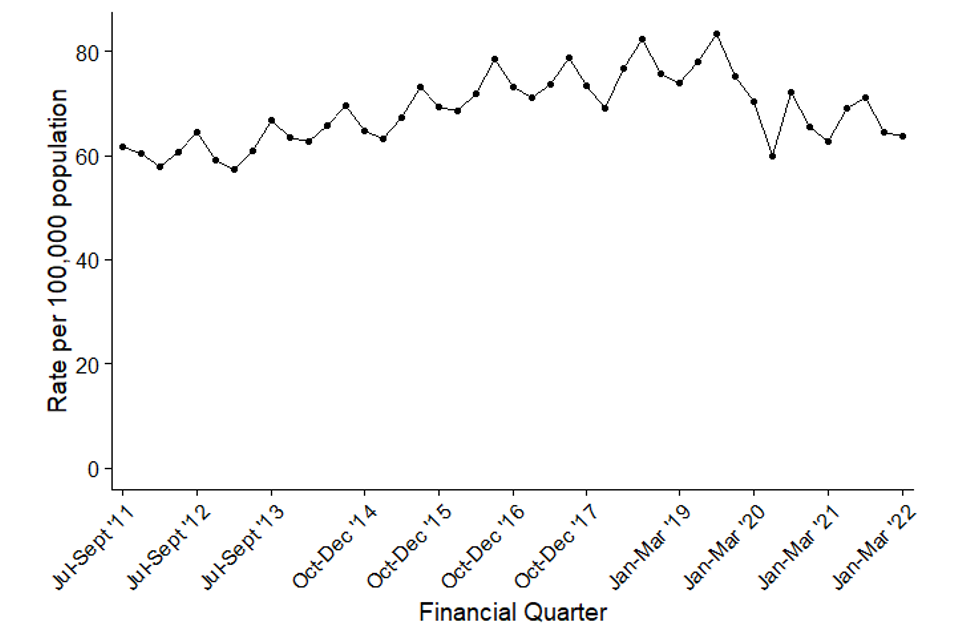
Figure 1b. Quarterly rates of hospital-onset E. coli bacteraemia: July to September 2011, to January to March 2022
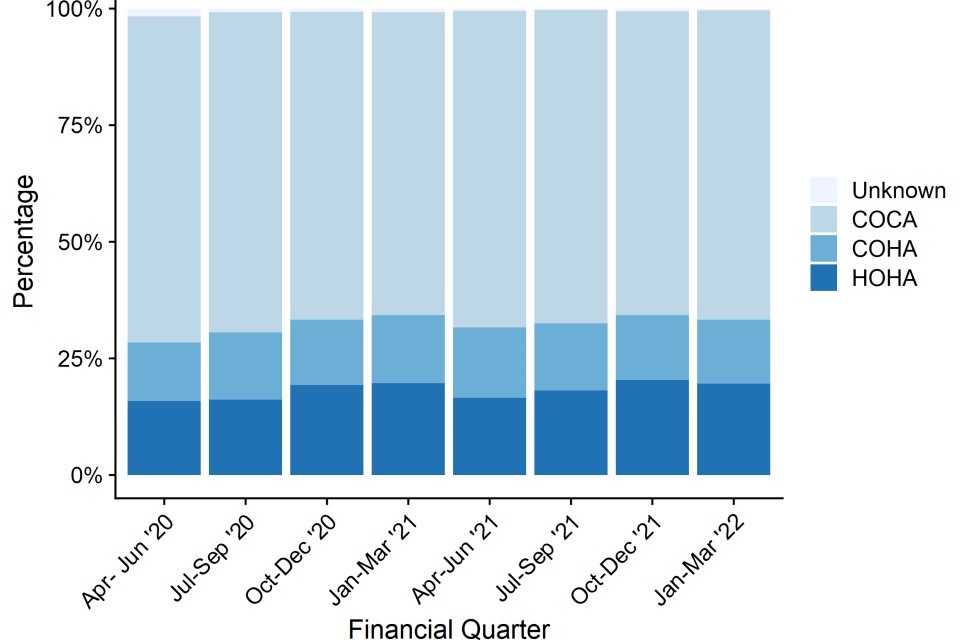
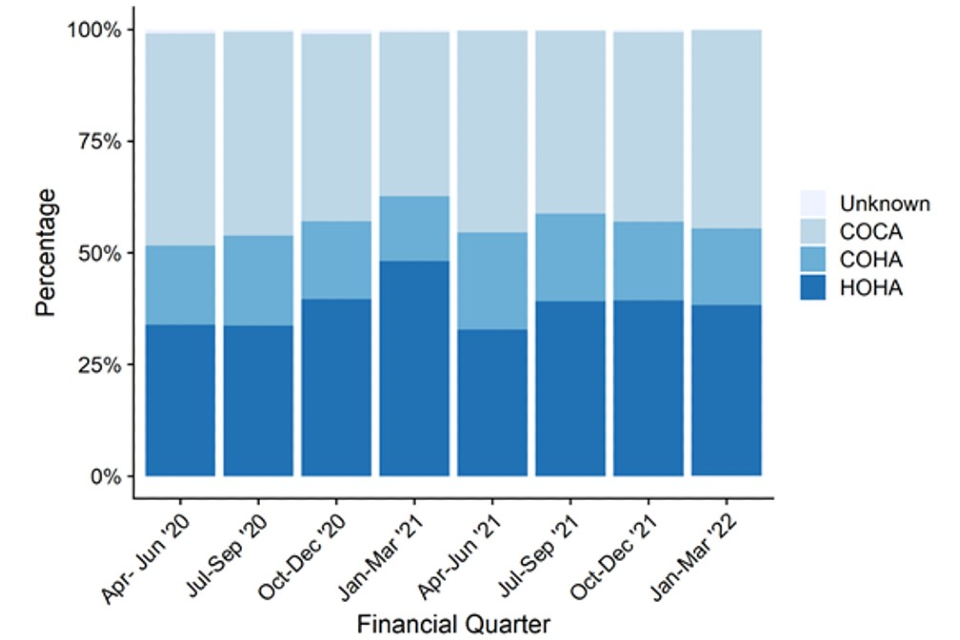
Since April 2020, community-onset cases E. coli bacteraemia cases have been further categorised based on a patient’s previous discharge (or not) from the same reporting acute trust within 28 days.
Cases where no previous discharge within 28 days prior to the current case – Community Onset-Community Associated (COCA) cases – accounted for the majority of reported Community onset E. coli bacteraemia, between April to June 2020 and January to March 2022.
While there have been some fluctuations, the percentage has remained similar at around two-thirds of all cases. Overall, the percentage between April to June 2020 and January to March 2022, decreased slightly from 69.9% to 66.3% over this period (Figure 1c, Table S1a). During the same period, the percentage of Healthcare Onset – Healthcare Associated (HOHA) and Community Onset – Healthcare Associated (COHA) cases increased from 15.9% to 19.6% and 12.5% to 13.7% of all E. coli bacteraemia cases respectively (Figure 1c, Table S1a).
Although the distribution of cases by these categories remained broadly stable, when comparing the number of COHA cases from the current quarter to the same quarter in 2021 (January to March 2021), COHA cases decreased from 14.5% to 13.7%. COCA cases increased from 65.0% to 66.3%. There was no considerable change in the percentages of HOHA cases.
Figure 1c. Count of E. coli bacteraemia cases by prior trust exposure: April to June 2020, to January to March 2022
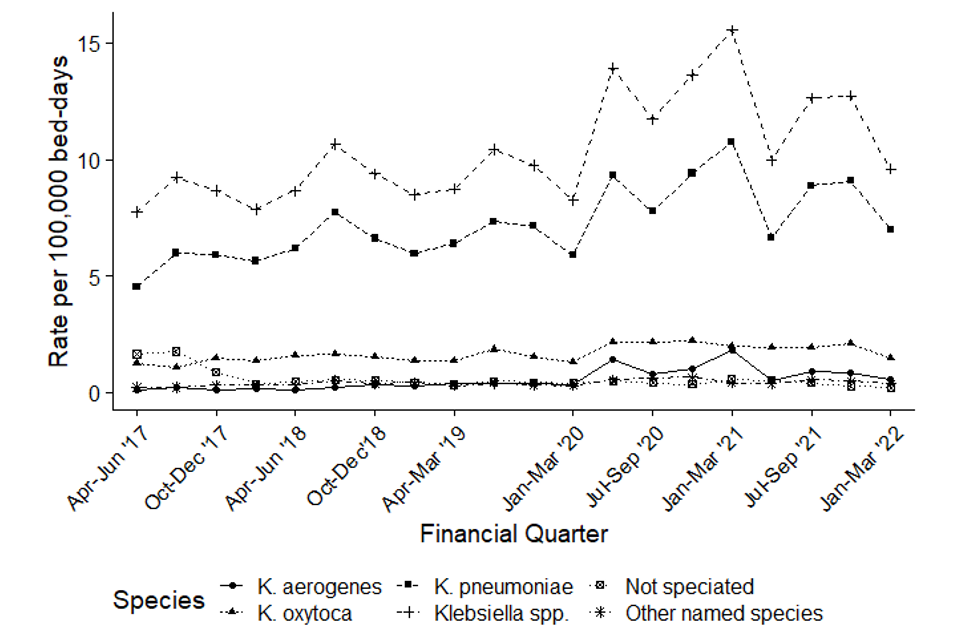
Klebsiella spp. bacteraemia
Between April to June 2017 and January to March 2022, there was a 12.8% increase in the count of all reported Klebsiella spp. bacteraemia cases from 2,348 to 2,648 and a 11.2% increase in the incidence rate from 16.9 to 18.8 cases per 100,000 population (Figure 2a).
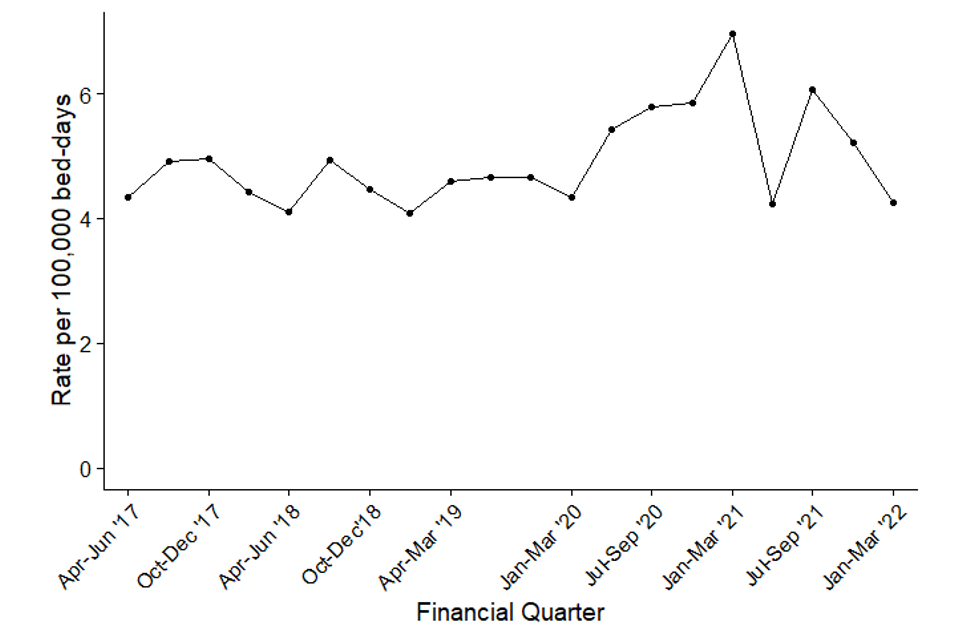
The count of community-onset cases also increased by 9.5% from 1,678 to 1,837 cases, while the incidence rate increased by 8.0% from 12.1 to 13.1 cases per 100,000 population. Over the same period, the count of hospital-onset cases increased by 21.0% from 670 to 811 cases, while the incidence rate increased by 23.7% from 7.8 to 9.6 cases per 100,000 bed-days (Figure 2b, Table S2). Counts and rates of hospital-onset Klebsiella spp. peaked between July to September 2020 and January to March 2021 during the COVID-19 pandemic. Both counts and rates of hospital-onset cases increased to levels which were the highest observed since the inception of mandatory Klebsiella spp. surveillance. The incidence rate of hospital-onset cases peaked at 15.5 cases per 100,000 bed-days during January to March 2021.The specific drivers of this increase are still being investigated, but we do know these trends coincided with increased incidence of COVID-19, Sloot and others 2021 (1).
In January to March 2022, the number of hospital-onset Klebsiella spp. bacteraemia cases decreased by 29.9% from 1,157 to 811 and the incidence rate decreased by 38.3% from 15.4 per 100,000 population to 9.6; when compared with the same quarter in the previous year (January to March 2021). Compared to the same period in 2019 (January to March 2019) a more typical year prior to the pandemic, the counts and the incidence rate of hospital-onset cases increased by 8.9% and 13.0% respectively. The number of all reported cases and incident rate in the current quarter compared to the same period in 2019 (January to March 2019) increased by 3.0% from 2,571 to 2,648 cases and from 18.5 to 18.8 per 100,000 population, respectively (Figure 2a, Table S2). The number of community-onset Klebsiella spp. cases remained broadly similar (absolute change 1,826 to 1,837) and the infection rate decreased from 13.2 to 13.1 per 100,000 population (Table S2).
During January to March 2022, 72.4% (1,916/2,648) of all reported Klebsiella spp. bacteraemia were caused by Klebsiella pneumoniae, a decrease from 71.9% in the same quarter in the previous year (January to March 2021). Over the same period, the percentage of cases identified as Klebsiella oxytoca was 17.0% (451 of 2,648) in January to March 2022, an increase from 15.3% reported in January to March 2021.
The incidence rate of all most Klebsiella species increased at roughly the same pace. The exception to this was the incidence rate of K. oxytoca, which increased within hospital-onset cases around the start of the pandemic and subsequently stabilised at between 1.9 to 2.1 per 100,000 bed days and now appears to be returning to pre-pandemic levels.
There is evidence of seasonality in the trend of all-reported Klebsiella spp. bacteraemia cases, with the highest incidence rates normally observed in July to September of each year. However, it is important to evaluate financial year April 2020 to March 2021 with caution.
Figure 2a. Quarterly rates of all reported Klebsiella spp. bacteraemia by species: April to June 2017, to January to March 2022
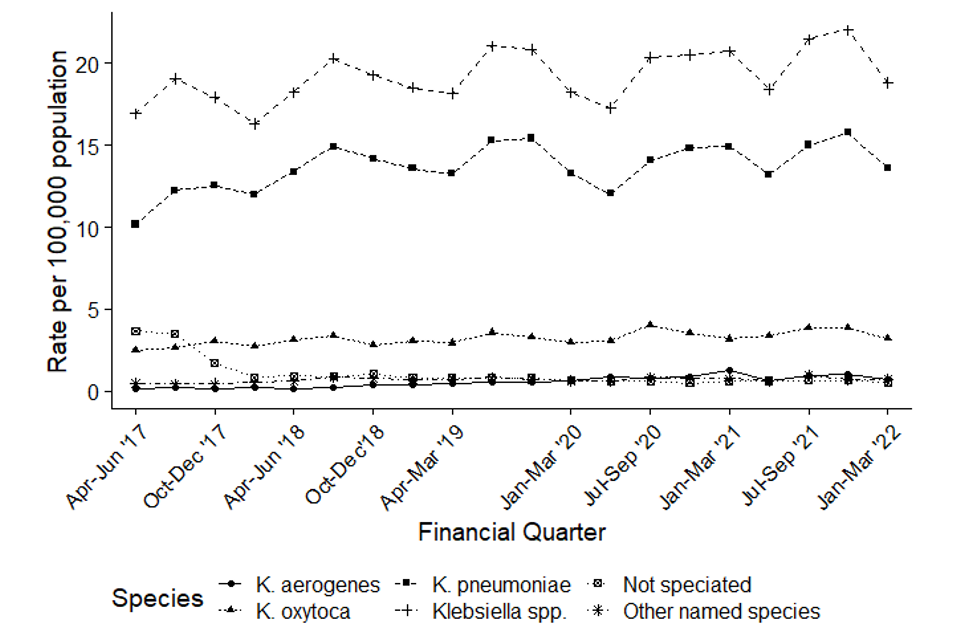
Figure 2b. Quarterly rates of hospital-onset Klebsiella spp. bacteraemia: April to June 2017, to January to March 2022
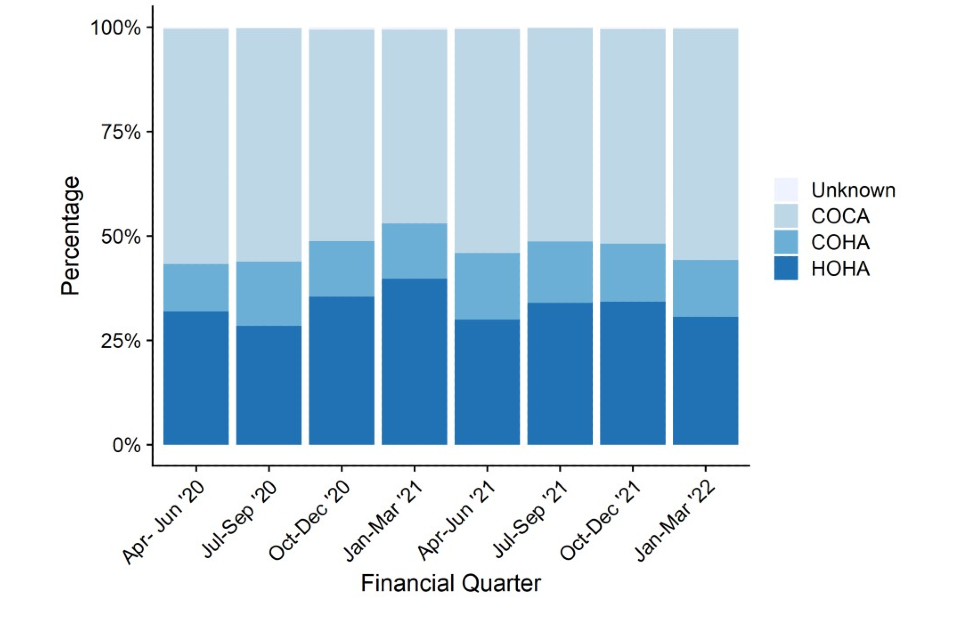
Like E. coli bacteraemia, between April to June 2020 and January to March 2022, COCA cases made up the largest percentage of all Klebsiella spp. bacteraemia, accounting for around half of all cases (Figure 2c).
HOHA cases peaked at 39.7% in January to March 2021 alongside a decline in COCA cases to 46.4%. The increase in HOHA cases coincided with the second lockdown and has been investigated by Sloot and others, 2021. They found that this peak corresponded with an increase in patients with co or secondary COVID-19 infections in intensive care settings.
Compared to the same quarter in 2021, a decrease is seen in HOHA cases from 39.7% to 30.6% of all cases. The percentage of COHA cases remained broadly similar at 13.7% of all Klebsiella spp. bacteraemia cases compared to 13.3% in the same period in the previous year. The number of COCA cases increased from 46.4% to 55.4% of all reported cases. (Figure 2c, Table S2a).
Figure 2c. Count of Klebsiella spp. bacteraemia cases by prior trust exposure: April to June 2020, to January to March 2022
Pseudomonas aeruginosa bacteraemia
Between April to June 2017 and January to March 2022, there was a 7.1% decrease in the count of all reported P. aeruginosa bacteraemia cases from 1,015 to 943, and an 8.4% decrease in the incidence rate from 7.3 to 6.7 cases per 100,000 population (Figure 3a). The count and the incidence rate of community-onset cases decreased by 8.8% from 639 to 583 cases and by 10.0% from 4.6 to 4.1 cases per 100,000 population respectively. Over the same period, the count and the incidence rate of hospital-onset cases decreased by 4.3% from 376 to 360 cases and by 2.1% from 4.35 to 4.26 cases per 100,000 bed-days, respectively (Figure 3b, Table S3).
Like Klebsiella spp. cases, increases in counts and rates of hospital-onset P. aeruginosa were also observed during the second wave of the pandemic. The counts and rates of hospital-onset P. aeruginosa increased between July to September 2020 and January to March 2021. During this period, both the counts and rates of hospital-onset cases increased to levels not seen since the initiation of mandatory surveillance of P. aeruginosa bacteraemia. The incidence rate of hospital-onset cases peaked at 7.0 cases per 100,000 bed-days in January to March 2021. The reasons for this increase have been investigated by Sloot and others, 2021, and it was observed that this increase coincided with a rise in the percentage of hospital-onset bacteraemia cases who were also positive for COVID-19.
When comparing similar quarters since the beginning of the mandatory surveillance, data from the most recent quarter for total and hospital-onset counts is still higher than pre-pandemic counts, with corresponding incidence rates, whereas counts and rates of community-onset cases remain at similar levels.
Care should be taken when comparing January to March 2022 with the same period in the previous year (January to March 2021) which was largely affected by the COVID-19 pandemic. Both the total reported, and community-onset counts and rates remained broadly the same. A 30.5% decrease was seen in the hospital-onset counts which dropped from 518 to 360. With a corresponding decrease of 38.8% in hospital onset incidence rate, from 7.0 to 4.3 cases per 100,000 bed-days. This decrease in rate is due to the fact the bed-days data for the current quarter is 13.6% higher than it was in January to March 2021.
A comparison to the same period in 2019 (January to March 2019), which was a more typical year before the pandemic, shows little change in the count of all reported cases from 963 to 943 with a corresponding decrease in rate from 6.9 to 6.7 cases per 100,000 population (Figure 3a, Table S3). Counts of community-onset P. aeruginosa cases decreased by 3.5% from 604 to 583, with a corresponding decline in the community-onset incidence rate of 4.7% from 4.4 to 4.1 per 100,000 population (Table S3). There was a slight increase in counts of hospital-onset P. aeruginosa cases from 359 to 360, with an increase in the incidence rate of 4.1% from 4.1 to 4.3 per 100,000 bed-days (Figure 3b, Table S3). This increase in rate is due to the fact the bed-days data for the current quarter is 3.6% lower than it was in January to March 2019.
There is evidence of seasonality in the incidence of all-reported P. aeruginosa bacteraemia cases, with the highest rates normally observed in July to September of each year.
Figure 3a. Quarterly rates of all reported P. aeruginosa bacteraemia: April to June 2017, to January to March 2022
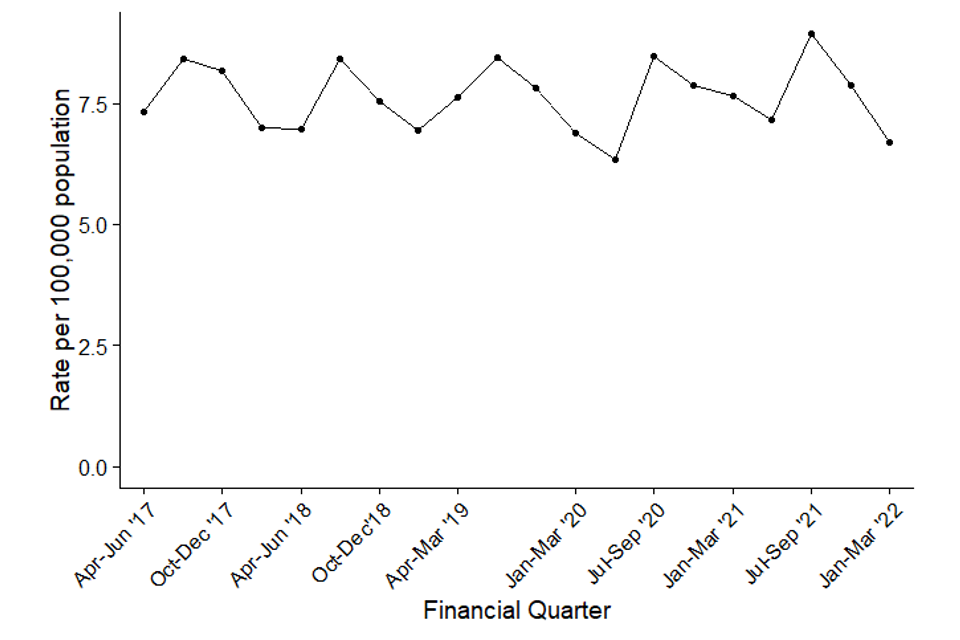
Figure 3b. Quarterly rates of hospital-onset P. aeruginosa bacteraemia: April to June 2017, to January to March 2022
Similarly to E. coli and Klebsiella spp., COCA cases (around 50%) tend to dominate P. aeruginosa bacteraemia cases between April to June 2020 and January to March 2022. In January to March 2021, HOHA cases surpassed COCA cases for the first time since April 2020 coinciding with the peak of the second wave of the COVID-19 pandemic.
The percentage of HOHA cases increased from 33.9% in April to June 2020 to 38.2% in January to March 2022. Over the same period, COCA cases decreased from 47.5% to 44.5% and COHA cases showed little change decreasing from 17.7% to 17.2%.
Comparing January to March 2022 to the same quarter in 2021 (January to March 2021), HOHA cases decreased from 48.2% to 38.2% of all P. aeruginosa bacteraemia cases. The percentage of COHA cases increased from 14.4% to 17.2%. COCA cases have increased from 36.8% to 44.5%. (Figure 3c, Table S3a).
Figure 3c. Count of P. aeruginosa bacteraemia cases by prior trust exposure: April to June 2020, to January to March 2022
Epidemiological analyses of Staphylococcus aureus bacteraemia data
MRSA bacteraemia
There has been a considerable decrease in the incidence rate of all reported MRSA bacteraemia since the enhanced mandatory surveillance of MRSA bacteraemia began in April 2007 (Figure 4a, Table S4). The incidence rate of all reported cases fell by 85.0% from 10.2 cases per 100,000 population in April to June 2007 to 1.5 cases per 100,000 in January to March 2014. The rate has fluctuated between 0.6 and 1.8 since then and is currently at 1.3 cases per 100,000 population in January to March 2022.
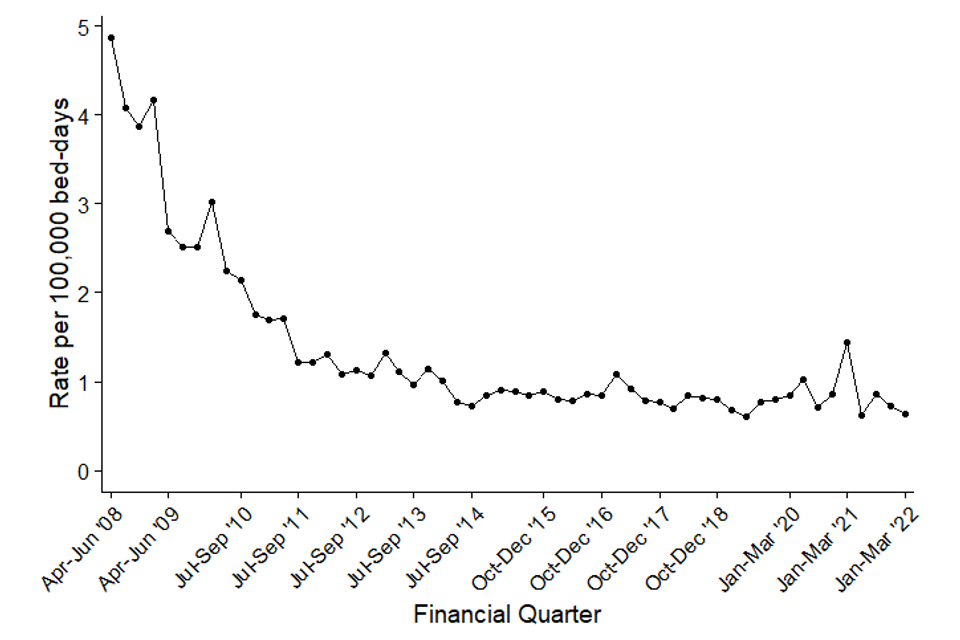
A similar trend was observed with the incidence rate of hospital-onset cases (Figure 4b, Table S4). There was a steep decrease of 79.3% from 4.9 cases per 100,000 bed-days in April to June 2008 to 1.0 case per 100,000 bed-days in January to March 2014.
Subsequently, between January to March 2014 and January to March 2022, the rate has decreased to 0.6 cases per 100,000 bed-days. Since January to March 2014 there have been fluctuations in both the number of hospital-onset infections and the hospital-onset incidence rate, although it has remained broadly stable.
Like Klebsiella spp. and P. aeruginosa, the incidence rate of hospital-onset MRSA bacteraemia peaked at 1.4 cases per 100,000 bed-days in January and March 2021 (Figure 4b, Table S4). This was the highest rate seen for hospital-onset MRSA bacteraemia since April to June 2011. The reasons for this increase are still being investigated, although it has been observed that this increase coincided with a rise in the percentage of hospital-onset bacteraemia cases who were also positive for COVID-19.
A comparison with the same period in 2019 (January and March 2019), which was a more typical year before the COVID-19 pandemic, shows no change in total counts of 179 for both periods and a decline in the incidence rate of 1.3% from 1.29 to 1.27 cases per 100,000 population (Figure 4a, Table S4). Community-onset MRSA bacteraemia cases increased by 5.0% from 119 to 125, while the incidence rate increased by 3.7% from 0.86 to 0.89 cases per 100,000 population (Table S4). During the same quarter in 2019, the count of hospital-onset MRSA bacteraemia cases decreased by 10.0% from 60 to 54, with a 6.6% decrease in incident rate from 0.7 to 0.6 per 100,000 bed-days (Figure 4b, Table S4).
Figure 4a. Quarterly rates of all reported MRSA bacteraemia: April to June 2007, to January to March 2022
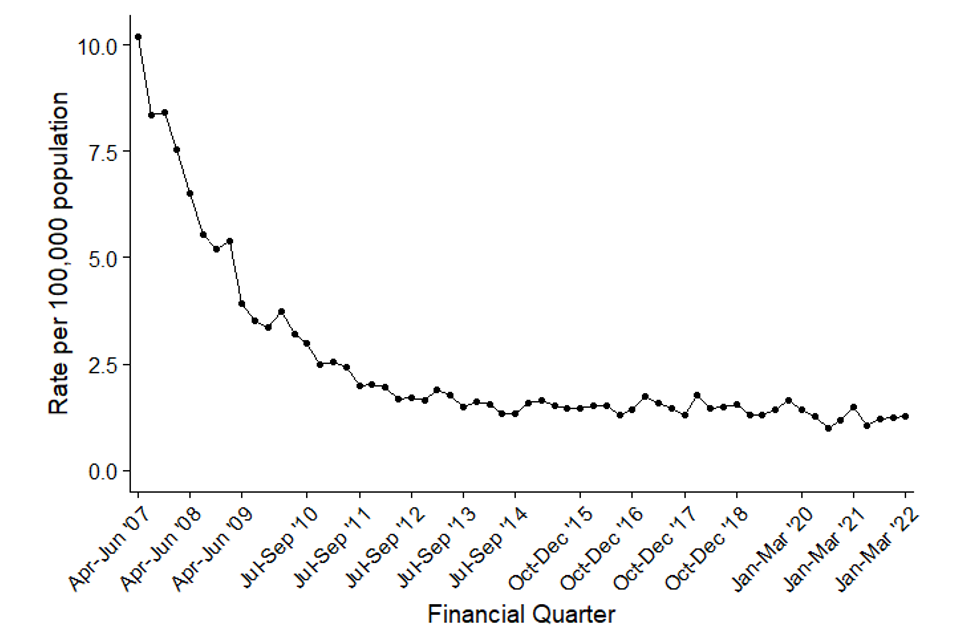
Figure 4b. Quarterly rates of hospital-onset MRSA bacteraemia: April to June 2008, to January to March 2022
MSSA bacteraemia
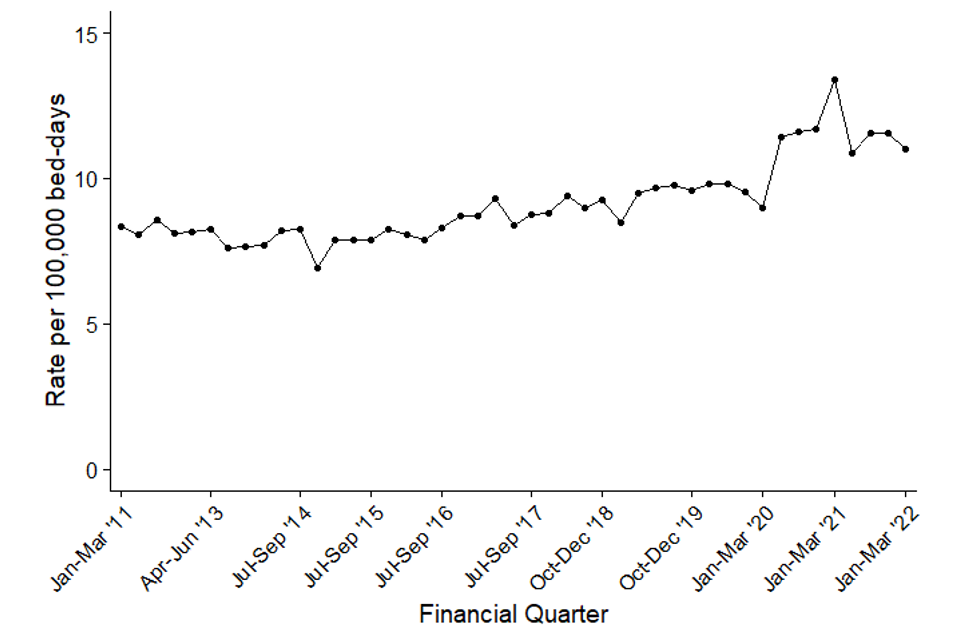
Since the mandatory reporting of MSSA bacteraemia began in January 2011 there has been a general trend of increasing counts and incidence rates of cases. The count of all reported cases of MSSA bacteraemia increased by 41.4% from 2,199 to 3,110 between January to March 2011 and January to March 2022. This was accompanied by a 31.7% increase in incidence rate from 16.8 to 22.1 per 100,000 population (Figure 5a, Table S5)
These increases are primarily driven by increases in community-onset cases. Between January to March 2011 and January to March 2022, the count and the incidence rate of community-onset cases increased by 48.9% and 38.7% respectively from 1,464 to 2,180 cases and from 11.2 to 15.5 cases per 100,000 population (Table S5). Over the same period, the count of hospital-onset cases increased by 26.5 from 735 to 930 cases, while the hospital-onset incidence rate increased 31.9% from 8.3 to 11.0 cases per 100,000 bed-days (Figure 5a and Figure 5b, Table S5a). Since the beginning of the COVID-19 pandemic, the numbers of all reported MSSA cases are generally lower than in previous years, but have started to return to pre-pandemic levels.
Since April to June 2020, there has been an increase in the incidence rate of hospital-onset MSSA bacteraemia cases. The overall growth is, in part, a result of reduced hospital admissions and overnight bed-days. This has caused a large increase in the rate of hospital-onset cases over a relatively short time since overnight bed-days is used as a denominator for rate calculations. This culminated in a peak during January to March 2021 of 13.4 cases per 100,000 bed-days and 998 cases, which was the highest MSSA hospital-onset rate and count that has been observed since the inception of MSSA surveillance. This pattern is comparable to that observed in both Klebsiella spp. and P. aeruginosa.
In comparison to the same period in 2019 (January to March 2019), which is a more typical year prior to the first wave of the pandemic, there is a 2.8% increase in the counts of all reported cases from 3,026 to 3,110 and a 1.5% increase in the rate from 21.8 to 22.1 cases per 100,000 population in the current quarter (January to March 2022). Over this same period, hospital-onset MSSA bacteraemia cases have increased by 10.3% from 843 to 930, which corresponds to a 14.5% increase in the incidence rate from 9.6 to 11.0 per 100,000 bed-days. There was a slight decrease in community-onset MSSA bacteraemia cases from 2,183 to 2,180, while the rates decreased by 1.4% from 15.7 to 15.5 per 100,000 population over the same period.
Figure 5a. Quarterly rates of all reported MSSA bacteraemia: January to March 2011, to January to March 2022
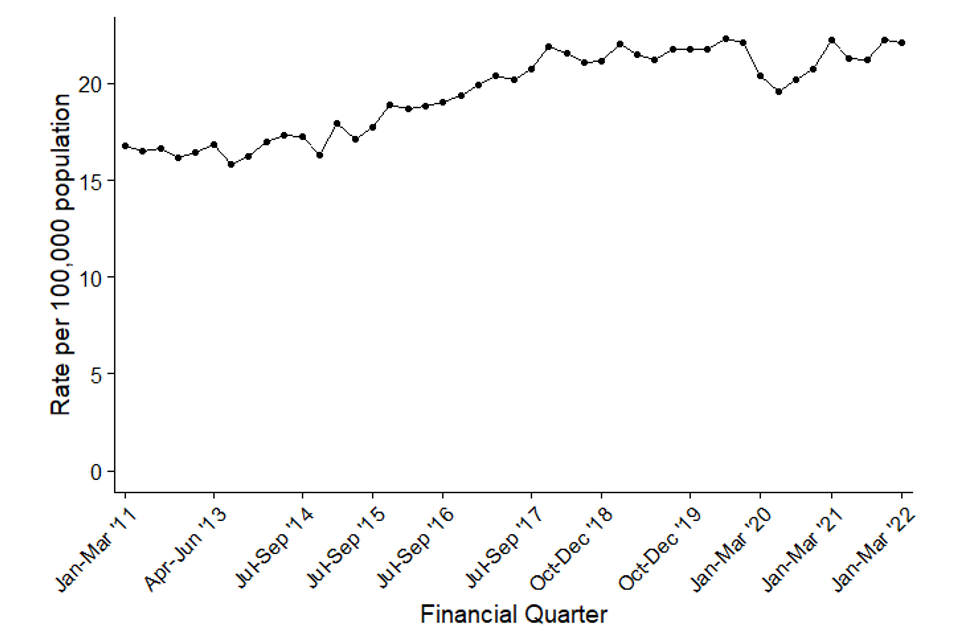
Figure 5b. Quarterly rates of hospital-onset MSSA bacteraemia: January to March 2011 to January to March 2022
Epidemiological analyses of Clostridioides difficile infection data
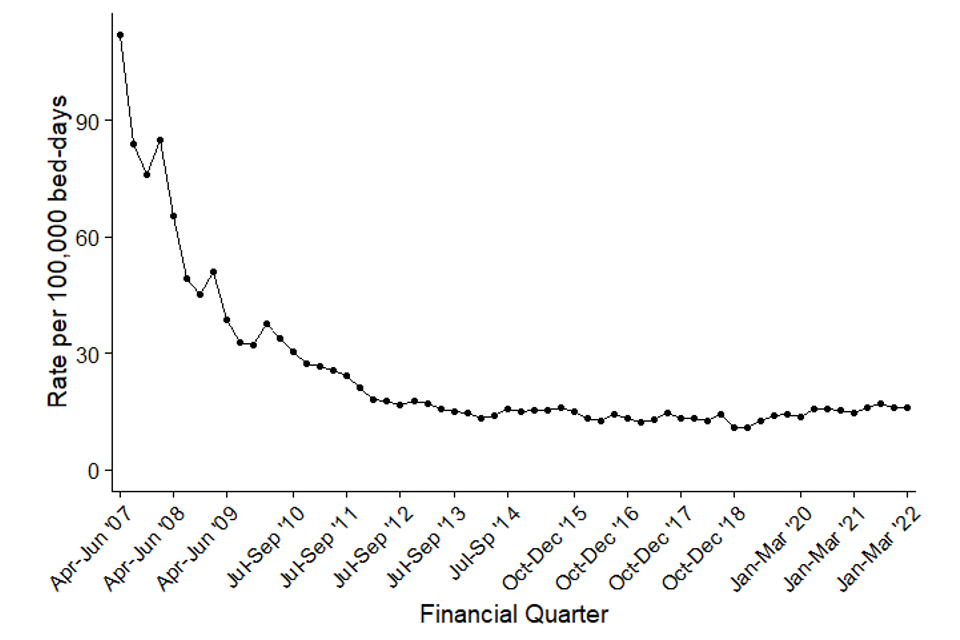
Since the initiation of CDI surveillance in April 2007, there has been an overall decrease in the count and incidence rate of both all-reported and hospital-onset cases of CDI (Figure 6a, Figure 6b and Table S6).
A large part of the decrease in the incidence rate occurred between April to June 2007 and January to March 2012, with a 78.0% decrease in all-reported cases of CDI from 16,864 to 3,711 cases and an associated 78.8% reduction in incidence rate from 131.6 cases per 100,000 population to 27.9 cases per 100,000 population. Subsequently, between January to March 2012 and January to March 2022, the count of all-reported cases decreased by 11.9% from 3,711 to 3,269 cases, with the incidence rate reduced by 16.7% from 27.9 to 23.2 cases per 100,000 population.
There were similar, but greater, reductions among hospital-onset CDI cases with an 84.5% reduction in count of cases between April to June 2007 and January to March 2012 from 10,436 to 1,613 cases and an 83.9% reduction in the incidence rate from 112.1 to 18.2 per 100,000 bed-days. This was followed by a further 16.1% decrease in the count of cases from 1,613 to 1,354 cases and a decrease of 11.4% in the incidence rate from 18.1 to 16.0 cases per 100,000 bed-days between January to March 2012 and January to March 2022.
When comparing the most recent quarter (January to March 2022) to January to March 2019, which is a more typical period prior to the first wave of the COVID-19 pandemic, there is a 25.5% increase in the count of all reported cases from 2,604 to 3,269, corresponding to an 23.9% increase in the incidence rate from 18.8 to 23.2 cases per 100,000 population (Figure 6a, Table S6).
Community-onset CDI cases increased by 15.8% from 1,654 to 1,915 while the rate increased by 14.3% from 11.9 to 13.6 per 100,000 population (Table S6, Table S6). Hospital-onset CDI cases increased by 42.5% from 950 to 1,354 which corresponds to an incidence rate increase of 47.9% from 10.8 to 16.0 cases per 100,000 bed-days (Figure 6b, Table S6).
The reasons for these observed increases are still being investigated.
Figure 6a. Quarterly rates of all reported C. difficile: April to June 2007, to January to March 2022
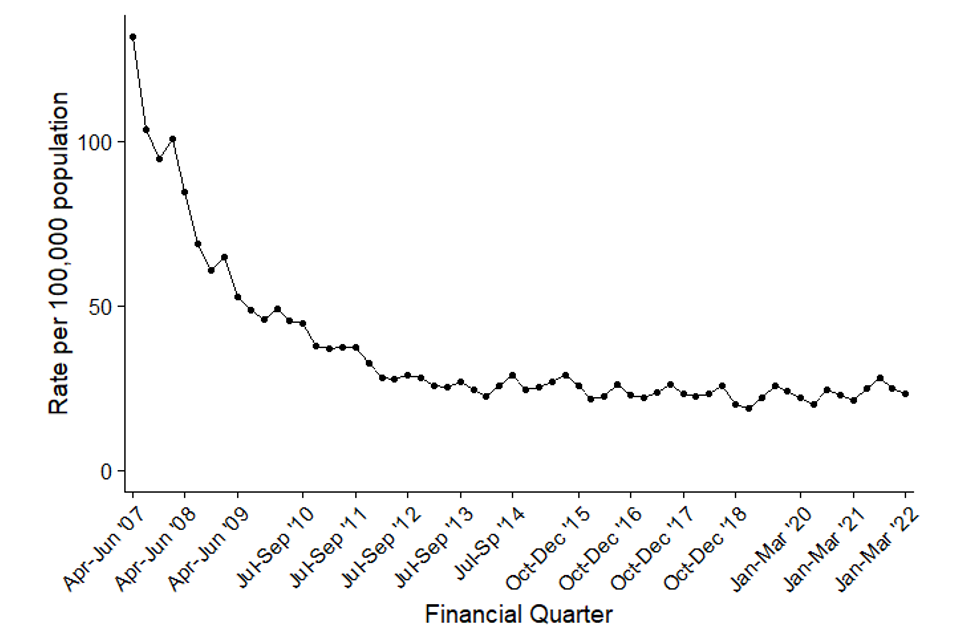
Figure 6b. Quarterly rates of hospital-onset C. difficile: April to June 2007, to January to March 2022
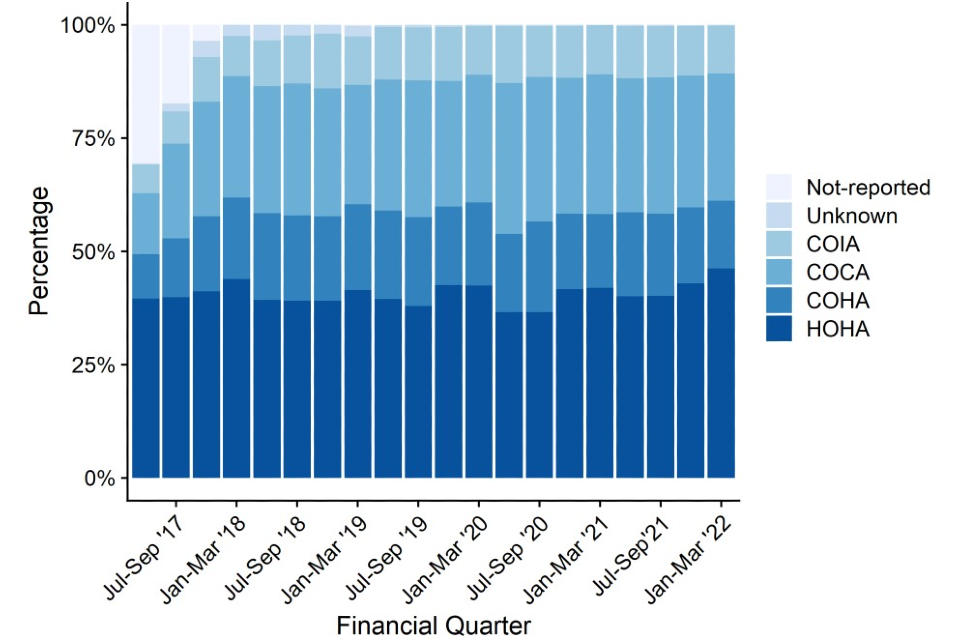
Between April to June 2017 and January to March 2022 the largest percentage of cases were HOHA. While there have been some fluctuations, the percentage has remained broadly stable at around 40% of all cases. Over the same period, COCA cases increased from 13.4% to 28.1% of all CDI, while COHA cases have increased from 9.7% to 14.9% of all CDI. Community Onset Indeterminate Association (COIA) cases have increased from 6.3% to 10.5% of all CDI. Much of the increase observed is likely due to improved data quality as shown by the sharp decline of cases with missing data (Figure 7, Table S7).
Figure 7. CDI rates by prior trust exposure April to June 2017, to January to March 2022
Appendix
Bed-day data
For bacteraemia and CDI, the average bed-day activity reported by acute trusts via KH03 returns is used to derive the bed-day denominator for acute trust incidence rate rates (assigned and apportioned). As of Q1 2011 to 2012, bed-day data has been available on a quarterly basis and has been used as such for Q2 2011 to 2012, to Q3 2021 to 2022.
However, UKHSA has reviewed its policy for processing KH03 data. Data irregularities identified have been flagged with colleagues at NHS England (data owners of the KH03 data set). Until we receive confirmation that any identified change in the occupied overnight bed-days for an acute trust is anomalous, UKHSA now uses the data as published in the KH03 data set. This affects all reports published since 1 December 2015 and incidence rate rates published prior that time will differ slightly as a result.
For the KH03 data used to calculate rates included in this report to be consistent over the full-time period, previously amended KH03 data for trust United Lincolnshire Hospitals (RWD) for financial year 2014 to 2015, has been altered to reflect that published in the KH03 data set. Please note that this could lead to slight differences in hospital-onset assigned rates when compared with publications prior to 1 December 2015.
Missing data for acute trusts in the KH03 returns will continue to be processed as before, where the KH03 return for the same quarter from the previous year will be used as a proxy. The acute trusts thus affected were:
-
Moorfields Eye Hospital NHS Foundation Trust (RP6) 2007 to 2008, and 2008 to 2009 KH03 figures: replaced with 2006 to 2007 KH03 figure
-
Rotherham NHS Foundation Trust (RFR): 2009 to 2010 and from April to June 2010, to April to June 2011 KH03 figures: replaced with 2008 to 2009 KH03 figure
-
Sheffield Teaching Hospitals NHS Foundation Trust (RHQ) from April to June 2010, to April to June 2011 KH03 figures: replaced with 2009 to 2010 KH03 data
-
the Princess Alexandra Hospital NHS Trust (RQW) April to June 2014, and October to December 2014 KH03 figures: replaced with April to June 2013, to October to December 2013 KH03 figures, respectively
-
Ipswich Hospital NHS Trust (RGQ) January to March 2016 KH03 figure: replaced with January to March 2015 figures
-
West Suffolk NHS Foundation Trust (RGR) April to June 2016, to October to December 2016 and April to June 2017 KH03 figures: replaced with April to June 2015, to October to December 2015 KH03 figures
-
Gloucestershire Hospitals NHS Foundation Trust (RTE) October to December 2016, to January to March 2017 KH03 figures: replaced with October to December 2015, to January to March 2016 KH03 figures
The KH03 data used for this report was published on 19 May 2022. This may include revisions of previously published KH03 data used in earlier reports.
Population data
National incidence rates are calculated using 2007 to 2020 mid-year resident population estimates which are based on the 2011 census for England (2021 estimates are based on 2020 mid-year estimates).
Definitions
Bacteraemia hospital-onset (trust-apportioned) cases
Include patients who are (i) in-patients, day-patients, emergency assessment patients or not known; and (ii) have had their specimen taken at an acute trust or not known; and (iii) specimen was taken on or after day 3 of the admission (admission date is considered day ‘one’). Cases that do not meet these criteria are categorised as community-onset (not-trust apportioned).
CDI hospital-onset (trust-apportioned) cases
Include patients who are (i) in-patients, day-patients, emergency assessment patients or not known; and (ii) have had their specimen taken at an acute trust or not known; and (iii) specimen was taken on or after day 4 of the admission (admission date is considered day ‘one’). Cases that do not meet these criteria are categorised as community-onset (not-trust apportioned).
Historically, report published before September 2017 have used the term ‘trust- apportioned’ to describe cases meeting the above conditions for apportionment and ‘not trust-apportioned’ for those that do not. Moving forward, these terminologies have been updated to ‘hospital-onset’ and ‘community-onset’ respectively. Please note that this is simply a change in terminology and does not constitute a change in the methodology for apportionment.
Prior trust exposure
From April 2017, reporting trusts were asked to provide information on whether patients with CDI had been admitted to the reporting trust within the 3 months prior to the onset of the current case. This allows a greater granulation of the healthcare association of cases. This was extended to all other data collections in 2019.
Cases are split into one of 6 groups for CDI and 5 groups for the bacteraemias.
CDI prior trust exposure categories
- HOHA: date of onset is greater than 2 days after admission (where day of admission is day 1).
- COHA: is not categorised HOHA and the patient was most recently discharged from the same reporting trust in the 28 days prior to the specimen date (where day 1 is the specimen date).
- COIA: is not categorised HOHA and the patient was most recently discharged from the same reporting trust between 29 and 84 days prior to the specimen date (where day 1 is the specimen date).
- COCA: is not categorised HOHA and the patient has not been discharged from the same reporting organisation in the 84 days prior to the specimen date (where day 1 is the specimen date).
- Unknown: the reporting trust answered ‘Don’t know’ to the question regarding previous discharge in the 3 months prior to CDI case.
- No Information: the reporting trust did not provide any answer for questions on prior admission.
Bacteraemia prior trust exposure categories
April 2020, the HCAI DCS has included questions relating to prior trust exposure to the same acute trust reporting Gram-negative bacteraemia cases. These additional mandatory items were developed to assist the UK governments ambition to reduce healthcare-associated Gram-negative BSI and CDI from a 2019 baseline to threshold levels. This supports the intention to reduce Gram-negative BSI by 25% by March 2022, and by 50% by March 2024.
Cases since April 2020 have also been categorised as:
- HOHA: date of onset is greater than 2 days after admission (where day of admission is day 1).
- COHA: is not categorised HOHA and the patient was most recently discharged from the same reporting trust in the 28 days prior to the specimen date (where day 1 is the specimen date).
- COCA is not categorised HOHA and the patient has not been discharged from the same reporting organisation in the 28 days prior to the specimen date (where day 1 is the specimen date).
- Unknown: the reporting trust answered ‘Don’t know’ to the question regarding previous discharge in the month prior to the current episode.
- No Information: the reporting trust did not provide any answer for questions on prior admission.
Total reported cases
This is the total count of infections for each organism as of the date of extraction. Please note that for C. difficile, this count excludes those from patients less than 2 years old.
Episode duration
The length of an infection episode is defined as 14 days (28 days for CDI) from the earliest case’s specimen date (day ‘one’).
Incidence rate calculations
MRSA, MSSA and E. coli, Klebsiella spp., P. aeruginosa bacteraemia, and CDI population incidence rate (episodes per 100,000)
This incidence rate is calculated using the number of episodes and the mid-year population for England:
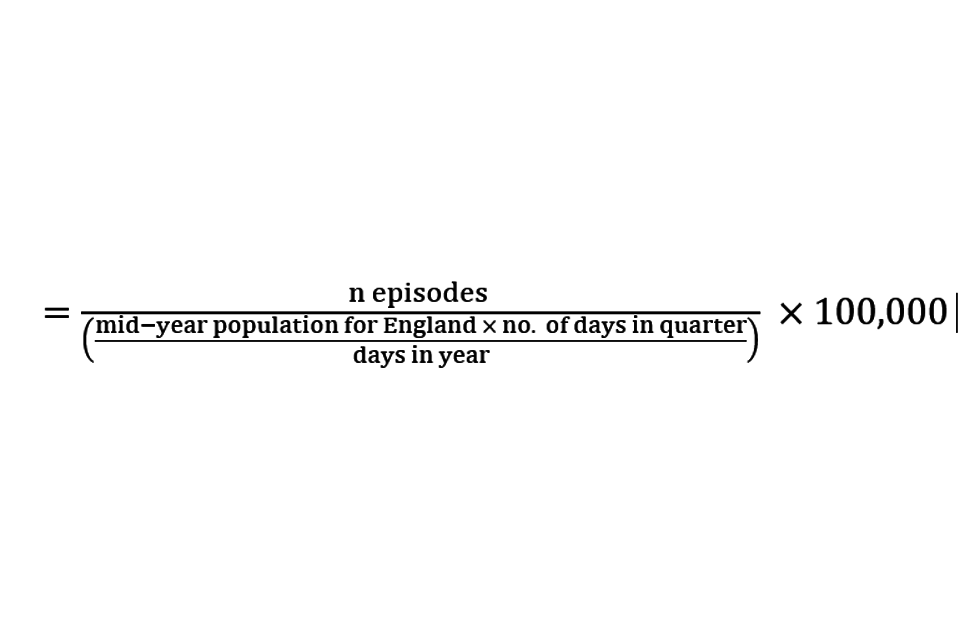
That is: the number of episodes is multiplied by 100,000, then multiplied by the number of days in the year, then divided by the mid-year of population for the same year for England, then divided by the number of days in the quarter.
MRSA, MSSA and E. coli, Klebsiella spp., P. aeruginosa and CDI hospital-onset incidence
This incidence rate is calculated using the number of episodes and the KH03 average bed-day activity (see bed-day data above) and is calculated as follows:
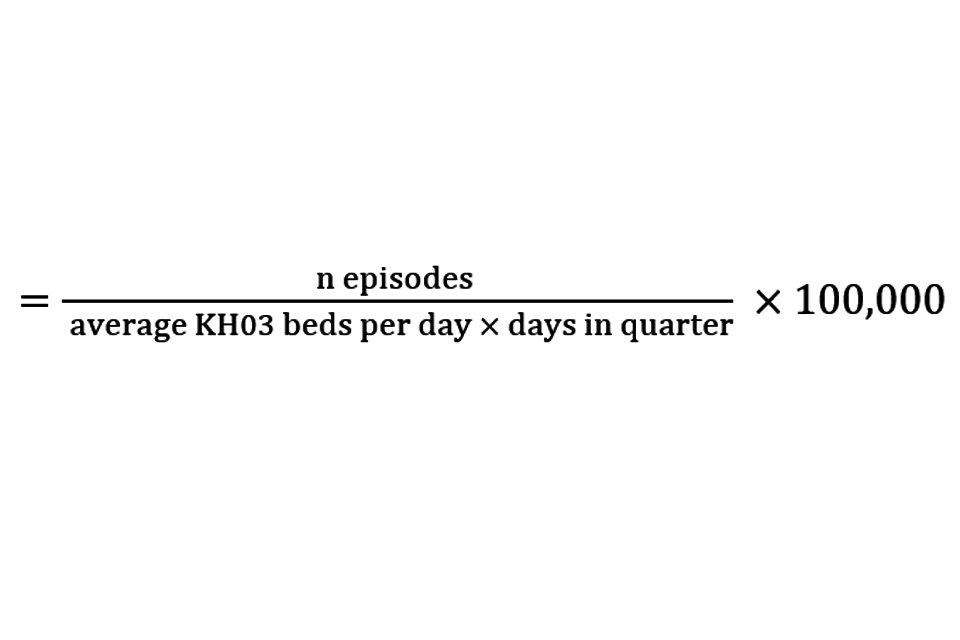
That is: the number of episodes is multiplied by 100,000, then divided by the average number of beds occupied-overnight in a quarter, then divided by the number of days in the same quarter.
Graphs and percentage change calculation
Please note that percentage changes in rate have been calculated using raw rate figures while those presented in the tables and commentary have been rounded to one decimal place. Similarly, graphs included in this report were plotted using raw rates figures. The raw rate figures are included in the Quarterly Epidemiological Commentary’s accompanying data.
Quarters
In publications prior to March 2016, all references to quarterly data are based on calendar year definitions and not financial year definitions, that is:
- Q1 2014 – April to June 2014
- Q2 2014 – April to June 2014
- Q3 2014 – July to September 2014
- Q4 2014 – October to December 2014
However, for all subsequent publications, including this one, all references to quarterly data are based on financial year definitions and not calendar year definitions, that is:
- Q1 2014 to 2015 – April to June 2014
- Q2 2014 to 2015 – July to September 2014
- Q3 2014 to 2015 – October to December 2014
- Q4 2014 to 2015 – April to June 2015
References
- Sloot R, Nsonwu O, Chudasama D, Rooney G, Pearson C, Choi H, Mason E, Springer A, Gerver S, Brown C, Hope R. ‘Rising rates of hospital-onset Klebsiella spp. and Pseudomonas aeruginosa bacteraemia in NHS acute trusts in England: a review of national surveillance data.’ August 2020 to February 2021. Journal of Hospital Infection 2021: September 2020