Quarterly epidemiological commentary: Gram-negative, MRSA and MSSA bacteraemia and C. difficile infections, quarter 1
Published 8 October 2026
Applies to England

© Crown copyright 2026
This publication is licensed under the terms of the Open Government Licence v3.0 except where otherwise stated. To view this licence, visit nationalarchives.gov.uk/doc/open-government-licence/version/3 or write to the Information Policy Team, The National Archives, Kew, London TW9 4DU, or email: psi@nationalarchives.gov.uk.
Where we have identified any third party copyright information you will need to obtain permission from the copyright holders concerned.
This publication is available at https://www.gov.uk/government/statistics/gram-negative-mrsa-and-mssa-bacteraemia-and-c-difficile-infections-quarterly-reports-2026-to-2027/quarterly-epidemiological-commentary-gram-negative-mrsa-and-mssa-bacteraemia-and-c-difficile-infections-quarter-1
Main points
This report provides an overview of the 6 data collections during the latest quarter, April to June 2026.
Escherichia coli (E. coli) bacteraemia
During the latest quarter:
- the all-reported (irrespective of prior trust exposure) incidence rate of E. coli bacteraemia was 77.9 cases per 100,000 population
- this was a 1.1% increase compared with the same quarter last year, and no substantial difference when compared with the corresponding pre-COVID-19 pandemic quarter
- most cases were community-onset (82.7%), otherwise 17.3% were hospital-onset
Klebsiella species (spp.) bacteraemia
During the latest quarter:
- the all-reported incidence rate of Klebsiella spp. bacteraemia was 24.1 cases per 100,000 population
- this was an 8.7% increase compared with the same quarter last year, and a 31.8% increase since the corresponding quarter in 2019
- K. pneumoniae was the most common species among Klebsiella spp. bacteraemia, accounting for 72.4% of cases, yet the primary contributor to the rise of 226 cases in this quarter is K. oxytoca, in all-reported, hospital (up 48 cases) and community cases (up 59 cases)
Pseudomonas aeruginosa (P. aeruginosa) bacteraemia
During the latest quarter:
- the all-reported incidence rate of P. aeruginosa bacteraemia was 7.2 cases per 100,000 population
- this was a 1.4% decrease compared with the same quarter last year, and a 5.4% decrease since the corresponding quarter in 2019
- there was a 3.3% decrease in the hospital-onset rate versus a 0.3% increase in the community-onset rate when compared with the same quarter last year
Meticillin-resistant Staphylococcus aureus (MRSA) bacteraemia
During the latest quarter:
- the all-reported incidence rate of MRSA bacteraemia was 1.8 cases per 100,000 population
- this was a 4.0% decrease compared with the same quarter last year (mainly from a 16.3% decrease in hospital-onset incidence), and a 40.2% increase since the corresponding quarter in 2019
Meticillin-sensitive Staphylococcus aureus (MSSA) bacteraemia
During the latest quarter:
- the all-reported incidence rate of MSSA bacteraemia was 23.9 cases per 100,000 population
- this was no substantial change compared with the same quarter last year, and a 9.1% increase since the corresponding quarter in 2019
- overall, the incidence rate remains at the highest level seen in England with recent increases attributed to hospital cases
Clostridioides difficile (C. difficile) infections
During the latest quarter:
- the all-reported incidence rate of C. difficile infections (CDI) was 30.1 cases per 100,000 population
- this was not a substantial change compared with the same quarter last year nor the corresponding quarter in 2019
- compared with the same quarter last year, community-onset rates increased by 3.2% and hospital-onset rates decreased by 2.4%
Rolling case counts for all collections
Figure 1 describes the 12-month rolling percentage change in case counts for each data collection, compared with the baseline 12-month period ending in December 2012, or March 2018 for Klebsiella spp. or P. aeruginosa bacteraemia. Values above zero percent indicate higher case counts than each data collection’s respective baseline, while values below zero percent indicate lower case counts than baseline.
Figure 1. Percentage change in 12-month rolling counts in E. coli, Klebsiella spp., P. aeruginosa, MRSA and MSSA bacteraemia and CDI, December 2012 to June 2026
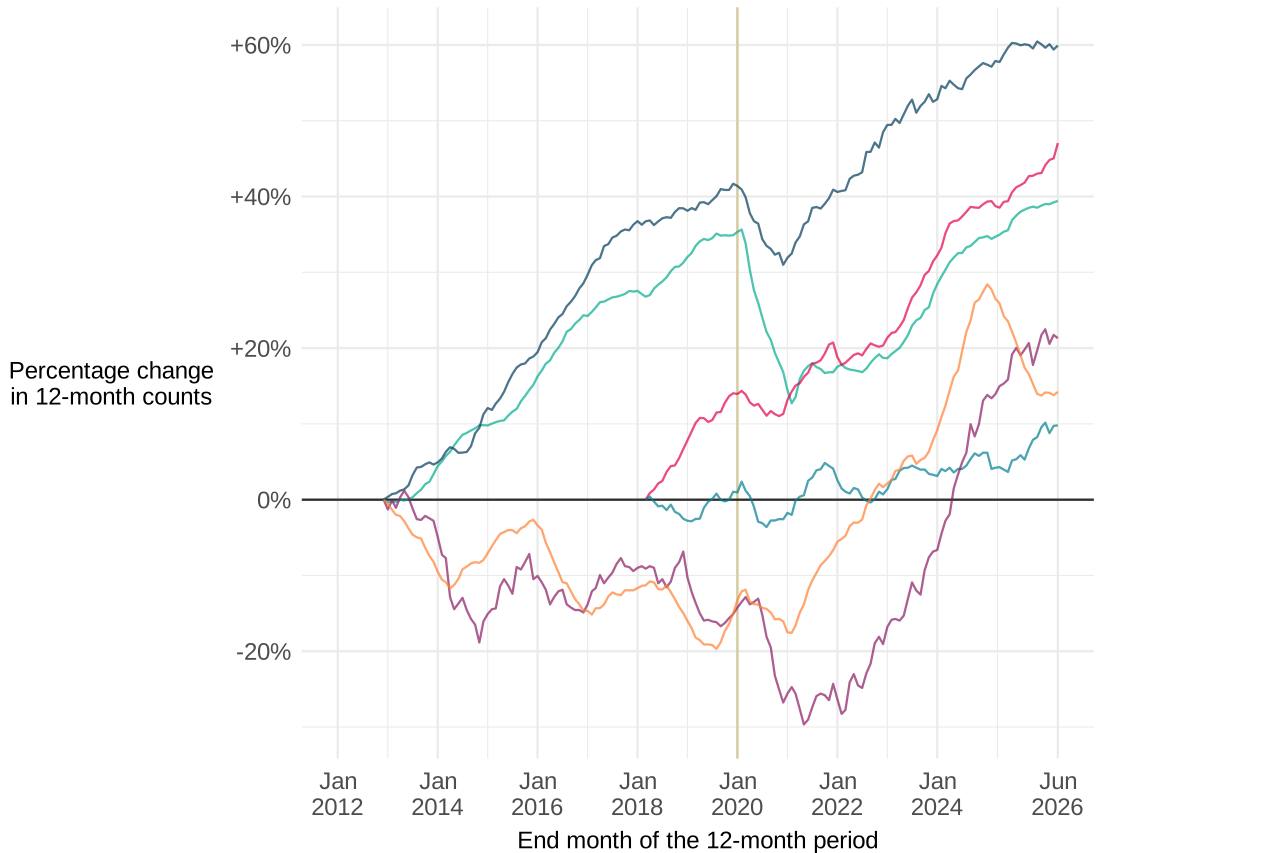
The 12-month rolling case counts for all 6 organisms have surpassed records for their respective data collection baselines (Figure 1, Table S7 in the accompanying data tables). Over the whole period the highest percentage increase in 12-month rolling case counts was observed for MSSA bacteraemia. Trends in MSSA and E. coli bacteraemia flattened at the start of 2025, with a recent return to increasing case counts for E. coli. CDI rolling case counts appear to have plateaued at 14% above the 2012 baseline. This follows a sustained decrease since 2025, which reversed the upward trend that began in January 2021 and peaked at 28.3% above baseline in January 2025.
Epidemiological analyses of Gram-negative bacteraemia (E. coli, Klebsiella spp. and P. aeruginosa) data
E. coli bacteraemia
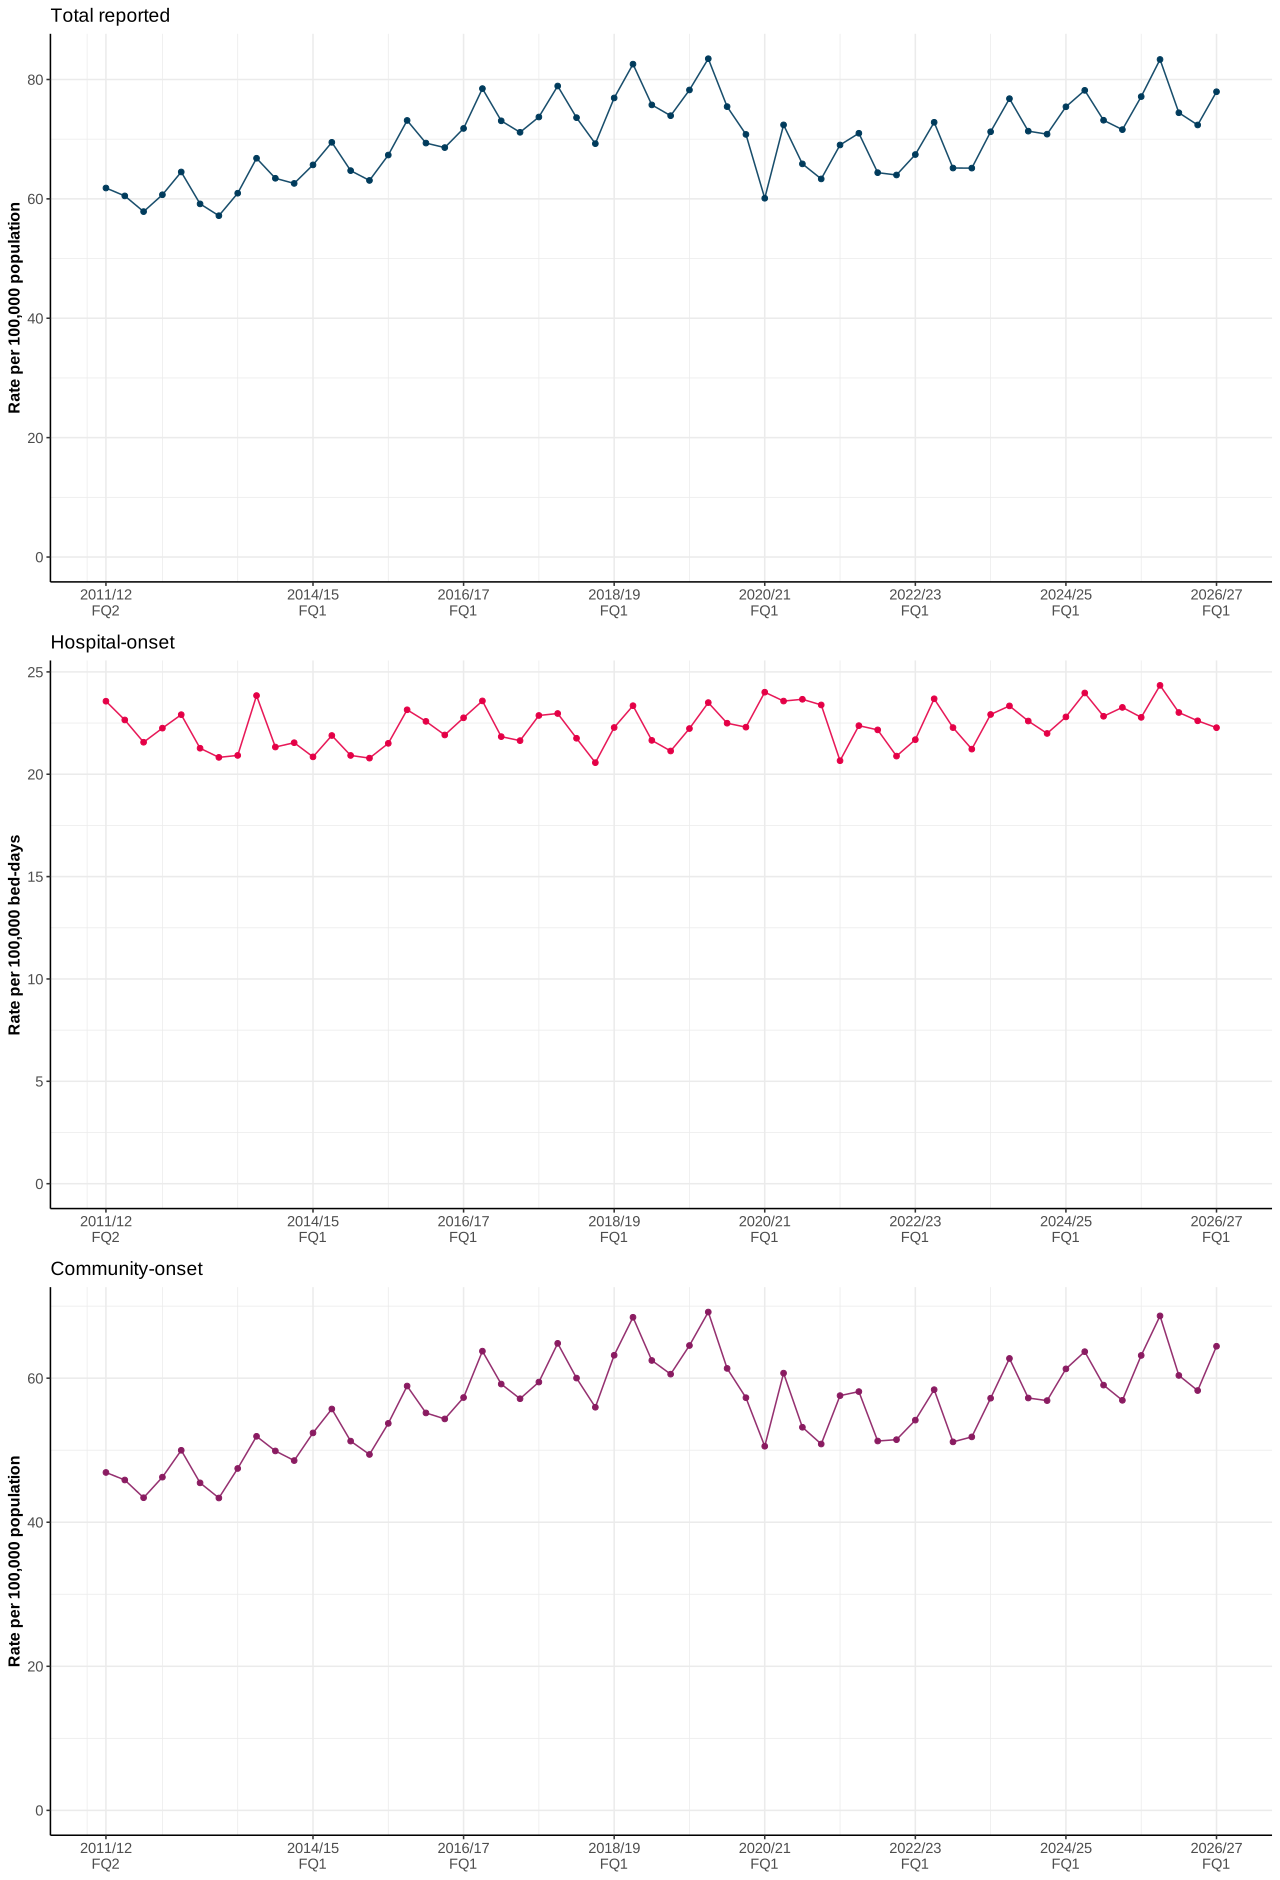
There were 11,392 total reported cases of E. coli bacteraemia in April to June 2026 (Figure 2).
Figure 2. Quarterly rates of E. coli bacteraemia, total reported, hospital-onset and community-onset cases, July 2011 to June 2026
Compared with start of surveillance
There was an increase of 28.4% in the incidence rate from 60.7 to 77.9 cases per 100,000 population compared with April to June 2012 (the corresponding quarter in the starting year of surveillance). This increase was primarily due to an increase in community-onset cases. There were 9,416 community-onset cases in April to June 2026 (Table S1 in the accompanying data tables). This corresponded to a 39.3% increase in incidence rate from 46.3 to 64.4 cases per 100,000 population since April to June 2012. Over the same period, the hospital-onset incidence rate had no substantial change with a rate of 22.3 per 100,000 bed-days, with 1,976 hospital-onset cases in the most recent quarter.
Compared with pre-pandemic
There was no substantial change in the incidence rate (77.9 cases per 100,000 population) when comparing April to June 2026 to the equivalent pre-COVID-19 pandemic period (April to June 2019). The incidence rate of community-onset cases was 64.4 cases per 100,000 population, showing no substantial change when compared with April to June 2019. The hospital-onset incidence rate also showed no substantial change at 22.3 cases per 100,000 bed-days.
Compared with last year
When comparing the most recent quarter to the same quarter last year, the incidence rate of total reported cases showed a slight increase of 1.1% from 77.1 to 77.9 per 100,000 population. Community-onset cases increased by 2.0% in incidence rate, from 63.2 to 64.4 per 100,000 population. Over the same period, the incidence rate of hospital-onset E. coli bacteraemia cases decreased by 2.2% from 22.8 to 22.3 per 100,000 bed-days.
Seasonality
A strong seasonal trend is visible with the total reported E. coli bacteraemia, as the highest rates are observed between July to September of each year. However, there were more fluctuations during the pandemic years (Figure 2). The same seasonal trend is apparent among hospital-onset rates since July 2011, excluding the period January 2020 to December 2021.
Prior trust exposure
Since April 2020, community-onset E. coli bacteraemia cases have been further categorised into healthcare- or community- associated. This is based on whether each patient had been previously discharged from the same reporting acute trust in the preceding 28 days (see our quality and methodology information (QMI) report for more details).
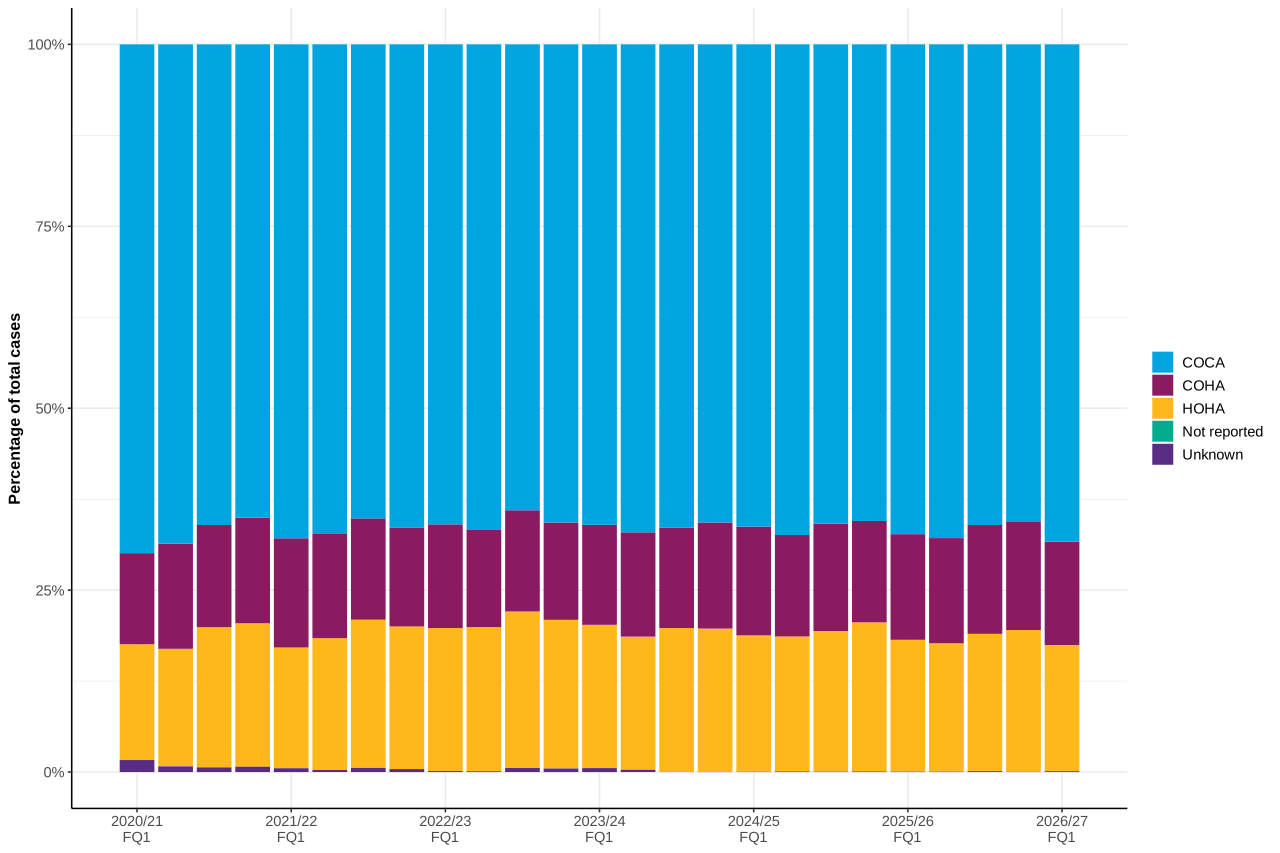
The distribution of cases by these categories has remained broadly stable since 2021. Community-onset community-associated (COCA) cases accounted for the majority (around two-thirds) of E. coli bacteraemia from April 2020. In the current quarter, 68.3% of cases were community-onset community-associated, 14.2% were community-onset healthcare-associated (COHA), and 17.3% were hospital-onset healthcare-associated (HOHA) (Figure 3, Table S1a in the accompanying data tables).
Figure 3. Percentage of E. coli bacteraemia cases by prior trust exposure, April 2020 to June 2026
Klebsiella spp. bacteraemia
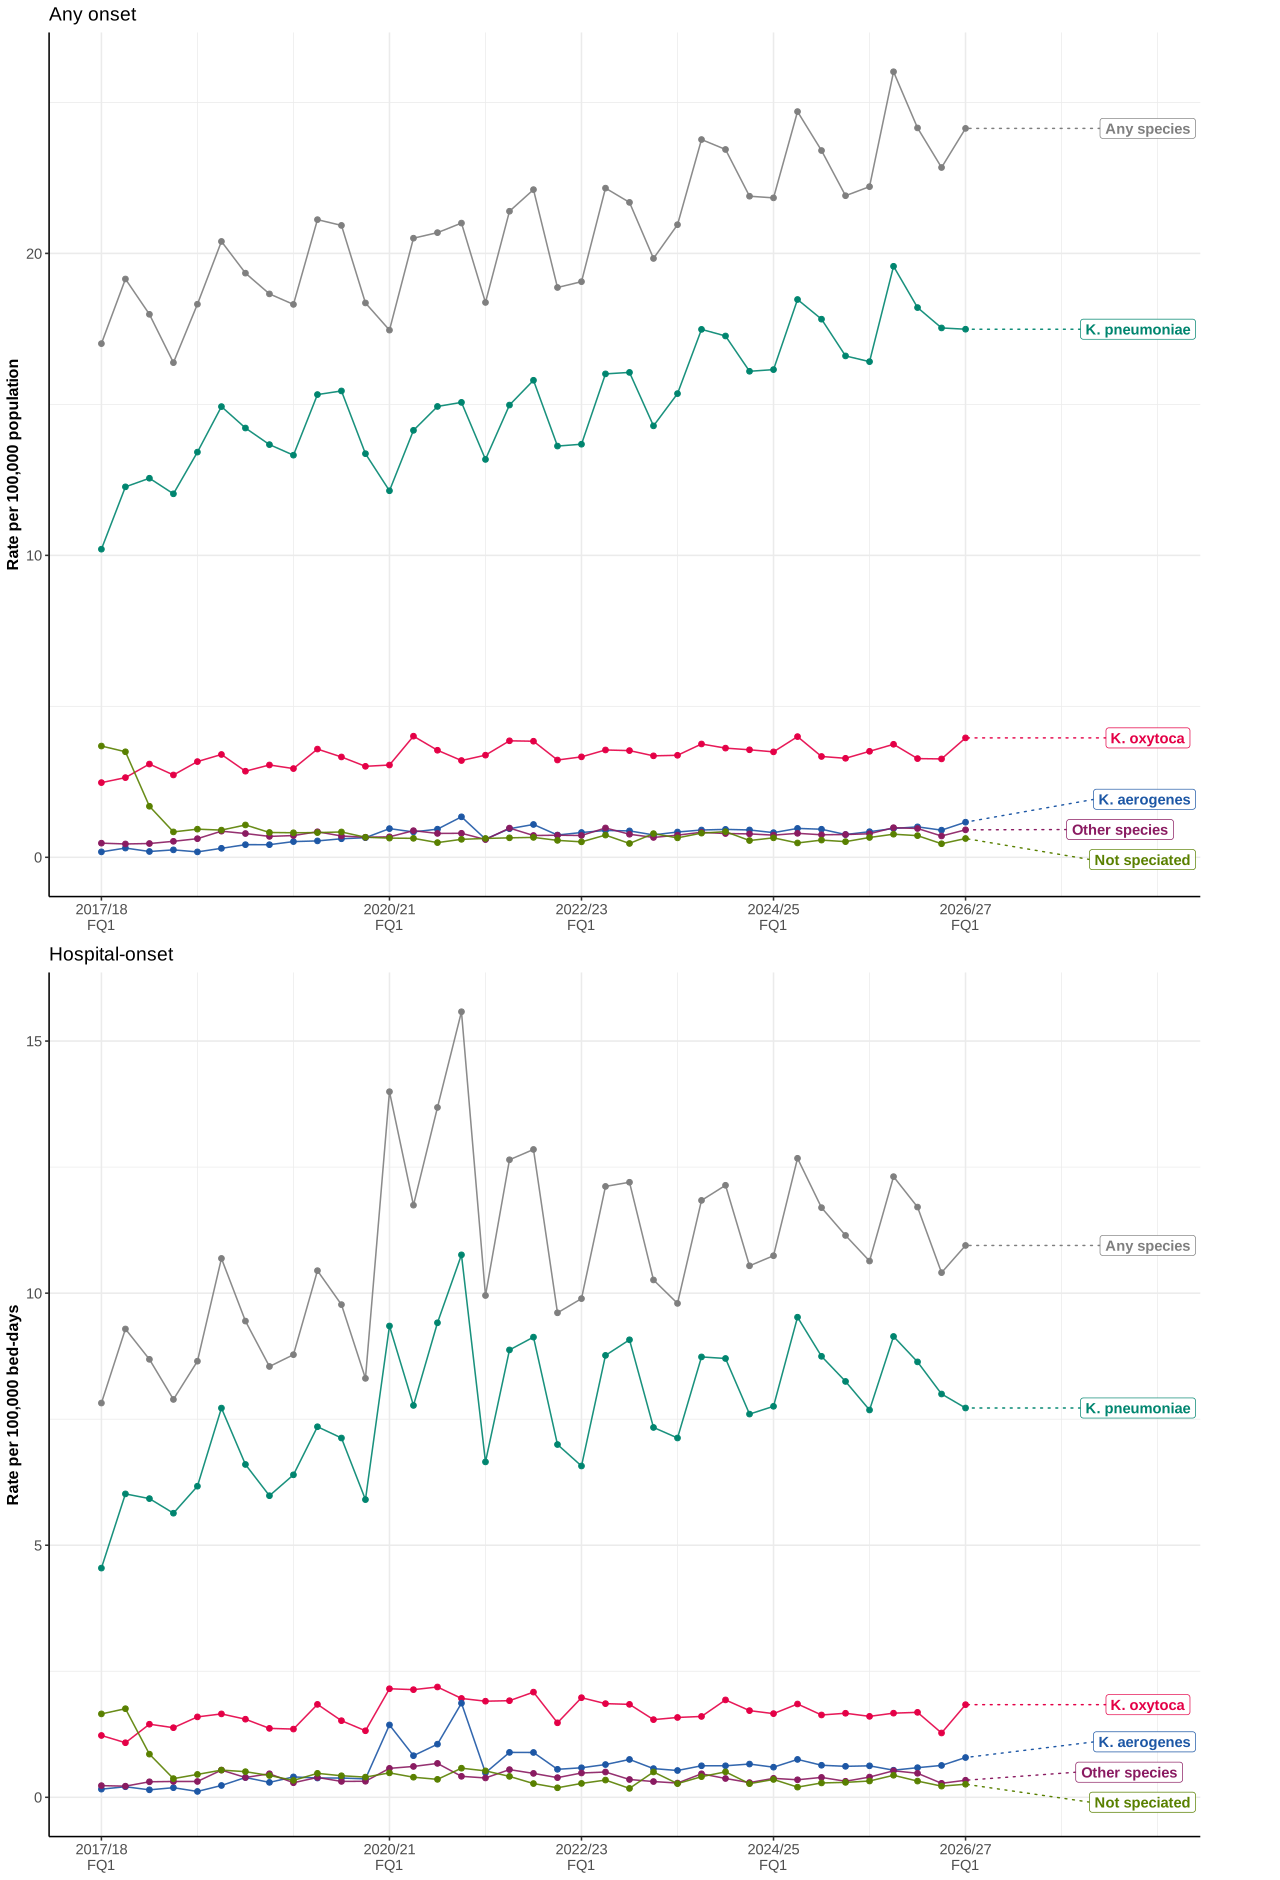
There were 3,528 total reported cases of Klebsiella spp. bacteraemia in April to June 2026 (Figure 4).
Figure 4. Quarterly rates of Klebsiella spp. bacteraemia, total reported and hospital-onset cases, by species, April 2017 to June 2026
Compared with start of surveillance
There was an increase of 41.9% in the incidence rate from 17.0 to 24.1 cases per 100,000 population compared with April to June 2017 (the corresponding quarter in the starting year of surveillance). There were 971 hospital-onset cases, a 40.0% increase in incidence from 7.8 to 10.9 per 100,000 bed-days compared to April to June 2017 (Table S2 in the accompanying data tables). There were 2,557 community-onset cases, which corresponded to a 44.2% increase in incidence rate from 12.1 to 17.5 cases per 100,000 population.
Compared with pre-pandemic
When comparing April to June 2026 with the equivalent pre-COVID-19 pandemic period (April to June 2019), there was an increase of 31.8% in the incidence rate from 18.3 to 24.1 cases per 100,000 population. The incidence rate of community-onset cases increased by 35.7% from 12.9 to 17.5 cases per 100,000 population. The hospital-onset incidence rate increased by 24.7% from 8.8 to 10.9 cases per 100,000 bed-days.
Compared with last year
When comparing the most recent quarter to the same quarter last year, the incidence rate of total reported cases increased by 8.7% from 22.2 to 24.1 per 100,000 population. The recent increase was due to an increase in community-onset cases; these saw an increase of 11.6% in incidence rate, from 15.7 to 17.5 per 100,000 population. The hospital-onset incidence rate saw an increase of 2.9% from 10.6 to 10.9 cases per 100,000 bed-days.
By species
During April to June 2026, 72.4% of the total reported Klebsiella spp. bacteraemia were due to K. pneumoniae, 16.4% by K. oxytoca, and 4.8% by K. aerogenes. Since the previous quarter (January to March 2026), hospital-onset Klebsiella genus rates have seen a 5.2% increase to 10.9 cases per 100,000 bed-days. This increase was predominantly due to a 44.0% increase in the K. oxytoca hospital-onset rate to 1.8 cases per 100,000 bed-days, representing 48 extra cases. The increase in K. oxytoca cases was seen in most of the seven NHS England reporting regions but notably in the North West with a 54.7% increase on the previous quarter.
Seasonality
There is a seasonal trend of total reported Klebsiella spp. bacteraemia cases. Higher rates are normally observed in July to December and lower rates observed from January to June of each year (Figure 4).
Prior trust exposure
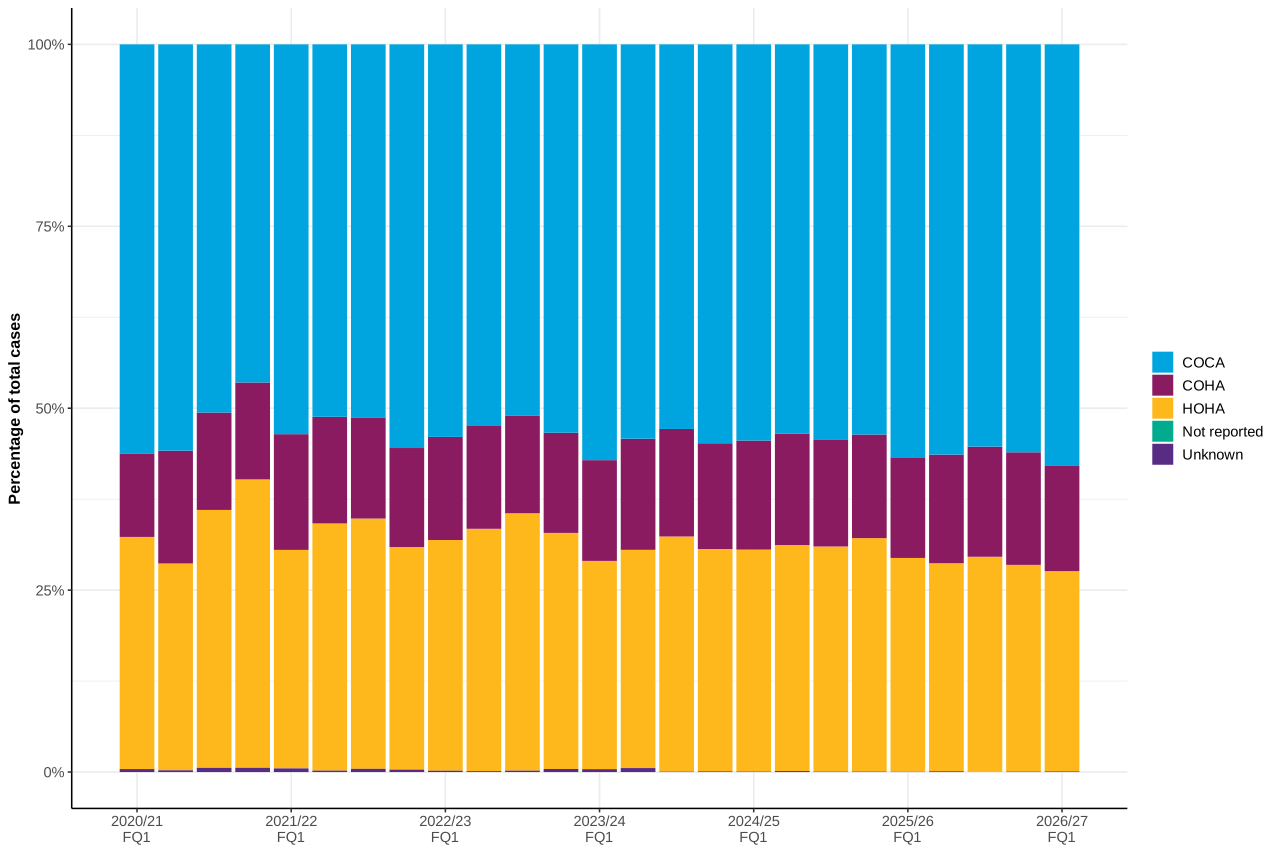
Since the addition of prior trust exposure classifications in April to June 2020, COCA cases have made up slightly more than half of all Klebsiella spp. bacteraemia. This proportion has since decreased and was 57.9% in the latest quarter. In the latest quarter, the proportion of HOHA cases is 27.5% and 14.5% for COHA cases (Figure 5, Table S2a in the accompanying data tables).
Figure 5. Percentage of Klebsiella spp. bacteraemia cases by prior trust exposure, April 2020 to June 2026
Pseudomonas aeruginosa bacteraemia
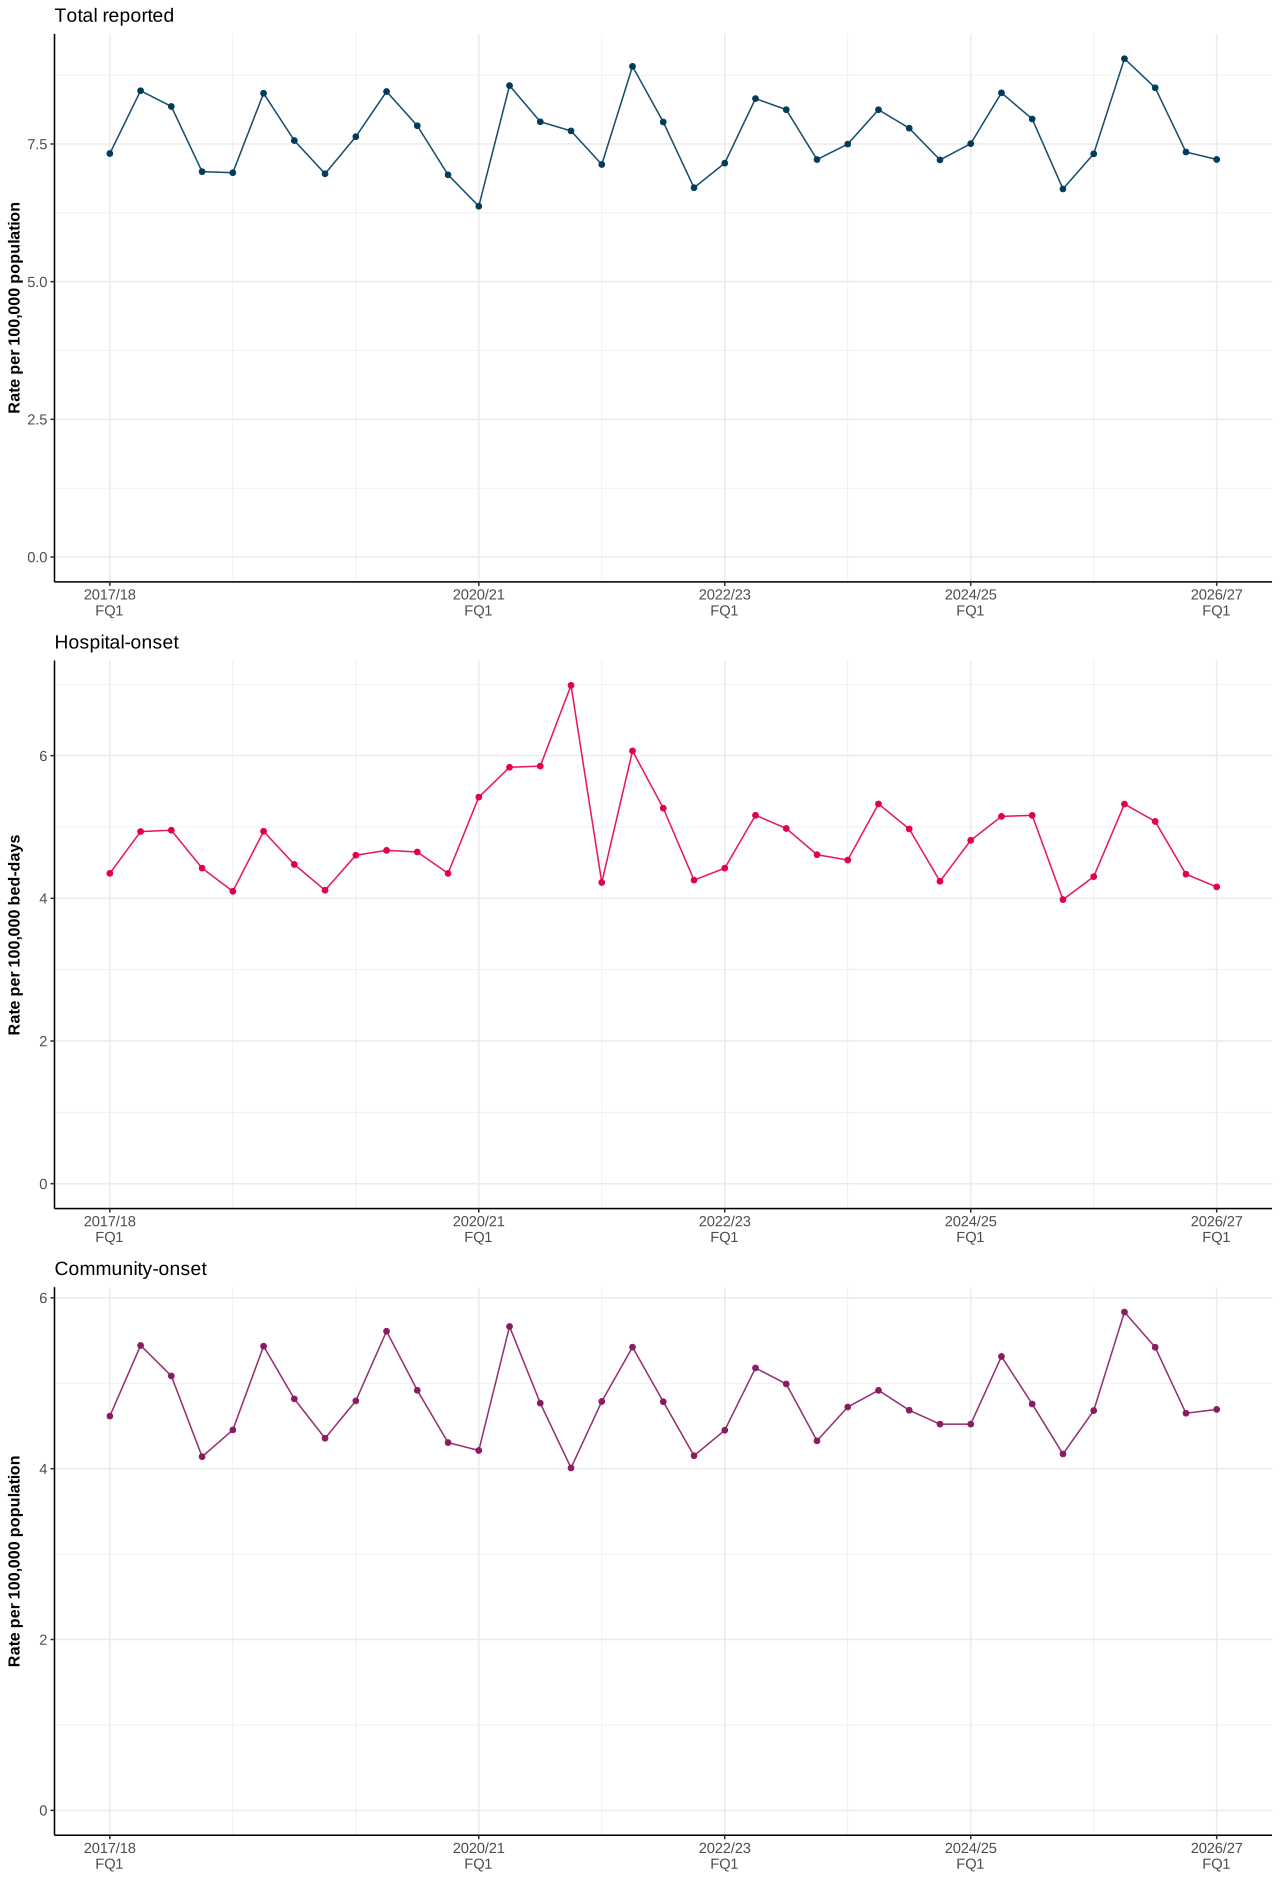
There were 1,055 total reported cases of P. aeruginosa bacteraemia in April to June 2026 (Figure 6).
Figure 6. Quarterly rates of P. aeruginosa bacteraemia, total reported, hospital-onset and community-onset cases, April 2017 to June 2026
Compared with start of surveillance
The incidence rate decreased by 1.5% from 7.3 to 7.2 cases per 100,000 population when compared with April to June 2017 (the corresponding quarter in the starting year of surveillance). There were 369 hospital-onset cases, a 4.4% decrease from 4.3 to 4.2 per 100,000 bed-days compared with April to June 2017 (Table S3 in the accompanying data tables). There were 686 community-onset cases, which corresponded to a 1.7% increase in incidence rate from 4.6 to 4.7 cases per 100,000 population.
Compared with pre-pandemic
When comparing April to June 2026 with the equivalent pre-COVID-19 pandemic period (April to June 2019), there was a decrease of 5.4% in the incidence rate, from 7.6 to 7.2 cases per 100,000 population. The incidence rate of community-onset cases decreased by 2.1% from 4.8 to 4.7 cases per 100,000 population. The hospital-onset incidence rate decreased by 9.6% from 4.6 to 4.2 cases per 100,000 bed-days.
Compared with last year
When comparing the most recent quarter to the same quarter last year, the incidence rate of total reported cases decreased by 1.4% from 7.3 to 7.2 per 100,000 population.
Seasonality
There is a seasonal trend of P. aeruginosa bacteraemia cases. Higher rates are normally observed in July to September and lower rates observed in March to June each year (Figure 6).
Prior trust exposure
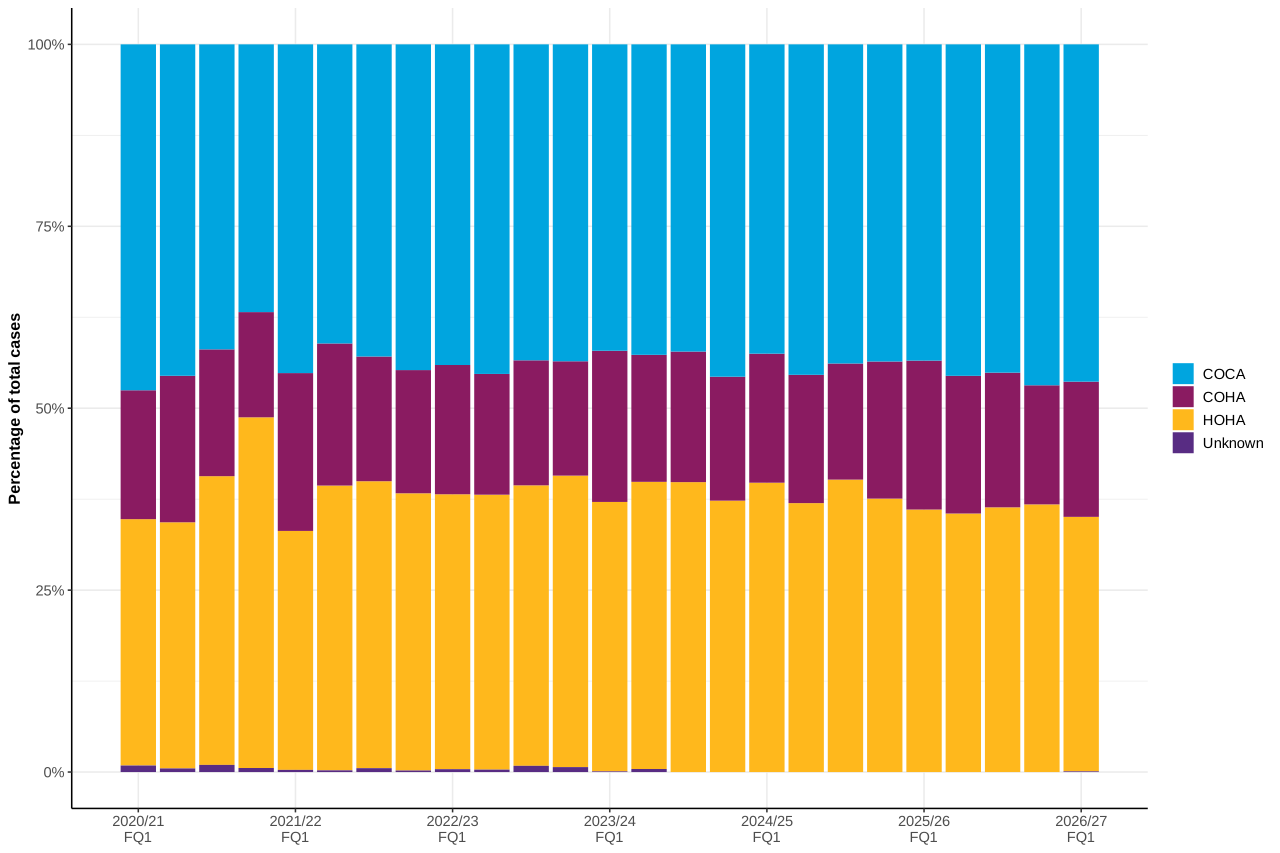
Similarly to E. coli and Klebsiella spp., COCA cases make up the highest proportion of P. aeruginosa bacteraemia cases. In the latest quarter, 46.4% of the total belonged to COCA, 18.6% were COHA, and 35.0% were HOHA (Figure 7, Table S3a in the accompanying data tables).
Figure 7. Percentage of P. aeruginosa bacteraemia cases by prior trust exposure, April 2020 to June 2026
Epidemiological analyses of Staphylococcus aureus bacteraemia data
Meticillin-resistant Staphylococcus aureus (MRSA) bacteraemia
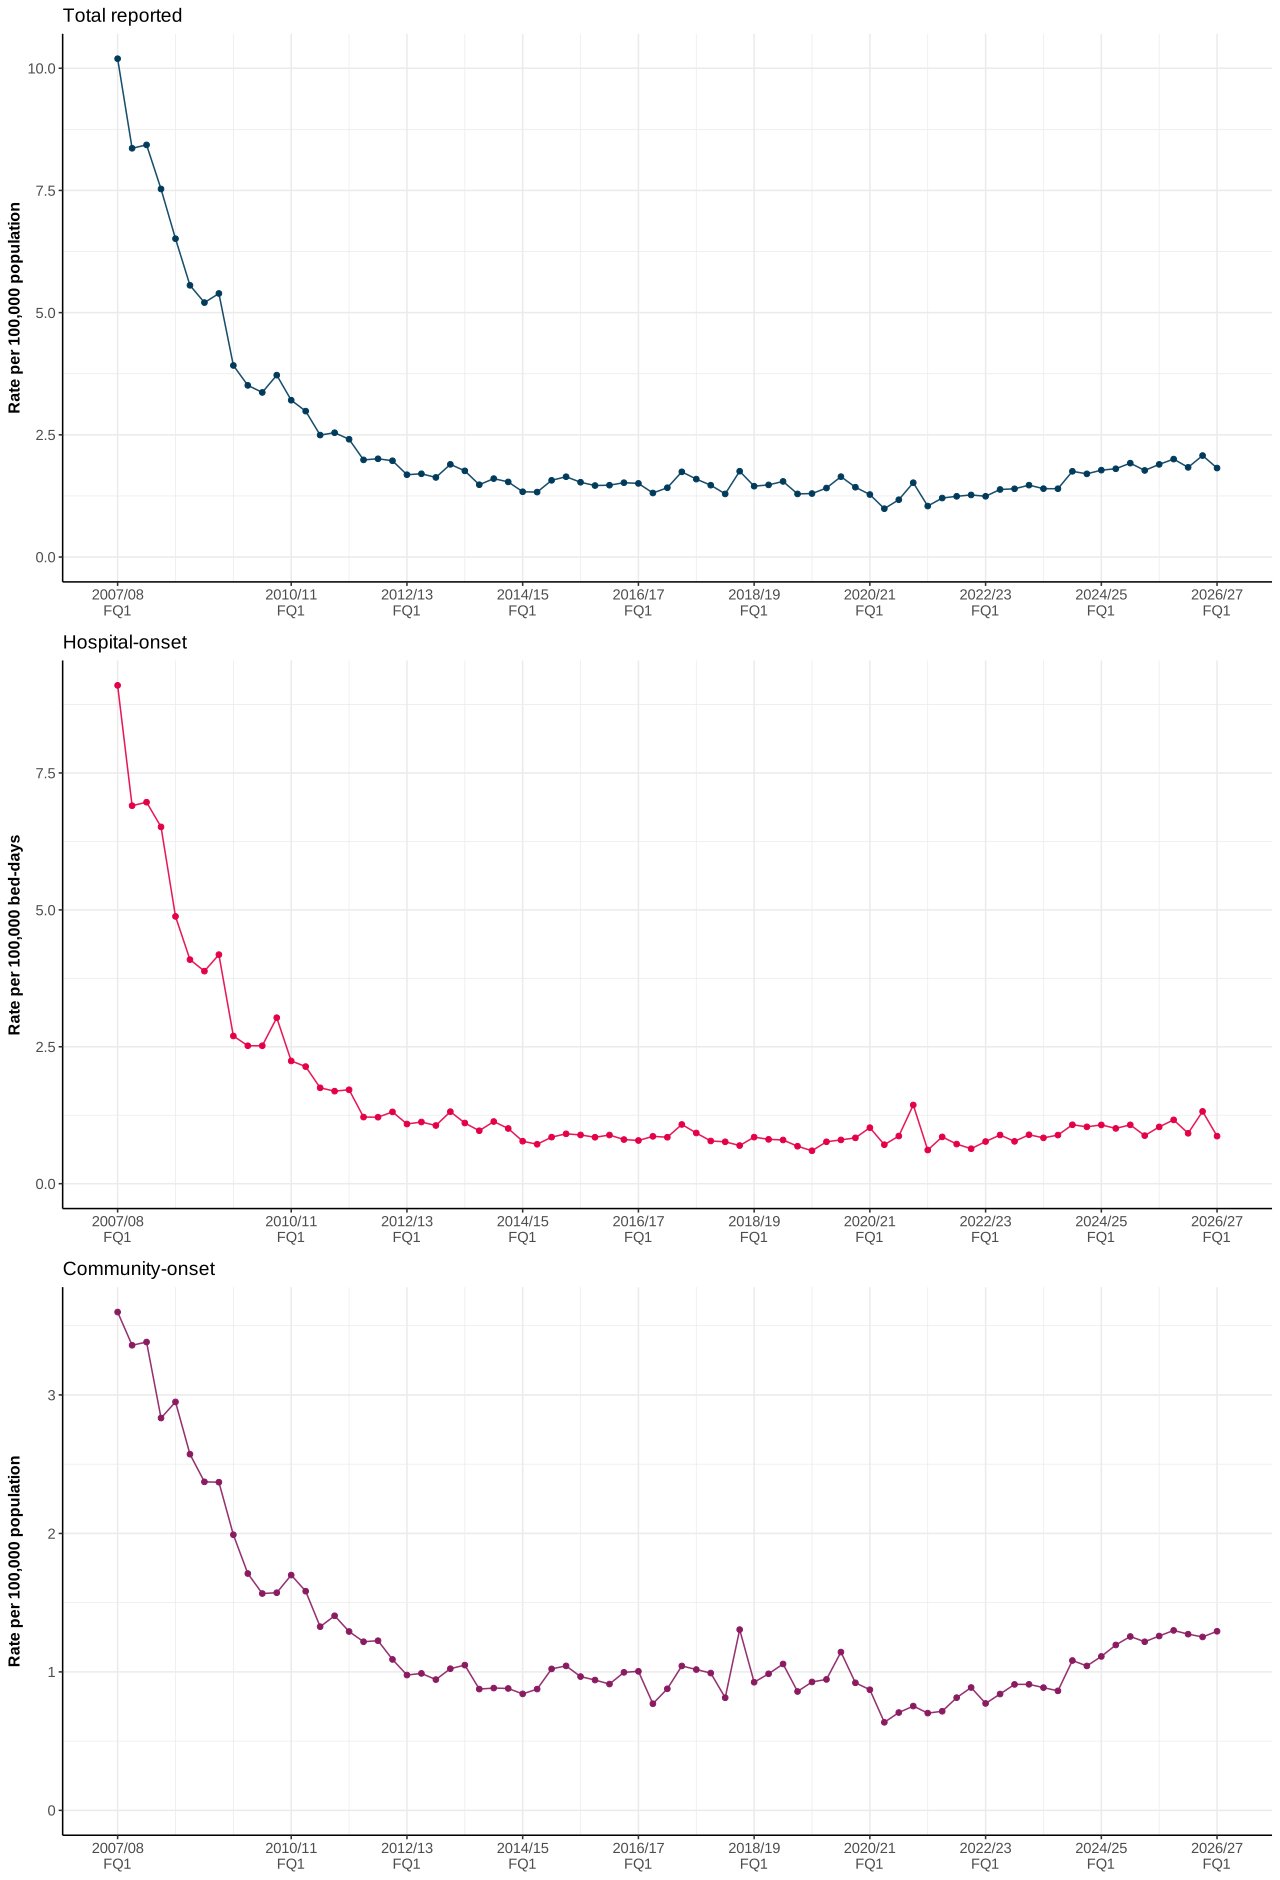
There were 266 total reported cases of MRSA bacteraemia in April to June 2026 (Figure 8). Due to the low incidence of MRSA bacteraemia, proportions should be interpreted with caution.
Figure 8. Quarterly rates of MRSA bacteraemia, total reported cases, hospital-onset and community-onset cases, April 2007 to June 2026
Compared with start of surveillance
There has been a considerable decrease in the incidence rate of total reported MRSA bacteraemia since the enhanced mandatory surveillance of MRSA bacteraemia began in April 2007. The incidence rate decreased by 82.1% from 10.2 to 1.8 cases per 100,000 population when compared with April to June 2007 (the corresponding quarter in the starting year of surveillance). A similar trend was observed with the incidence rate of hospital-onset cases (Table S4 in the accompanying data tables). There was a steep decrease of 90.5% from 9.1 cases per 100,000 bed-days in April to June 2007 to 0.9 cases per 100,000 bed-days.
Compared with pre-pandemic
There was an increase of 40.2% in the incidence rate from 1.3 to 1.8 cases per 100,000 population when comparing April to June 2026 with the equivalent pre-COVID-19 pandemic period (April to June 2019). The incidence rate of community-onset cases increased by 39.5% from 0.9 to 1.3 cases per 100,000 population.
Compared with last year
The incidence rate of total reported cases decreased by 4.0% from 1.9 to 1.8 cases per 100,000 population when comparing the most recent quarter to the same quarter last year. The incidence rate of community-onset MRSA bacteraemia saw a slight increase of 2.7% to 1.3 per 100,000 population. The hospital-onset incidence rate saw a decrease of 16.3% from 1.0 to 0.9 per 100,000 bed-days.
Prior trust exposure
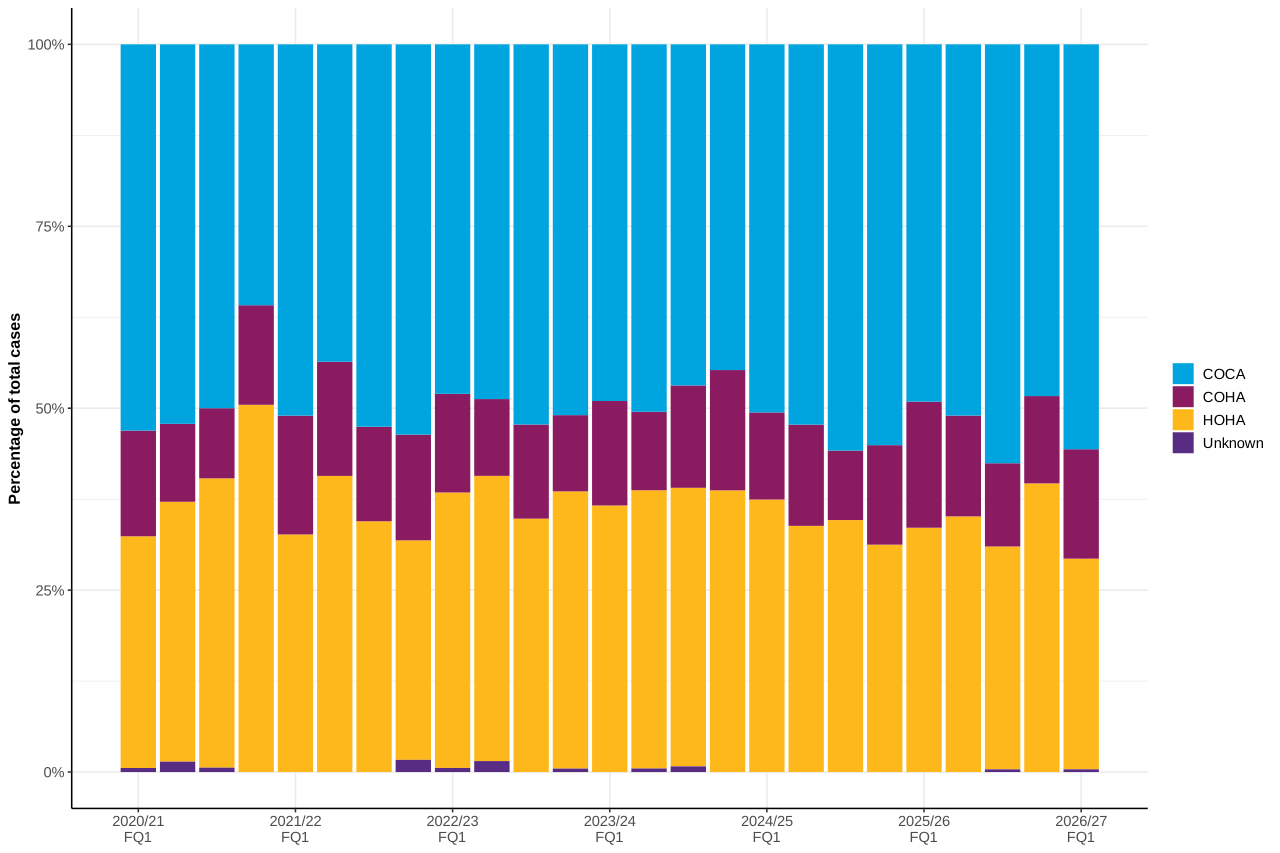
In the current quarter, 55.6% of cases were community-onset community-associated (COCA). 15.0% of cases were community-onset healthcare-associated (COHA), and 28.9% were hospital-onset healthcare-associated (HOHA) (Figure 9, Table S4a in the accompanying data tables).
Figure 9. Percentage of MRSA bacteraemia cases by prior trust exposure, April 2020 to June 2026
Meticillin-sensitive Staphylococcus aureus (MSSA) bacteraemia
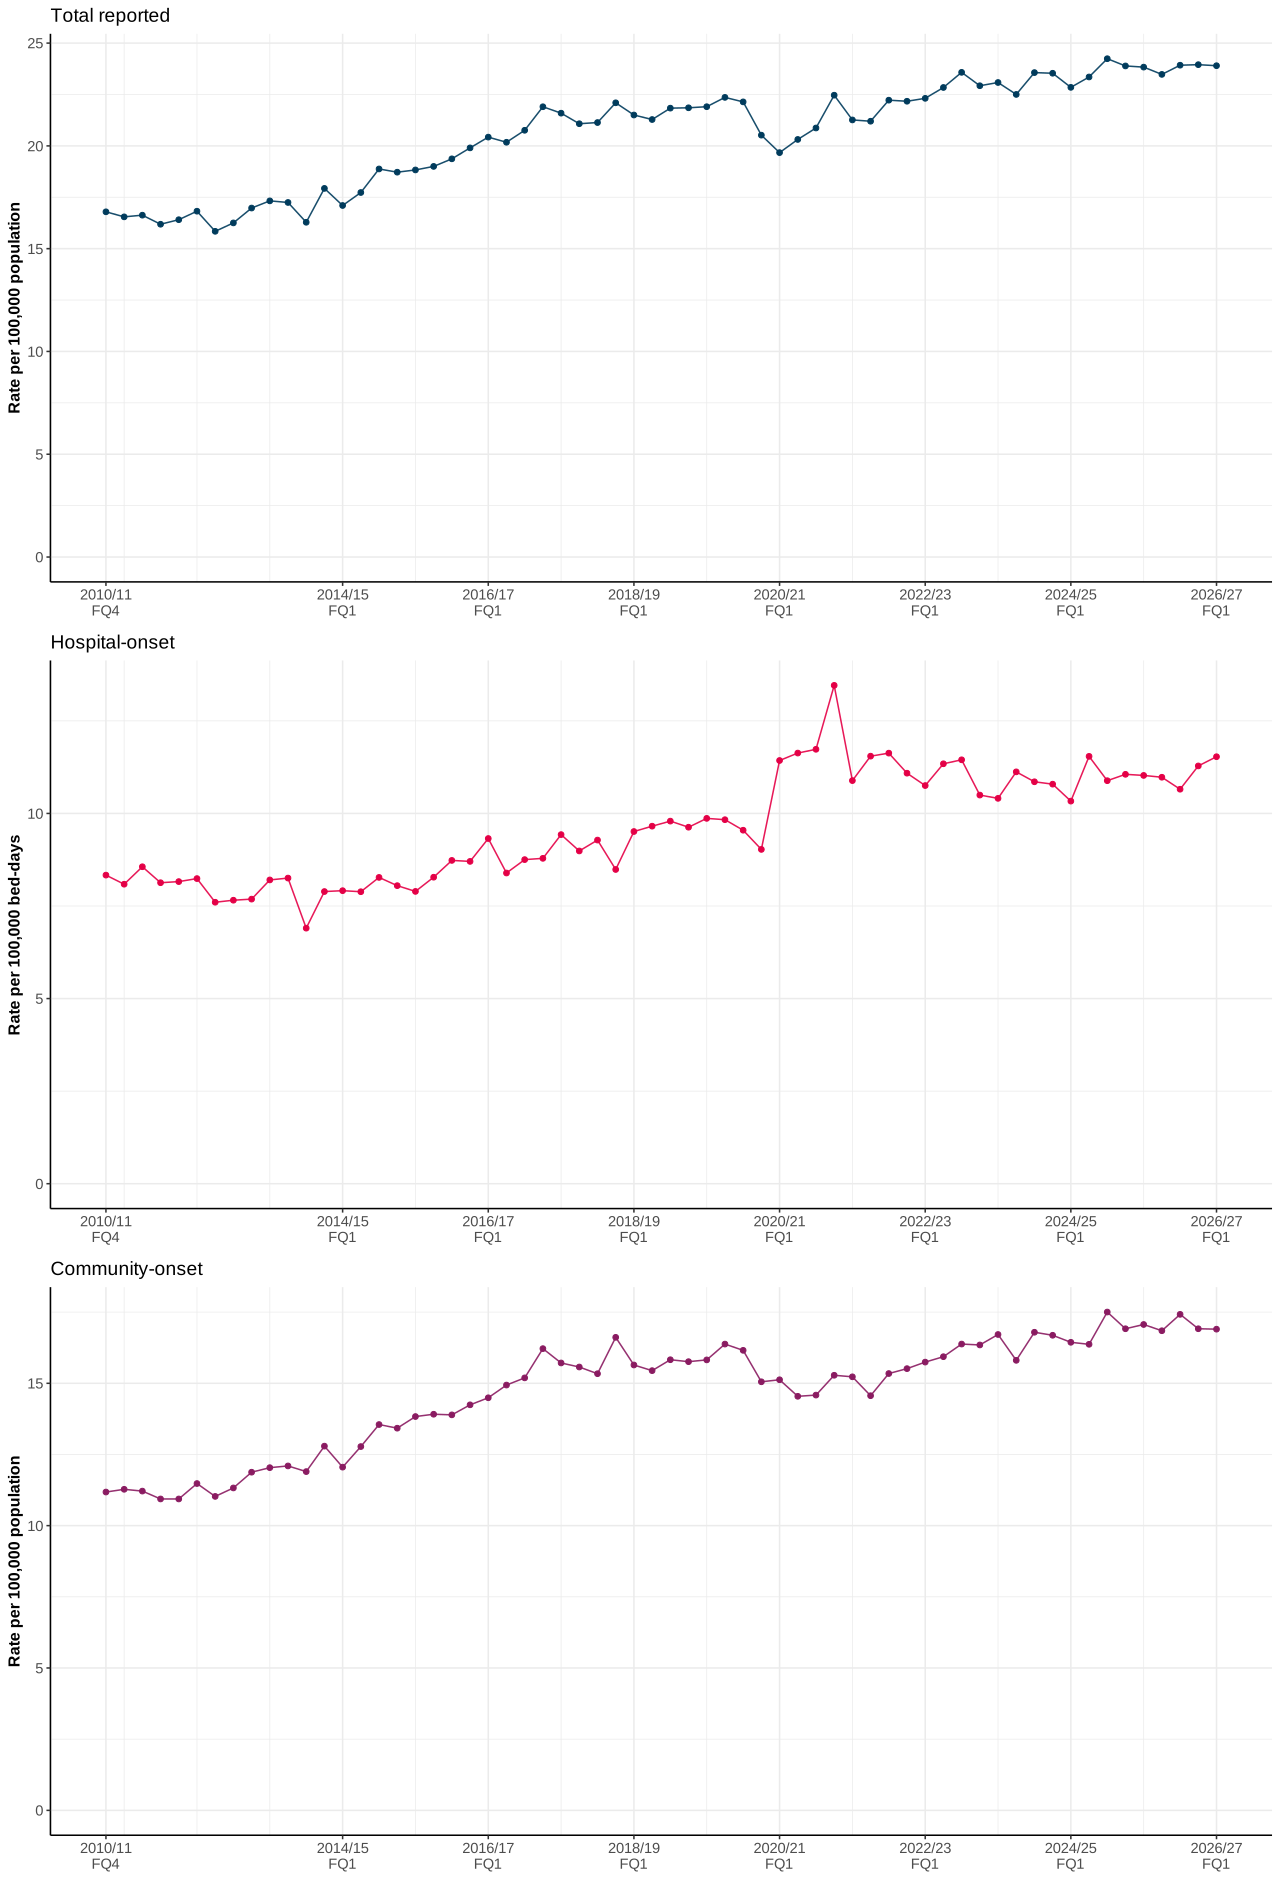
There were 3,493 total reported cases of MSSA bacteraemia in April to June 2026 (Figure 10).
Figure 10. Quarterly rates of MSSA bacteraemia, total reported, hospital-onset and community-onset cases, January 2011 to June 2026
Compared with start of surveillance
There has been a general trend of increasing incidence of MSSA bacteraemia since mandatory reporting began in 2011, except for a temporary decline in cases during the initial stages of the COVID-19 pandemic. Since April to June 2011 (the corresponding quarter in the starting year of surveillance), there was an increase of 44.4% in incidence rate, from 16.5 to 23.9 cases per 100,000 population. This increase is primarily due to the increase in community-onset cases. The incidence rate of community-onset cases increased by 49.9% from 11.3 to 16.9 cases per 100,000 population (Table S5 in the accompanying data tables). Over the same period, the incidence rate of hospital-onset cases increased by 42.6% from 8.1 to 11.5 cases per 100,000 bed-days.
Compared with pre-pandemic
There was an increase of 9.1% in the incidence rate from 21.9 to 23.9 cases per 100,000 population when comparing April to June 2026 with the equivalent pre-COVID-19 pandemic period (April to June 2019). The incidence rate of community-onset cases increased by 6.8% from 15.8 to 16.9 cases per 100,000 population.
Compared with last year
The incidence rate showed a slight increase of 0.3% from 23.8 to 23.9 cases per 100,000 population when comparing the most recent quarter (April to June 2026) to the same quarter last year. The hospital-onset MSSA bacteraemia rate saw an increase of 4.6% in incidence rate from 11.0 to 11.5 per 100,000 bed-days. The community-onset MSSA bacteraemia rate showed a slight decrease of 1.0% from 17.1 to 16.9 cases per 100,000 population.
Prior trust exposure
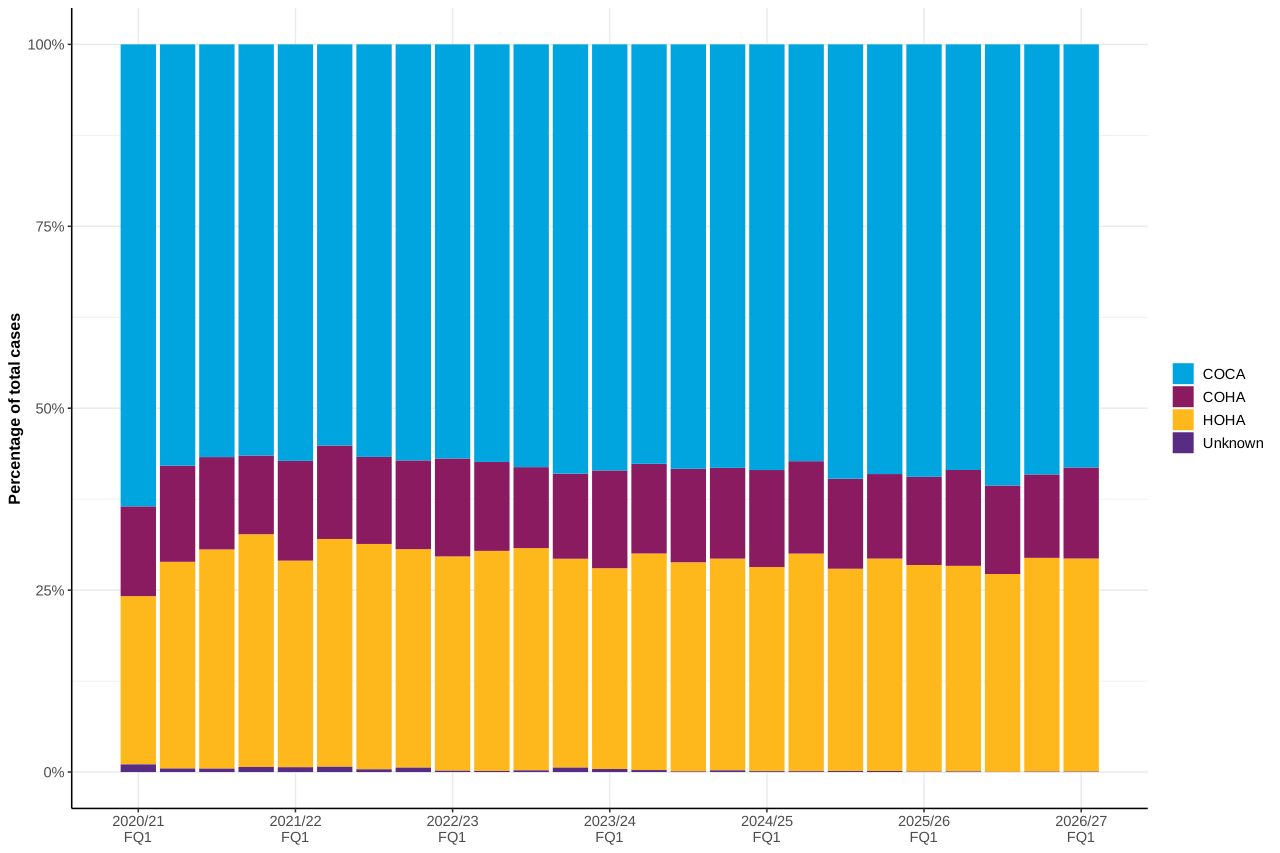
In the current quarter, 58.1% of cases were community-onset community-associated (COCA), 12.5% community-onset healthcare-associated (COHA), and 29.3% hospital-onset healthcare-associated (HOHA) (Figure 11, Table S5a in the accompanying data tables).
Figure 11. Percentage of MSSA bacteraemia cases by prior trust exposure, April 2020 to June 2026
Laboratory blood cultures
On a quarterly basis, NHS acute trusts are mandated to report the total number of blood culture sets tested. The pooled blood culture positivity of E. coli, Klebsiella spp., P. aeruginosa, MRSA and MSSA bacteraemia was 3.4% in April to June 2026, which was the same as at the start of surveillance in April to June 2017. There were some fluctuations in the intervening quarters (Figure 12, Table S9 in the accompanying data tables).
Figure 12. Trends in pooled E. coli, Klebsiella spp., P. aeruginosa, MRSA and MSSA blood culture median positivity, England, by financial year: July to September 2017 to April to June 2026 [note 1]
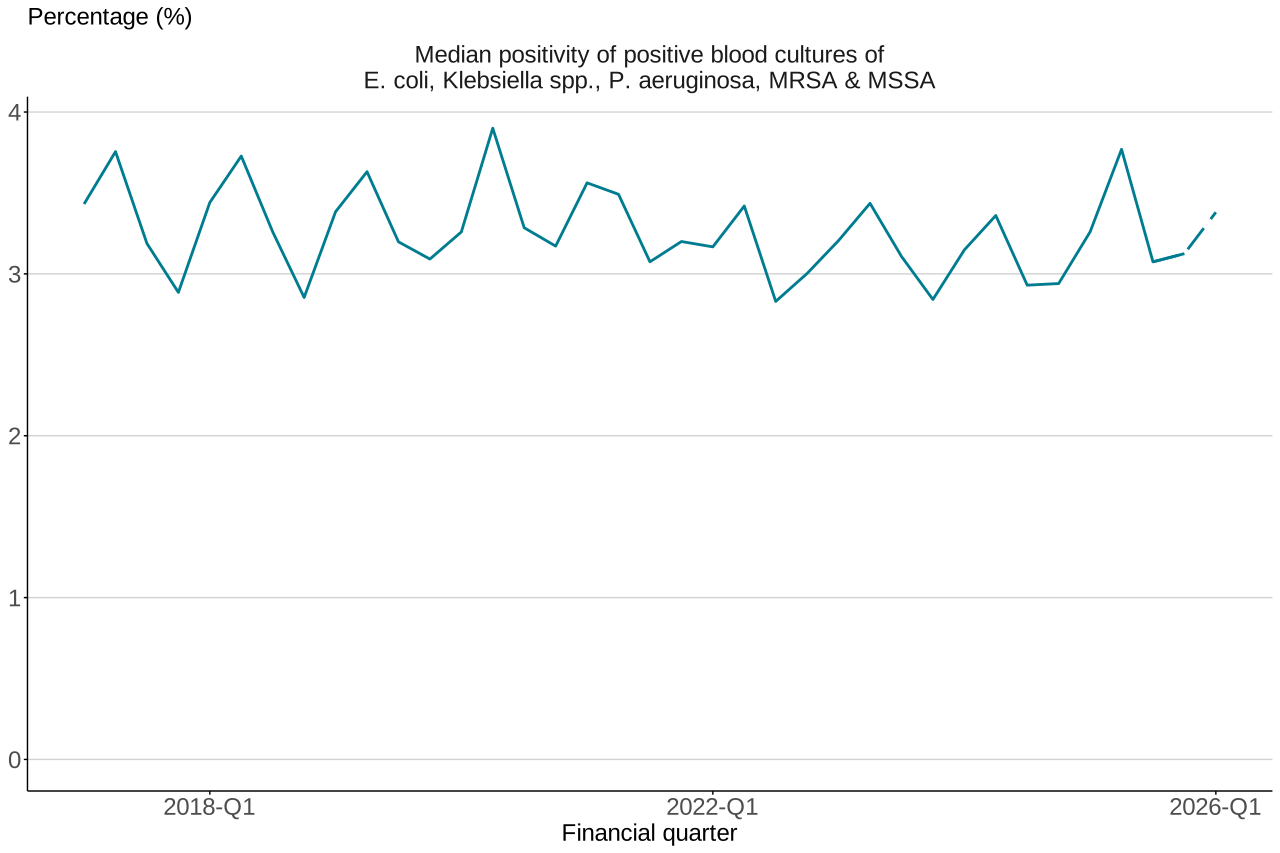
Note 1: the number of trusts submitting data on blood culture sets has declined in the most recent financial quarter. Data from this quarter, shown with the dashed line on the graph, is incomplete and should be interpreted with caution.
The number of trusts submitting quarterly is variable. Overall, 101 trusts submitted data for April to June 2026 (see notes 1 and 2). The median positivity (Figures 12 and 17) is a more robust metric to such missingness than the rate estimates provided (Figures 13 and 16).
Excepting the COVID-19 pandemic, the rate of blood culture sets tested gradually increased from April to June 2010. This rose by 32.1% from 30.3 to 40.1 blood culture sets examined per 1,000 population in January to March 2026 (Figure 13, Table S8 in the accompanying data tables).
Figure 13. Trends in the rate of blood culture sets, England, by financial year: April-June 2010 to January-March 2026 [note 1]
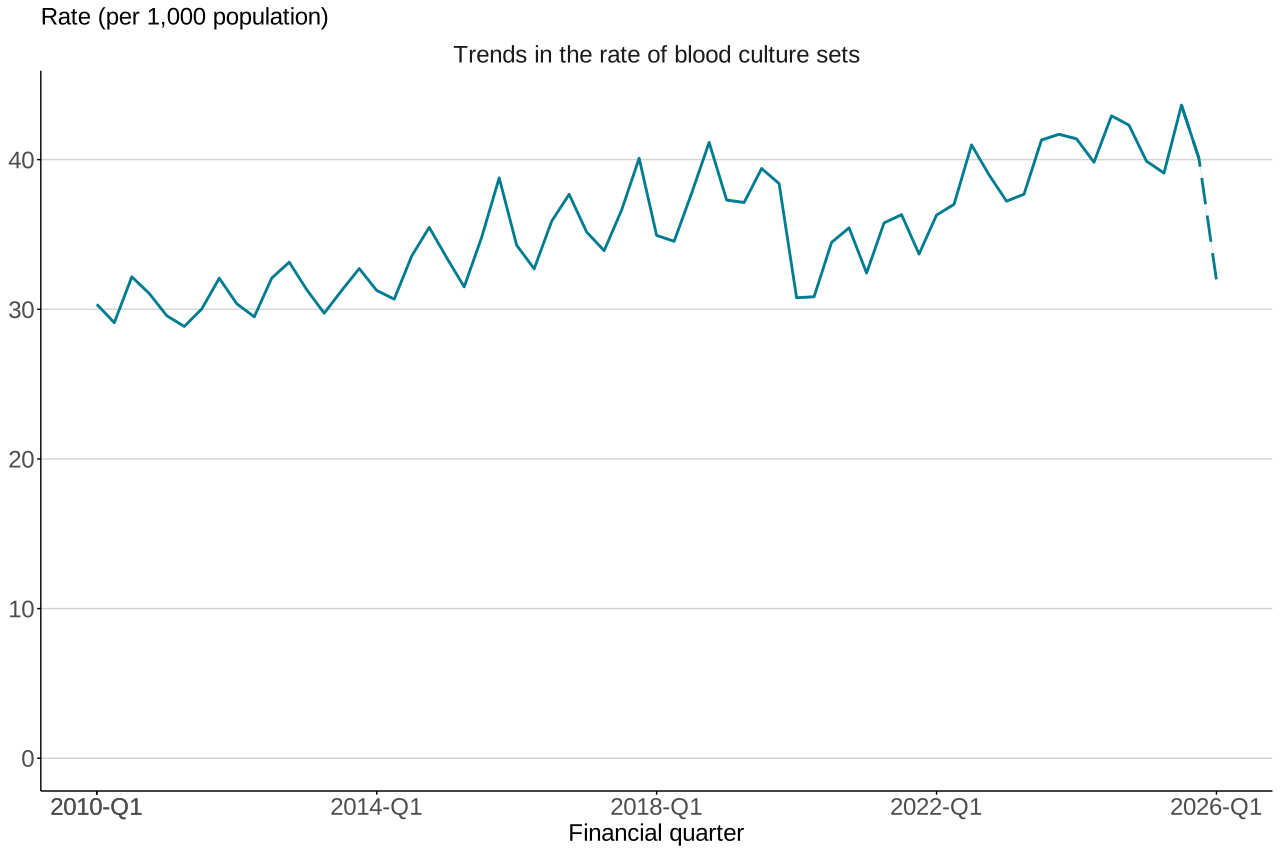
Note 1: the number of trusts submitting data on blood culture sets has declined in the most recent financial quarter. Data from this quarter, shown with the dashed line on the graph, is incomplete and should be interpreted with caution.
While the sampling rate has increased concurrently with the overall increase in bacteraemia incidence, this does not appear to have impacted positivity, which is between 2.8% to 3.9%. Positivity has remained relatively stable throughout the surveillance period. However, there may be variation by data collection or at trust-level.
Although there appeared to be a sharp decline of 20.3% in the rate of blood culture sets examined per 1,000 population compared with the previous quarter, this should be treated with caution. The reduction in the number of trusts reporting during this period (note 1) may have contributed to this observed decrease. This may also affect the observed increase in blood culture positivity rate but to a smaller degree.
Epidemiological analyses of Clostridioides difficile infection (CDI) data
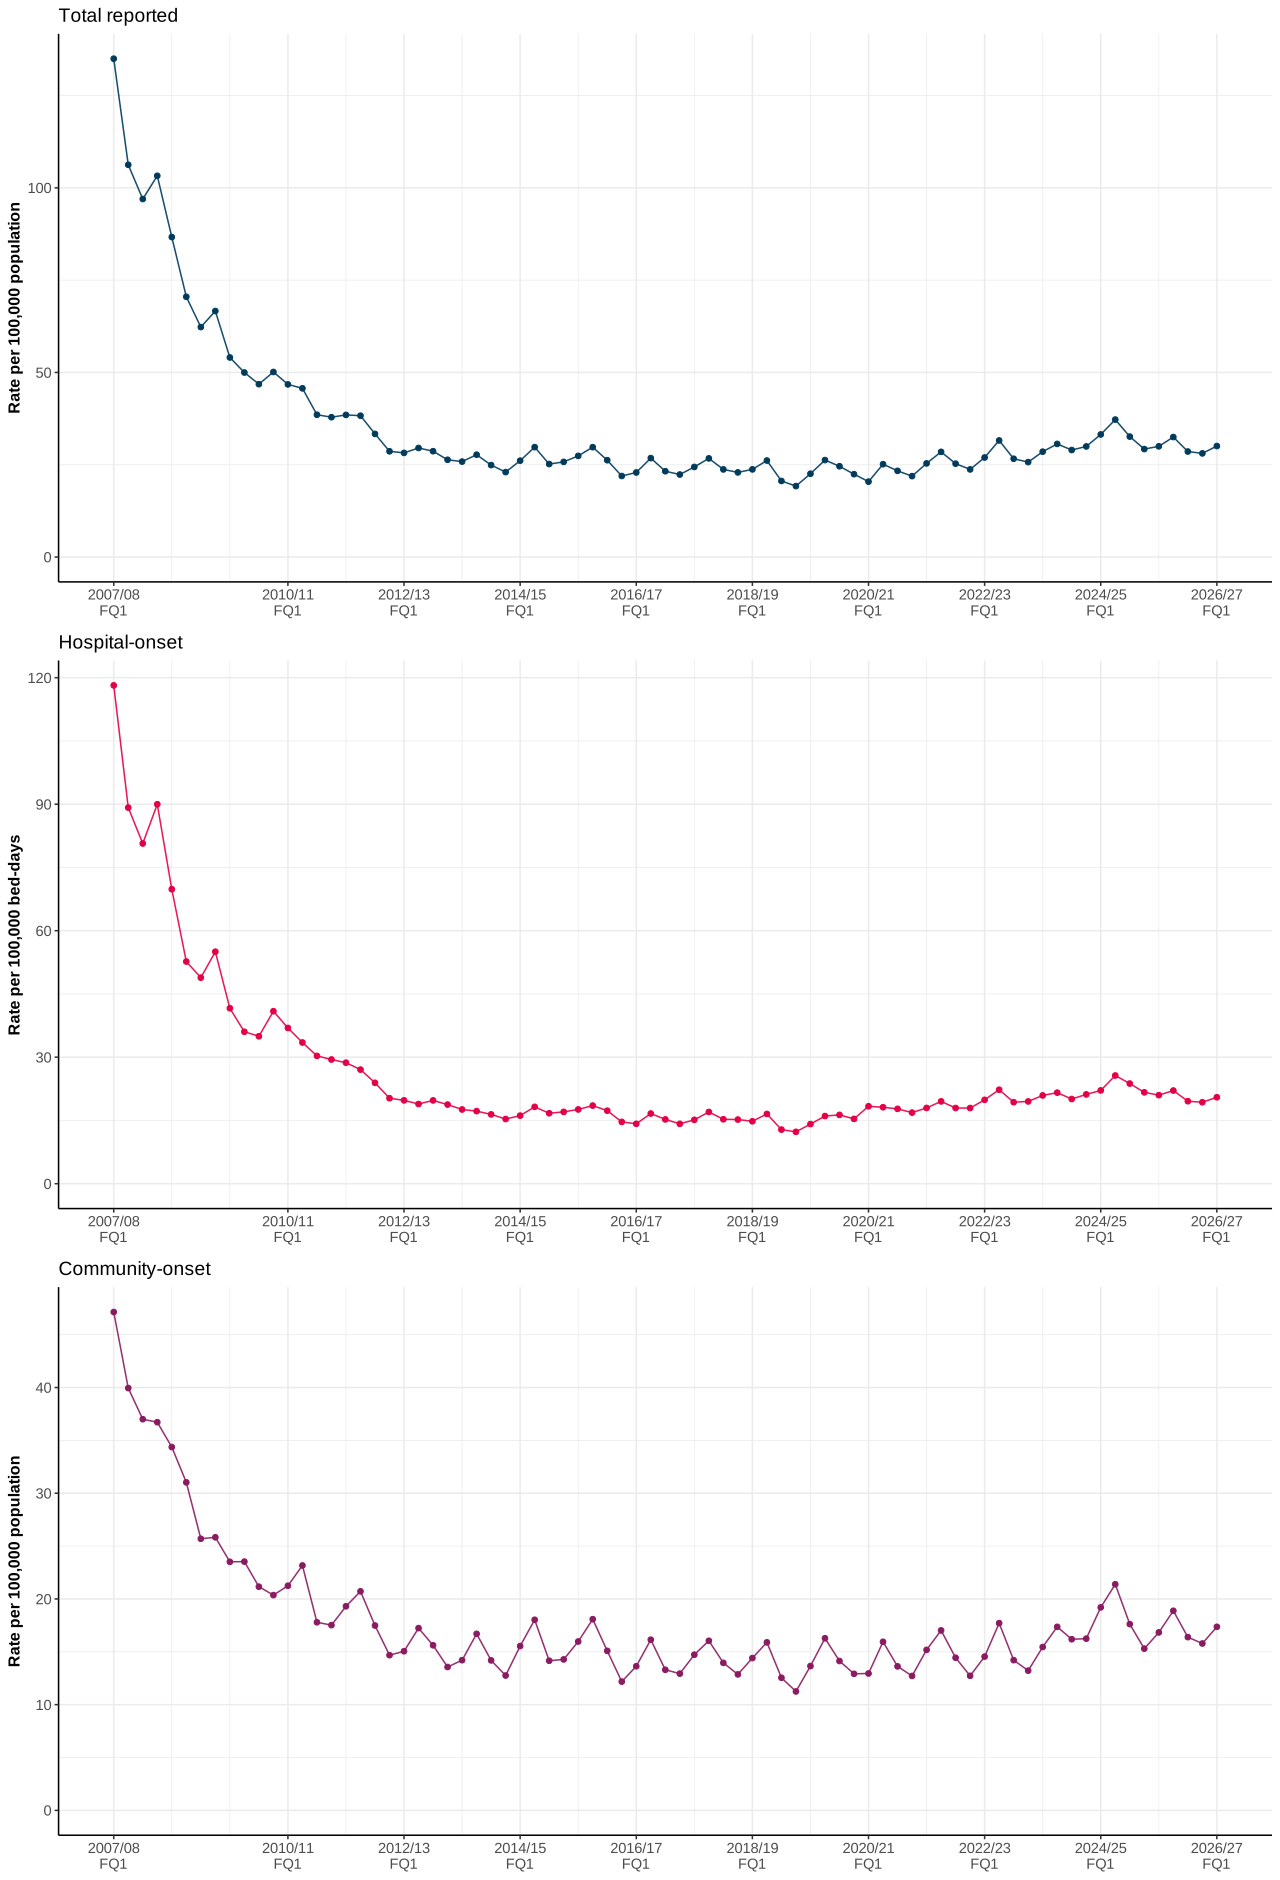
There were 4,305 total reported cases of CDI in April to June 2026 (Figure 14).
Figure 14. Quarterly rates of C. difficile infection, total reported, hospital-onset and community-onset cases, April 2007 to June 2026
Compared with start of surveillance
Since the start of CDI surveillance in April 2007, there have been substantial decreases in the incidence of CDI. Compared with April to June 2007 (the corresponding quarter in the starting year of surveillance), the overall incidence rate decreased by 77.7% from 135.0 to 30.1 cases per 100,000 population. The community-onset incidence rate decreased by 63.2% from 47.1 to 17.4 cases per 100,000 population (Table S6 in the accompanying data tables). The hospital-onset incidence rate decreased by 82.7% from 118.2 to 20.5 cases per 100,000 bed-days.
Compared with pre-pandemic
The overall incidence rate increased by 33.2% from 22.6 to 30.1 cases per 100,000 population when comparing the latest quarter with the corresponding pre-pandemic quarter of (April to June 2019). The incidence rate of community-onset cases increased by 27.2% from 13.6 to 17.4 cases per 100,000 population. The incidence rate of hospital-onset cases increased by 45.0% from 14.1 to 20.5 cases per 100,000 bed-days.
Compared with last year
The incidence rate showed a slight increase of 0.3%, from 30.0 to 30.1 cases per 100,000 population when comparing the latest quarter to the same quarter last year. Hospital-onset CDI cases decreased by 2.4% in incidence rate from 21.0 to 20.5 per 100,000 bed-days. The community-onset incidence rate increased by 3.2% from 16.8 to 17.4 cases per 100,000 population.
Seasonality
There is a seasonal trend of community-onset CDI cases (Figure 14). Higher rates are normally observed in July to September and lower rates observed in January to March each year (Figure 6).
Prior trust exposure
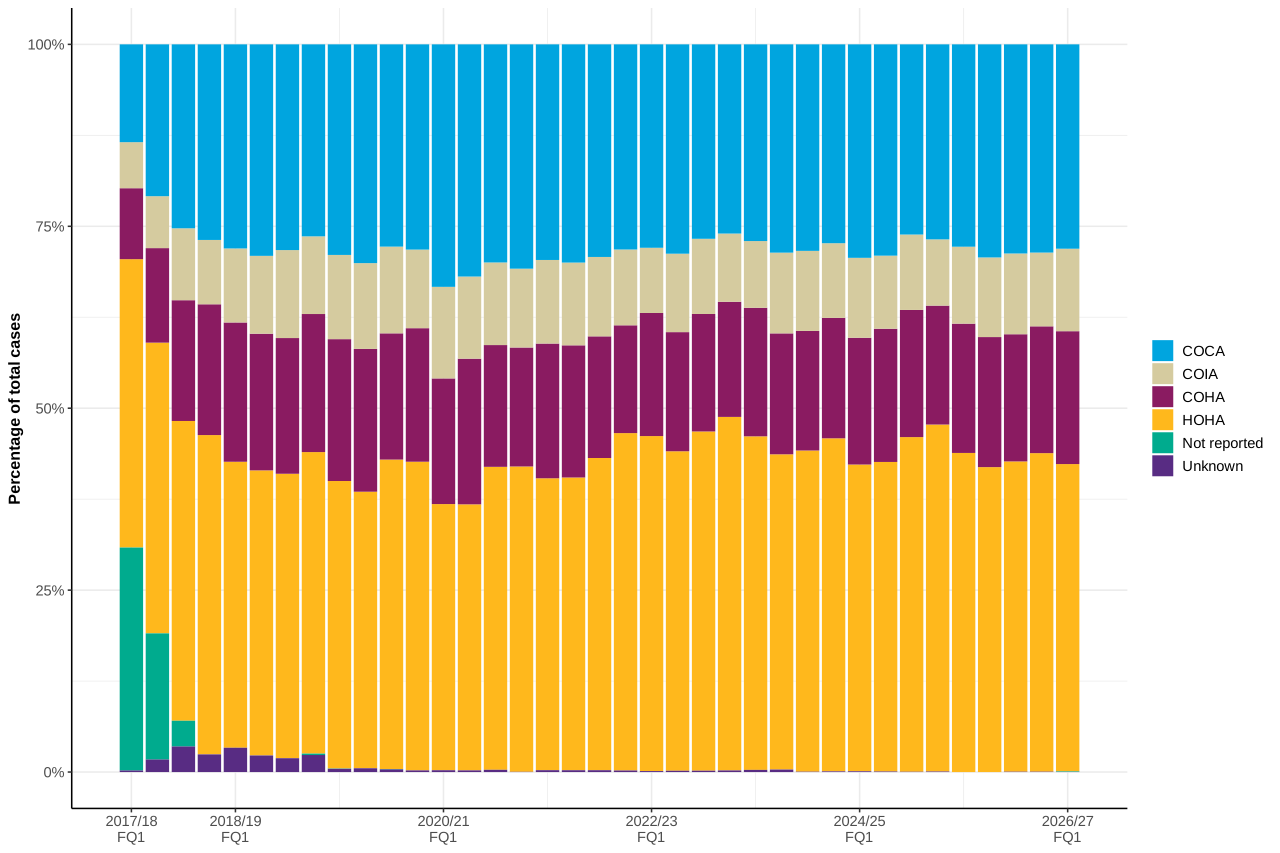
The largest proportion of cases in the latest quarter were HOHA, accounting for 42.2% of the total (Figure 15, Table S6a in the accompanying data tables). COCA cases in the latest quarter were 28.1% of the total. COHA and community-onset indeterminate-association (COIA) cases constituted 18.3% and 11.3% in the last quarter respectively.
Figure 15. Percentage of C. difficile infection cases by prior trust exposure, April 2017 to June 2026
Laboratory stool specimens
On a quarterly basis NHS acute trusts are mandated to report the total number of stool specimens tested and the total number of stool specimens tested for diagnosis of CDI. The CDI positivity was initially 3.4% in April to June 2010 before declining by 44.0% to 2.1% by January to March 2026 (Figure 16, Table S9 in the accompanying data tables). While the sampling rate since surveillance began has mirrored changes in CDI incidence (Figure 17), this does not appear to have affected CDI positivity, which has seen a downtrend throughout this period. However, this England-level analysis may hide different relationships that exist at a trust level.
Figure 16. Trends in median percentage positivity of stool specimens examined for CDI diagnosis, April 2010 to March 2026 [note 2]
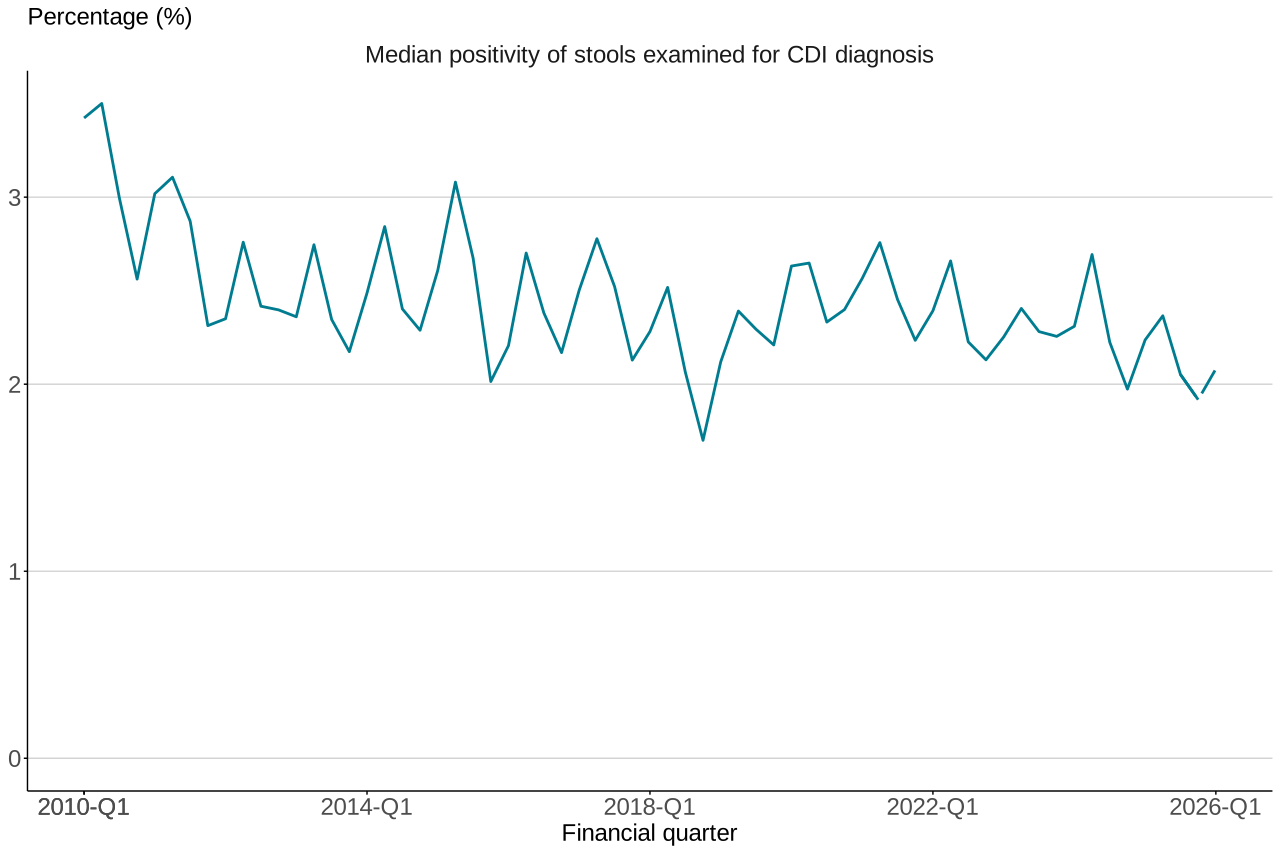
Note 2: the number of trusts submitting data on stool specimen sampling has declined in the most recent quarter. Data from this quarter, shown with the dashed line on the graph, is incomplete and should be interpreted with caution.
Since the start of the COVID-19 pandemic, there has been an increasing trend in overall stool specimen sampling rate. The sampling rate has risen from 15.7 per 100,000 population in April to June 2020 to 36.3 per 1,000 population in January to March 2026. The sharp drop of 23.1% in the most recent quarter versus the previous quarter is likely due to the reduction in the number of trusts reporting (Figure 17, Table S8 in the accompanying data tables). This may also affect the observed increase in blood culture positivity rate but to a smaller degree.
Figure 17. Trends in the rate of stool specimens examined for CDI diagnosis and overall stool specimens examined, April 2010 to June 2026 [note 2]
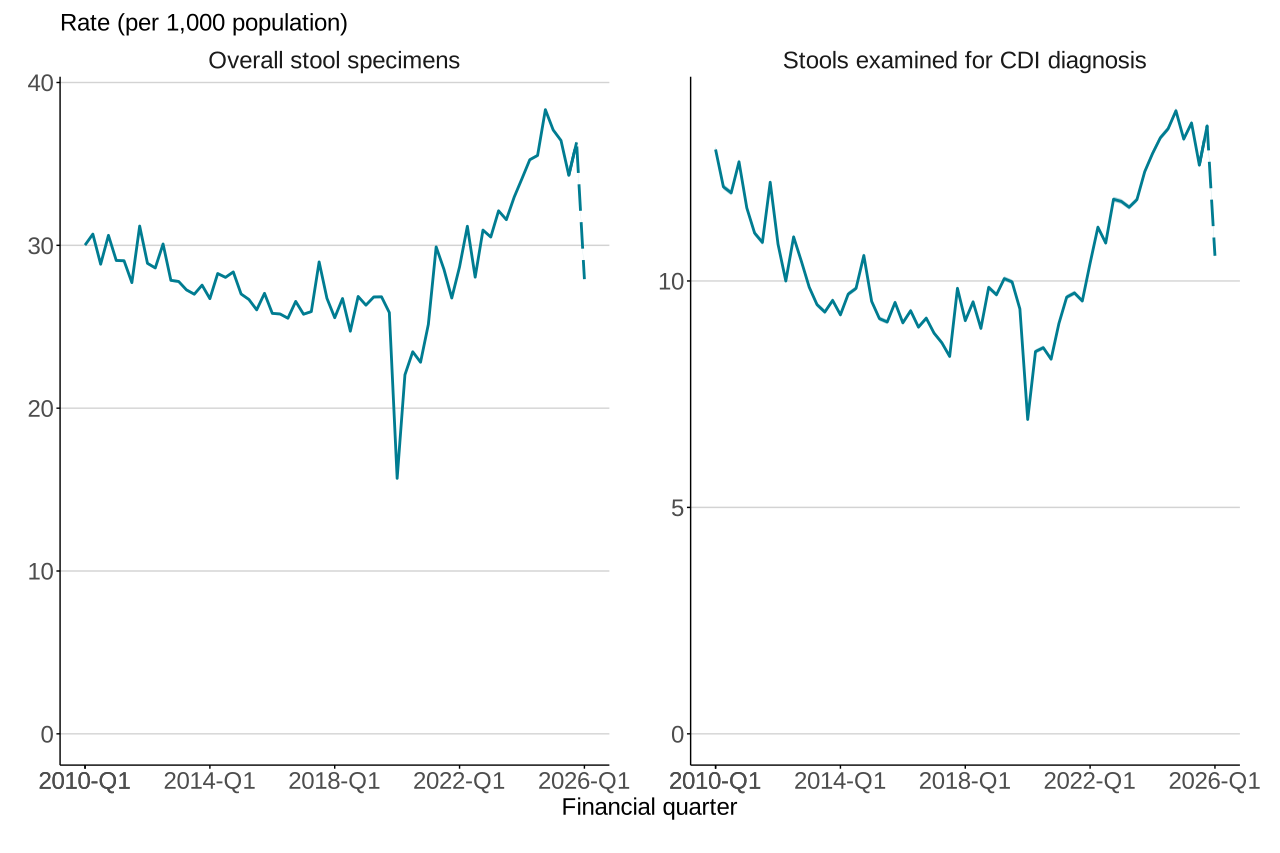
Note 2: the number of trusts submitting data on stool specimen sampling has declined in the most recent quarter. Data from this quarter, shown with the dashed line on the graph, is incomplete and should be interpreted with caution.
Data sources and methodology
For detailed information about the data sources and methodology used to analyse data in this report, please refer to our QMI report. Some additional information related to this publication is summarised below.
Data sources
Numerator data
Infection episode data used in this report were extracted from UKHSA’s HCAI data capture system (DCS) on 25 to 27 August 2026.
Population data
Mid-year resident population estimates are up to calendar year 2024 released by the Office for National Statistics and based on the 2021 census for England are used to derive the population denominator for the total reported incidence rates and the community-onset incidence rates.
Bed-day data
For bacteraemia and CDI, the average bed-day activity reported by NHS England’s hospital occupancy (KH03) returns is used to derive the bed-day denominator for hospital-onset incidence rates. As of Q1 FY 2010 to 2011, bed-day data has been available on a quarterly basis and has been used as such since Q2 FY 2011 to 2012.
The KH03 data used for this report were published by NHS England on 20 August 2026; this may include revisions of previously published data used in earlier reports.
On 1 December 2015, UKHSA reviewed its policy for processing KH03 data. Data irregularities identified have been flagged with colleagues at NHS England. Until we receive confirmation that any identified change in the occupied overnight bed-days for an acute trust is anomalous, UKHSA now uses the data as published in the KH03 data set. Incidence rates published before December 2015 will differ slightly as a result.
For the KH03 data used to calculate rates included in this report to be consistent over the full-time period, previously amended KH03 data for trust United Lincolnshire Hospitals (trust code: RWD) for FY 2014 to 2015 has been altered to reflect that published in the KH03 data set. This could lead to slight differences in hospital-onset assigned rates when compared with publications prior to 1 December 2015.
Missing data for acute trusts in the KH03 returns will continue to be processed as before, where the KH03 return for the same quarter from the previous year will be used as a proxy. The following acute trusts were therefore affected:
- Moorfields Eye Hospital NHS Foundation Trust (RP6) FY 2007 to 2008, and FY 2008 to 2009: replaced with FY 2006 to 2007
- Rotherham NHS Foundation Trust (RFR): FY 2009 to 2010 and from April to June 2010, to April to June 2011: replaced with FY 2008 to 2009
- Sheffield Teaching Hospitals NHS Foundation Trust (RHQ) from April to June 2010, to April to June 2011: replaced with FY 2009 to 2010
- The Princess Alexandra Hospital NHS Trust (RQW) April to June 2014, and October to December 2014: replaced with April to June 2013, to October to December 2013, respectively
- Ipswich Hospital NHS Trust (RGQ) January to March 2016: replaced with January to March 2015
- West Suffolk NHS Foundation Trust (RGR) April to June 2016, to October to December 2016 and April to June 2017: replaced with April to June 2015, to October to December 2015
- Gloucestershire Hospitals NHS Foundation Trust (RTE) October to December 2016, to January to March 2017: replaced with October to December 2015, to January to March 2016
- James Paget University Hospitals NHS Foundation Trust (RGP), The Dudley Group NHS Foundation Trust (RNA), Birmingham Women’s and Children’s NHS Foundation Trust (RQ3), University Hospitals of Morecambe Bay NHS Foundation Trust (RTX), and East and North Hertfordshire Teaching NHS Trust (RWH) January to March 2026: replaced with January to March 2025
- Countess of Chester Hospital NHS Foundation Trust (RJR) April to June 2026: replaced with April to June 2025
COVID-19 and this data
Marked differences in general trends of all the data collections were observed over the course of the SARS-CoV-2 (COVID-19) pandemic. In general, we observed a reduction in the number of counts, compared with what would have been expected, across all bloodstream infection and CDI cases in the initial stages, followed by various fluctuations.
Analysis of voluntary laboratory surveillance data from April 2020 to March 2022 mirrored the changes seen in the mandatory surveillance system during this period, albeit to different extents. Due to the similarities in trends across both systems, these changes do not appear to be a specific ascertainment problem in the mandatory programme.
Hospital activity changed radically over the course of the pandemic, with an influx of patients critically ill with respiratory infection, and cancellation or delays applied to elective procedures. A gradual staged return to normal activity occurred later. Various other general restrictions on movement and mixing were introduced nationally to limit the spread of the virus. We note that post pandemic, many of these collections have now returned to normal pre-pandemic levels, except for E. coli and CDI.
As a result, data and trends from the beginning of the pandemic onwards should be interpreted with caution and take into consideration these otherwise unprecedented changes.
Background information
UK Health Security Agency and this report
Since the UK Health Security Agency (UKHSA) was created in April 2021, it has been responsible for protecting every member of every community from the effect of infectious diseases, chemical, biological, radiological, and nuclear incidents, and other health threats. We provide intellectual, scientific, and operational leadership at national and local level, as well as on the global stage, to make the nation’s health secure.
The agency replaces Public Health England (PHE) and is an executive agency of the Department of Health and Social Care (DHSC). The transition to UKHSA included the integration of both staff and systems. Accordingly, the systems and processes responsible for the publication of the previous annual epidemiological commentaries were incorporated into UKHSA. The same methods of data capture, analysis and dissemination have been employed in the production of this report.
Report summary
This document contains quarterly, national-level epidemiological commentaries for Escherichia coli (E. coli), Klebsiella spp., Pseudomonas aeruginosa (P. aeruginosa), meticillin-resistant Staphylococcus aureus (MRSA) and meticillin-susceptible Staphylococcus aureus (MSSA) bacteraemia and Clostridioides difficile infection (CDI). These include analyses on counts and incidence rates of total reported, hospital-onset (previously referred to as trust-apportioned) and community-onset (previously referred to as non-trust-apportioned) cases of E. coli, Klebsiella spp., P. aeruginosa, MRSA and MSSA bacteraemia and CDI. All data tables associated with this report are included in an OpenDocument spreadsheet. Data revisions are covered by a data-specific revisions and correction policy.
If this data is used for publication elsewhere, citation to UKHSA, healthcare-associated infections (HCAI) and antimicrobial resistance (AMR) division is required, using the content below.
Further information and contact details
This publication forms part of the range of accredited Official Statistics outputs routinely published by UKHSA which include monthly and annual reports on the mandatory surveillance of E. coli, Klebsiella spp. and P. aeruginosa, MRSA and MSSA bacteraemia and CDI.
Annual report output
Further epidemiological analyses by financial year can be found in UKHSA’s annual epidemiological commentary.
Monthly report outputs
The following reports are produced by UKHSA monthly.
- Gram-negative, MRSA and MSSA bacteraemia, and CDI – monthly data trends
- E. coli, Klebsiella spp., P. aeruginosa, MRSA and MSSA bacteraemia – counts of total reported, hospital-onset healthcare-associated, community-onset healthcare-associated, community-onset community-associated for each bacteraemia by organisation
- CDI – counts of total reported, hospital-onset healthcare-associated, community-onset healthcare-associated, community-onset of indeterminate association, community-onset community-associated CDI by organisation.
Feedback and contact information
For any enquiries or feedback on this report, or to request copies of this report in PDF format, please contact mandatory.surveillance@ukhsa.gov.uk
Accredited official statistics
Our statistical practice is regulated by the Office for Statistics Regulation (OSR). OSR sets the standards of trustworthiness, quality and value in the Code of Practice for Statistics that all producers of Official Statistics should adhere to. You are welcome to contact us directly by emailing mandatory.surveillance@ukhsa.gov.uk with any comments about how we meet these standards. Alternatively, you can contact OSR by emailing regulation@statistics.gov.uk or via the OSR website.
UKHSA is committed to ensuring that these statistics comply with the Code of Practice for Statistics. This means users can have confidence in the people who produce UKHSA statistics because our statistics are robust, reliable and accurate. Our statistics are regularly reviewed to ensure they support the needs of society for information.
Citation
Please cite this document as follows: UK Health Security Agency. Quarterly epidemiology commentary: mandatory MRSA, MSSA and Gram-negative bacteraemia and C. difficile infection in England (up to January to March 2026). London: UK Health Security Agency, July 2026.
Reference
Sloot R, Nsonwu O, Chudasama D, and others. ‘Rising Rates of Hospital-Onset Klebsiella Spp. And Pseudomonas Aeruginosa Bacteraemia in NHS Acute Trusts in England: A Review of National Surveillance Data, August 2020 to February 2021’ Journal of Hospital Infection 2022: volume 119, pages 175 to 181