The state of the environment: the urban environment
Updated 26 January 2023
Applies to England

© Crown copyright 2023
This publication is licensed under the terms of the Open Government Licence v3.0 except where otherwise stated. To view this licence, visit nationalarchives.gov.uk/doc/open-government-licence/version/3 or write to the Information Policy Team, The National Archives, Kew, London TW9 4DU, or email: psi@nationalarchives.gov.uk.
Where we have identified any third party copyright information you will need to obtain permission from the copyright holders concerned.
This publication is available at https://www.gov.uk/government/publications/state-of-the-environment/the-state-of-the-environment-the-urban-environment
Please cite this report as: Environment Agency, Chief Scientist’s Group. (2021). The state of the environment: the urban environment.
Foreword
We need to make sure the cities we love are fit for future environmental risks, not those of the past. For every person who suffers flooding, around 16 others are affected by a loss of services such as transport and power. In June, the Committee on Climate Change released its Independent Assessment of UK Climate Risk. It said in the last 5 years, “over 570,000 new homes have been built that are not resilient to future high temperatures”. Urban planning must create more resilient infrastructure that can adapt to future needs using, where possible and appropriate, nature-based solutions.
The pandemic has shown that climate risks don’t only come in the form of disasters like floods, there are long term health impacts associated with being cut off from green space. The proportion of England’s urban areas made up of green space has declined – just 35% of households with annual incomes below £10,000 are within a 10-minute walk of a publicly accessible natural green space. In James Bevan’s speech “Clean Up, Green Up and Level Up: how to build a future city”, the Environment Agency Chief Executive says: “the NHS could save over £2 billion in treatment costs if everyone in England had equal access to good quality green space.”
The benefits go beyond health: gardens and public parks create habitats for nature, help urban cooling which could reduce emissions from air conditioning, and slow the flow of surface water. Urban planning must improve access to green and blue spaces for the growing populations of city regions. The pandemic has changed the way we work and many think it will remain changed permanently. This could present opportunities to redevelop urban areas and, with potentially less need for offices and shops, increase the public realm.
When world leaders meet at COP26 this year, they will be looking to create investable propositions for climate resilience and for nature-based solutions. Dame Caroline Mason, Chief Executive of the Esmée Fairbairn Foundation and a member of the Environment Agency’s board, has said: “If we understand the models that can make money and can be funded through private capital, we can raise additional money for nature and make sure that public and philanthropic funding goes where it’s most needed.”
This year, the government said that nationally significant infrastructure projects will need to ensure biodiversity net gain. The tools to do this are there, but we need to help the world of finance understand how to connect the dots and deliver returns.
The IGNITION project, which the Environment Agency supports alongside the Greater Manchester Combined Authority and others, is one example where we are trying to do just that. IGNITION’s projects in and around Greater Manchester are providing data that will help develop investable propositions for urban resilience, for public goods and for nature-based solutions to the climate emergency.
How we finance urban resilience sounds like an ethereal, academic problem, but really it’s a human one. The urbanist and author Jane Jacobs said: “There is no logic that can be superimposed on the city; people make it, and it is to them, not buildings, that we must fit our plans.”
I hope this report will help keep those plans focused on people, nature and climate resilience.
Emma Howard Boyd, Chair of the Environment Agency
Main findings
-
England’s urban environment and population is growing, both in city centres and the suburbs.
-
Urban growth and lifestyles affect the environment locally and globally, but urban areas also provide opportunities for sustainable management of resources and waste.
-
Air and water quality in urban areas have improved over recent decades, but progress has not continued in recent years and challenges remain.
-
Urban environments are lower in biodiversity than natural and semi-natural habitats but can provide opportunities for groups such as some mammal and pollinator species.
-
Economic valuation of urban natural capital demonstrates multiple social, environmental and economic benefits and the importance of urban green and blue spaces and blue-green infrastructure.
-
Urban environments can have detrimental impacts on people’s health and wellbeing but can also be harnessed to offer opportunities to prevent and treat ill-health if well designed and maintained.
-
Exposure to air pollution, higher flood risk, poor quality rivers and industrial sites, and access to the natural environment in urban areas are not equally distributed across all sectors of society, leading to issues of environmental justice.
-
Climate change and population growth are exacerbating environmental issues in urban areas.
-
How urban areas grow, as well as by how much, will affect their environments, and the ability to mitigate and adapt to climate change.
-
Urban environments are complex systems, and a system-based approach will better enable people to manage this complexity and identify where nature-based solutions will be most effective.
Cities are hugely important for our society and economy, ensuring they are sustainable by increasing resource efficiency, reducing land take, reducing emissions and waste and incorporating green and blue infrastructure offers huge opportunities socially, economically and environmentally.
Professor Sir Partha Dasgupta, The Economics of Biodiversity – The Dasgupta Review, 2020.
Introduction
Urban life can create a false sense of separation between people and nature. In reality, a complex network of cause and effect connects the human, built and natural elements of the environment, within and between urban and surrounding rural areas, locally and globally. Changes to one part of this system may affect others in expected or unexpected ways. The dual climate and biodiversity emergencies mean that the links between people and their environment have become even harder to ignore.
All systems experience trade-offs between costs and benefits associated with their different parts. People in urban areas value the proximity of social, cultural and leisure provision such as theatres, exercise facilities and community centres, as well as natural assets such as urban wildlife, trees and green and blue spaces. However, the higher densities of population in urban environments create challenges in managing larger fluxes and volumes of pollution and waste. Understanding of the human health effects of poor air quality and the importance of access to green and blue spaces is increasing. The coronavirus (COVID-19) pandemic has further highlighted the depth and impact of inequalities in local environments.
People are increasingly living in urban areas, globally and in the UK. Around 80% of people in England now live in urban areas.[footnote 1] Between the 1960s and 1990s car ownership grew and many people moved out of city centres into suburbs.[footnote 2] Then, in the 1990s many of these inner city areas were redeveloped, often with high rise flats. Building has increased in both inner cities and suburbs as the country’s population continues to grow.[footnote 3] The centres of many towns and cities have doubled in population size over the past 20 years, while the UK population overall has increased by only 10%.[footnote 4]
This report looks at the state of the urban environment in England. It outlines some of the challenges created by urban areas for managing natural resources and waste, and the links between urban environments and wider environmental issues. The report looks at natural capital in cities, and the benefits of urban green and blue spaces for wildlife and people. It also highlights environmental inequalities in urban areas. Finally the report summarises some of the expected impacts of climate change and population growth on England’s urban environment.
England’s urban environment
Although only around 8% of land in England is covered by urban areas,[footnote 5] this figure makes England one of Europe’s more built-up countries.[footnote 6] The largest metropolitan areas include London, Birmingham, Manchester, Leeds-Bradford, Liverpool-Birkenhead and Tyneside (figure 1).[footnote 7]
This report draws on evidence from a wide range of sources, which define ‘urban’ in different ways. The report uses a broad definition, including cities, towns and wider conurbations when discussing general urban issues.
Figure 1. Map showing urban areas in the UK

Map shows concentrations around the urban centres of the UK.
Source: Urban boundary defined by Eftec/CEH (2017) for Defra and ONS, 2011 to 2012, UK. Graphic created by ONS Geography. Source: Office for National Statistics licensed under the Open Government Licence v3.0.
Urban natural capital
Substantial proportions of urban areas can contain natural assets such as parks, trees, fields, rivers and lakes. These are also often referred to as ‘green’ and ‘blue’ spaces. Other terms often used are ‘green infrastructure’ or ‘blue-green infrastructure’. These refer to the overall network of natural assets within and between urban and rural areas, which provide multiple benefits to communities. This network includes street trees, parks, river corridors, green walls and roofs, and sustainable drainage systems (SuDS), as well as larger green and blue spaces.[footnote 8] SuDS incorporate a range of approaches to managing surface water drainage and can include rain gardens, infiltration basins and wetlands.
The proportion of urban areas covered by green space can be assessed in a range of ways, and estimates can vary depending on how the urban boundary is defined, and which green spaces are included in the measurements. Nationally, 30% of the urban area in England is classified as ‘natural land cover’, which includes grassland, scrub, parks, allotments, public gardens and other public ‘green’ spaces. Golf courses and playing fields are also included.[footnote 9] The top 10 largest built up areas (BUA)[footnote 10] in England range from 46% natural land cover in West Yorkshire BUA, to 27% in Liverpool BUA.[footnote 9]
Domestic gardens have been estimated to make up 30% of the urban area in England. Not all of the land covered by domestic gardens will be green, as a proportion of this comprises paved areas and buildings. Domestic gardens can be valuable for wildlife, because of the concentration and variety of plants they can contain, as well as providing habitats such as ponds, and connecting larger patches of urban green space.[footnote 11] [footnote 12]
Research in 2018 revealed an average tree canopy cover of around 16% for 283 English towns and cities, but it is unclear whether the trend is increasing or decreasing because this data has not been collected before.[footnote 13] Canopy cover varies among places, from 3% in Fleetwood, Lancashire, to 45% in Farnham, Surrey.
Without careful planning, green spaces can be lost as the built environment grows. It is estimated that the proportion of England’s urban areas made up of green space declined from 63% in 2001 to 55% in 2018.[footnote 14]
Urban natural capital comprises all the natural assets of a town or city that provide benefits to people. The benefits urban natural capital provides include:
- removing air pollution and mitigating noise
- restorative effects on wellbeing through recreation in nature
- supporting biodiversity
- absorbing and storing carbon
- reducing urban heat island effects and increasing thermal comfort
- reducing flood risk by reducing runoff and providing space for water away from homes, businesses and infrastructure
A biologically diverse environment can provide a wide range of services to people, including pollinating food crops, forming and improving soil, capturing and cycling of nutrients, and capturing and breaking down pollutants. These services rely on healthy, biodiverse habitats and ecosystems, to ensure they are resilient to changing environmental and climatic conditions. Nature also has cultural and aesthetic value for many people. There is emerging evidence that urban green and blue spaces with higher levels of biodiversity have greater health and wellbeing benefits.[footnote 15] [footnote 16]
The value of urban natural capital is disproportionately large in relation to the area it covers. One of the reasons for the disproportionately high value of urban natural capital is that people live in in greater densities in cities and so the benefits are received by more people. Some benefits, such as air pollution removal can extend beyond the urban area itself. In 2017, removal of air pollution by urban vegetation in Great Britain is estimated to have saved around £163 million in health care costs through avoided deaths, reduced life years lost and fewer hospital admissions.[footnote 9] Over 70% of the avoided health impacts are due to removal of fine particulate matter, primarily by urban trees and woodland. Urban trees and woodland make up only 7.5% of all woodland area in Great Britain. The overall amounts of pollutants removed from the air are small in comparison to urban emissions and concentrations, and so vegetation, including trees, are not a complete solution to air quality issues.[footnote 17]
Impacts of the urban environment - local to global
Cities are home to the majority of people, and are centres of economic activity, innovation and culture. Globally, cities occupy around 2% to 3% of the total land area, and are home to around 54% of people yet consume 70% to 75% of global resources.[footnote 18] This concentration of population and activity causes polluted air, land and water, and damaged and fragmented ecosystems. Past industrial activities in some places have left behind contaminated soils.
The wider environment is also affected. Water is abstracted, sometimes affecting ecosystems far upstream. Polluted water from cities travels through catchments and out into the ocean. Carbon emissions from cities and the production of goods consumed in them alter the global climate. Biodiversity and ecosystems around the world are destroyed or degraded to clear land for food production and to exploit their natural resources. This level of global exploitation of natural resources is putting the stability of many of the planet’s systems at risk.[footnote 19] This, in turn, threatens the essential ecosystem services provided to people. There are many opportunities to make changes in urban areas to provide greater resource and energy efficiency, cleaner air, land and water, and better places for people and wildlife, within the areas themselves, and globally.
Land use and biodiversity
Urban areas draw heavily on food and resources from outside their immediate area. Globally, population growth, coupled with urbanisation has massively reduced the area of wild and semi-natural land, mainly as a result of conversion to agriculture.[footnote 20] The consumption of resources such as minerals for construction, and water, also degrade and pollute ecosystems. These activities result in biodiversity loss directly and through habitat fragmentation. Although these impacts are caused by human activity and population growth as a whole, much economic activity and population growth, and therefore consumption, globally is in urban areas. Coastal habitats are being lost where urbanisation combines with rising sea levels to create ‘coastal squeeze’.
Within urban areas, habitats are fragmented and often degraded. The noise and light pollution that come with urban life can negatively affect wildlife such as birds and bats.[footnote 21] [footnote 22] Polluted water adversely affects the plants and wildlife in urban rivers and lakes.
The global extinction of species is now at a crisis point and threatens the ecosystem services that support human life in both urban and rural areas. Tipping points, where an ecosystem can no longer recover from damage, are close to being reached for some habitats such as coral reefs. This level of exploitation is endangering the prosperity of current and future generations of people.[footnote 23]
Urbanisation is a significant pressure on biodiversity in the UK.[footnote 24] Thousands of hectares of previously undeveloped land, including habitats such as farmland, woodland and wetland, are built on every year. In England, of the 28,294 hectares of land developed in 2017 to 2018, 12,748 ha (45%) was previously developed land, and 15,546ha (55%) was previously undeveloped.[footnote 25] Some habitat restoration and creation also take place.
Urban areas, while generally lower in biodiversity than rural areas, can contain a range of wildlife, plants and habitats. Developments designed with space for nature can even increase species diversity and abundance, for example, where land is converted from intensive farmland.[footnote 24] Some species are considered ‘urban specialists’. For example, swifts, which nest in cavities in the roofs of older buildings. Urban specialist birds are a good biodiversity indicator for urban areas, because good quality, long-term data is available, and much is known about their ecology and some of the pressures affecting them. Urban specialist birds have declined in abundance in the UK since 1994 (figure 2).[footnote 9] Factors contributing to some of these species declines include building demolition, renovation and roof repair.
Figure 2. Trends in UK urban specialist bird species, 1994 to 2017. Data standardised to a 1994 baseline. Dashed lines represent missing data as a result of lack of survey activity during the 2001 foot and mouth outbreak.

Some wildlife species benefit from the concentration of food resources created by people in cities. Generalist mammals such as foxes, rats and badgers are thriving in UK cities. Badgers, rats and roe deer all increased in numbers in urban areas between 2004 and 2015 (figure 3).[footnote 9] Hedgehogs and grey squirrels decreased over the same time period.
Figure 3. Change in abundance (%) of selected mammal species in urban areas of Great Britain between 2004 and 2015
| Mammal | Change in abundance (%) |
|---|---|
| Hedgehog | -26 |
| Grey squirrel | -10 |
| Brown rat | 48 |
| Badger | 73 |
| Roe deer | 83 |
Insect pollinators provide valuable ecosystem services, and some species may benefit from the concentration and range of floral resources and nesting sites in urban gardens and allotments. Urban pollinators have not been extensively studied in the past, but some recent studies from the UK[footnote 26] and other countries in Europe[footnote 27] [footnote 28] found that urban sites can have higher diversity of bee species in comparison to surrounding agricultural areas. However, emerging evidence suggests that urbanisation increases the risk of mistiming between plants and their pollinators as heat and local climate effects move flowering times forward.[footnote 29]
Case study: Natural Capital in the Oxford to Cambridge (OxCam) Arc[footnote 30] [footnote 31]
The OxCam Arc is a cross government initiative that supports planning for the future of the counties of Oxfordshire, Buckinghamshire, Bedfordshire, Northamptonshire and Cambridgeshire. One million new homes are planned alongside new and expanded transport links. This initiative aims to ensure co-ordinated provision of improved connectivity, productivity and place making, whilst ensuring pioneering environmental standards and enhancements are achieved, in line with the government’s 25 Year Environment Plan.
The Environment Agency on behalf of, and with, the wider Defra Group has worked with local partners to create the first government endorsed Local Natural Capital Plan (LNCP). This provides a strategic evidence base that outlines the natural capital present, the ecosystem services that flow from this, and the economic benefits provided. Alongside this, reports have been produced that outline the environmental opportunities, as well as the risks and pressures faced by the Arc’s natural capital. The LNCP will help local partners to make better decisions that support goals to protect and enhance the environment of the Arc.
There are also other initiatives to support natural capital within the Arc. There is a project piloting and championing best practice in management of the John Clare countryside, which is a stronghold of butterflies and orchid-rich grasslands. The Nene Valley plan includes better management of habitats and wildlife in an area that already has Special Protection Status for its overwintering bird populations.
Urban water environment
Historically in England, and globally, many towns and cities developed around ports and waterways, which were then the major trade and transport hubs and routes. The role of urban rivers expanded during the Industrial Revolution, when they provided power and water supplies, and acted as convenient waste-disposal routes. Some urban rivers, such as the Thames in London, deteriorated so much as a result, that by the 1970s they were considered to be biologically dead.
There have been great improvements in urban river quality since the 1970s, but progress has not continued in recent years, and some challenges remain. Pollution from urban areas, including hydrocarbons, metals, litter, nutrients and pathogens, is still impacting on water quality and aquatic plants and animals, both in cities and in areas downstream. Plastics, including microplastic particles, are an emerging pollutant of concern. It is thought that around 68,000 tonnes of microplastics are generated from tyre wear in the UK every year of which 7,000 to 19,000 tonnes enter surface waters. A further 1,400 to 3,700 tonnes originate from paint on buildings and road markings.[footnote 32] Other emerging pollutants of concern include pharmaceuticals such as antibiotics, and other chemicals such as pet flea treatments. With increased awareness and interest in ‘wild swimming’ in inland waters, ensuring these are of sufficient quality for bathing is a growing challenge.
In 2020, about 18% of water bodies in England were identified as being damaged by pollution from towns, cities and transport.[footnote 33] This figure does not include pollution from waste water treatment, such as discharges from sewage works or storm overflows, much of which originates from urban sources. Pressure on the water environment in towns and cities is increasing.
The main sources of water pollution in urban areas are:
- rainwater run-off from roads, car parks, industrial areas, contaminated land, pavements and roofs
- misconnected pipes such as toilets and household appliances discharging to surface water drains
- inappropriate disposal of domestic materials such as oils, fats, sanitary products and wet wipes into the sewage system causing overflow discharges and sewer failures
- discharges of sewage from storm overflows during heavy rainfall events
- discharges from sewage treatment works and industrial installations into urban rivers, estuaries and coastal waters
- direct discharges and accidental spillages into surface water drains by commercial operations
Urban areas are also affected by pollution from activities taking place upstream, such as agriculture.
Many urban water bodies are affected by physical modifications such as culverting, embankments and channel straightening. These modifications mean that it is very difficult to restore some rivers back to their natural structure, restore natural processes and recreate the services and functions they could provide. Some of the impacts of physical modification include:[footnote 34]
- loss of and damage to freshwater habitats for wildlife and flood water retention
- loss of social functions such as accessible riverside areas for leisure activities
- changes in spatial functions such as providing a greener and more diverse urban landscape
Case study: Restoring the River Medlock
All of a sudden a kingfisher was fishing there, and you could see little shoals of fish … and … these 3 dragonflies … all dancing over the river
Quote from local visitor[footnote 35]
Legislation requires that the water environment is improved and protected wherever possible. River restoration is the re-establishment of natural physical processes, features and physical habitats of a river system. Thousands of river restoration projects have been carried out across the UK.[footnote 36]
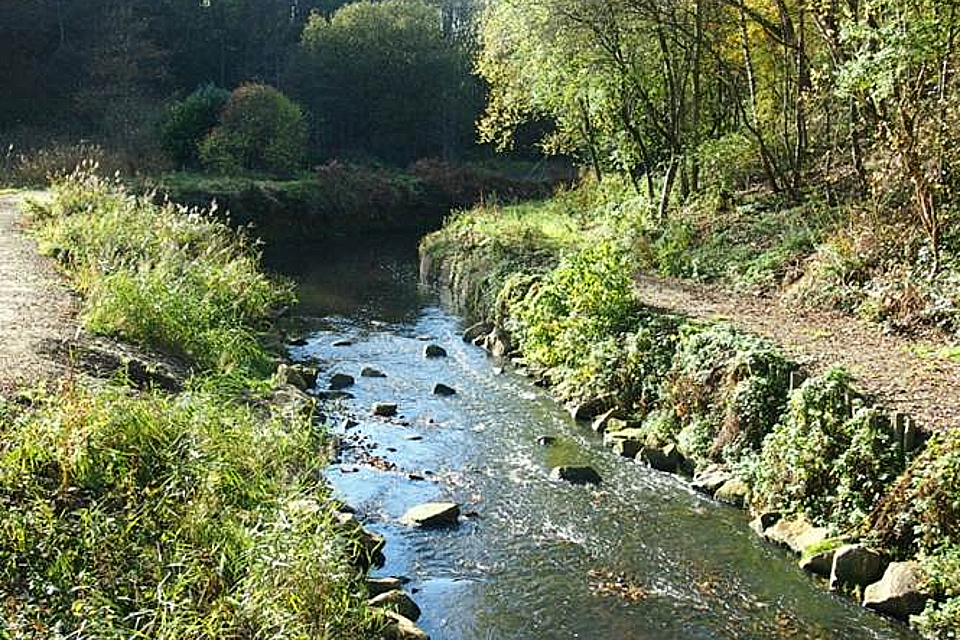
Many of the rivers in Greater Manchester, including the Medlock, are affected by diffuse urban pollution and physical modification because they are urbanised and have an industrial heritage. The Environment Agency led a project to restore a section of the Medlock, known locally as the Red River because bricks had been used to line the channel. The restoration aimed to improve water flow, provide habitats for wildlife and increase access for people. The red bricks were removed, channels widened and footpaths added. The restoration benefited wildlife populations and increased the river’s biodiversity contributing to positive effects on users.[footnote 35]
Photo: Section of the river Medlock before restoration[footnote 35]
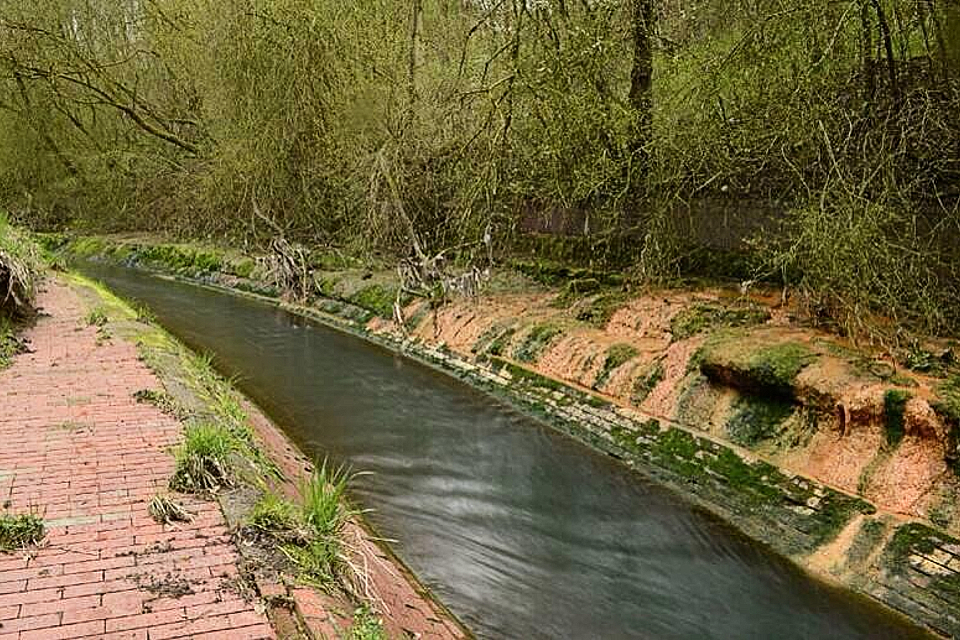
Photo: Section of the river Medlock after restoration[footnote 35]
Case study: Natural Course in the north west[footnote 37]
There are significant water quality issues in the north west. The area has one third of the poorest quality rivers in England and Wales, with 78% of rivers not reaching a recognised good standard.
Natural Course is a programme that aims to better understand and overcome some of the biggest barriers to improving the north west water environment. It is a collaboration made up of the Environment Agency, Natural England, Greater Manchester Combined Authority, the Rivers Trust and United Utilities. This unique mix of organisations has driven innovation and improvements by aligning investment to carry out bigger, multi-benefit projects. Projects have resulted in continued innovation in areas such as local governance of the water environment, embedding a natural capital approach, and the financing of natural flood management and SuDS. This collaborative way of working has influenced £41 million worth of activities that benefit the environment, from an investment of £12.5 million.
One project based in Manchester developed a new approach to providing and financing SuDS to improve climate resilience and water quality. It proved that by aggregating SuDS-type projects at a number of locations, investment opportunities can be developed at a scale that provide a worthwhile return to investors as well as water management benefits at a catchment scale.
Urban air quality
Technology, environmental policy and regulation have all improved air quality hugely since the mid-20th century.[footnote 38] However, air pollution remains the single biggest environmental threat to health in the UK, shortening tens of thousands of lives each year.[footnote 39] Towns and cities have greater concentrations of pollution sources such as road transport. Household wood burning also contributes significantly to poor urban air quality. Urban air pollution can also affect rural areas downwind. The main pollutants of concern to human health in urban areas are nitrogen oxides (NOx), including NO2, and small particulate matter (PM10 and PM2.5).
Some parts of towns and cities are exposed to levels of pollution that breach legal limits. One or more locations in 25 of England’s 31 air quality reporting zones breached the EU annual mean NO2 limit values in 2019.[footnote 40] Annual average PM2.5 levels in parts of London, and some cities in the Midlands and South are above the World Health Organisation (WHO) guideline limit for PM2.5. In London 95% of people live in areas that exceed the WHO guideline by at least 50%.[footnote 41] Exceeding the WHO exposure threshold leaves people at risk of a range of health effects throughout their lives, from mild and short-term to severe and long-term.[footnote 42]
Annual mean concentrations of NO2 and particulates in urban areas have declined overall since the 1990s (figures 4, 5). Particulate levels have stabilised in recent years (figure 5). The downward trends can be attributed to improved vehicle emissions standards as well as the phasing out of coal power stations. Lower average levels of urban background and roadside NO2 in 2020 than 2019 are likely to have been linked to reductions in traffic volumes during the COVID-19 pandemic lockdown periods.[footnote 43] PM2.5 levels were also lower overall in 2020 than in 2019, but the causes are less clear because of the influence of transboundary pollution and weather patterns on particulate levels.[footnote 44] A recent preliminary analysis suggests that air pollution in some large towns and cities in the UK fell over the course of the first national lockdown, but then rose to meet or exceed pre-pandemic levels in 80% of places studied. This is likely to be linked to increases in traffic as a result of reduced public transport use in favour of cars.[footnote 45]
Figure 4. England annual mean concentrations of NO2, 1990 to 2020. Roadside data from 1997. Dashed lines represent 95% confidence intervals. Data source: Defra

Figure 5. England annual mean concentrations of PM10, 1993 to 2020. Roadside data from 1997. Dashed lines represent 95% confidence intervals. Data source: Defra

Resource use and waste
The concentration of people and economic activity in urban areas means that they depend on large amounts of resources and supply chains reaching far beyond their boundaries. The density of populations in urban areas also creates large volumes and flows of waste materials, presenting unique challenges for waste management systems.
Food consumption can be one of the largest components of a city’s environmental footprint.[footnote 46] Globally, around 21% to 37% of greenhouse gas emissions are associated with the food system, from agriculture and land use to final retail and consumption.[footnote 47] Most of the food consumed in towns and cities is produced elsewhere, often overseas, creating damage that is disconnected from where it is eaten. The sustainability and security of food supplies is of concern as a result of finite and diminishing global soil resources and the spatial disconnect between cities and the places where their food is produced.[footnote 48]
Urban areas use large volumes of water as a result of their higher population densities. Water is abstracted from rivers, lakes, reservoirs, estuaries and groundwater. Households and energy generation are the main users. Current levels of abstraction in England are unsustainable in about 27% of groundwater bodies. Up to 15% of surface waters are affected by over abstraction.[footnote 49] This leaves little room for possible increases in demand, and can reduce water levels and damage wildlife.[footnote 50] There are few parts of England where additional water is available all the time, after taking existing licences and environmental needs into account.
England generated 187 million tonnes of waste in 2016, an increase of 2.8% from 2014.[footnote 51] Most waste generated comes from sources other than households. Construction, demolition and excavation generates around 64% of waste, with commercial and industrial generating around 17%. Around 92% of non-hazardous construction waste was recycled in 2016: this rate has stayed the same for several years. Households generate around 12% of total waste. Urban areas tend to have lower household recycling rates than rural areas.[footnote 52] They can be particularly low in deprived areas and places with high-density housing. Factors influencing this pattern include limited storage space, transient populations in inner-city areas and a lack of householder engagement and understanding.
Waste generated in UK cities is often transported and treated elsewhere. Plastic waste is exported overseas in large volumes for recycling. However this often in practice leads to pollution that affects people and wildlife in other countries. Around 0.7 million tonnes was exported from the UK in the 12 months up to October 2018.[footnote 53] Some of the large importers such as China stopped accepting plastic waste at the beginning of 2018. This has meant more plastic waste now needs to be managed in the UK, or is diverted in the interim to countries unlikely to have adequate capacity, resulting in pollution risks.
The denser populations and infrastructure of urban areas provide opportunities for optimising the collection and treatment of waste. In 2019, waste recovery or reuse at permitted sites improved to a record 74%.[footnote 54]
In 2019, just over one third of all serious pollution incidents in England were caused by waste management activities.[footnote 54] Of these, just over half were caused by illegal waste activities, and just under half by legal waste management activities such as landfill, biowaste and incineration.
Energy consumption and greenhouse gas emissions
Cities consume large amounts of energy to power domestic, commercial and industrial activity. Energy use is still strongly linked to greenhouse gas (GHG) emissions, with the majority of energy used in the UK generated by fossil fuels.[footnote 55] Globally, urban areas account for around 76% of CO2 emissions from global final energy use.[footnote 56] The total GHG emissions produced by a city, or any specific area, include:
- extended territorial emissions - those produced directly through activities such as transport and industry within the area itself, as well as those associated with producing the electricity consumed within the area boundary
- imported emissions - those embedded in the resource, energy and water use required to produce goods imported to and consumed within the area boundary
In more developed countries, including the UK, there is generally lower energy use per person in cities than their national averages.[footnote 56] Greenhouse gas emissions per person can also be lower in urban areas. London has the lowest per capita net extended territorial emissions of any local authority area in the country.[footnote 57] This is partly a result of its urban transport system and the lower levels of industrial activity than in other parts of the country. Domestic emissions per person are also lower in London than elsewhere in the country. Different official national measures of emissions vary in some details of what is included and excluded.[footnote 58]
Imported emissions are harder to assess with certainty, because they rely on many types of national accounts and trade data.[footnote 59] One study calculated emissions for 434 settlements across the UK.[footnote 60] The study found that urban areas had lower extended territorial emissions than rural areas. There was no difference in total emissions between the 2 settlement types. Total emissions were instead mainly determined by socio-economic and lifestyle factors such as income and car ownership, both of which produced higher emissions.
The UK’s cities reduced their territorial carbon emissions by 29% between 2005 and 2012.[footnote 61] This is a greater reduction than the national average of 27%. The reductions are mainly from commercial and industrial activity. These rates of reduction will have to continue and extend to other sectors such as transport and buildings in order to meet net zero targets.[footnote 62] Total carbon emissions, including imported emissions, increased in the UK overall between 1990 and 2007, but have fallen by around 21% over the past decade.[footnote 63]
Climate change, urban heat islands and flooding
England’s climate is changing and will continue to change as a result of GHG emissions. The Met Office’s Central England Temperature series shows that the 21st century has so far been warmer than the previous 3 centuries.[footnote 64] The summer of 2018 was the joint hottest ever recorded in the UK since 1910.[footnote 65] It has been estimated that climate change has increased the likelihood of record breaking warm years in central England by at least 13 times.[footnote 66] Over the past 50 years, more winter rainfall has fallen in heavy events.[footnote 67]
Hot, dry summers, heatwaves and floods are all expected to become more frequent in future years.[footnote 68] Sea levels are rising around the UK and this is expected to continue into the future.[footnote 69] Coastal flood risk and erosion from rising sea levels is expected to increase over coming decades.[footnote 69]
Extreme temperatures and flooding can both have environmental and human health effects, and can damage buildings and infrastructure. Urban areas create temperature and weather effects that can exacerbate the impacts of climate change on people living in them. For example, cities experience elevated temperatures in comparison to less built-up places because of the concentration of heat absorbing surfaces, and reduced air flow. This is known as the ‘urban heat island’ effect.
Urban heat islands exacerbate the human health effects of high temperatures, which can cause heat exhaustion and premature death, particularly in older people and those with underlying illnesses.[footnote 42] The ecological effects of urban heat islands have not been studied as extensively, but they are known to alter the timing and length of plant growing seasons.[footnote 70] One study[footnote 71] in Chicago found that air and lake water temperatures outside the city, were affected by the urban heat island up to 40km downwind of the city for the lake, and 70km for air temperature. This effect could have implications for the lake’s wildlife.
Urban heat island effects can also increase the amount of energy used for cooling buildings, with subsequent indirect air quality and climate impacts. This has increased rapidly over the past 10 years.[footnote 59]
Increases in the frequency and intensity of extreme weather events raise the risk of surface water flooding. This risk increases further when permeable green spaces are built on, or development takes place on flood plains. Surface water flooding is the largest cause of property flooding in the UK, with over 3 million properties at risk.[footnote 72]
Sewerage systems can become overloaded by heavy rainfall events. Storm overflows help prevent properties getting flooded with sewage, but can increase the risk of flooding from rivers and cause pollution. Culverting of rivers also increases flood risk as they become less permeable and often increase the speed of water flow. The majority of the 2.7 million properties currently at risk of flooding from rivers and the sea are in urban areas. Flooding can have serious economic, environmental and human health impacts. Increased operation of storm overflows also has negative impacts on the water quality of urban rivers.
Cities are known to affect local rainfall patterns, both through increased rainfall totals and increased rainfall intensities. This can increase the risk of flash flooding. A recent global review found increased rainfall in and around cities, particularly in the centre and up to 52 km downwind.[footnote 73] This is mainly caused by urban heat island effects: aerosols and physical characteristics of buildings may also play a part. One recent study in Paris found that the surrounding urban area experiences 29% higher daily rainfall downwind of the city, with a more pronounced effect in summer.[footnote 74]
Case study: Thames Tideway Tunnel[footnote 75]
London’s sewerage system is over 150 years old and was built for a much smaller population. This, combined with reductions in permeable surfaces when land is built on, and more heavy rainfall as a result of climate change, puts growing pressure on the system. In a typical year around 39 million tonnes of untreated sewage enters the tidal River Thames from storm overflows. This will be reduced by 95% once the Thames Tideway Tunnel is in operation in 2025. The 25km ‘super sewer’ tunnel will provide additional capacity for London to continue to grow and prosper.
The Environment Agency works with Tideway and its contractors to help ensure the extensive programme of approvals and consents required to carry out the project meets overall project deadlines. The reduction in frequency and volume of storm overflow discharges into the river will improve water quality, in turn improving habitats and reducing health risks to users.
Photo: A 700 tonne tunnel boring machine at the Thames Tideway Tunnel site

Photo: Tunnel construction at Blackfriars

Sustainability challenges and opportunities
With multiple social, economic and environmental challenges facing them, cities are increasingly in need of solutions that address these issues sustainably. This means taking a longer term view, ensuring that solutions provide for the needs of current and future generations. The UK has signed up to the United Nations Sustainable Development Goals,[footnote 76] which set out areas to be addressed in order to ensure a safe and prosperous world for generations to come. Goal 11 focuses on making cities and settlements ‘inclusive, safe, resilient and sustainable’.
Environmental pressures linked to urbanisation need to be addressed at a whole-system level, rather than focussing on individual issues, if sustainability goals are to be achieved and unintended consequences avoided. A systems approach can maximise the co-benefits of interventions such as nature-based solutions (NbS). These are actions to protect, sustainably manage and restore natural or modified ecosystems that address societal challenges such as climate change while providing additional human wellbeing and biodiversity benefits.[footnote 77] Urban green and blue spaces that are restored and improved, increase natural capital and create habitat for wildlife and plants, and can also have direct benefits for local businesses if they attract more customers to an area. Hard engineered infrastructure such as coastal flood defences and boundary walls that cannot be replaced with NbS can be ‘greened’ to increase the range of benefits provided for people and wildlife.[footnote 78]
Moving towards a more circular economy will play a major part in sustainably reducing the wider environmental impacts of urban areas, through maximising resource and energy efficiency, and lessening the need for waste management. A circular economy is a system “where the value of products, materials, and resources is maintained in the economy for as long as possible, and the generation of waste is minimised” (figure 6). It is considered essential to achieving a “sustainable, low carbon, resource efficient and competitive economy.”[footnote 79]
Figure 6. Linear and circular economy models. Adapted from a linear to a circular economy

A linear economy diagram shows raw materials going into production, then use, then non-recyclable waste. A circular economy shows how raw materials go into production, then use, then recycling, which flows back into raw materials and round again.
The government produced a resources and waste strategy in 2018, which sets long-term goals towards a more circular economy, including eliminating all avoidable waste and doubling resource productivity by 2050.[footnote 80] Reducing resource and material consumption is also an important part of lowering waste generation, in addition to re-use and recycling. Urban areas provide greater economic opportunities for re-using and recycling materials because of the high volumes and concentration of activities.[footnote 81] Circular approaches can be applied to water and food systems as well as material resources. Cities, as centres of economic activity, knowledge and innovation, have the resources to drive the transformations needed.
Case study: the Amsterdam Doughnut[footnote 82]
When a bird builds a nest in a tree, it takes care not to destroy the surrounding forest in the process
Janine Benyus
The Doughnut model for economics was created as a framework for human prosperity in the 21st century that allows human needs such as housing, food and equality to be met without damaging Earth’s ‘life-supporting systems’. These planetary boundaries include biodiversity loss, air pollution and freshwater abstraction. Where human needs are met without breaching the limits of the living planet, this is the ‘safe and just space for humanity’.[footnote 83] The model has been used to profile the city of Amsterdam. It shows that some of the needs of the people of Amsterdam are not being met, and that carbon emissions from the city are above 1990 levels. The Amsterdam model also includes the often highly exploitative labour of people in west Africa, because it is the largest importer of cocoa beans in the world. The Doughnut model is now being put into practice in public policy and in a range of community-based projects across the city, including sustainable business, circular food and clothing initiatives, and neighbourhood development planning.
Living in towns and cities
Urban environments affect every aspect of the lives of people living in towns and cities. Amenities and employment opportunities exist in greater concentrations, and social and cultural events can offer enrichment of daily life. Urban environments can have a restorative effect on wellbeing.[footnote 84] This can be connected to natural assets such as green and blue spaces, as well as cultural, recreational and architectural elements. A survey of 3,700 people in Bristol found that green spaces, parks and access to the wider countryside were important aspects of city life, alongside culture, community and diversity. (See figure 7.)
On the other hand, some elements of city life can cause additional stress to individuals and can be detrimental to society as a whole. Urban areas can increase risks of a range of health issues.[footnote 85] Most of these challenges relate to air quality, crowding, noise, lack of green spaces and physical inactivity. Overall, health outcomes in England are better in rural areas than in urban areas.[footnote 86] The structure and layout of the built environment also affects people’s access to health services, community centres, shops and green and blue spaces, all of which are important for health and wellbeing.[footnote 87]
Inequalities in access to green and blue spaces and a clean environment prevent many people from living happy, healthy lives in their towns and cities. A survey of 2,186 people in 2015 found that only 18% of adults living in urban areas agreed that it is easier to have a good quality of life in cities rather than elsewhere in the UK.[footnote 88]
Figure 7. Word cloud of the top 30 words people in Bristol used when describing their favourite things about the city[footnote 89]
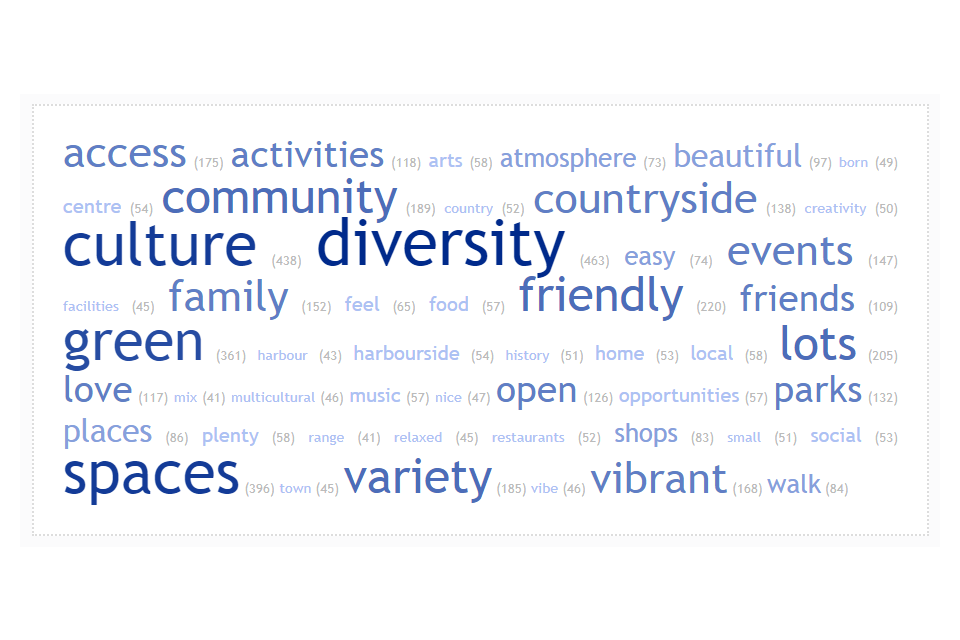
Prominent words include: diversity, culture, spaces, green, variety, vibrant, community, countryside, friendly, events, access and activities.
Connecting to nature in and around towns and cities
Green and blue spaces such as parks, lakes, beaches and riverside paths in towns and cities provide multiple benefits to society. These include:
- improved health and wellbeing[footnote 42] [footnote 90] through increased activity and nature connectedness
- sense of place and social cohesion
- economic benefits through both ecosystem services and encouraging investment
One study found that people living in urban coastal areas had better levels of self-reported overall health than those living in urban areas further inland.[footnote 91] Another study[footnote 92] found that adults living in urban areas 1km or less from the coast had better mental health than those in urban areas further inland. The analysis showed that this pattern only existed for the lowest income households, suggesting that living near the coast may mitigate health inequalities.
People’s relationship with, and the meanings they attach to, the places where they live can affect the way they feel, and therefore their health and wellbeing. This ‘sense of place’ also affects the way people interact with, value and use the environment and ecosystems around them and on which they rely. Only 61% of urban citizens feel they ‘belong’ in their immediate neighbourhood, compared with 72% of people living in rural areas.[footnote 93]
People living in urban areas visit the natural environment, within and outside urban boundaries, less often than those living in smaller towns and rural areas.[footnote 94] Access to good quality local green spaces can be a barrier in some places. Ease of access to the wider environment can be related to a range of factors, including owning or having access to a car. An independent review commissioned by the government found that many British people of all ethnicities saw the countryside as a ‘white environment’, creating a challenge to the review’s proposal to increase the diversity of visitors to national parks and other national landscapes.[footnote 95]
Case study: Barcelona superblocks[footnote 96]
The city of Barcelona has demonstrated the benefits of incorporating green infrastructure and traffic-free areas with accessible public transport links into urban design. Superblocks are pedestrian-first, mostly traffic-free zones that reduce emissions and noise from vehicles. They also allow users to enjoy the health and wellbeing benefits of green spaces and reduced temperatures by planting additional trees. In 2020, Barcelona had 6 superblocks.[footnote 97] The end goal is for Barcelona to have over 500 ‘inclusive for all’ superblocks, where every citizen has a square and a ‘green street’ within 200 metres of their home.
One superblock has been reported to have reduced traffic volumes by 58%. Noise was reduced, from above WHO exposure limits, to a safer level. According to a 2019 study, a full realisation of the city’s 503-block plan could prevent 667 premature deaths a year.[footnote 98]
Environmental inequalities in towns and cities
Some communities in towns and cities are exposed to higher levels of pollution. The same communities often have less access to safe local green and blue spaces. These environmental inequalities contribute to associated inequalities in health and wellbeing.
These places are often those with populations that suffer from multiple deprivation. Factors associated with deprivation, such as language barriers, ability to earn, old age, and health status, often affect people’s vulnerability to other pressures, including those caused by environmental inequalities.[footnote 99] The Chief Medical Officer for England recently highlighted the ‘triple jeopardy’ experienced by deprived communities, who face higher risks from social determinants of health, air pollution exposure and greater susceptibility to the impacts of pollution.[footnote 100] The UK has one of the highest levels of income inequality amongst wealthy countries. In 2020, it was at its highest level since 2008, and the income of the richest 20% of people was over 6 times higher than the poorest 20%.[footnote 101]
There is evidence that communities with higher percentages of residents from black, Asian and other minority ethnic backgrounds experience inequalities in access to green spaces, are exposed to poorer quality air and have higher social vulnerability to flooding.
The body of evidence highlighting these patterns of environmental inequality leads to questions of ‘environmental justice’. The environmental justice approach asks about fairness in relation to issues such as how the inequalities are produced, who is responsible, the social distribution of impacts and benefits, and how action can improve the situation.[footnote 102]
Inequalities in urban air quality
A growing body of evidence shows that people living in deprived urban areas are exposed to greater levels of air pollution than those living in more affluent areas. One study of cities across England found significantly higher concentrations of NO2 and PM10 in the most deprived neighbourhoods (figure 8).[footnote 103] Recent Environment Agency analysis has found similar results, with people who are exposed to the highest levels of NO2 and particulates found to be more likely to live in deprived areas of England.[footnote 104]
An analysis of data covering every household across England and Wales has shown that areas with higher numbers of poorer households are exposed to higher levels of traffic-related pollution.[footnote 105] The analysis also indicated that this inequality worsened between 2003 and 2011, when the study was carried out. The same study found that households’ private transport emissions were lowest in the poorest areas, and highest in the wealthiest areas, where there was higher vehicle ownership, more ownership of diesel vehicles, and people drove greater distances.
There is evidence that different ethnic groups are exposed to different levels of air pollution in towns and cities.[footnote 106] One study found that the highest air pollution levels within cities occurred in more ethnically diverse city neighbourhoods after other demographic factors such as deprivation level were accounted for.[footnote 103]
There is some evidence that exposure to air pollution in cities is also split unequally among age groups, with babies, young children and young adults living in more polluted areas.[footnote 107] [footnote 105]
Figure 8. PM10 concentrations in the most and least deprived areas of selected English cities, 2001. Source: Fecht, D and others (2015)[footnote 108]

Inequalities in proximity to past and present industrial activity
There have been relatively few studies in England examining inequalities in proximity to industrial sites. One study found that some types of regulated industrial site are disproportionately located and clustered in areas of higher deprivation.[footnote 108] The study also found that sites in deprived areas produced more frequent emissions and more ‘offensive’ pollutants likely to have an impact on day-to-day quality of life. Exploratory analysis of data from north-west England by the Environment Agency found that more deprived populations were more likely to be living closer to waste sites.[footnote 109] This work also suggested that these populations were more likely to be living close to waste sites that had not complied with conditions of their permit licence. The pattern did not apply to landfill sites, probably because they are less likely to be in urban locations. There is little evidence at present on the causes of these patterns of inequality.[footnote 106]
The impacts on health of living in close proximity to waste or other industrial sites are not well understood. Emission limits are set to protect human health, and industrial sites are monitored and regulated to minimise pollution risk to the environment and health. There is no strong evidence that local people’s health is affected by industrial sites in the UK.
There are some known effects. People living near some regulated sites can experience issues with noise, litter, flies, dust, increased vehicle traffic and odours. These effects can lower the quality of life in affected neighbourhoods.[footnote 42] Other impacts can include decreased property values and reduced ability to mobilise against future siting decisions. There can also be positive effects on communities, for example, job creation or where energy from waste (EfW) plants provide heating to local housing.
Brownfield sites, deindustrialised land that is no longer used, can be contaminated by substances such as heavy metals, hydrocarbons, gases, and asbestos. These substances, if left untreated, may have a negative effect on public health[footnote 8] and the environment. In 2005, it was estimated that 2% of England was likely to have been affected by industrial activities that could cause contamination.[footnote 110] Contaminated land may have to be remediated before it can be used for urban development.[footnote 111] Research from Scotland and the US suggests that brownfield sites are disproportionately located in deprived areas[footnote 112] however this relationship has not been tested for sites in England. The north of England has higher amounts and concentrations of brownfield land compared to the south, with the exception of London which has the highest concentration of brownfield land.[footnote 112] People can sometimes end up living closer to waste infrastructure when brownfield sites are redeveloped, leading to increased potential for exposure to effects such as noise and odour pollution.
Inequalities in urban water quality
Environment Agency analysis carried out in 2008 suggested that people in deprived and heavily populated urban areas were more likely to live within 600m of a river with poor chemical or biological quality.[footnote 113] These effects were concentrated in the north west, Yorkshire and Humberside, and London.
Since 2008, water quality measures have changed but deprivation patterns have not, and even though efforts have been made to improve water quality, the relationship of deprived populations living close to poor quality rivers is likely to exist. More research is needed into the nature and scale of any social impacts on people living near rivers of lower quality, as these are not measured as part of standard water quality monitoring.
Inequalities in exposure to noise pollution
Urban noise pollution can come from many human activities, including construction, shipping and aircraft, but road traffic is the main source. Noise pollution has been linked to a range of impacts on physical and mental health. Known effects include sleep disturbance, increased incidence of heart disease, and effects on children’s learning.[footnote 114]
Little is known about the social distribution of noise pollution. The 2020 Environmental noise in Europe report[footnote 114] concluded that there are inequalities in environmental noise exposure. However, results vary depending how noise and deprivation are measured and the spatial scale studied.[footnote 115] One study in the London area indicated that people with a high income were more likely to be exposed to aircraft noise, while those living in deprived areas were more likely to be exposed to rail noise.[footnote 116] The same study also found that black participants were significantly more likely to be exposed to rail noise than people of other ethnicities. Exposure to aircraft noise was significantly higher for white participants than those of Asian or ‘other’ ethnicities.
Inequalities in access to urban green spaces
Access to the natural environment is unevenly distributed across society. People in the most deprived areas of England tend to have significantly less accessible green space in their locality than those living in wealthier areas.[footnote 117] In the UK, 59% of households with incomes of £60,000 or more - roughly the top 10% by income - are within a 10-minute walk of a publicly accessible natural green space, compared with just 35% of those with incomes below £10,000.[footnote 1] The COVID-19 pandemic has exacerbated inequalities in accessing green spaces. People on lower incomes, with lower levels of education or who live in deprived areas visited natural spaces less often than usual, whereas other groups visited more often.[footnote 118]
Fewer than 20% of adults from black, Asian and minority ethnic backgrounds strongly agree that they have green spaces within easy walking distance compared with over 30% of white adults.[footnote 94] This figure is affected by many factors, including differences in ethnic diversity in urban and rural locations. However, these inequalities also exist within urban areas. One study found that city communities with 40% or more residents from black, Asian and minority ethnic backgrounds have access to 11 times fewer green spaces locally than those comprising mainly white residents.[footnote 121]
People from black, Asian and minority ethnic backgrounds are also less likely to have access to a private garden than people from white backgrounds (figure 9).[footnote 94] Of survey participants from black backgrounds, 44% did not have access to a garden or private outdoor space of any kind, compared with 24% of participants from Asian backgrounds, 11% from white British or Irish backgrounds, and 21% from white backgrounds other than British or Irish. Statistical analysis of this data has shown that these trends are significant even when other factors including geographical location, social grade and age are taken into consideration. The analysis found that people from black ethnic backgrounds are 2.4 times less likely to have garden access than those of white ethnicity.[footnote 119]
Figure 9. Access to a private or communal garden or private outdoor space (% survey participants) by ethnic background, 2018 to 2019

A review of 385 studies found evidence that the quality of parks and green spaces is lower in deprived areas.[footnote 120] This presents an additional barrier to access as people may avoid areas they perceive to be unloved or run-down. Perception of safety is the most important barrier to using local green spaces, as well as facilities such as toilets and cafes.[footnote 121] The study also highlighted evidence gaps for inequalities related to factors such as disability in accessing parks and green spaces. The NHS could save over £2 billion in treatment costs if everyone in England had equal access to good quality green spaces.[footnote 122]
Inequalities in flood risk and flood resilience
Deprived communities face higher flood risk exposure from all sources. Inequalities are particularly high in coastal communities and are higher in rural than urban areas.[footnote 123]
A range of social factors can affect the ability of households to prepare for, respond to and recover from flooding. For example, low income households are less likely to be able to afford to make their property resilient or to insure it against flood damage.[footnote 124] Around 8% of English neighbourhoods have extremely high flood-related social vulnerability. All of these are in urban areas, and 38% are within 2km of the coast.[footnote 124] A recent analysis of social vulnerability to flooding highlighted the disproportionate disadvantage experienced by ethnic minorities, particularly black ethnic groups.[footnote 125]
Inequalities in heat vulnerability
Urban populations in general are more at risk from hot weather as a result of the urban heat island effect. The elderly are often the most vulnerable group to heat-related illness and death.[footnote 126] Living accommodation and working environments can be detrimental, for example, living in top-floor flats or working in heated indoor spaces.[footnote 124] Inequalities in access to parks and green spaces make it harder to get away from higher temperatures. Advice to leave windows open through the night during heatwave events is less likely to be followed if people live alone or fear crime.
Case study: Beam Parklands natural capital account[footnote 127] [footnote 128] [footnote 129]
Beam Parklands is a multi-functional green space in the London Borough of Barking and Dagenham, one of the most deprived areas in the country. Redeveloped between 2009 and 2011, it is now a highly successful blue-green infrastructure investment. It includes flood protection, valued at £591,000 a year, and a multi-use open space that provides recreation and education opportunities, enhances local environmental amenity, and contributes to the conservation of important habitats and wildlife such as great crested newts and emperor dragonflies. The Environment Agency worked in partnership with other organisations to make additional improvements to the integrity and capacity of the flood storage washland area of the site, reducing the risk of flooding to over 570 homes and 90 businesses.
Photo: Work in progress at Beam Parklands

Photo: Completed work at one of the ponds at the Beam Parklands site

Natural capital accounts show that the benefits to a wide range of people were greater than the costs of maintaining the site. Regulatory services such as air quality and climate regulation were not included in the calculations. Many other benefits can currently be described but not valued in monetary terms, meaning that values calculated are underestimates of the true value. The benefits were mainly for the local community, while the costs were mainly borne by the Land Trust for maintaining the site. The estimated natural capital asset value for Beam Parklands is £43 million with a maintenance cost of approximately £1 million.
Using a natural capital accounts approach means that benefits can be recognised and included in corporate and strategic accounts, enabling organisations to make better informed decisions about the value of their natural assets.
Future urban growth and climate impacts
Urban growth and climate change are both exacerbating other existing pressures on the environment. Unexpected events can disrupt trends, making precise predictions of future urban growth difficult, however the increase in urban populations in the UK is generally expected to continue. Official projections produced in 2015 suggest population growth in Great Britain’s cities of around 18% by 2036, relative to 2011 figures, with the greatest increases in the south east. In London, population growth rates are expected to be particularly high, making up about 28% of total national growth.[footnote 130] There may, however, be significant migration away from urban centres towards the suburbs, fringes and more rural areas as more people work from home or reconsider their living situations in the wake of the COVID-19 pandemic. There are early signs, for example, that London’s population may decline in coming years, for the first time in decades.[footnote 131]
As populations grow, their need for energy and resources increases, more waste and pollution are produced, and the space left for nature is reduced. Circular economy approaches, such as those outlined in the government’s waste and resources strategy will be crucial in managing the impacts of this growth. Incorporating space for nature into development plans can go some way to reducing the biodiversity impacts. The government’s upcoming Environment Bill contains legislation to ensure that new developments, including housing, benefit biodiversity by creating and improving habitats and local green spaces.
The way that urban areas grow, not just where and how much they grow by, will be a defining factor in how the environment is affected. For example making the built areas of cities denser may reduce energy use for transport, but if they are not designed appropriately, this can increase flood risk by reducing permeable surface areas, and reduce green space for urban cooling.[footnote 132] The COVID-19 pandemic may affect future urban form, for example, if demand grows for less densely built homes such as those in suburban areas. This could increase carbon emissions related to energy use for heating and cooling buildings, and from transport. National planning policy sets out the expectation that the planning system should result in development that mitigates climate change, adapts to its impacts and improves biodiversity.
The changing climate will continue to exacerbate environmental pressures experienced in urban areas, including intensifying the pressures on water quality. Heavy rainfall events following periods of prolonged dry weather are a particular problem because pollutants accumulate and then wash off into water bodies. This type of weather pattern is likely to become more common as the planet warms further. Increases in heavy rainfall events combined with population growth could also increase the risk of sewer flooding and overflows of sewage into water bodies. The water companies are investing over £4 billion up to 2025 on wastewater treatment and systems which will help reduce some of the impacts of population growth and climate change on both urban and rural water quality.
Climate-related changes to weather patterns, and rising sea levels will increase flood risk across England.[footnote 133] Projected total flood damages will be higher in urban areas because of the numbers of people affected. Population growth projections, and the resultant need for new homes could double the number of properties in the flood plain over the next 50 years.[footnote 134] However, government planning policy steers new development away from areas at highest risk, and requires any properties built in flood risk areas to be made safe for their lifetime without increasing flood risk elsewhere. This should mean many of these new properties will be in areas with low to very low likelihood of flooding as a result of existing flood and coastal defences.[footnote 135]
Without action to ensure resilient supplies and an improved water environment, severe water supply deficits are projected for England, even under low population growth and modest climate change scenarios. With higher growth scenarios and greater climate change these deficits will be more extreme and will spread across the UK by the 2050s.[footnote 136] Significant increases in supply, such as new reservoirs, along with reductions in demand from household and businesses will be needed.[footnote 137] New developments can be designed to increase water efficiency and reduce run-off, through measures such as re-use and rainwater harvesting. Incorporating SuDS into urban design will help enable water to replenish groundwater stocks.
Mitigating climate change by reducing emissions is vital. Major changes required within the UK to meet commitments made under the Paris climate agreement will be:[footnote 138]
- reducing demand for carbon-intensive activities
- take-up of low carbon transport and technologies, such as electric boilers
- expansion of renewable energy generation
- offsetting of the remaining carbon emissions by creating and restoring habitats such as woodlands and peatlands
Many city authorities have started to implement mitigation action plans. Actions that can reduce the climate impact of urban areas include:
- increasing the energy and water efficiency of homes and other buildings
- reducing private transport use
- increasing resource efficiency, reducing consumption, and moving towards a more circular economy
- creating more blue-green infrastructure, including planting urban trees
While blue-green infrastructure makes a relatively small contribution to mitigating climate change, urban vegetation also has adaptation benefits. Adaptation to the impacts of climate change is necessary because the Earth is already locked into a certain degree of warming. Urban communities, planners and decision-makers can take actions to be more resilient to the impacts of inevitable climate change. Some adaptation is already taking place, but more is needed.[footnote 139] Adaptation and mitigation must be addressed together to maximise co-benefits and to avoid trade-offs, as well as avoiding actions that constrain the effectiveness of future adaptation or mitigation.[footnote 132] Nature-based solutions can play a part in addressing these challenges. For example, using natural flood management alongside traditional flood defences can have additional adaptation benefits such as reducing urban heat island effects and connecting areas of wildlife habitat, allowing species to shift their ranges as conditions change.
Case study: Kidbrooke Village, Greenwich[footnote 140]
The Environment Agency is a statutory consultee in the planning system and responds to thousands of consultations every year. Through our evidence, technical skills and partnership working, we co-shape investment and spatial plans so places tackle climate change, create healthier environments and become more resilient to flood risk. We work at a range of scales, supporting strategic engagement, for example on local plans, alongside planning advice to individual consultations. Our responses focus on ensuring environmental and flood risk aspects of government planning and development policy are met, and advising on opportunities to achieve environmental outcomes.
At the Kidbrooke Village site, the Environment Agency is working with Berkeley Group to ensure that resilience to climate change is designed into this 109 hectare scheme from the start. The scheme is split into 6 phases over 20 years to provide 5,000 new homes, shops, cafés, health care facilities, schools, green spaces and a new railway station. Resilience measures include 35 hectares of high-quality green spaces and SuDS including ponds and wetlands. Central to the Kidbrooke Village master plan is the new Cator Park which will link with Sutcliffe Park to provide a ‘green spine’ through the development.
We carry out strategic and partnership work advising on policy and associated guidance and good practice, to help ensure environmental outcomes like this are achieved widely.
Conclusion
As people around the world face the dual climate and biodiversity emergencies, putting sustainability at the forefront of how urban areas grow and adapt, presents huge opportunities for the health and wellbeing of billions of people, now and in future generations.
Environmental inequalities reduce the potential of individuals to enjoy and improve their lives, and subsequently the potential of society to innovate and address the most pressing issues.
The COVID-19 pandemic has highlighted these inequalities and emphasised the importance of good air quality and access to urban green and blue spaces for physical and mental wellbeing. It has also shown us the importance of preparing, for expected and unexpected events.
City leaders, planners, communities and citizens can lead the way to an inclusive, resilient future, within the limits of the planet’s resources.
References
-
RSPB. (2020). Recovering together [Accessed 9 April 2021] ↩ ↩2
-
Government Office for Science. (2014). Urban form and infrastructure: a morphological review. Foresight report. [Accessed 9 April 2021]: ↩
-
As also used in Government Office for Science. (2014). Urban form and infrastructure: a morphological review. Foresight report. [Accessed 9 April 2021] ↩
-
Centre for cities. (2018). The UK’s rapid return to city centre living. Data analysis conducted for the BBC. [Accessed 9 April 2021] ↩
-
Rae, A. (2017). A land cover atlas of the United Kingdom. Copyright rests with the European Commission; Acknowledgement: Produced by the University of Leicester, The Centre for Landscape and Climate Research and Specto Natura and supported by Defra and the European Environment Agency under Grant Agreement 3541/B2012/R0-GIO/EEA.55055 with funding by the European Union. [Accessed 9 April 2021] ↩
-
EEA. (2016). Urban sprawl in Europe. Report number 11 [Accessed 9 April 2021] ↩
-
ESPON project 1.4.3 Study on Urban Functions. European Spatial Planning Observation Network. British urban pattern: population data. March 2007. p. 119. [Accessed 9 April 2021] ↩
-
Parliamentary Office of Science and Technology. (2017). Urban green infrastructure and ecosystem services. PostBrief No. 26. [Accessed 9 April 2021] ↩ ↩2
-
ONS. (2018). UK natural capital: ecosystem accounts for urban areas [Accessed 9 April 2021] ↩ ↩2 ↩3 ↩4 ↩5
-
ONS. (2011). Guidance and methodology: built up area subdivision. Archived web content. [Accessed 9 April 2021] ↩
-
Gaston, K. J. and others. (2005). Urban domestic gardens (IV): the extent of the resource and its associated features. Biodiversity and Conservation 14:3327-3349. [Accessed 9 April 2021] ↩
-
Cameron, R. W. F. and others. (2012). The domestic garden – its contribution to urban green infrastructure. Urban Forestry and Urban Greening, 11: 129-137. [Accessed 9 April 2021] ↩
-
Forest Research. (online). Tree canopy cover leaflet. [Accessed 9 April 2021] ↩
-
Committee on Climate Change. (2019). UK housing: fit for the future? [Accessed 9 April 2021] ↩
-
Wood, E. and others. (2018). Not all green space is created equal: biodiversity predicts psychological restorative benefits from urban green space. Frontiers in Psychology 27 November 2018. [Accessed 9 April 2021] ↩
-
Cameron, R. W. F. and others. (2020). Where the wild things are! Do urban green spaces with greater avian biodiversity promote more positive emotions in humans? Urban Ecosystems 23:301-317. [Accessed 9 April 2021] ↩
-
AQEG. (2018). Impacts of vegetation on urban air pollution. Air Quality Expert Group report prepared for: Department for Environment, Food and Rural Affairs; Scottish Government; Welsh Government; and Department of the Environment in Northern Ireland. [Accessed 9 April 2021] ↩
-
UNEP. (2017). Resilience and resource efficiency in cities. [Accessed 9 April 2021] ↩
-
Steffen, W. and others. (2015). Planetary boundaries: guiding human development on a changing planet. Science 347, 1259855, [Accessed 9 April 2021]: ↩
-
Revi, A., and others. (2014). Chapter 8, Urban areas. In: Climate Change 2014: Impacts, Adaptation, and Vulnerability. Part A: Global and Sectoral Aspects. Contribution of Working Group II to the Fifth Assessment Report of the Intergovernmental Panel on Climate Change [Field, C.B. and others (eds.)]. Cambridge University Press, Cambridge, United Kingdom and New York, NY, USA. [Accessed 9 April 2021] ↩
-
Shannon, G. and others. (2015). A synthesis of two decades of research documenting the effects of noise on wildlife. Biological Reviews 91:982-1005. [Accessed 9 April 2021] ↩
-
Sanders, D. and others. (2020). A meta-analysis of biological impacts of artificial light at night. Nature Ecology and Evolution 5:74-81 [https://doi.org/10.1038/s41559-020-01322-x] [Accessed 9 April 2021] ↩
-
Dasgupta, P. (2021). The economics of biodiversity: the Dasgupta review. London: HM Treasury. [Accessed 9 April 2021] ↩
-
RSPB. (2019). State of Nature Report. [Accessed 9 April 2021] ↩ ↩2
-
MHCLG live tables on land use change. [Accessed 9 April 2021] ↩
-
Baldock, K. C. R. and others. (2015). Where is the UK’s pollinator biodiversity? The importance of urban areas for flower-visiting insects. Proc. R. Soc. B Biol. Sci. 282: 20142849. [Accessed 9 April 2021] ↩
-
Theodorou, P. and others. (2017). The structure of flower visitor networks in relation to pollination across an agricultural to urban gradient. Functional Ecology 31, 838–847. [Accessed 9 April 2021] ↩
-
Theodorou, P.E. and others. (2020). Urban areas as hotspots for bees and pollination but not a panacea for all insects. Nature Communications. [Accessed 9 April 2021] ↩
-
Fisogni, A. and others. (2020). Urbanization drives an early spring for plants but not for pollinators. Oikos 129:1681-1691. [Accessed 9 April 2021] ↩
-
OxCam Local Natural Capital Plan. [online]. [Accessed 9 April 2021] ↩
-
Natural Cambridgeshire. [online]. [Accessed 9 April 2021] ↩
-
Environment Agency. (2019). Pollution from towns, cities and transport: 2021 river basin management plans. Available in links document from the Challenges and choices consultation summary report. [Accessed 22 April 2021] ↩
-
Environment Agency 2020 analysis. Raw data are available on the catchment data explorer. ↩
-
EEA. (2016). Rivers and lakes in European cities: past and future challenges. Report number 26/2016. ↩
-
DeBell, S. and others. (2020). Evaluating dual ecological and well-being benefits from an urban restoration project. [Accessed 9 April 2021] ↩ ↩2 ↩3 ↩4
-
The River Restoration Centre. [online]. River restoration in urban areas. [Accessed 9 April 2021]: ↩
-
Natural Course. [online]. [Accessed 9 April 2021] ↩
-
Environment Agency. (2018). The state of the environment: air quality. [Accessed 9 April 2021] ↩
-
Royal College of Physicians. (2016). Every breath we take: the lifelong impact of air pollution. London: RCP. [Accessed 9 April 2021] ↩
-
Defra. (2020). Air pollution in the UK. London: Department for Environment, Food and Rural Affairs. [Accessed 9 April 2021] ↩
-
London Sustainable Development Committee. (2017). Quality of life indicators 2017. [Accessed 9 April 2021] ↩
-
Environment Agency. (2020). The state of the environment: health, people and the environment. [Accessed 9 April 2021] ↩ ↩2 ↩3 ↩4
-
Defra. (2021). National statistics: concentrations of nitrogen dioxide. [Accessed 26 May 2021] ↩
-
Defra. (2021). National statistics: concentrations of particulate matter (PM10 and PM2.5). [Accessed 26 May 2021] ↩
-
Centre for cities. (2020). Briefing: How have the Covid pandemic and lockdown affected air quality in cities? [Accessed 9 April 2021] ↩
-
Mcdonald, R. I. and others. (2020). Research gaps in knowledge of the impact of urban growth on biodiversity. Nature Sustainability 3:16-24. [Accessed 9 April 2021] ↩
-
Mbow, C. and others. (2019). Chapter 5. Food security. In Climate Change and Land: An IPCC special report on climate change, desertification, land degradation, sustainable land management, food security, and greenhouse gas fluxes in terrestrial ecosystems. Intergovernmental Panel on Climate Change. [Accessed 9 April 2021] ↩
-
POSTnote. (2020). 626. A resilient UK food system. [Accessed 9 April 2021] ↩
-
Environment Agency analysis. Data available from Catchment Data Explorer. [Accessed 9 April 2021] ↩
-
Environment Agency. (2017). The state of the environment: water resources. [Accessed 9 April 2021] ↩
-
Defra. (2020). UK statistics on waste – March 2020 update. London: Department for Environment, Food and Rural Affairs. [Accessed 9 April 2021] ↩
-
EFRA. (2014). Waste management in England. Fourth report of session 2014-15. London: House of Commons Environment, Food and Rural Affairs Committee. [Accessed 9 April 2021] ↩
-
Environment Agency analysis of customs data. (2019). [Accessed 9 April 2021] ↩
-
Environment Agency. (2020). Regulating for the environment, people and growth. [Accessed 9 April 2021] ↩ ↩2
-
IEA. (2019). Energy and electricity generation statistics, 2019. [Accessed 9 April 2021] ↩
-
Seto K. C. and others. (2014). Human Settlements, Infrastructure and Spatial Planning. In: Climate Change 2014: Mitigation of Climate Change. Contribution of Working Group III to the Fifth Assessment Report of the Intergovernmental Panel on Climate Change [Edenhofer, O., R. and others (eds.)]. Cambridge University Press, Cambridge, United Kingdom and New York, NY, USA. [Accessed 9 April 2021] ↩ ↩2
-
Defra. (2020). National statistics: UK local authority and regional carbon dioxide emissions national statistics: 2005 to 2018. London: Department for Environment, Food and Rural Affairs. [Accessed 9 April 2021] ↩
-
ONS. (2019). Net zero and the different official measures of the UK’s greenhouse gas emissions. [Accessed 9 April 2021] ↩
-
Committee on Climate Change. (2020). Reducing UK emissions – progress report to parliament. [Accessed 9 April 2021] ↩ ↩2
-
Minx, J. and others. (2013). Carbon footprints of cities and other human settlements in the UK. Environmental Research Letters. 8: 035039. [Accessed 9 April 2021] ↩
-
Centre for cities. (2018). Blog post, using Department for Energy and Climate Change data. [Accessed 9 April 2021] ↩
-
CCC. (2020). Reducing UK emissions – progress report to parliament. ↩
-
Carbon brief. (online). Analysis: UK’s CO2 emissions have fallen 29% over the past decade. [Accessed 9 April 2021] ↩
-
Kendon, M. and others. (2019). State of the UK climate 2018. Special issue article. International Journal of Climatology 39: 1-55. [Accessed 9 April 2021] ↩
-
Met Office. (2018). Was summer 2018 the hottest on record? (online). [Accessed 9 April 2021]: ↩
-
King, A.D. and others. (2015). Attribution of the record high Central England temperature of 2014 to anthropogenic influences. Environmental Research Letters 10: 054002. [Accessed 9 April 2021] ↩
-
Watts, G. and Anderson, M. (eds). (2016). Water climate change impacts report card 2016 edition. Living With Environmental Change. [Accessed 9 April 2021] ↩
-
Kovats, S (eds.). (2015). Health Climate Change Impacts Summary Report Card, Living With Environmental Change. [Accessed 9 April 2021] ↩
-
Horsburgh, K. and others. (2020). Impacts of climate change on sea-level rise relevant to the coastal and marine environment around the UK. MCCIP Science Review 116-131. [Accessed 9 April 2021] ↩ ↩2
-
Zipper, S. C. and others. (2016). Urban heat island impacts on plant phenology: intra-urban variability and response to land cover. Environmental Research Letters 11: 054023. [Accessed 9 April 2021] ↩
-
Cosgrove, A. and Berkelhammer, M. (2018). Downwind footprint of an urban heat island on air and lake temperatures. Npj Climate and atmospheric science 1:46. [Accessed 9 April 2021] ↩
-
Speech by Sir James Bevan, CEO of the Environment Agency. (2018). Surface water: the biggest flood risk of all. CIWEM surface water management conference Oct 2018. [Accessed 9 April 2021] ↩
-
Liu, J. and Niyogi, D. (2019). Meta-analysis of urbanization impact on rainfall modification. Scientific Reports 9:7301. [Accessed 9 April 2021] ↩
-
LeRoy, B. and others. (2019). Long time series spatialized data for urban climatological studies: A case study of Paris, France. International Journal of Climatology 40:3567-3584. [Accessed 9 April 2021] ↩
-
UN Department of Economic and Social affairs. (online). Sustainable development: the 17 goals. New York: United Nations. [Accessed 9 April 2021]: ↩
-
Cohen-Shacham, E. and others. (2016). Nature-based solutions to address global societal challenges. IUCN Commission on Ecosystem Management (CEM), IUCN World Commission on Protected Areas (WCPA). [Accessed 9 April 2021] ↩
-
Naylor, L. A. and others. (2017) Greening the Grey: a framework for integrated green grey infrastructure (IGGI). University of Glasgow report. [Accessed 9 April 2021] ↩
-
Commission of European Communities. (2015). Communication No. 614, 2015. Closing the loop - an EU action plan for the circular economy (COM no. 614, 2015). [Accessed 9 April 2021] ↩
-
Defra. (2018). Resources and waste strategy. London: Department for Environment, Food and Rural Affairs. [Accessed 9 April 2021] ↩
-
Government Office for Science. (2015). Urban metabolism: a review in the UK context [Accessed 9 April 2021] ↩
-
Raworth, K. (2020). Introducing the Amsterdam City Doughnut. [online]. [Accessed 9 April 2021] ↩
-
Doughnut economics action lab. [online]. What is doughnut economics? [Accessed 26/05/2021] ↩
-
Weber, A. M. and Trojan, J. (2018). The Restorative Value of the Urban Environment: A Systematic Review of the Existing Literature. Environmental Health Insights 12. [Accessed 9 April 2021] ↩
-
Environmental Audit Committee. (2019). Our planet, our health. Chapter 5: Sustainable cities. [Accessed 9 April 2021] ↩
-
Local Government Association and Public Health England. (2017). Health and wellbeing in rural areas. [Accessed 9 April 2021] ↩
-
Public Health England. (2015). Local action on health inequalities: Reducing social isolation across the lifecourse. Practice resource: September 2015. London: Public Health England. [Accessed 9 April 2021] ↩
-
New research reveals British attitudes to cities. Survey carried out in 2015 by YouGov in association with Arts and Humanities Research Council. [Accessed 9 April 2021] ↩
-
Bristol City council. (2020). Bristol Quality of Life Survey 2019/20. Insight, Performance and Intelligence Service, Bristol City Council. [Accessed 9 April 2021] ↩
-
Environment Agency. (2020). The social benefits of blue space: a systematic review. [Accessed 9 April 2021]: ↩
-
Wheeler, B. W. (2012). Does living by the coast improve health and wellbeing? Health and Place 18: 1198-1201. [Accessed 9 April 2021] ↩
-
Garrett, J. K. and others. (2019). Coastal proximity and mental health among urban adults in England: The moderating effect of household income. Health and Place 59:102200. [Accessed 9 April 2021] ↩
-
Department for Digital, Culture, Media and Sport. (2020). Community life survey 2019-20. [Accessed 9 April 2021] ↩
-
Natural England. (2020). Monitor of engagement with the natural environment, 2018/19. [Accessed 9 April 2021] ↩ ↩2 ↩3
-
Glover, J. (2018). Landscapes Review: National Parks and AONBs. Commissioned by Defra. [Accessed 9 April 2021] ↩
-
Zigurat Global Institute of Technology. (2020). Barcelona’s superblocks. [online]. [Accessed 9 April 2021] ↩
-
Cities today. (2020). Barcelona to expand ‘superblocks’ to city centre district. [online]. [Accessed 28 May 2021] ↩
-
Mueller, N. and others. (2020). Changing the urban design of cities for health: the superblock model. Environment International 105132. [Accessed 9 April 2021] ↩
-
Environment Agency. (2007). Addressing environmental inequalities: cumulative environmental impacts. [Accessed 9 April 2021] ↩
-
Chief Medical Officer. (2017). Health impacts of all pollution – what do we know? Independent report. London: Department of Health and Social Care. [Accessed 9 April 2021] ↩
-
ONS. (2021). Household income inequality, UK. Financial year ending 2020. [Accessed 9 April 2021] ↩
-
Walker, G. and Burningham, K. (2011). Flood risk, vulnerability and environmental justice: Evidence and evaluation of inequality in a UK context. Critical Social Policy 31:216-240. [Accessed 19 April 2021] ↩
-
Fecht, D. and others. (2015). Associations between air pollution and socioeconomic characteristics, ethnicity and age profile of neighbourhoods in England and the Netherlands. Environmental Pollution. [Accessed 9 April 2021] ↩ ↩2
-
Environment Agency analysis of English Indices of Multiple Deprivation (IMD) data (2019) and Defra modelled ambient air quality data (2018). [Accessed 10 May 2021] ↩
-
Barnes, J.H. and others. (2019). Emissions vs exposure: increasing injustice from road traffic-related air pollution in the United Kingdom. Transportation research part D: transport and environment 73, 56-66. [Accessed 9 April 2021] ↩ ↩2
-
Natural England. (2019) Commissioned Report NECR273. The Messy Challenge of Environmental Justice in the UK: Evolution, status and prospects. [Accessed 9 April 2021] ↩ ↩2
-
Mitchell, G. and Dorling, D. (2003). An environmental justice analysis of British air quality. Environment and Planning A 35:909-929. [Accessed 9 April 2021] ↩
-
Walker, G. and others. (2005). Industrial pollution and social deprivation: evidence and complexity in evaluating and responding to environmental inequality. Local Environment 10:361-377. [Accessed 9 April 2021] ↩ ↩2
-
Environment Agency (2008). Addressing Environmental Inequalities: Waste Management. [Accessed 9 April 2021] ↩
-
Environment Agency. (2005). Indicators for land contamination. [Accessed 9 April 2021] ↩
-
Environment Agency. (2019). State of the environment: soils. [Accessed 9 April 2021] ↩
-
Bambra, C. and others. (2015). This divided land: An examination of regional inequalities in exposure to brownfield land and the association with morbidity and mortality in England. Health & Place 34:257-269. [Accessed 9 April 2021] ↩ ↩2
-
Damery, S. and others. (2008) Addressing environmental inequalities: water quality. Environment Agency, Bristol. [Accessed 9 April 2021] ↩
-
European Environment Agency. (2020). Environmental noise in Europe - 2020. EEA report no. 22/2019. [Accessed 9 April 2021] ↩ ↩2
-
Science for Environment Policy. (2016). Links between noise and air pollution and socioeconomic status. In depth report 13 produced for the European Commission, DG Environment by the Science Communication Unit, UWE, Bristol. [Accessed 9 April 2021] ↩
-
Tonne, C. and others. (2018). Socioeconomic and ethnic inequalities in exposure to air and noise pollution in London. Environment International 115:170-179. [Accessed 9 April 2021]: ↩
-
Defra. (2018). 25 year environment plan. London: Department for Environment, Food and Rural Affairs. [Accessed 9 April 2021] ↩
-
Armstrong, A. and others. (2021). Why Society Needs Nature: Lessons from Research during Covid-19. [Accessed 26 May 2021] ↩
-
CABE. (2010). Community green: using local spaces to tackle inequality and improve health. London: Commission for Architecture and the Built Environment. [Accessed 9 April 2021] ↩ ↩2
-
ONS. (2020). Environmental accounts: access to garden spaces: England. [Accessed 9 April 2021] ↩
-
Dobson, J., and others. (2019). Space to thrive: A rapid evidence review of the benefits of parks and green spaces for people and communities. The National Lottery Heritage Fund and The National Lottery Community Fund, London. [Accessed 9 April 2021] ↩
-
Natural England. (2009). An estimate of the economic and health value and cost effectiveness of the expanded WHI scheme 2009. Natural England Technical Information Note TIN055. Natural England, Peterborough. [Accessed 29 June 2021] ↩
-
Environment Agency. (2020). Social deprivation and the likelihood of flooding. [Accessed 9 April 2021] ↩
-
Lindley, S. and others. (2011). Climate change, justice and vulnerability. Joseph Rowntree Foundation Report. [Accessed 9 April 2021] ↩ ↩2 ↩3
-
Sayers, P. B. and others. (2020). Flood disadvantage: Socially vulnerable and ethnic minorities. [Accessed 9 April 2021] ↩
-
McGregor, G. R., Pelling, M., Wolf, T. and Gosling, S. (2007). The Social Impacts of Heatwaves, Science Report – SC20061/SR6. Environment Agency. [Accessed 9 April 2021] ↩
-
The Land Trust - Beam Parklands. [Accessed 9 April 2021] ↩
-
The River Restoration Centre - Beam Washlands. (2012). [Accessed 9 April 2021] ↩
-
The Land Trust. (2015). The natural capital account of Beam Parklands 2015. Carried out by Eftec. [Accessed 9 April 2021] ↩
-
Government Office for Science. (2015). What do the latest official sub-national population projections suggest for Great Britain’s 63 cities?. Addendum to ‘people in cities: the numbers’. [Accessed 9 April 2021] ↩
-
PWC UK. (2021). UK economic update - January 2021. [Accessed 9 April 2021] ↩
-
Ürge-Vorsatz, D. and others. (2018). Locking in positive climate responses in cities. Nature Climate Change 8:174-175. [Accessed 9 April 2021] ↩ ↩2
-
Sayers, PB., Horritt, M, Carr, S, Kay, A, Mauz, J., Lamb R, and Penning-Rowsell E (2020). Third UK Climate Change Risk Assessment (CCRA3): Future flood risk. Research undertaken by Sayers and Partners for the Committee on Climate Change. Published by Committee on Climate Change, London. [Accessed 9 April 2021] ↩
-
Environment Agency. (2019). Long-term investment scenarios (LTIS) 2019. [Accessed 9 April 2021] ↩
-
Environment Agency. (2020). National flood and coastal erosion risk management strategy for England. [Accessed 9 April 2021] ↩
-
Committee on Climate Change (2017). UK Climate Change Risk Assessment 2017. Synthesis report: priorities for the next five years. London: Committee on Climate Change. [Accessed 9 April 2021] ↩
-
Environment Agency. (2020). Meeting our future water needs: a national framework for water resources. [Accessed 9 April 2021] ↩
-
Committee on Climate Change. (2020) The 6th carbon budget. [Accessed 9 April 2021] ↩
-
Environment Agency. (2018). Climate change impacts and adaptation ↩
-
Landscape Institute. (2020). Case study: Cator Park, Kidbrooke. [Accessed 9 April 2021] ↩