DVLA's annual report and accounts 2016 to 2017
Published 19 July 2017

© Crown copyright 2017
This publication is licensed under the terms of the Open Government Licence v3.0 except where otherwise stated. To view this licence, visit nationalarchives.gov.uk/doc/open-government-licence/version/3 or write to the Information Policy Team, The National Archives, Kew, London TW9 4DU, or email: psi@nationalarchives.gov.uk.
Where we have identified any third party copyright information you will need to obtain permission from the copyright holders concerned.
This publication is available at https://www.gov.uk/government/publications/dvla-annual-report-and-accounts-2016-to-2017/dvlas-annual-report-and-accounts-2016-to-2017
0.1 Non Executive Chair’s introduction

I am pleased to introduce the DVLA’s Annual Report and Accounts for 2016-17, which sets out the agency’s performance over the last financial year.
2016-17 has been another successful year for us where we’ve continued to focus on anticipating our customers’ needs and exceeding their expectations - giving them choice in how they access our services.
We’ve built new and innovative digital services and laid the foundation for future technology. From live web chats to a dedicated online portal for reporting medical conditions, the last year has seen us develop more responsive and tailored services online.
As one of the largest employers in South Wales we’re committed to playing a significant role in the community. Throughout the year we’ve supported employment initiatives and offered work placement opportunities to local people.
We also became Science Technology Engineering and Maths (STEM) Ambassadors for the area and supported local primary schools to engage young people in technology through ‘code club’ sessions.
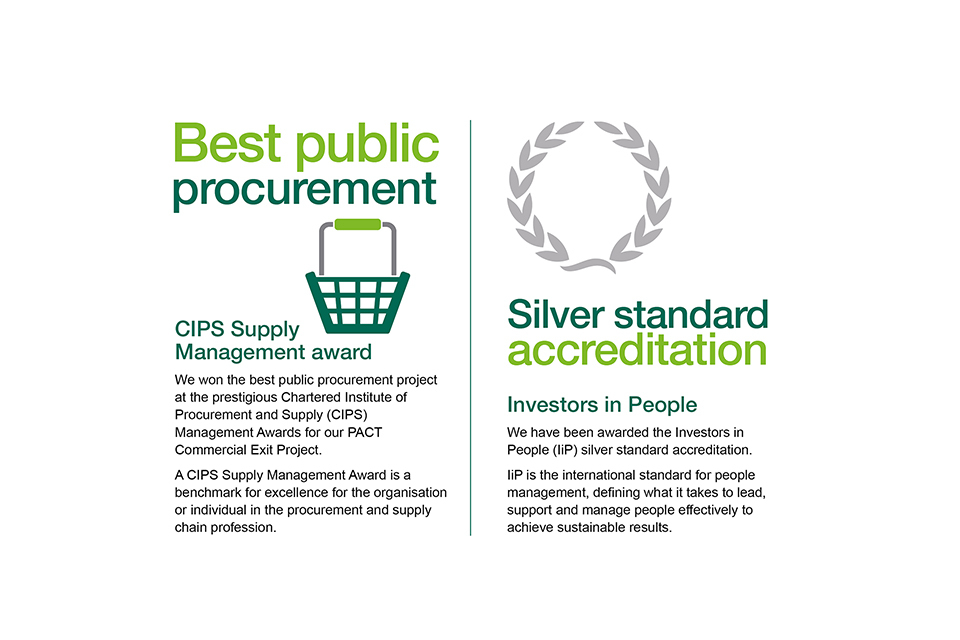
In 2016-17 we were awarded Investors in People silver accreditation and successfully retained our silver award in the Corporate Health Standard accreditation scheme. We’ve continued to drive for a diverse workforce, that reflects the customers and communities we serve and has the right attitudes, behaviours and skills to deliver and improve our services.
I’m proud of what we’ve achieved over the past year, ultimately providing customers with simpler, better and more secure ways of transacting with us. These achievements would not have been possible without the talents and hard work of our staff.
I look forward to the opportunities that lie ahead and to working together with our Board and staff in delivering our Strategic Plan for 2017-20.
Lesley Cowley OBE
Non-Executive Chair
28 June 2017
0.2 Chief Executive’s message

This last year has been one of significant achievement for the Agency. We completed our Strategic Plan 2014-17 whilst delivering our core responsibilities, we were also recognised on a national level for our digital services.
The previous 3 years have been very much about transforming our services and business. We’ve focused on providing excellent online services, hand-in-hand with other channels and recognising opportunities to continuously improve these, delivering best in class customer services.
Our goal is clear and it is what drives us every day - to get the right drivers and vehicles on the road as simply, safely and efficiently as possible.
2016-17 was an exceptional year for our digital services, which were recognised at the Digital Leaders Top 100 awards where among other accolades we won the overall prize of Digital Leaders 100 Award.
During the year we:
- Made our systems ready for the new vehicle tax rates which came into force on 1 April 2017. This was a huge piece of work which involved working closely with vehicle manufacturers and dealers to make sure that new cars could be registered and licensed without delay.
- Introduced a new online service allowing customers to tell us they have a medical condition. This service has helped provide quicker decisions to customers.
- Exceeded our efficiency target of 14%, achieving an 18% reduction, equating to around £45 million cost savings. Revenues paid over to HM Treasury increased by 23%, contributing £201.6m to the Exchequer. Our net income for the year represents 20% of total income, a significant improvement on the 10% reported last year.
Last year was not without its challenges. A Parliamentary and Health Services Ombudsman’s investigation into our Drivers Medical Group highlighted the need for improvements in the way we manage medical cases. We apologised to customers affected and continued to make improvements.
Our achievements have been possible due to the dedication and passion of DVLA staff. My thanks go to the commitment and support of my Executive team and the hard work of our staff for getting us to where we are today.
Looking forward, our new Strategic Plan 2017-20 focuses on 5 key areas: best-in-class customer services; dynamic technology and services; hub for digital motoring; modern workplace; unrivalled safety, security and compliance.
We’re looking forward to taking the opportunities offered by cloud services, agile methodology and our recently in-sourced IT to continue to build dynamic technology and services that respond to changing customer demand. Motoring technology is changing fast, and our commitment to innovation and excellent customer-service will enable us to become a hub for digital motoring.
I look forward to the year ahead.
Oliver Morley CBE
Accounting Officer and Chief Executive, DVLA
28 June 2017
0.3 Highlights for the year
Highlights for the year

Highlights for the year

Highlights for the year

Highlights for the year
Highlights for the year
Highlights for the year
1. Who we are and what we do
DVLA is an Executive Agency of the Department for Transport and is part of the DfT Roads, Devolution and Motoring Group.
Our goal is to get the right drivers and vehicles taxed and on the road, as simply, safely and efficiently as possible.
We maintain the registration and licensing of over 47 million drivers in Great Britain and the registration of over 39 million vehicles, together with the collection and enforcement of VED in the UK.
Our services
Our award winning digital services provide the public with a simpler, better and more secure way of transacting with us. During the year we continued to look at ways to improve our services whilst delivering our core responsibilities.
Our multi-channel contact centre provides customers with the option to talk to our customer service advisors, email or to use our new webchat service for certain transactions.
We have a personalised registration scheme for customers to purchase personalised registrations online or through one of our auctions. The scheme has raised over £2.4 billion since it started in 1989.
During the year, we continued to work closely with our stakeholders to ensure that our services were tailored accordingly. We also worked with the police and local authorities to deal with vehicle related crime.
For more information about our services visit our website.
Our strategic plan
This is the final year of our Strategic Plan 2014-17 and we have delivered significant changes to our business and introduced new services for our customers.
Some of the major changes delivered over the last 3 years were:
- moving away from a large scale contract to deliver our IT in-house
- abolition of the tax disc
- abolition of the paper counterpart to the driving licence
- introduction of direct debit to pay VED
- 7 new online services
- reductions in various driving licence fees which has resulted in savings of around £20 million per year for motorists
In March 2017, we published our Strategic Plan 2017-20 which details our plans for the next 3 years.
How we manage our agency
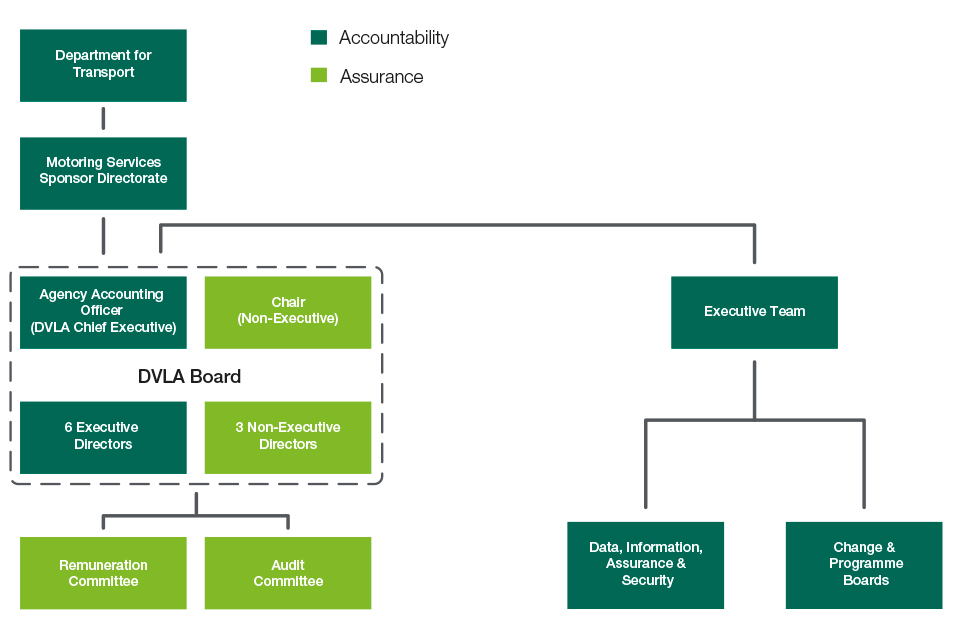
We work within a framework which sets out our governance, accountability, key relationships and financial management arrangements. The core of our management is our board consisting of a Non-Executive Chair, Chief Executive and Accounting Officer, 6 Executive Directors and 3 Non-Executive Directors. For more information about our board and its members visit our website. For more information about our governance see our Accountability Report.
Risk management
Risk management is embedded into our culture and plays an important part in the development and everyday running of our business.
During the year, we have facilitated events promoting risk management and awareness both internally and externally. These events have focused on risk handling, leadership and partnership, openness and the value of risk identification.
We have formed a Welsh Risk Networking Group bringing together best practice within the public sector.
Social responsibility
We are committed to our corporate social responsibility policy and are dedicated to proactively supporting initiatives that empower and benefit Welsh communities and individuals. As one of the largest employers in the Swansea area, we are committed to giving as much back to the local area as possible.
We played an active role in supporting employment initiatives in Wales, offering a number of work placement opportunities throughout 2016.
Our software development community has continued to support local primary schools, holding weekly ‘code club’ sessions with children between the ages of 9 to 11. Working in collaboration with Swansea University, we have played a big part in becoming Science Technology Engineering and Maths (STEM) Ambassadors for the area. We have presented at festivals and road shows to demonstrate how ‘computational thinking’ is a skill and how it can help young people to transfer these skills into the workplace.
We have continued our relationship with Swansea Techhub which led to a move into the new building in 2016. Our new sponsored event space named Furnace has become a home for the tech community which can be used for workshops, meetings, conferences and hackathons.

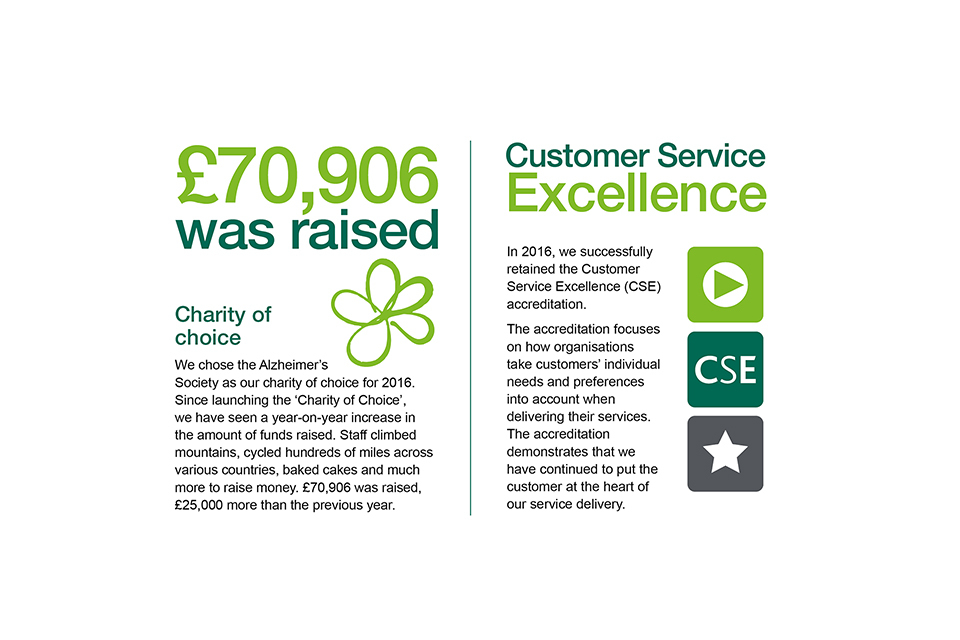
Our staff chose the Alzheimer’s Society as its charity of choice for 2016. Since launching the ‘Charity of Choice’, we have seen a year-on-year increase in the amount of funds raised. £70,906 was raised, £25,000 more than the previous year.
The purpose of this document
This Annual Report and Accounts sets out our performance and achievements for the year and should be read in conjunction with our Business Plan 2016-17.
2. Delivering against our 2016-17 business plan
| 1. Changing our agency | Target | Result |
|---|---|---|
| 1.1 Vehicle Excise Duty (VED) reform: we will implement the new vehicle registration and licensing rules (announced by the Chancellor in July 2015) | As of 31 March 2017 | We have made changes to our systems and processes to deliver VED Reform from 1 April 2017 |
| 1.2 Drivers medical reform: introduce an online service for customers to notify us of a medical condition and renew their short period driving licence | August 2016 | A new online service for customers to notify us of their medical condition and renew their short period licence was introduced in August 2016 |
| 1.3 Contact centre modernisation: - to deliver an online self-service facility to support customers with their enquiries - to deliver an automated telephone call analysis solution providing valuable customer insight to improve and simplify our services |
February 2017 June 2016 |
- Following further exploration of an online self-service facility, it was decided that a change of approach was required. A new improved e-mail solution was delivered in place of this. - This was delivered by our contact centre introducing a speech analytics system |
| 2. Our services | Target | Result |
|---|---|---|
| 2.1 Collecting VED: develop and agree with Her Majesty’s Treasury and DfT a strategy to reduce VED evasion | September 2016 | In September 2016, Her Majesty’s Treasury, HMT, DfT and DVLA agreed a strategy to reduce evasion |
| 2.2 IT resilience: to provide scheduled availability (taking into account scheduled downtime) of: - Vehicle Tax - Vehicle Management - Personalised Registration - Driver Licence online services |
99.5% availability |
99.9% 99.9% 99.9% 99.9% |
| 2.3 Our total digital and automated transactions at March 2017 will exceed | 80% | 96.2% |
| 2.4 To despatch a: - first driving licence in 8 days - vocational driving licence in 6 days - digital tachograph in 8 days |
98% of cases |
99.9% 99.6% 100% |
| 2.5 Reduce the number of drivers medical casework (drivers who notify us of a medical condition) by 25% to 89,000 cases waiting for action against the 2015-16 baseline | 89,000 cases | 82,204 cases |
| 2.6 To answer calls queued to an advisor in 5 minutes | 95% of cases | 98.3 % |
| 3. Meeting customer needs | Target | Result |
|---|---|---|
| 3.1 Customer Service Excellence standard | Retain accreditation | Retained accreditation |
| 3.2 Customer Contact Association Global standard | Retain accreditation | Our contact centre achieved this through accreditation to the Customer Contact Association’s new Global Standard 6. |
| 3.3 Customer satisfaction – maintain customer satisfaction for key transactions: - I want to tax my vehicle - I want to amend my vehicle registration document - I want to renew my driving licence |
95% 90% 93% |
96.1% 90.9% 95.8% |
| 3.4 Improve customer satisfaction on drivers medical transactions against the 2015-16 baseline of 77% | March 2017 | 83.9% |
| 3.5 Customer complaints – reduce the number of formal complaints by 5% (from the March 2016 baseline) - Drivers - Drivers medical - Vehicles |
5% |
Exceeded (-12%) Not achieved (+9%) Exceeded (-21%) |
| 3.6 Freedom of Information Act – provide a response within 20 working days | 93% | 98% |
| 3.7 Parliamentary questions – provide a response by due date | 100% | 100% |
| 3.8 Ministerial correspondence – provide a response within 7 working days | 100% | 99.7% |
| 3.9 Official correspondence – provide a response within 20 working days | 80% | 99.80% |
| 3.10 Prompt payments – payment of invoices within 5 working days | 80% | 86.7% |
| 4. Financial responsibilities | Target | Result |
|---|---|---|
| 4.1 Deliver the CSR efficiency saving of 14% by March 2017 (34% by March 2020) | 14% | 18.2% |
| 4.2 Financial expenditure – VED collection and enforcement expenditure will not exceed | £131 million | £119 million |
| 4.3 Headcount – by March 2017, DVLA full time equivalents will number fewer than | 5,497 | 5,351 |
| 4.4 Sick absence – reduce the number of working days lost (by full time equivalents) due to sickness by 0.5 against the 2015-16 baseline and work towards the DfT target of not exceeding 7 days | 8.13 days | 8.33 |
2.1 Changing our agency
Vehicle Excise Duty reform
In July 2015 the Chancellor announced that cars and some motorhomes first registered from 1 April 2017 would be subject to new Vehicle Excise Duty (VED) rates.
We have added the new rates to our systems and processes to allow customers to tax their vehicles at the correct rate from 1 April 2017. We have also made changes to the first registration service to capture the list price of the vehicle, so that the appropriate rate is charged.
For more information on the new VED rates visit our website.
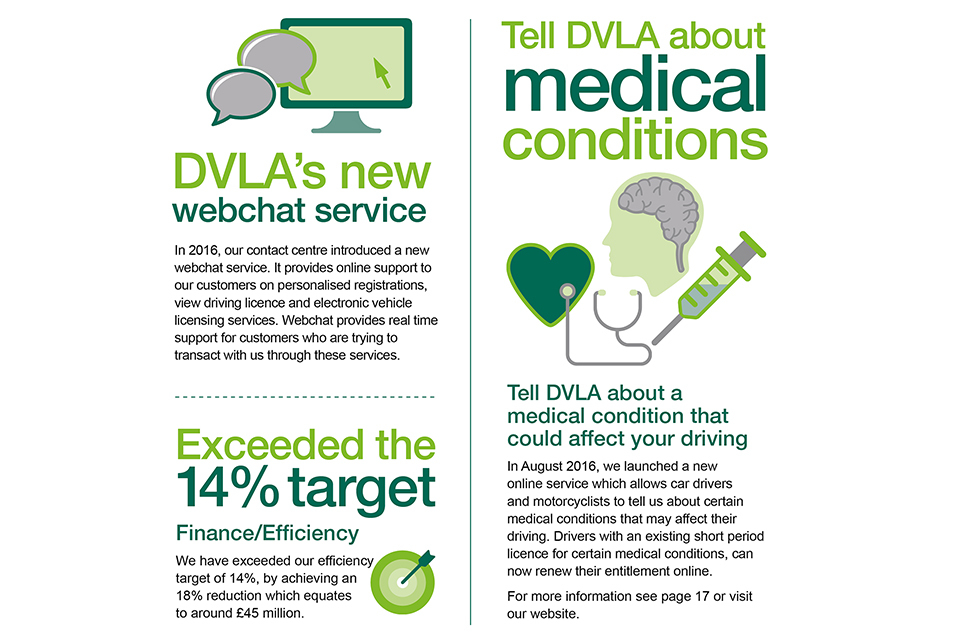
Tell DVLA about a medical condition that could affect your driving
We currently deal with approximately 660,000 paper based medical transactions each year. In August 2016, we introduced a new online service to allow drivers with car and motorcycle entitlement to tell us about a medical condition that may affect their driving. Drivers can currently use the service to tell us about diabetes, vision, epilepsy, stroke, Parkinson’s disease, certain heart conditions, sleep apnoea and narcolepsy. We have also introduced an online service to allow drivers with similar medical conditions and criteria to renew their short term medical driving licence.
Our online services provide instant advice to the user, meeting their needs until a licensing decision is made. Due to the efficiencies of the online services we can now provide quicker decisions to users, aiding road safety.
For more information visit our website.
Contact centre modernisation
We have a responsibility to provide excellent services and value for money to the public. Our contact centre receives around 7.8 million driver licence enquiries and 17.3 million vehicle enquiries a year.
Our contact centre is currently undergoing a modernisation programme, with the potential to be a ‘Centre of Excellence’ in Government. Our contact centre will have the ability to provide services across departments and the public sector.
We have been successful in achieving high level industry recognised awards over the last 10 years. We have achieved the prestigious accreditation to the Customer Contact Association (CCA) new Global Standard 6 award in 2016-17.
In 2017, a new improved email solution was introduced. Customers can now make an enquiry through an online web form and receive an answer from an advisor or automatic email response. This approach significantly improves the customer journey when contacting us by email.
In addition to the delivery of the new email service, we have developed an internal knowledge database for advisors, it provides quick access to the information they need to answer the customer’s enquiry.
During the year, we introduced a new speech analytics solution. This solution provides insight around call demand and has improved both the services we offer and the customer experience. This also helps reduce call demand and provides a more efficient telephone service for our customers.
In 2016, we introduced a new webchat service, it provides online support to our customers on personalised registration, view driving licence and electronic vehicle licensing services. Webchat provides real- time support for customers who are trying to transact through these services. Since the service has been introduced the number of customers using the service has increased from 3,000 to 25,000 a month. 91% of our customers are satisfied with the service.
Our contact centre uses social media to answer customer enquiries, receiving over 14,000 enquiries a year. This is supported by the introduction of a social media marketing and analytical tool, which provides a greater understanding around the effectiveness of any social media campaigns. This tool also helps to identify whether new initiatives are being communicated and understood on our social media channels.
2.2 Our services
VED collection
We collect around £6 billion in VED each year. VED compliance is high, largely due to the convenience and simplicity of our online services. In 2015, the DfT Roadside Survey on VED estimated that 1.4% of vehicles were unlicensed.
Although this reflects that the vast majority of VED is collected, we did see some change in customer behaviour following the abolition of the tax disc and the rules around non-transferability of VED. As a result we refreshed our approach to compliance and enforcement and developed a strategy which makes VED even easier to pay and harder to evade.
In September 2016, HM Treasury, DfT and DVLA agreed a strategy to reduce evasion. The recommendations are to:
- reduce evasion to under 1% by 2019 and show an improvement by 2017
- carry out a DfT roadside survey in June 2017 (reporting findings in November 2017)
- create an enforcement approach that is sustainable, efficient and delivers a digital service wherever possible.
We will continue to introduce new online services to ensure that we make it easier for customers to comply with the law. In 2016 we introduced a facility for customers to pay enforcement penalties online. This supports the government’s digital agenda, making it easier for customers to use our services. For more information, visit our website.
In 2017-18 we will be increasing the range of penalties payable through our online services. For more information about our enforcement strategy see our Strategic Plan 2017-20 and Business Plan 2017-18.
Digital services

We have continued to focus on providing excellent online services to our customers, building new and innovative digital services and laying the foundation for new technology.
To meet customer expectations and provide a service that meets their needs, our online service is available 24/7. In 2016-17 take up of our digital and automated transactions increased to 96.2%.
We have gained an impressive list of accomplishments over the last year, winning the prestigious Digital Leaders Top 100 Awards for our share driving licence service. We received the Digital Public Service Innovation of the Year Award which honours the highest achievements of the year, for teams and individuals from the private and public sector.
Over the next 3 years we will further transform our IT and services. We will become a hub for digital motoring, removing paper and documents where we can with digital options. We will provide interactive software to allow business and government to develop new services on top of ours.
Drivers medical
Our drivers’ medical department deals with all aspects of driver licensing when there are medical conditions that could affect safe control of a vehicle.
We operate under national medical guidelines on fitness to drive that we have published on our website. The guidance is intended to assist doctors and other healthcare professionals in advising their patients:
- whether or not we require notification of a medical condition
- what the licensing outcome from our medical enquiries is likely to be.
In 2016-17, we recruited and trained over 100 staff to be able to investigate and process a wider range of notifiable medical conditions. To increase the resource dedicated to deal with the more complex cases, we ran recruitment campaigns for qualified and experienced doctors and nurses. In 2016-17, 4 doctors and 3 casework nurses joined the agency. In addition to this up to 8 doctors and additional nurses will join the agency in 2017-18.
Additional resource has had a significant impact in improving the levels of drivers’ medical customer service. In 2016-17 a medical licensing decision was made in 92.3% of cases within 90 days compared to 84.4% in 2015-16. In 2016-17, the average number of days taken to make a decision on fitness to drive was 37 days compared to 55 in 2015-16.
Throughout 2016-17, we have worked on a range of initiatives to continually improve the drivers’ medical service, including:
- extending medical licences for specific conditions (for example diabetes and Parkinson’s disease) from 3 years to 5 years
- launching and updating the Assessing Fitness to Drive guidance
- reviewing customer facing letters
- streamlining internal process to support a quicker licensing decision without compromising medical standards.
Customer service standards

We are committed to delivering excellent services to our customers. We work closely with a wide range of customers to ensure that we provide a service that they expect. In 2016-17, we exceeded all of our customer service standards.
For more information about our service standards visit our website.
2.3 Meeting customer needs
Customer Service Excellence
Customer service and satisfaction is pivotal to what we do. In 2016, we successfully retained the Customer Service Excellence (CSE) accreditation. CSE demonstrates our commitment to achieve service excellence and ‘best in class’ customer service.
Customer satisfaction
In 2016-17 we obtained customer insight through surveys, focus group discussions and in-depth interviews.
To test our services with customers we have used our ‘state of the art’ UX lab. Our UX@DVLA is one of the best user experience testing labs in the country. The UX lab gives us detailed feedback to help us improve our services further.
We also conducted a number of different research projects to support the development of new and existing online services. This ensures that our customers are at the heart of service development.
| Customer satisfaction measure | Target | Result |
|---|---|---|
| I want to tax my vehicle | 95% | 96.1% |
| I want to amend my vehicle registration details | 90% | 90.9% |
| I want to renew my driving licence | 93% | 95.8% |
| Drivers medical transactions | 77% | 83.9% |
Customer complaints
In 2016-17 the number of overall customer complaints reduced by 13.8% compared to 6.5% in 2015-16.
Both driver and vehicle complaints have seen a considerable decrease of 17% and 24% respectively, which exceeds the 5% reduction target. These have been achieved through the continued development and continuous improvement to processes and online services that have had a positive impact on customers dealing with the agency.
Drivers’ medical complaints has increased during the period by 4%. While this clearly fails the reduction target, complaint volumes account for only 0.14% of case volumes. This may have increased due to media interest. To address this, additional resource was introduced and combined with process enhancements, has led to improved performance with substantially more cases closured.
Corporate customers
We have continued to deliver and improve services that meet the business needs of our corporate customers. During the year, we worked closely with our corporate customers, continuously improving our services through customer insight and feedback. Results of the 2016 survey showed that 94% of our corporate customers were happy with our service.
VED reform – we formed and chaired an Industry Steering Group to ensure that the motor industry had all the information they required in preparation for VED reform. This group supported and informed the development of the services that supported the changes. Early and regular engagement with the industry on VED reform implementation was well received. We hosted workshops and webinars to increase understanding across the industry. This has enabled early cascade and feedback channels to obtain clarity for smooth implementation.
Vocational driver guide – this was an excellent example of collaborative working between DfT, the Traffic Commissioner for Wales and the trade associations from the passenger transport and haulage industry. Our work with corporate customers helped inform drivers of the complex rules and regulations around driving lorries and buses.
Fitness to Drive – our collaboration with charities and motoring organisations throughout the year has resulted in them supporting our digital driver service developments and communications. It has also improved mutual understanding of the issues affecting both the charities and our customers.
Fleet companies – corporate customers who operate large fleets of vehicles have benefitted from the introduction of new services through our fleet scheme. This allows operators to better organise and manage compliance in their fleets.
We hosted and visited trade associations, motoring organisations, charities and police forces during the year. This has provided the opportunity to showcase the benefits and efficiencies of our digital services.
Business development
We have an experienced and cost-efficient workforce with a wide mix of skills. We want to make the best use of these opportunities as a service provider both for government and the private sector. Our aim is to use our assets to build new revenue and transactional opportunities across government using our own commercial enterprise.
During the year, we continued to build on cross-government working, securing work to produce 14.5 million annual tax summaries for HM Revenue and Customs (HMRC).
We also carried out a 6 month pilot with Highways England, issuing warning letters to drivers using Red X lanes or who drive on the hard shoulder.
In December 2016, we launched a new workplace charge point grant scheme for the Office for Low Emission Vehicles (OLEV) and are working towards designing a single online portal to facilitate a further 3 grant schemes in 2017-18.
This has been a successful year for our personalised registration scheme. During the year we:
- launched the 66 and 17 new series registrations
- introduced some P prefix registrations.
Our auction programme of selling older style registrations achieved over £22 million.
We also continued to introduce new Northern Ireland format registrations for sale on our website and at auction which raised £1.9 million (£1.4 million in 2015-16). The total overall revenue raised for 2016-17 was £114.0 million (£102.2million in 2015-16).
2.4 Financial responsibilities
Our accounts are made up of the Business Account and the Trust Statement.
Business Account
The Business Account is segmented into:
- maintenance of the driver and vehicle database and related services
- sale of personalised registrations, which represents commercial income generated directly from the public. We retain income to recover our costs in administering personalised registrations services with the excess paid to HM Treasury as Consolidated Fund extra receipts
- collection and enforcement of VED including enforcement recoveries (the income stream from the collection of VED is accounted for in the Trust Statement)
- services delivered to other government departments.
Financial results
Our total income for the year was £564 million against £541 million in 2015-16. An increase of £23 million is due to a number of variances, the key increase being due to the sale and transfer of personalised registrations marks.
Our total expenditure for the year was £451 million against £485 million in 2015-16. The reduction of £34 million is mainly due to the decrease in IT costs following PACT exit in 2015-16.
Net income for the year has increased from 10% of total income in 2015-16 to 20% in 2016-17.
Departmental Expenditure Limit
As a government body, we have budgets set at the start of the financial year in respect of our Business Account activities. The resource (RDEL) out-turn for the year is £91 million, £22 million under our original settlement for the year. This reduction results from the increased income and reduced expenditure.
Trust Statement
Our Trust Statement details the revenue in respect of VED, fines and penalties and HGV levy falling outside of the boundary of our Business Account.
Financial results
During the year the Trust Statement gross revenue amounted to over £6 billion.
The net cost of collecting VED and the enforcement action taken as a result of non-compliance (brought to account in the Business Account) was £119 million, a decrease of £18 million when compared to expenditure in 2015-16. This is £12 million less than our 2016-17 business plan measure (VED collection and enforcement expenditure will not exceed £131 million). The overall reduction is due to efficiencies which more than off-set the £4.2 million increase in the direct cost of wheelclamping.
Efficiency
The Spending Review 2015 committed us to make a 14% resource budget reduction by 31 March 2017 in comparison to the 2015-16 baseline (34% total reduction by 31 March 2020). We have exceeded the target by achieving a 18% reduction.
In total, we have reduced costs by £45 million (unadjusted for inflation) against the baseline, through:
- realising the benefits of moving away from a large IT contract and bringing IT services in-house. These include removing over 60% of our hardware/software contracts and challenging contractor rates to drive savings
- introducing new online services and increasing take-up of existing services which has resulted in reduced intermediary and consumables costs
- commercial efficiencies through negotiating reduced unit prices, achieving economies of scale and challenging requirements to reduce contract costs.
Sustainability
In 2016 the Greening Government Commitments (GGC) were revised as 3 year targets, ranging from 2016-17 to 2019-20, set against the original baseline of 2009-10. They continue to focus on greenhouse gas emissions, waste, water and paper. More details of the new commitments can be found on GOV.UK.
We have exceeded all but 1 of our ambitions for the year including reducing carbon emissions by a further 2% currently at 36% less than 2009-10. Details of the targets we set for 2016-17 to contribute to the 2020 commitments and our performance can be found below.
| Measure | Target towards the Greening Government Commitment | Outturn 2016-17 |
|---|---|---|
| Greenhouse Gas Emissions | Achieve a further 2% reduction in our greenhouse gas emissions against the 2009-10 baseline. (34% in 2015/16) | 36% |
| Greenhouse Gas Emissions | Maintain our reduction of domestic business travel flights of more than 90% from the 2009-10 levels (number of flights). | 94% |
| Waste | Send no more than 10% of our waste to landfill Maintain a reduction in waste generated at 49% against our 2009-10 baseline Recycle and compost at least 70% of our waste |
6% 52% 71.5% |
| Water | Reduce water consumption year on year (Office m3/ Office FTE) (4m3 per Office FTE in 2014-2015) | 7.7 |
| Administrative Paper | Maintain our reduction in paper use of more than 60% from the 2009-10 baseline | 66% |
Further information is available in our Sustainability Report, published on our website. The following section details the minimum sustainability reporting requirements in accordance with the HM Treasury Public Sector Annual Reports: Sustainability Reporting Guidance 2016-17 and Greening Government Commitments Guidance.
Greenhouse gas emissions
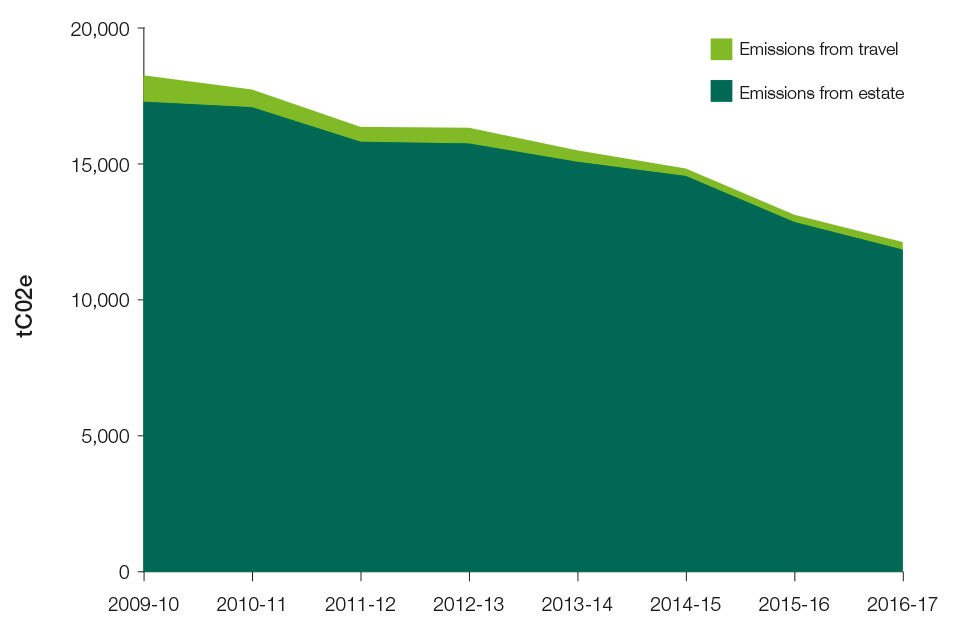
The total reduction in greenhouse gas emissions (carbon equivalent) is 36%; this is made up of 2 components:
- emissions from travel at 70%
- emissions from the estate at 34%.
Emissions from the estate
There has been a marked reduction in emissions from our estate during the last 12 months. we were able to achieve the further 2% reduction in total emissions by continued good practice in the management of our heating and cooling systems and have also replaced existing lighting with LEDs in trial areas, which we intend to roll out across the estate in the next few years.
Emissions from travel
We continue to perform well in ensuring the emissions created by business travel are kept to a minimum. We achieved a 70% reduction of emissions from business travel against the 2009-10 baseline. Although this is a good result, we have increased emissions from business travel by 12.3% compared to last year.
The majority of the increase in business travel has been identified as the result of our IT transformation and the in-housing of our IT services. Some travel, previously undertaken by IT contractors is now carried out by our staff.
The remainder of the increase is largely attributed to the recent purchase of 3 further Automatic Number Plate Recognition (ANPR) fleet cars. This has increased mileage by 20% but will allow for additional road side identification of VED evasion.
Total Greenhouse Gas Emissions
Total greenhouse gas emissions
Waste
The GGC target requires us to reduce the amount of waste created year on year and increase the amount recycled to ensure that we send less than 10% of that waste to landfill.
In 2016-17 we created 52% less waste than the baseline 2009-10. This equated to an 7.5% reduction during the year, compared to 2015-16.
The main contributing factor was a reduction in paper waste, which reduced by just under 85 tonnes. General waste also reduced by over 20 tonnes, both of which are around a usual month’s total. Our reduction in paper demonstrates the continued benefits realised from the digitalisation of our services. In addition, operational activities to reduce paper waste include the work of our printing facilities to reuse end of operational paper reels to feed smaller batches of work.
Of the 1060 tonnes of waste created, just 6% was sent to landfill, 71.5% was recycled or reused and the remainder was incinerated for energy.
During 2016-17 we continued to divert nearly 600 items that were at the end of their useful life away from becoming waste. This was due to significant changes in process or technology refresh, had little financial value but could be of use to others. These items, such as paper, operational stationery, IT equipment and furniture, wherever possible, were found new homes in local schools, charities or local government organisations.
Water
We have committed to continue to reduce total water consumption from 2014-15 levels by 2019-20.
During 2016-17 we achieved a 4% reduction.
This has been achieved through increased monitoring of sub-meters leading to the prompt resolve of any leaks and allows the identification of wasteful processes. As we have redefined what is considered as office accommodation throughout our estate we have increased the level of m3 per full time equivalent employee from 4m3 to 7.7m3.
Procurement
We recognise the impact that our procurement decisions have on our sustainability outcomes. We successfully achieved the CIPS accreditation which demonstrates our compliant policies, processes and practices, which includes a sustainability agenda, against the accreditation standard.
We are represented on the government-wide sustainable procurement group and continue to be committed to meeting the Government Buying Standards (GBS) best practice specifications wherever possible.
During 2016-2017, we established a sustainability action log to identify process/organisational improvements and provide key delivery milestones and timescales.
We have increased the level of awareness of our commercial staff relating to sustainability within the procurement process through:
- mandated product knowledge sessions to commercial advisors
- senior management attendance at external sustainable procurement courses
- mandated sustainability module for commercial advisors undertaking CIPS Level 5 examinations.
Transparency commitments
| Climate change adaptation | One of our properties is at risk of flooding. Mitigating actions have been taken by the local council within the area and we have business continuity plans in place to reflect this risk. |
|---|---|
| Biodiversity and natural environment | We have continued to see an increase in the number of fauna and flora species on site, now standing at 162, including 11 section 7 species of the Environment (Wales) Act 2016. Our staff have been leading regular nature themed activities as part of staff engagement and awareness. We have been working collaboratively with our Private Finance Initiative (PFI) service partners to maintain and enhance biodiversity. As a result of this, new initiatives and management plans relating to biodiversity have been created. The Environment (Wales) Act 2016 is to replace the NERC Act 2006 in Wales and the new Biodiversity Action Plan 2017 will reflect these changes. |
| Procurement of food and catering services | Our PFI contractor provides all food and catering services and the contract stipulates sustainable requirements. We audit the requirements annually to ensure compliance and actions of improvement if necessary. Results of audits can be found in our Sustainability Report. |
| Sustainable construction | No construction activities have been undertaken in the past 12 months. |
| People | We are proactive in our support of people within the agency and the communities in which we works. More detailed information can be found in our Sustainability Report. |
3. Corporate governance report
Directors’ report
Purpose of the directors’ report
This report is presented in accordance with the requirements of the Companies Act 2006 (Strategic Report and Directors’ Report) Regulations 2013.
Members of the board
Full disclosure of the serving directors for 2016-17 is available in the Governance Statement of this document. Directors have declared that they hold no significant third party interests that may conflict with their board duties.
Pension liabilities
Our employees are civil servants to whom the conditions of the Superannuation Acts 1965 and 1972 and subsequent amendments apply.
The Principal Civil Service Pension Scheme (PCSPS) and the Civil Servant and Other Pension Scheme (CSOPS) – known as ‘alpha’ – are unfunded multi-employer defined benefit schemes. We are unable to identify our share of the underlying assets and liabilities. Provision is made in note 11 of the Business Account to meet early retirement costs payable by us up to employee’s normal retirement age.
Employees
Information about our policies and arrangements relating to staff is shown in the staff report.
External auditors’ remuneration
The external auditors did not undertake any non-audit work in the year.
Sickness absence data
Our sickness absence measure is shown in the Performance Report.
HM Treasury cost allocation and charging requirements
Full disclosure of our compliance with the cost allocation and charging requirements of HMT is reported within note 2 of the financial statements.
Personal data related incidents
Full disclosure of our data controls is made through the Governance Statement.
Future developments
Our future developments are detailed in our Strategic Plan 2017 - 20 and Business Plan 2017-18.
Statement of Accounting Officer’s responsibilities
Business Account
Under the Government Resources and Accounts Act 2000, HM Treasury has directed us to prepare for each financial year a statement of accounts in the form and on the basis set out in the Accounts Direction. The accounts are prepared on an accruals basis and must give a true and fair view of the state of affairs of our comprehensive net expenditure, cash flows and changes in taxpayers’ equity for the financial year.
In preparing the Business Account, the Accounting Officer is required to comply with the requirements of the Government Financial Reporting Manual and in particular to:
- observe the Accounts Direction issued by HM Treasury, including the relevant accounting and disclosure requirements and apply suitable accounting policies on a consistent basis
- make judgements and estimates on a reasonable basis
- state whether applicable accounting standards as set out in the Government Financial Reporting Manual have been followed and disclose and explain any material departures in the financial statements
- prepare the financial statements on a going concern basis.
The Permanent Secretary of DfT has appointed the Chief Executive of DVLA as the Accounting Officer of the agency. The responsibilities of an Accounting Officer, including responsibility for the propriety and regularity of the public finances for which the Accounting Officer is answerable, for keeping proper records and for safeguarding our assets, are set out in Managing Public Money published by HM Treasury.
Trust Statement
Under the Exchequer and Audit Departments Act 1921, HM Treasury has directed us to prepare, for each financial year, a Trust Statement detailing the revenue and expenditure in respect of VED, fines and penalties and HGV levy falling outside of the boundary of our Business Account. The Trust Statement is prepared on an accruals basis and must give a true and fair view of the collection and allocation of VED, fines and penalties and HGV levy, including the revenue and expenditure, financial position and cash flows. Whilst we are concerned with compliance, the Trust Statement does not estimate the duty foregone because of non-compliance with the VED regime.
In preparing the Trust Statement, the Accounting Officer is required to comply with the requirements of the Government Financial Reporting Manual and in particular to:
- observe the Accounts Direction issued by HM Treasury, including the relevant accounting and disclosure requirements and apply suitable accounting policies on a consistent basis
- make judgements and estimates on a reasonable basis
- state whether applicable accounting standards as set out in the Government Financial Reporting Manual have been followed and disclose and explain any material departures in the Trust Statement
- prepare the financial statements on a going concern basis.
HM Treasury has appointed the Permanent Secretary of DfT as Principal Accounting Officer of the Department. Our Chief Executive holds the role of Accounting Officer for the purposes of the Trust Statement. The Accounting Officer is also responsible for the fair and efficient administration of the VED regime including the assessment, collection and proper allocation of VED revenue.
Disclosure of audit information
The Accounting Officer confirms that, as far as he is aware, there is no relevant audit information of which the Agency’s auditors are unaware and he has taken all steps that he ought to have taken to make himself aware of any relevant audit information and to establish that the agency’s auditors are aware of that information.
Responsibility for the annual report and accounts
The Accounting Officer has confirmed that the annual report and accounts as a whole are fair, balanced and understandable and that he takes personal responsibility for the annual report and accounts and the judgments required for determining that they are fair, balanced and understandable.
Governance Statement
Introduction
The Permanent Secretary of DfT has appointed me as Accounting Officer and Chief Executive for DVLA. As Accounting Officer, I have responsibility for the proper, effective and efficient use of public funds and may be required to appear before Parliamentary Select Committees. I am accountable to the minister for the performance of DVLA in accordance with the framework document, which sets out the accountability and key relationships between DVLA and DfT. I am also required as Accounting Officer by HM Treasury’s Managing Public Money and the Government Financial Reporting Manual to provide a statement on how I have discharged my responsibility to manage and control the resources for which I am responsible during the year.
We are sponsored by DfT’s Roads, Devolution and Motoring Group which is also sponsor to the Driver and Vehicle Standards Agency (DVSA) and the Vehicle Certification Agency (VCA). We are responsible for providing driver licensing services in Great Britain and the registration of vehicles and collection of VED throughout the UK. Regular meetings are held with ministers to discuss the current issues and general progress. These are attended by our Non-Executive Chair, Chief Executive and DfT sponsor as required.
Driver licensing in Northern Ireland is a devolved power and is undertaken by the Driver and Vehicle Agency (DVA), sponsored by the Department of Infrastructure in Northern Ireland. However, responsibility for licensing and registering of vehicles in Northern Ireland lies directly with DfT Secretary of State.
Governance framework
I have ensured that our governance framework is designed to comply with the good practice guidance laid down in HM Treasury Corporate Governance in Central Government Departments: Code of Good Practice 2011.
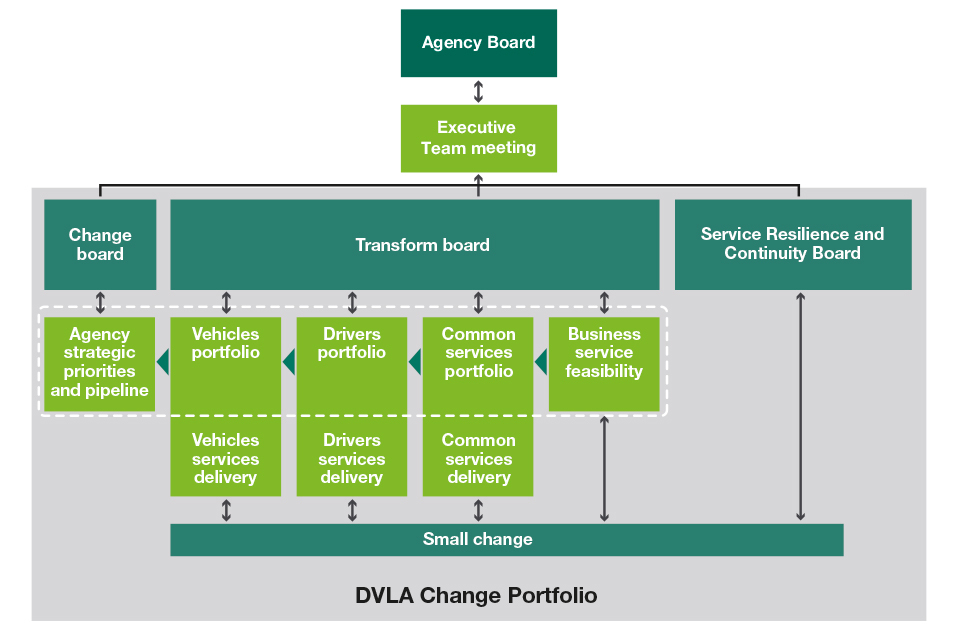
We are managed by a board and an Executive Team (ET). Our board is chaired by a Non-Executive Director. We have both strategic and business oversight responsibilities supported by the Audit and Risk Committee and the Remuneration Committee. Our ET is responsible for the day-to-day management in delivering our commitments to the government and the public as set out in our annual business plan. Our high level governance structure is given below.
Governance structure
Governance structure
DVLA board
Our board comprises a Non-Executive Chair, the Chief Executive, 6 Executive Directors and 3 independent Non-Executive Directors and focuses on our strategic direction. Our board gives assurance to the Secretary of State for Transport on the effectiveness with which our agency is run and is meeting our objectives. It holds the ET to account for the delivery of those objectives. The Non-Executive Chair is appointed by the Secretary of State. I appoint the Executive Directors with approval from the Permanent Secretary. Non-Executive Directors are recommended for appointment by the Chair to the DVLA Board, in partnership with the Director General of Roads, Devolution and Motoring at DfT. There is a clear demarcation between our DVLA Board and the ET.
Our board meets formally each month to consider:
- the strategic direction and plans, including oversight of our change agenda and progress against the business plan
- oversight of the key risks and issues identified by our ET and the effectiveness with which they are mitigated.
Our Executive Directors have specific areas of functional responsibility and accountability as below:
- Operations and Customer Services: Tony Ackroyd
- Human Resources and Estates: Phil Bushby (to 27 June 2016); Louise White (from 28 June 2016)
- Technology: Iain Patterson (to 29 February 2016); Dave Perry (from 03 June 2016). (See note)
- Strategy, Policy and Communications: Julie Lennard
- Finance: Rachael Cunningham; Tracy Nash (Interim from 25 May 2016 to 30 September 2016)
- Commercial and Business Development: Andrew Falvey.
The Non-Executive Chair and the 3 Non-Executive Directors act through the monthly board meetings and as members of the Audit and Risk Committee and Remuneration Committee and have private sector backgrounds:
- Lesley Cowley, Non-Executive Chair (appointed October 2014 and re-appointed October 2016) in leadership and digital transformation
- Jeremy Boss, Audit and Risk Committee Chair (appointed January 2016), in accountancy, audit, finance and IT
- Christopher Morson (appointed October 2013 and re-appointed in October 2016) in strategy and digital service transformation
- Emma West (appointed November 2014) in talent management and organisational development.
(Note: Oliver Morley assumed the role of SRO during the period from Iain Patterson leaving on the 29 February 2016 to Dave Perry joining on the 3 June 2016).
Executive Team
The ET meets formally each week and has responsibility and accountability for delivering our business plan. This is together with day-to-day management of the business. I chair this meeting and its membership is drawn exclusively from our Executive Directors.
The focus of these meetings changes and follows a regular weekly cycle which repeats itself each month:
- Week 1 – Change Portfolio Delivery and Investment Decisions
- Week 2 – Operations
- Week 3 – Finance and Commercial
- Week 4 – Human Resources, Estates, Policy and Communications
- Week 5 – Open agenda
This regular and consistent rhythm builds a strong team ethic with a keen focus on business issues driving productivity and delivering change.
Board and Audit and Risk Committee attendance
Figures denote meetings attended (meetings available to attend) between 1 April 2016 and 31 March 2017.
| Name | DVLA Board | Audit and Risk Committee |
|---|---|---|
| Lesley Cowley, Non-Executive Chair | 11 (11) | N/A |
| Oliver Morley, Chief Executive | 10 (11) | 3 (4) |
| Rachael Cunningham Tracy Nash (May 2016 to September 2016) |
6 (8) 2 (3) |
3 (3) 1 (1) |
| Phil Bushby (to June 2016) Louise White (from June 2016) |
3 (3) 8 (8) |
N/A N/A |
| Tony Ackroyd | 9 (11) | N/A |
| Julie Lennard | 11 (11) | N/A |
| Andrew Falvey | 10 (11) | N/A |
| Dave Perry | 9 (9) | N/A |
| Jeremy Boss, Non-Executive Director and Audit and Risk Committee Chairman | 11 (11) | 4 (4) |
| Christopher Morson, Non-Executive Director | 11 (11) | 3 (4) |
| Emma West, Non-Executive Director | 10 (11) | 3 (4) |
| Paul Rodgers, Independent Member | N/A | 4 (4) |
| Sarah Scullion, Independent Member (to June 2016) | N/A | 1 (2) |
| Helen John, Independent Member (from October 2016) | N/A | 2 (2) |
The ET has met 50 times in the year with non-attendance agreed in advance on an exceptional basis.
DVLA board effectiveness
The Chair meets regularly with the Non-Executive Directors to discuss their performance and to ensure we gain greatest value from their external perspectives and experience.
The board periodically undertakes self assessment reviews of its performance against Cabinet Office, National Audit Office and external good business practice guidance. The latest review was undertaken in December 2016. The review concluded there were no significant issues to address, and provided evidence of the growing maturity and effectiveness of the board, a view supported by external stakeholders. As in previous years the board has agreed a number of continuous improvement activities in the areas of strategic planning and development and external stakeholder engagement.
As Chief Executive, my role is to formally agree specific targets and success criteria with each ET member at the start of each year, directly from our published business plan and I review progress against these objectives with them at face-to-face monthly meetings.
Remuneration committee
The role of the remuneration committee is to make recommendations to DfT and myself on all aspects of remuneration decisions for our ET (including the Chief Executive) in accordance with current pay guidance and with particular regard to equal opportunities.
It also considers the wider talent in the organisation and ensures visibility in respect of potential successors into agency senior civil service positions.
The Committee will normally meet once a year in February, but may do so more often if necessary, at the discretion of the Chair.
Audit and Risk Committee
Our Audit and Risk Committee has formally agreed terms of reference which are reviewed on an annual basis. The Committee provides advice and support to the Chief Executive in discharging the responsibilities of our Accounting Officer.
The Audit and Risk Committee is comprised of 3 Non-Executive Directors and 2 independent members who are Senior Civil Servants (SCS) in other Government Departments. The members are:
- Jeremy Boss, Audit and Risk Committee Chair (appointed January 2016)
- Christopher Morson (appointed October 2013 and re-appointed in October 2016)
- Emma West (appointed November 2014)
- Paul Rodgers, accountancy and commercial operations (DfT SCS appointed October 2012)
- Sarah Scullion, human resources (DWP SCS appointed June 2013 retired June 2016)
- Helen John, sponsorship of arm’s length bodies and finance (DWP SCS appointed October 2016)
I attend along with the Finance Director and Head of Internal Audit as observers; National Audit Office and KPMG as sub-contracted auditors to National Audit Office. Other ET members attend as observers by rotation and when the committee has asked to discuss matters for which they are accountable. Representatives of DfT Finance have a standing invitation to attend every meeting.
The Audit and Risk Committee has access to all internal audit reports, major project assurance reports, external reviews, risk registers and management reports. The agenda follows a cyclical pattern for external reporting but consider the following at each of their 4 meetings:
- progress against assurance plans; adequacy of response to the risk register and that correct risks have been identified
- management responses and action progress against assurance reviews
- response to fraud and bribery threats
- ICT security and any breaches reported.
The Audit and Risk Committee challenges and approves the agency Management Assurance Statement and the Annual Report and Accounts.
Wider governance
DfT Sponsor helps ensure sufficient priority is afforded to operational delivery, progress towards business plan performance measures and the management of risk through regular challenge meetings with myself and the Finance Director.
We contribute monthly to DfT transparency reporting on progress towards financial targets and cash forecasting, expenditure and contracts in respect of our own activities. Our reports, together with emerging escalated risks and issues, are aggregated with those of other agencies and considered at DfT Executive Committee and Group Audit and Risk Committee as appropriate.
Managing our risks
Our risk policy is updated on an annual basis to ensure the risk management framework and approach to risk appetite is appropriately defined and remains effective. The current agency risk policy is published on our internal intranet site and remains aligned to the overarching DfT policy.
Risks are identified and managed at several levels and captured on a standard reporting template. There is an established process for escalating risks to the Corporate Risk Register which is reviewed by the Executive Team on a monthly basis and quarterly by our board and our Audit and Risk Committee.
The ET and board consider potential new risks that we face on an ongoing basis. A specific risk identification exercise was undertaken in August 2016 identifying risks to be included on the Corporate Risk Register.
The main risks at the 2016-17 year end included a number of inherent risks that we will always need to monitor. Such risks include ensuring robust business continuity plans are in place to address a range of potential disruptive scenarios; and the ongoing risks based around resource and resilience.
We have a continuous focus on the security and integrity of the data and information for which we are responsible. The Data Governance Board (DGB) provides the Senior Information Risk Owner (SIRO) and through the SIRO, the board with the necessary assurances in relation to the data and information for which we hold responsibility.
Significant risks are escalated as appropriate to DfT in accordance with requirements set by the Department and HM Treasury.
Managing the business – change and investment
We manage the introduction of change through the strategic pipeline along with assignment of strategic priority. The key features of this process are:
- a rolling pipeline of planned change including projects, contracts, business as usual and business development activities
- a fortnightly Change Board consisting of the ET and representatives from business, finance and Information Technology Services (ITS), which acts as the first decision making forum in the pipeline process
- a fortnightly Business Impact Panel (BIP) consisting of representatives from across the agency. This panel assesses the potential impact of any change and allocates up to £50k funding to initiate discovery work and validate the scope of any change, agree requirements and consider options for delivery. The outcome of the discovery enables investment decision making
- our business case process determines the appropriate governance route for each investment. A 3-stage business case process (following HM Treasury Green Book guidance) is undertaken for changes with a lifecycle cost greater than £1 million with smaller value investments requiring a cost benefits analysis
- all business cases are subject to internal specialist review and approval, prior to approval at the appropriate investment board, depending on value (for example, programme, Executive Team, DVLA Agency Board).
Governance model
Cabinet Office spending controls
In addition to the rules set out in Managing Public Money, Cabinet Office operates a set of additional spending controls.
We have worked with DfT and Cabinet Office spend approval teams (for digital and technology spend) to develop and pilot a new and more responsive spend control process. This has been based on our pipeline view of change and an assessment of our governance and controls. The pilot has run in parallel with the existing spend controls process and a positive outcome will enable rollout of the new pipeline approval across all change portfolios through 2017-18. We meet with DfT and Cabinet Office on a monthly basis to review individual projects and assess progress against spend plans, with quarterly assessments also being undertaken by Cabinet Office. This new approach allows DfT and Cabinet Office to concentrate on fewer, but higher profile items. Our change pipeline is key to this process by giving a forward view of change plans.
The Cabinet Office spend controls process requires Ministerial approval for ICT spend over a threshold of £5m. One issue was identified during the year with an element of the overall PACT exit spend not receiving appropriate approval. However, we have an excellent record in this space, being recognised as an exemplar across government, as evidenced by the pilot mentioned above and our very positive record since April 2015 to March 2017, receiving approval for 48 different ICT initiatives with a total value of £168m.
Financial controls
Review of operational budgets and project affordability takes place at the monthly finance ET meeting with confirmation of affordability given by the Finance Director. Budgetary controls are supported by a robust and formal full monthly planning and re-forecasting cycle, monitoring volume and change demand. A summary of the results are reported monthly to our board.
As the Accounting Officer, I hold a letter of Financial Delegation issued by the Permanent Secretary of DfT. I sub-delegate financial delegations to Executive Directors and key finance staff.
Staff who have been allocated a delegation must ensure that they have completed the mandatory training programme and been assessed to ensure competence to fulfil the role.
We have developed and implemented a strategy and framework for the analytical assurance of both business case models and statistic reports. The framework details roles and responsibilities and ensures we enshrine the principles of the Macpherson Review in the day-to-day operation of our business. We ensure a robust body of documentation is available for audit. Analytical assurance statements are produced as standard reflecting best practice. Specialist review sign-off of business cases ensures analytical assurance is undertaken before investment decisions being made. A periodic review is undertaken assessing our organisation’s business models against DfT criteria to establish if the model in question is classified as ‘business critical’. At present we do not have any models classed as ‘business critical’.
Shared Services
Since divestment, Shared Services has provided services to DfT and DVLA. Commercial discussions with Arvato have been concluded and both platforms are to be maintained with DfT managing the contract directly. This has led to DfT being in control of ensuring continuity of service; standardisation of process; securing value for money; and its future direction.
As the framework authority, DfT Accounting Officer is now responsible for providing DfT and DVLA, with assurance that Independent Shared Service Centre (ISSC) 1 is meeting its contractual obligations. The DfT Accounting Officer is supported in this role by a dedicated Shared Service Audit Committee.
DfT has received an International Standards of Assurance Engagement (ISAE) 3402 report produced by KPMG on Arvato’s operation of the control environment at ISSC1. DfT has also received a number of internal audit reports on ISSC1 risk controls. DVLA has placed reliance on these reports for assurance over ISSC1’s control environment during the 2016-17 financial year.
Commercial controls
As a central government body, our commercial activity is governed by legislation within the Public Contracts Regulations 2015. Governance and control of commercial activity is administered by the Commercial Directorate and overseen by the Commercial Director.
Our Commercial Directorate is responsible for ensuring that commercial practice is compliant with the regulations. In line with the government’s transparency agenda, all tender opportunities are published, including single tender actions and contracts over £10,000.
The Commercial Directorate has developed Commercial Procedures and a Commercial Policy which act as the 2 primary control documents governing commercial activity.
Contractual authority emanates from me as Accounting Officer and is delegated to individuals in specific posts (primarily Commercial Director, Head of Procurement and senior commercial managers) and is not transferable. Only those with contractual authority are allowed to commit us to any commercial activity. Contractual authority is distinct from financial authority and no individual is permitted to exercise both for the same requirement.
We have developed an efficient and effective practice whereby all contracts are sponsored at ET level. This is supplemented by making day-to-day contract management the shared responsibility of a business owner and a professional Commercial Advisor from within Commercial Directorate; supported by a professional Financial Advisor.
Data controls
The governance arrangements for control of data have not changed significantly. Embedded processes whilst under constant review have proved fit for purpose and are mature.
The SIRO who is also the Director of Strategy, Policy and Communications is accountable for information risk and is supported by a Chief Information Security Officer (CISO) and Information Asset Owners (IAO’s) the latter being accountable for the day to day control of information.
Data control and risk is co-ordinated through a DGB chaired by the SIRO and attended by subject matter experts from across the organisation. The Chief Executive also attends this board.
There have been 15 incidents of personal data breaches this year which is a decrease from last year (21 in 2015-16). All of these breaches have been low volume and largely attributed to human error, none required reporting to the Information Commissioners’ Office.
The threats to our information from both criminal and other activity are increasing globally. Our controls are under constant review with privacy impact assessments being made for data releases, new systems or changes to existing processes. This allows us to adjust control frameworks ranging from contractual arrangements to technical controls as needed.
With the increasing threats to personal data globally we have focused on awareness and training for staff with various events across the agency such as security awareness week. We have targeted training events for our IAO’s and Information Assurance Staff. In addition all staff have to pass an annual assessment on information security principles and best practice with the pass mark set at 80%. This assessment is also used to raise awareness of current risk and threat trends.
Looking forward we have started preparatory work for compliance with the General Data Protection Regulation coming into force during 2018. As part of this preparation we are reviewing our ISO27001 compliance against our core datasets.
Fraud, error and debt
The management of fraud, error and debt is a critical part of good governance. Losses and recoveries are reported to Cabinet Office. Overall responsibility for our management of this area sits with the Director of Strategy, Policy and Communications, supported by a cross-agency Fraud, Error and Debt Board.
Counter fraud initiatives and fraud investigations are taken forward by the Fraud Policy and Investigations Team, often in liaison with our operational Criminal Intelligence Officers. The Government Internal Audit Agency (GIAA) provides support and input to fraud investigations, advising on aspects of control and risk management.
The Fraud Policy and Investigations team review all changes initiatives and work closely with individual business areas to fraud risk assess business processes, providing support and advice on fraud mitigation. The team is currently working with DfT to review the new government counter fraud standards which will be in place from April 2017. These are being rolled out to standardise and improve counter fraud practices across government and we will be assessing current processes in line with these standards. A new Government Counter Fraud profession will also be introduced in 2017.
Accounting Officer assurance
The system of internal control is designed to manage risk to a reasonable level, rather than to eliminate all risk. It should provide reasonable and not absolute assurance of effectiveness. The system of internal control supports the achievement of our policies, aims and objectives, whilst safeguarding the funds and assets of the organisation, in accordance with HM Treasury’s Managing Public Money.
As Accounting Officer for DVLA, I have responsibility for reviewing the effectiveness of the systems of internal control. This is primarily informed by our internal audit reviews, along with the management assurance reporting of our managers who are responsible for the development and maintenance of the internal control framework.
Twice a year, a Management Assurance Statement review is undertaken to review all facets of management assurance, policy and practice. The 2016-17 Management Assurance Statement review asked our senior managers to provide performance commentary and evidence on the application of 40 aspects of assurance. There were 31 areas of substantial assurance and 9 areas of assurance were classed as moderate. Responses were compiled by subject matter experts, challenged by internal audit, ET, DfT and signed off by Audit and Risk Committee. The areas with moderate assurance (and not substantial) correspond with internal audit expectations. Action plans are in place to address any further improvements where required.
Audit and Risk Committee
Our board and Audit and Risk Committee assist in developing and overseeing governance assurance processes and the plans to address any identified weaknesses. This ensures that continual improvement of the systems remains a priority.
These processes apply to all our activities and transactions in the Business Account and Trust Statement. The Chair of the Audit and Risk Committee reports regularly to the board on the Audit and Risk Committee’s views on the effectiveness of our governance, risk management and internal control arrangements.
Internal audit
Our internal audit team are now part of the GIAA. This move increases the independence of the internal audit function and follows wider government priorities for internal audit services within the Civil Service. Benefits include greater consistency and joined up working for the provision of internal audit services across government.
The internal audit team operates to prescribed Public Sector Internal Audit Standards and complies with procedures and standards set by the GIAA. The internal audit report provides me with an independent and objective opinion on the adequacy and effectiveness of our system of internal control, together with recommendations agreed to by management for improvement to address identified areas of risk or control enhancement.
The Head of Internal Audit has unfettered access to the Chair of the Audit and Risk Committee and as Accounting Officer, I also work closely with the DfT Group Chief Internal Auditor within GIAA. The audit plan for the year is informed by the main risks to our business and encompasses a broad range of internal controls. This includes assurance over the security and use of our data, as well as contractual commitments and data protocols for those organisations that interact with us.
Head of Internal Audit opinion
On the basis of the evidence obtained during 2016-17 the Head of Internal Audit was able to provide a moderate level of assurance that the framework of governance, risk management and control is appropriately defined and working effectively throughout 2016-17.
The Head of Internal Audit has advised that this opinion reflects the maturity of our Risk Management Framework; and our continued focus on further strengthening existing governance arrangements.
Established key controls were found to be generally working effectively but with some improvements required to enhance the adequacy and effectiveness of the framework of governance, risk management and control. The areas for further improvements and which would benefit from strengthening procedural controls are predominantly areas impacted by the significant change. There have been notable improvements in IT functions after being brought in-house as a result of the exit from the PACT contract. This reflects a change in leadership within Information Technology Services; focussing on harmonising IT services combined with organisational restructure.
The cases where internal audit identified the need for control enhancements were not deemed significant in the context of the overall control environment. Where enhancements were proposed, corrective action has been agreed with management. Delivery against those actions is monitored closely by the Executive Team and where relevant, by the appropriate governance board (such as the DGB and Audit and Risk Committee).
Actions agreed with management against weaknesses identified as part of the internal audit programme have contributed to the overall assurance reported within this Governance Statement.
Monitoring of specific control issues
The Agency identified during the year that an element of the PACT exit costs relating to expenditure incurred on operational transition services, owing to an omission, did not have full and appropriate prospective ICT spend approval from Cabinet Office. However the Agency did receive Cabinet Office approval for the wider PACT Exit project. Cabinet Office was immediately informed and the Agency pursued this approval through the established retrospective approvals process offered under Cabinet Office guidelines; however retrospective approval was not received. Procedures have subsequently been reviewed.
A number of ‘deep dive’ internal audit review activities during 2016-17 have identified instances where we could make further control improvements. These have covered specific actions to address very specific control issues – predominantly (not limited to) those areas that have been the transition of IT services. Management have agreed actions to take forward; and are closely monitored in line with the established arrangements described above.
In the opinion of the Head of Internal Audit there are no further significant weaknesses that fall within the scope of issues that should be reported here.
4. Remuneration and staff report
Remuneration report
Remuneration policy
The remuneration of senior civil servants is set by the Prime Minister following independent advice from the review body on senior salaries.
The review body takes account of the evidence it receives about wider economic considerations and the affordability of its recommendations. Further information about the work of the review body can be found at Office of Manpower Economics.
We have our own remuneration committee in line with board best practice, chaired by a Non-Executive Director. Further details can be found within the Governance Statement.
Service contracts
Civil Service appointments are made in accordance with the Civil Service Commissioners’ Recruitment Code, it requires appointments to be based on fair and open competition but also includes the circumstances when appointments may otherwise be made. Unless otherwise stated below, the officials covered by this report hold appointments that are open-ended. Early termination, other than for misconduct, would result in the individual receiving compensation as set out in the Civil Service Compensation Scheme. The standard period of notice to be given by directors is 3 months.
Salary and pension entitlements
The remuneration and pension interests of the Chief Executive and directors are set out below.
The senior civil servant annual pay award bonus is determined by performance. These pay award bonuses are awarded to the top 25% of senior civil servants. They are made to reward in-year performance in relation to agreed objectives, or short-term personal contributions to wider organisational objectives.
Salary
Salary includes gross salary, overtime, recruitment and retention allowances and any other allowance to the extent that it is subject to UK taxation. This report is based on payments made by us and recorded in these accounts. The directors did not receive any non-cash benefits during the current or prior year.
Performance bonus
Performance is assessed annually for directors through the appraisal processes. These are stipulated by DfT and entitlement to performance enhancements or bonuses established in comparison across the DfT family is through the departmental evaluation committee, chaired by the Permanent Secretary. Our remuneration committee provides advice to DfT on performance of directors.
Civil Service pensions

Pension benefits are provided through the Civil Service pension arrangements. From 1 April 2015 a new pension scheme for civil servants was introduced – the Civil Servants and Others Pension Scheme (CSOPS) or alpha, which provides benefits on a career average basis with a normal pension age equal to the member’s State Pension Age (or 65 if higher). From that date all newly appointed civil servants and the majority of those already in service joined alpha. Before that date, civil servants participated in the Principal Civil Service Pension Scheme (PCSPS). The PCSPS has 4 sections: 3 providing benefits on a final salary basis (classic, premium or classic plus) with a normal pension age of 60 and one providing benefits on a whole career basis (nuvos) with a normal pension age of 65.
These statutory arrangements are unfunded with the cost of benefits met by monies voted by Parliament each year. Pensions payable under classic, premium, classic plus, nuvos and alpha are increased annually in line with Pensions Increase legislation. Existing members of the PCSPS, who were within 10 years of their normal pension age on 1 April 2012, remained in the PCSPS after 1 April 2015. Those who were between 10 years and 13 years and 5 months from their normal pension age on 1 April 2012 will switch into alpha sometime between 1 June 2015 and 1 February 2022. All members who switch to alpha have their PCSPS benefits ‘banked’, with those with earlier benefits in one of the final salary sections of the PCSPS having those benefits based on their final salary when they leave alpha. The pension figures quoted for officials show pension earned in PCSPS or alpha – as appropriate. Where the official has benefits in both the PCSPS and alpha the figure quoted is the combined value of their benefits in the 2 schemes. Members joining from October 2002 may opt for either the appropriate defined benefit arrangement or a ‘money purchase’ stakeholder pension with an employer contribution (partnership pension account).
Employee contributions are salary-related and range between 3.8% and 8.05% of pensionable earnings for members of classic (and members of alpha who were members of classic immediately before joining alpha) and between 4.6% and 8.05% for members of premium, classic plus, nuvos and all other members of alpha. Benefits in classic accrue at the rate of 1/80th of final pensionable earnings for each year of service. In addition, a lump sum equivalent to 3 years initial pension is payable on retirement. For premium, benefits accrue at the rate of 1/60th of final pensionable earnings for each year of service. Unlike classic, there is no automatic lump sum. Classic plus is essentially a hybrid with benefits for service before 1 October 2002 calculated broadly as per classic and benefits for service from October 2002 worked out as in premium.
In nuvos a member builds up a pension based on their pensionable earnings during their period of scheme membership. At the end of the scheme year (31 March) the member’s earned pension account is credited with 2.3% of their pensionable earnings in that scheme year and the accrued pension is uprated in line with Pensions Increase legislation. Benefits in alpha build up in a similar way to nuvos, except that the accrual rate is 2.32%. In all cases members may opt to give up (commute) pension for a lump sum up to the limits set by the Finance Act 2004.
The partnership pension account is a stakeholder pension arrangement. The employer makes a basic contribution of between 8% and 14.75% (depending on the age of the member) into a stakeholder pension product chosen by the employee from a panel of providers.
The employee does not have to contribute, but where they do make contributions, the employer will match these up to a limit of 3% of pensionable salary (in addition to the employer’s basic contribution). Employers also contribute a further 0.5% of pensionable salary to cover the cost of centrally-provided risk benefit cover (death in service and ill health retirement).
The accrued pension quoted is the pension the member is entitled to receive when they reach pension age or immediately on ceasing to be an active member of the scheme if they are already at or over pension age. Pension age is 60 for members of classic, premium and classic plus, 65 for members of nuvos and the higher of 65 or State Pension Age for members of alpha. The pension figures quoted for officials show pension earned in PCSPS or alpha – as appropriate. Where the official has benefits in both the PCSPS and alpha, the figure quoted is the combined value of their benefits in the 2 schemes, but note that part of that pension may be payable from different ages.
For further details about the Civil Service pension arrangements visit civilservicepensionscheme.org.uk.
Cash Equivalent Transfer Values
A Cash Equivalent Transfer Value (CETV) is the actuarially assessed capitalised value of the pension scheme benefits accrued by a member at a particular point in time. The benefits valued are the member’s accrued benefits and any contingent spouse’s pension payable from the scheme. A CETV is a payment made by a pension scheme or arrangement to secure pension benefits in another pension scheme or arrangement when the member leaves a scheme and chooses to transfer the benefits accrued in their former scheme. The pension figures shown relate to the benefits that the individual has accrued as a consequence of their total membership of the pension scheme, not just their service in a senior capacity to which disclosure applies.
The figures include the value of any pension benefit in another scheme or arrangement which the member has transferred to the Civil Service pension arrangements. They also include any additional pension benefit accrued to the member as a result of their buying additional pension benefits at their own cost. CETVs are worked out in accordance with The Occupational Pension Schemes (Transfer Values) (Amendment) Regulations 2008 and do not take account of any actual or potential reduction to benefits resulting from lifetime allowance tax which may be due when pension benefits are taken.
Real increase in CETV
This reflects the increase in CETV that is funded by the employer. It does not include the increase in accrued pension due to inflation, contributions paid by the employee (including the value of any benefits transferred from another pension scheme or arrangement) and uses common market valuation factors for the start and end of the period.
Remuneration of the Executive board members – audited
Single total figure of remuneration
| Salary | Performance bonus | Pension benefits | Total | |||||
|---|---|---|---|---|---|---|---|---|
| 2016-17 £000 |
2015-16 £000 |
2016-17 £000 |
2015-16 £000 |
2016-17 £000 |
2015-16 £000 |
2016-17 £000 |
2015-16 £000 |
|
| Chief Executive Oliver Morley¹ |
130-135 | 130-135 | 15-20 | 10-15 | 20-25 | 20-25 | 165-170 | 165-170 |
| Executive board members | ||||||||
| Rachael Cunningham Finance Director |
80-85 | 80-85 | 10-15 | - | 30-35 | 35-40 | 120-125 | 115-120 |
| Louise White HR and Estates Director (from 27 September 2016) previously Acting HR and Estates Director (from 28 June 2016) |
60-65 (80-85 FYE²) | - | - | - | 90-95 | - | 170-175 | - |
| Andrew Falvey Commercial Director (from 12 May 2015, interim Commercial Director from 5 May 2014) |
75-80 | 75-80 | - | - | 30-35 | 25-30 | 105-110 | 105-110 |
| Tony Ackroyd Operations and Customer Services Director |
85-90 | 85-90 | 10-15 | - | 30-35 | 30-35 | 135-140 | 120-125 |
| Julie Lennard Strategy, Policy and Communications Director |
80-85 | 80-85 | 10-15 | 10-15 | 30-35 | 30-35 | 125-130 | 125-130 |
| Dave Perry¹ Chief Technology Officer (from 3 June 2016) |
105-110 (125 – 130 FYE²) | - | - | - | 5-10 | - | 110-115 | - |
| Tracy Nash Interim Finance Director (25 May 2016 to 30 September 2016) |
20-25 (70-75 FYE²) | - | - | - | 5-10 | - | 30-35 | - |
| Phil Bushby HR and Estates Director (to 27 June 2016) |
15-20 (70-75FYE²) | 70-75 | - | - | 0-5 | 30-35 | 20-25 | 100-105 |
| Iain Patterson³ Director of Technology (to 29 February 2016) |
- | 105-110 (115-120 FYE²) | - | 5-10 | - | 45-50 | - | 160-165 |
¹ Does not participate in the PCSPS.
² Full year equivalent.
³ Iain Patterson was employed by GDS as a full-time civil servant and was seconded to DVLA until 29 February 2016. He was paid directly by GDS.
Bonuses relate to those paid in 2016-17 in respect of 2015-16 performance. Bonuses to be paid in 2017-18 in respect of 2016-17 performance are yet to be determined. There were no benefits in kind.
Pension benefits included in the table above represent the actuarially assessed increase in pension benefits at retirement age arising due to in-year service, calculated as per Finance Act 2013 rules.
Median staff pay multiples - audited
| 2016-17 | 2015-16 | |
|---|---|---|
| Band of highest paid director total remuneration (£000) | 145 - 150 | 145 - 150 |
| Median total remuneration (£) | 20,566 | 21,234 |
| Ratios | 7.17 | 6.95 |
| Number of employees receiving remuneration in excess of highest paid Director | - | - |
| Remuneration range for employees excluding highest paid director (£000) | 16 - 127 | 17 - 138 |
Total remuneration within the calculation includes salary, non-consolidated performance related pay and benefits-in-kind. It does not include employer pension contributions and the cash equivalent transfer value of pensions.
The above ratios report the mid-point banded remuneration of the highest paid director in relation to the median remuneration of our staff. The ratios are a reflection of the composition, by grade, of individuals employed by us.
Pension benefits of the Executive board members – audited
| Real increase in pension and related lump sum at age 60 during year | Total accrued pension at age 60 and lump sum at 31/3/17 | Cash Equivalent Transfer Values (CETV) | Real increase in CETV as funded by employer in year | Employer contribution to partnership pension account | ||
|---|---|---|---|---|---|---|
| £000 | £000 | At 31/3/17 £000 |
¹At 31/3/16 £000 |
£000 | (To the nearest £100) £ |
|
| Oliver Morley² | N/A | N/A | N/A | N/A | N/A | £21,800 |
| Rachael Cunningham | 0.2.5 | 15-20 | 233 | 207 | 13 | - |
| Louise White | 2.5 – 5 plus a lump sum of 7.5-10 | 30-35 plus a lump sum of 85-90 | 553 | 468 | 62 | - |
| Andrew Falvey | 0-2.5 | 10-15 | 183 | 151 | 21 | - |
| Tony Ackroyd | 0-2.5 | 5-10 | 81 | 50 | 23 | - |
| Julie Lennard | 0-2.5 | 10-15 | 167 | 144 | 14 | - |
| Dave Perry² | N/A | N/A | N/A | N/A | N/A | 5,700 |
| Tracy Nash | 0-2.5 | 10-15 | 163 | 153 | 3 | - |
| Phil Bushby | 0-2.5 | 10-15 | 172 | 159 | 1 | - |
| Iain Patterson | - | - | - | 78 | - | - |
¹ Or at date of appointment as director if later.
² Does not participate in the PCSPS.
Remuneration of the Non-Executive board members – audited
| 2016-17 | 2015-16 | |
|---|---|---|
| £000 | £000 | |
| Lesley Cowley | 35 - 40 | 30 - 35 |
| Mike Brooks (i) | - | 10 - 15 |
| Christopher Morson | 15 - 20 | 20 - 25 |
| Emma West | 15 - 20 | 10 - 15 |
| Jeremy Boss (ii) | 10 - 15 | 0 - 5 |
The above include travel and subsistence expenses in accordance with civil service rates.
(i) Includes remuneration in respect of DfT activities. Mike Brooks resigned on 30 September 2015
(ii) Jeremy Boss became a Non-Executive board member in January 2016.
Staff report
We employ 5,351 full- time equivalent staff in Swansea. We are one of the largest employers in the Swansea area.
Our strategic plan going forward is to gradually reduce our headcount as we realise the benefits of increased digitalisation and more efficient processes. We will look to achieve an overall headcount of 5,000 full time equivalents which will be driven by both natural attrition rates and through re-shaping the organisation.
While we will keep tight controls on our workforce, we are prepared to see new jobs created where new externally funded opportunities arise and through the in-sourcing of IT activities. If we take on new activities then this would potentially offset any reductions.
| Workforce 2014-17 (Full-time equivalents) | |
|---|---|
| March 2014 | 4,965 |
| March 2015 | 5,147 |
| March 2016 | 5,430 |
| March 2017 | 5,351 |
Number of senior civil service staff by band
| SCS band | 2016-17 | 2015-16 |
|---|---|---|
| Band 2 | 1 | 1 |
| Band 1 | 6 | 7 |
| Total Number | 7 | 8 |
Staff composition by gender – board members, directors and senior civil servants and all grades
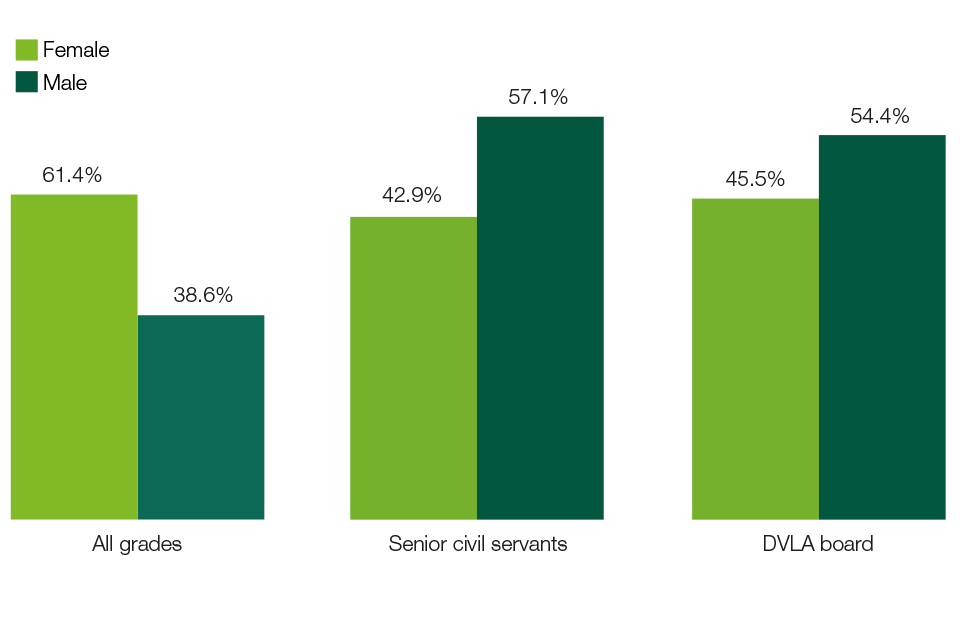
Staff composition by gender
Staff numbers and related costs – audited
Staff costs and average number of whole-time equivalent persons employed during the year, excluding staff managed by DfT, comprise:
| Permanently employed staff £000 |
Short-term employment contract and agency staff £000 |
2016-17 total £000 |
|
|---|---|---|---|
| Wages and salaries | 137,903 | 5,698 | 143,601 |
| Social security costs | 11,674 | 123 | 11,797 |
| Other pension costs (i) | 24,483 | 466 | 24,949 |
| Total 3 | 174,060 | 6,287 | 180,347 |
| FTEs | FTEs | FTEs | |
| Total directly employed | 5,351 | 160 | 5,511 |
3 Total staff costs shown above are net of £274,000 capitalised costs in year.
(i) Includes the impact of The New Fair Deal policy that allows employees who are transferred from the public sector to a non-public sector employer under TUPE terms to continue to access their previous public sector pension scheme. It also covers employees who transfer back to the public sector from a private employer.
| Permanently employed staff £000 |
Short-term employment contract and agency staff £000 |
2015-16 total £000 |
|
|---|---|---|---|
| Wages and salaries | 130,014 | 2,323 | 132,337 |
| Social security costs | 8,211 | 91 | 8,302 |
| Other pension costs (i) | 26,432 | 388 | 26,820 |
| Total 4 | 164,657 | 2,802 | 167,459 |
| FTEs | FTEs | FTEs | |
| Total directly employed | 5,262 | 143 | 5,405 |
4Total staff costs shown above are net of £112,000 capitalised costs in year.
The PCSPS and CSOPS – known as ‘alpha’ are unfunded multi-employer defined benefit schemes but we are unable to identify its share of the underlying assets and liabilities. The scheme actuary valued the scheme as at 31 March 2016. Details can be found in the resource accounts of the Cabinet Office: Civil Superannuation.
For 2016-17, employers’ contributions of £26.1 million were payable to the PCSPS (2015-16: £25.0 million) at one of four rates in the range 20% to 24.5% (2015-16: 20.0% to 24.5%) of pensionable pay, based on salary bands. The scheme’s actuary reviews employer contributions usually every 4 years following a full scheme valuation. The contribution rates are set to meet the cost of the benefits accruing during 2016-17 to be paid when the member retires and not the benefits paid during this period to existing pensioners.
Employees can opt to open a partnership pension account, a stakeholder pension with an employer contribution. Employers’ contributions of £320,435 (2015-16: £277,831) were paid to one or more of a panel of 3 appointed stakeholder pension providers. Employer contributions are age-related and ranged from 8% to 14.75% (2015-16: 3.0% to 12.5% up to 30 September 2015 and from 8.05 to 14.75% from 1 October 2015). Employers also match employee contributions up to 3% of pensionable pay. In addition, employer contributions of £10,790 – 0.5% of pensionable pay (2015-16: £10,100 – 0.5%) were payable to the PCSPS to cover the cost of the future provision of lump sum benefits on death in service and ill health retirement of these employees.
Civil Service and other compensation schemes – exit packages - audited
Comparative data is shown in brackets for previous year.
| Exit package cost band (£) | Number of compulsory redundancies agreed | Number of other departures agreed | Total number of exit packages by cost band (Total cost) |
|---|---|---|---|
| <10,000 | - (-) | 12 (-) | 12 (-) |
| 10,000 – 25,000 | - (-) | 45 (12) | 45 (12) |
| 25,000 – 50,000 | 1 (-) | 55 (34) | 56 (34) |
| 50,000 – 100,000 | - (-) | 39 (44) | 39 (44) |
| 100,000 – 150,000 | - (-) | 2 (-) | 2 (-) |
| Total number of exit packages by type | 1 (-) | 153 (90) | 154 (90) |
| 2016-17 Total cost (£) | 28,512 | 5,609,936 | 5,638,448 |
| 2015-16 Total cost (£) | 4,345,664 |
Redundancy and other departure costs have been agreed in accordance with the provisions of the Civil Service Compensation Scheme, a statutory scheme made under the Superannuation Act 1972. Exit costs are accounted for in full in the year of departure. Where we have agreed early retirements, the additional costs are met by us and not by the civil service pension scheme. Ill-health retirement costs are met by the pension scheme and are not included in the table.
Consultancy expenditure
Expenditure on consultancy is shown in note 3 of the Business Account.
Off-payroll engagement
Off-payroll engagements as of 31 March 2017, for more than £220 per day and that last longer than 6 months.
The following table summarises the situation on off-payroll engagements as at 31 March.
| 31 March 2017 | 31 March 2016 | |
|---|---|---|
| Number of existing engagements as of 31 March | 31 | 4 |
| Number that have existed for less than one year at time of reporting | 28 | 3 |
| Number that have existed for between one and two years at time of reporting | 3 | 1 |
All existing off-payroll engagements, outlined above, have at some point been subject to a risk based assessment. This is to determine whether assurance is required that the individual is paying the right amount of tax and where necessary, that assurance has been sought.
New off-payroll engagements, or those that reached six months in duration, between 1 April and 31 March for more than £220 per day and that last for longer than six months
| 2016-17 | 2015-16 | |
|---|---|---|
| Number of new engagements, or those that reached six months in duration, between 1 April and 31 March | 31 | 4 |
| Number of the above which include contractual clauses giving the department the right to request assurance in relation to income tax and National Insurance obligations | 31 | 4 |
| Number for whom assurance has been requested and received | 31 | 4 |
Off-payroll engagements of board members and/or senior officials with significant financial responsibility, between 1 April and 31 March
| 2016-17 | 2015-16 | |
|---|---|---|
| Number of off-payroll engagements of board members, and/or, senior officials with significant financial responsibility, during the financial year. | - | - |
| Total number of individuals on payroll and off-payroll that have been deemed board members and/or, senior officials with significant financial responsibility, during the financial year. This figure should include both on payroll and off-payroll engagements. | 13 | 12 |
Sick absence
During 2016-17, we focused on the issues that were causing high levels of sickness absence, with the aim of maximising attendance whilst addressing these issues.
Our target for the year was to reduce the number of working days lost (by full time equivalents) due to sick absence by 0.5 against the 2015-16 baseline. Despite close monitoring and interventions, the number of days lost due to sick absence in 2016-17 was 8.40 against a target of 8.13.This was a reduction of 0.2 days against the 2015-16 figure of 8.6. This was a disappointing result for us. Support and activities carried out during the year included:
- a staff survey on stress and its causes was used to inform initiatives
- in partnership with Public Health Wales, an ACTivate programme on how to manage mental health issues
- alcohol ‘brief intervention’ courses
- NHS awareness – education on Dementia Friends and Carers Associations
- coping with bereavement –advice and guidance to staff and managers
- time to Change Wales – launch of their ‘Reach Out’ campaign and the training of mental health champions across the business
- occupational health and employee assistance programmes.
Policy and procedure for staff
Our key source of information for employees is the staff handbook, which includes terms and conditions, procedures and guidance about the employment relationship. The trade union is informed and consulted on changes which may affect the people they represent.
During the year, discipline and grievance policies were introduced with an emphasis on simpler, time-bound processes and more practical guidance for managers and staff.
In November 2016, we successfully transferred our HR casework service provision from DfT to the Ministry of Justice (MoJ).
We also revised our corporate induction in line with our strategic plan for modernising the workplace. This has been developed through evaluation and input from key stakeholders including observing and researching organisation approaches across the public and private sector.
Communication
We have a central corporate communications team that manages a core set of channels to provide staff with regular communications aligned to agency strategy. Channels of communication include digital internal news pages, live web chats, policy and procedures, staff articles and real time information and advice. Staff have access to both digital and paper based anonymous channels to raise concerns that require information.
Diversity

During the year we continued to drive for a diverse workforce representative of the community in which we are based. The focus is on gender equality at all levels in our organisation and increasing the numbers of black, Asian, minority and ethnic people we employ.
We appointed a gender equality representative at Director level and continue to focus on attracting under-represented groups through recruitment campaigns.
We partner with a range of local community groups to provide work placements, providing training and work experience. Engagement with local community groups has successfully culminated in the launch of our Employability Skills Programme. This supports job seekers from different groups to get ‘job ready’. In doing this we have created a great opportunity for our staff to get involved in volunteering with the local community.
In recognition of our diverse workforce and to raise awareness and make a difference, we celebrated National Inclusion Week, inviting national and local organisations including:
- South Wales Police
- Unity group Wales, Women’s Aid
- The Environment Agency
- Swansea Bay Regional Equality Council
- University of the 3rd Age
- Alzheimer’s Society.
Learning and development
As part of the Civil Service Reform Plan, every civil servant should spend at least 5 days a year on their own learning and development. This helps to target those skills they need for their current and future roles. This can be met through many forms of learning, from e-learning to traditional training, team activities and coaching.
During the year, we have continued to deliver face-to-face courses, combined with e-learning, coaching and mentoring.
To strengthen our leadership capability, we delivered several leadership programmes:
- Leading with Purpose
- Talent and development
- Commercial Directorate ‘Class of 16’ designed to improve leadership capability
- In collaboration with diversity and inclusion staff networks, speed mentoring sessions.

158 apprentices were enrolled during 2016-17, 59 were externally recruited and 99 internal staff were converted onto apprentice programmes. In 2016, 3 of our apprentices gained special recognition in the DfT National Apprentice awards. We also held the DVLA apprentice awards and a speed mentoring event during National Apprenticeship Week 2017.
5. Parliamentary accountability and audit report
Losses and special payments – audited
| 2016-17 Number of cases | 2016-17 Value £ |
2015-16 Number of cases | 2015-16 Value £ |
|
|---|---|---|---|---|
| Losses written off in year | ||||
| Cash losses due to abandoned claims for payments from customers (i) | 11,426 | 536,529 | 6,526 | 263,513 |
| Special payments | ||||
| Ex-gratia payments (ii) | 1,409 | 225,363 | 1,325 | 254,023 |
| Personal injury compensation | 2 | 12,000 | 2 | 6,540 |
(i) Cash losses mainly relate to small underpayments from customers which are considered too small to pursue. The increase in value for 2016-17 is due to the write off of direct debit indemnities for Vehicle Excise Duty.
(ii) Ex-gratia payments are made to customers (without legal liability) in recognition of errors on the part of DVLA.
Constructive losses – audited
There are no constructive losses.
Fees and charges – audited
Fees and charges income and confirmation of compliance with cost allocation and charging requirements are shown in note 2 of the Business Account.
Oliver Morley CBE
Accounting Officer and Chief Executive, DVLA
28 June 2017
Certificate and Report of the Comptroller and Auditor General to the House of Commons
Business Account
I certify that I have audited the financial statements of the Driver and Vehicle Licensing Agency for the year ended 31 March 2017 under the Government Resources and Accounts Act 2000. The financial statements comprise: the Statements of Comprehensive Net Expenditure, Financial Position, Cash Flows, Changes in Taxpayers’ Equity; and the related notes. These financial statements have been prepared under the accounting policies set out within them. I have also audited the information in the Remuneration and Staff Report and the Parliamentary Accountability Disclosures that is described in that report as having been audited.
Respective responsibilities of the Accounting Officer and auditor
As explained more fully in the Statement of Accounting Officer’s Responsibilities, the Chief Executive as Accounting Officer is responsible for the preparation of the financial statements and for being satisfied that they give a true and fair view. My responsibility is to audit, certify and report on the financial statements in accordance with the Government Resources and Accounts Act 2000. I conducted my audit in accordance with International Standards on Auditing (UK and Ireland). Those standards require me and my staff to comply with the Auditing Practices Board’s Ethical Standards for Auditors.
Scope of the audit of the financial statements
An audit involves obtaining evidence about the amounts and disclosures in the financial statements sufficient to give reasonable assurance that the financial statements are free from material misstatement, whether caused by fraud or error. This includes an assessment of: whether the accounting policies are appropriate to the Driver and Vehicle Licensing Agency’s circumstances and have been consistently applied and adequately disclosed; the reasonableness of significant accounting estimates made by the Accounting Officer; and the overall presentation of the financial statements. In addition I read all the financial and non-financial information in the Annual Report to identify material inconsistencies with the audited financial statements and to identify any information that is apparently materially incorrect based on, or materially inconsistent with, the knowledge acquired by me in the course of performing the audit. If I become aware of any apparent material misstatements or inconsistencies I consider the implications for my certificate.
I am required to obtain evidence sufficient to give reasonable assurance that the expenditure and income recorded in the financial statements have been applied to the purposes intended by Parliament and the financial transactions recorded in the financial statements conform to the authorities which govern them.
Opinion on regularity
In my opinion, in all material respects the expenditure and income recorded in the financial statements have been applied to the purposes intended by Parliament and the financial transactions recorded in the financial statements conform to the authorities which govern them.
Opinion on financial statements
In my opinion:
- the financial statements give a true and fair view of the state of Driver and Vehicle Licensing Agency’s affairs as at 31 March 2017 and of the net operating income for the year then ended; and;
- the financial statements have been properly prepared in accordance with the Government Resources and Accounts Act 2000 and HM Treasury directions issued there-under.
Opinion on other matters
In my opinion:
- the parts of the Remuneration and Staff Report and the Parliamentary Accountability Disclosures to be audited have been properly prepared in accordance with HM Treasury directions made under the Government Resources and Accounts Act 2000; and;
- the information given in the Performance Report and Accountability Report for the financial year for which the financial statements are prepared is consistent with the financial statements.
Matters on which I report by exception
I have nothing to report in respect of the following matters which I report to you if, in my opinion:
- adequate accounting records have not been kept or returns adequate for my audit have not been received from branches not visited by my staff; or;
- the financial statements and the parts of the Remuneration and Staff Report and the Parliamentary Accountability Disclosures to be audited are not in agreement with the accounting records and returns; or;
- I have not received all of the information and explanations I require for my audit; or
- the Governance Statement does not reflect compliance with HM Treasury’s guidance.
Report
I have no observations to make on these financial statements.
Sir Amyas C E Morse
Comptroller and Auditor General
National Audit Office
157-197 Buckingham Palace Road
Victoria
London
SW1W 9SP
13 July 2017
Certificate and Report of the Comptroller and Auditor General to the House of Commons
Trust Statement
I have audited the financial statements of the Driver and Vehicle Licensing Agency’s Trust Statement for the year ended 31 March 2017 under the Exchequer and Audit Departments Act 1921. The financial statements comprise the Statement of Revenue and Expenditure, the Statement of Financial Position, the Statement of Cash Flows and the related notes. These financial statements have been prepared under the accounting policies set out within them.
Respective responsibilities of the Accounting Officer and auditor
As explained more fully in the Statement of Accounting Officer’s Responsibilities, the Chief Executive as Accounting Officer is responsible for the preparation of the financial statements and for being satisfied that they give a true and fair view. My responsibility is to audit and report on the financial statements in accordance with the Exchequer and Audit Departments Act 1921. I conducted my audit in accordance with International Standards on Auditing (UK and Ireland). Those standards require me and my staff to comply with the Auditing Practices Board’s Ethical Standards for Auditors.
Scope of the audit of the financial statements
An audit involves obtaining evidence about the amounts and disclosures in the financial statements sufficient to give reasonable assurance that the financial statements are free from material misstatement, whether caused by fraud or error. This includes an assessment of: whether the accounting policies are appropriate to the circumstances of the Driver and Vehicle Licensing Agency’s Trust Statement and have been consistently applied and adequately disclosed; the reasonableness of significant accounting estimates made by the Accounting Officer; and the overall presentation of the financial statements. In addition I read all the financial and non-financial information in the Annual Report to identify material inconsistencies with the audited financial statements and to identify any information that is apparently materially incorrect based on, or materially inconsistent with, the knowledge acquired by me in the course of performing the audit. If I become aware of any apparent material misstatements or inconsistencies I consider the implications for my report.
I am required to obtain evidence sufficient to give reasonable assurance that the expenditure and income recorded in the financial statements have been applied to the purposes intended by Parliament and the financial transactions recorded in the financial statements conform to the authorities which govern them.
Opinion on regularity
In my opinion, in all material respects the expenditure and income recorded in the financial statements have been applied to the purposes intended by Parliament and the financial transactions recorded in the financial statements conform to the authorities which govern them.
Opinion on financial statements
In my opinion:
- the Driver and Vehicle Licensing Agency’s Trust Statement gives a true and fair view of the state of affairs of the collection and allocation of taxes, fines and penalties as at 31 March 2017 and of the net revenue for the year then ended; and
- the financial statements have been properly prepared in accordance with the Exchequer and Audit Departments Act 1921 and HM Treasury directions issued there under.
Opinion on other matters
In my opinion:
the information given in the Performance Report and Accountability Report for the financial year for which the financial statements are prepared is consistent with the financial statements.
Matters on which I report by exception
I have nothing to report in respect of the following matters which I report to you if, in my opinion:
- adequate accounting records have not been kept or returns adequate for my audit have not been received from branches not visited by my staff; or
- the financial statements are not in agreement with the accounting records and returns; or
- I have not received all of the information and explanations I require for my audit; or
- the Governance Statement does not reflect compliance with HM Treasury’s guidance.
Sir Amyas C E Morse
Comptroller and Auditor General
National Audit Office
157-197 Buckingham Palace Road
Victoria
London
SW1W 9SP
13 July 2017
The Comptroller and Auditor General’s Section 2 Report to the House of Commons
Background
The Driver and Vehicle Licencing Agency (DVLA) is responsible for the collection of Vehicle Excise Duty (VED) on behalf of the Secretary of State for Transport. VED is tax which must be paid for most types of vehicles used (or kept) on public roads in the United Kingdom.
Levels of VED receipts
In 2016-17, the DVLA Trust Statement recorded £5,876 million of VED revenue, a fall of £54 million (0.9%) on 2015-16 levels. A small decrease in VED income in this period is in line with recent forecasts from the Office for Budgetary Responsibility1 (OBR). It follows similar declines in recent years, which are consistent with the tendency of average licence costs to decrease as the stock of vehicles in use becomes more fuel-efficient.
Cash collections reported in the Trust Statement2 were £6,063 million – an increase of £160 million on 2015-16. The fact that cash collected has increased while revenue has fallen reflects timing differences associated with the Direct Debit payment option having grown in popularity at a slower rate than in 2015-16.
The OBR estimates that VED receipts will increase progressively from 2017-18 due to the adjustment of rates for inflation and the April 2017 reforms affecting newly registered cars.
Scope of my audit work
Section 2 of the Exchequer and Audit Departments Act 1921 requires me to:
- examine the VED revenue accounts (reported by DVLA in the Trust Statement)
- ascertain whether DVLA has in place adequate regulations and procedures to secure an effective check on the assessment, collection and proper allocation of revenue
- evaluate whether DVLA is duly carrying out any such regulations and procedure
- examine the correctness of the sums brought to account; and
- report the results to the House of Commons.
This report, with my audit opinions on DVLA’s Trust Statement, together satisfy these requirements.
My team has examined the systems supporting collection and obtained evidence on the adequacy and operations of its regulations and procedure, including consideration of DVLA’s compliance and enforcement activities. In drawing a conclusion on DVLA’s overall management of VED, I have considered this examination, together with my analysis of:
- the available data on levels of compliance in VED payment
- the DVLA’s response to the reduced compliance levels identified last year
- how the DVLA uses digital services in promoting compliance; and
- the challenges arising from the April 2017 reforms to VED for newly registered cars.
Key findings
Levels of compliance in VED payment
Evidence on compliance levels for VED primarily comes from the Roadside Survey of Vehicle Observations3, which is carried out every 2 years and estimates VED evasion levels based on observing registration marks of vehicles in traffic carried out at 256 sites across the UK. The most recent Roadside Survey was published by the Department for Transport (DfT) in November 2015 based on data from June 2015.
As described in my 2015-16 Report4, the Department estimated a compliance rate of 98.6%, a 0.8% decline since the previous survey in 2013. It estimates the 1.4% of non-compliance as equivalent to £78 million in lost revenue (though some of this may be recovered through enforcement activity).
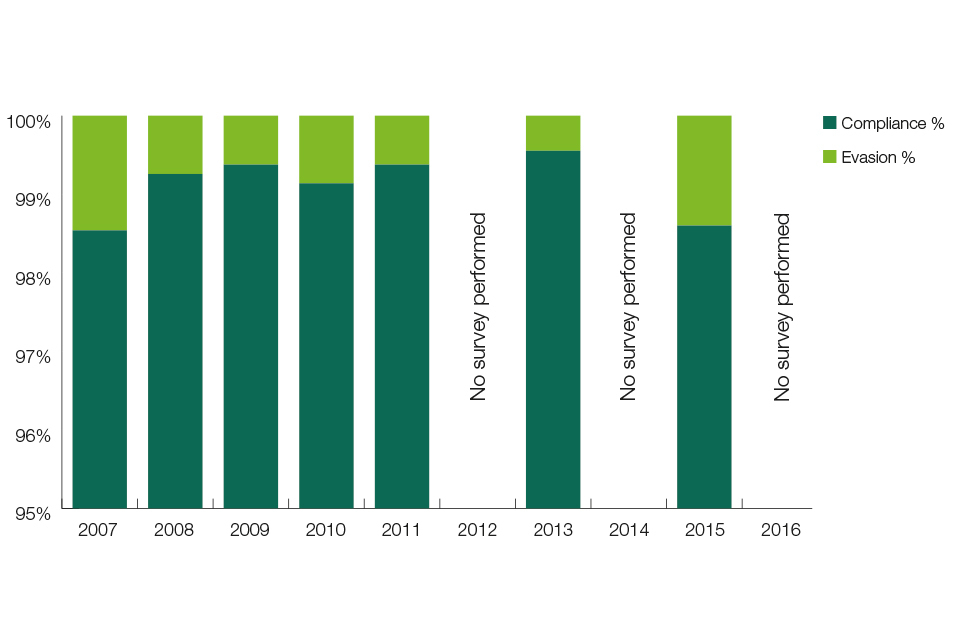
Compliance rates
This decline coincided with a significant period of change in the administration of VED: from October 2014, motorists were allowed to pay by Direct Debit; the paper tax disc was abolished; and the law was amended so that vehicle tax automatically ends when a vehicle changes ownership, rather than transferring with the vehicle.
While enforcement activity has increased during 2016-17, it is not possible with reasonable certainty to draw a link between this and compliance levels due to other variables involved. DVLA is working with Department for Transport statisticians to consider what options are available for the future to identify meaningful compliance trends between surveys.
For now, the Roadside Survey results, next due for publication in November 2017, provide the best evidence on DVLA’s progress in restoring compliance levels to historic norms.
Responding to reduced compliance levels
In July 2016, the DVLA Board approved a new Vehicle Excise Duty strategy. This commits DVLA to act swiftly to ensure the increasing evasion trend is reversed and evasion returned to below 1% by 2019. Towards this overall goal, the strategy includes aims to make VED compliance easier; to make evasion harder; and to ensure that evaders face prompt and robust enforcement action. DVLA’s success in implementing this strategy will prove critical to future VED compliance levels.
Measures to encourage compliance and reduce evasion
DVLA currently administers a wide range of enforcement methods to proactively encourage customers to licence their vehicles on time, as well as taking enforcement action against those who refuse to comply with their legal requirements. These range from reminder letters and the issue of penalties for continued non-compliance, through to prosecution for vehicles used on the road as well as the wheelclamping and seizure of vehicles.
On top of existing measures, the Agency is looking to make further improvements. Some of these include:
- improving its communication with customers and motor trade to minimise unintentional non-compliance
- continuing to work with partners such as the Police and Local Authorities, to increase awareness of the need to keep vehicle licensing up to date
- ensuring that the new Direct Debit service beds in successfully; and
- further improving the ease of use of its services. For example DVLA added functionality on 27 February 2017 to enable customers who pay Direct Debit to change their bank details via the contact centre, in cases where they are unable to do so via a switching service. Between service launch and 11 April 2017 DVLA had over 4,000 requests to use this service.
Ensuring prompt enforcement
DVLA’s primary focus in the administration of VED is to promote compliance. Nevertheless, enforcement action remains important both as a means of recovering money owed and as a deterrent against non-compliance. Current enforcement mechanisms include:
- the use of Automatic Number Plate Recognition (ANPR) cameras to detect unlicensed vehicles on the road which results in a fine
- the issue of penalties for continued non-compliance
- wheelclamping
- prosecutions.
Since 2013-14, there has been an overall increase in VED enforcement action across the DVLA’s business, including a 168% increase in Out of Court Settlements; a 155% increase in the number of penalties issued; a 159% increase in prosecutions; and a 166% increase in wheelclamping operations. The majority of these increases occurred during the 2015-17 period, following the VED rule changes.
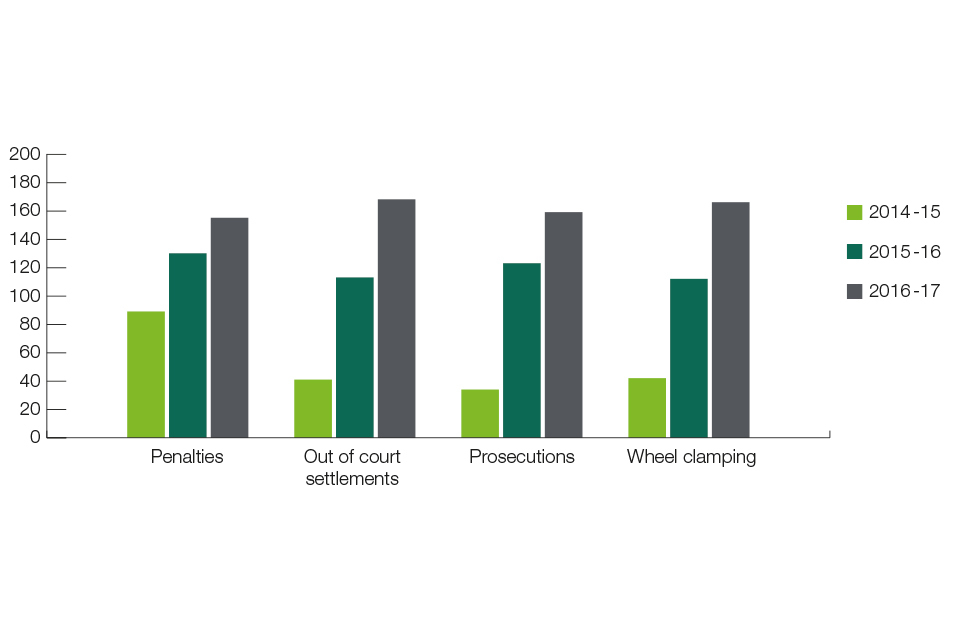
Percentage increase in VED
Source: Driver and Vehicle Licensing Agency
A significant proportion of the increase in penalties issued relates to Direct Debit penalties, following the introduction of that payment option in October 2014. Direct Debit penalties are issued at the end of a fully automated enforcement process which allows customers the opportunity to either pay the full outstanding balance of their licence or re-tax. Failure to do either will result in a penalty being issued which if not paid is referred to external debt collectors.
Out of Court Settlements following ANPR detections of unlicensed vehicles have also been rising in recent years. From October 2016, DVLA has increased the use of its mobile fleet, which provides wider coverage and additional unpredictability. The accuracy of information on whether detected cars are licensed has also been increased as the relevant data are now updated more regularly. As ANPR detections data accumulates, it may be possible to gain insight on general evasion trends from this data series and use that to inform evaluation of performance against VED compliance targets.
Supporting enforcement efforts
To assess the accuracy of its records, DVLA undertakes an annual Traceability Survey to estimate how accurate its records are. In 2015-16 Traceability Survey estimates that the accuracy of DVLA’s records at 92.6% (2014-15: 95.2%), against DVLA’s target of 95%. DVLA recognises the need to make progress in this area.
In respect of court space, HM Courts and Tribunal Service (HMCTS) are undergoing reforms which would, in theory, allow more flexibility in where offences can be prosecuted. We encourage DVLA to continue to work with HMCTS and to ensure that it is prepared to realise the benefits of any increased court capacity which becomes available.
DVLA’s digital services and their impact on VED collection
Increasingly, service users choose to transact with DVLA online. DVLA’s development of its digital services will affect the experience of these service users, but will also play a key role in its efforts to improve VED compliance levels.
Take-up levels for online VED payment
The option to license a vehicle online has been available since 2004, alongside the option to pay at the Post Office, or by telephone. Direct Debit options have been available either online or at the Post Office since October 2014.
As DVLA’s online services have developed, take-up has increased significantly. Between April 2013 and March 2017, the proportion of vehicle tax paid through fully digital methods increased from 55.0% to 80.3%. There are corresponding reductions in the level of transactions through the Post Office (43.7% down to 19.3%) and a reduction in manual applications (i.e. at a DVLA office or by telephone) from 1.3% down to 0.4%.
Vehicle licencing by channel over time
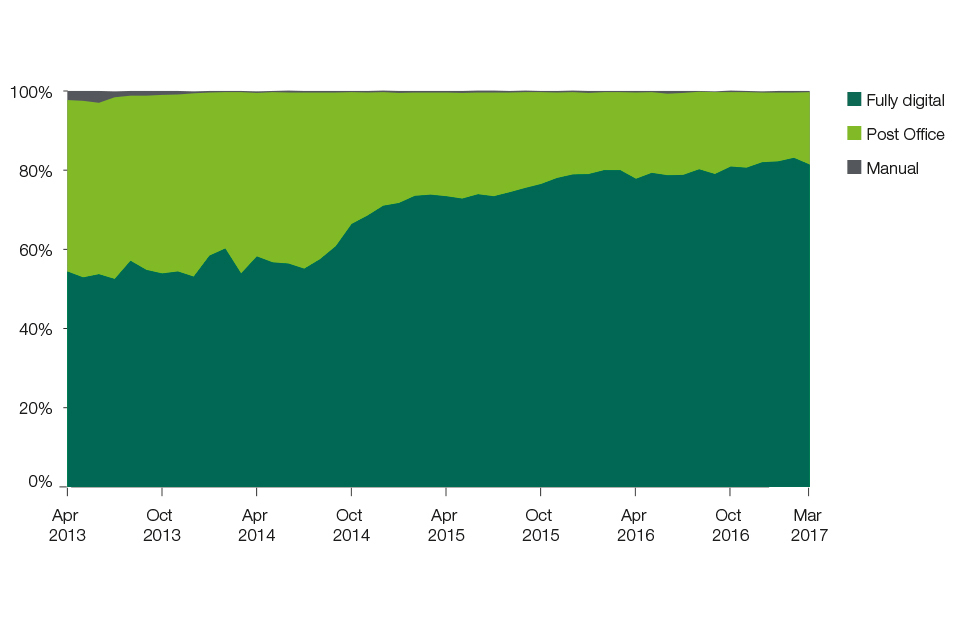
Vehicle licensing by channel
Source: Driver and Vehicle Licensing Agency
Online payment option for penalties
DVLA continues to develop its digital services in response to both user expectation and business need. In June 2016, management introduced an online system for paying penalties and the associated VED arrears. This has proved a popular option – 56% of all penalties paid in-year were settled using this payment option despite 2016-17 being the first year of its operation and its only being available for 9 months of that year.
Online payment option for penalties

Penalty payments by channel
Source: Driver and Vehicle Licensing Agency
The online system provides several benefits:
- users cannot settle a penalty without also paying the associated VED arrears, which should mitigate the loss of VED in enforcement cases
- after paying their penalty, users are directed to the service allowing them to pay their current VED due, or make an off-road notification, influencing improved compliance and
- the risk of a penalty level increasing during postal delays is removed, offering users certainty and removing administrative complexity.
Reliability of online services
In order for DVLA’s digital services to promote high levels of compliance, those services need to maintain high levels of availability. DVLA monitors usage patterns for its online services, allowing them to plan system maintenance during off-peak hours. Unplanned downtime for the core VED service, at 0.10% (505 minutes) is rare. For the Online Penalty Payment (OEPP) system, reliability was lower – the system was down for 1.03% of its first 9 months of operation (4,078 minutes). This clearly provides room for improvement, though it is reasonable to expect a lower level of reliability in this system in its first year.
Total minutes of planned and unplanned VED and OEPP system downtime
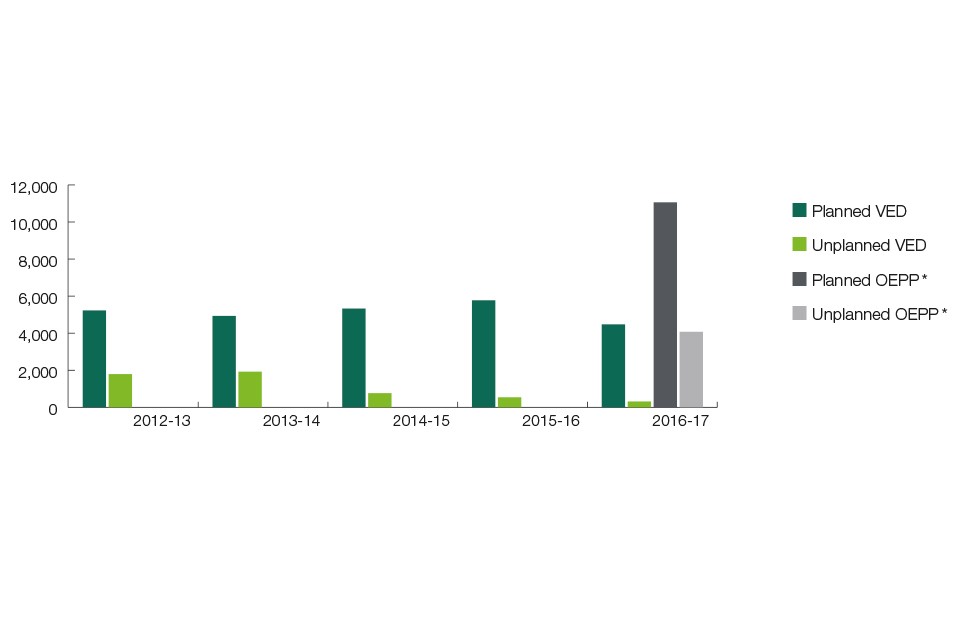
VED and OEPP system downtime
*OEPP data is reported for the nine months since the system went live in 2016-17
Source: Driver and Vehicle Licensing Agency
Responding to VED changes effective April 2017
For cars registered up to 1 April 2017, VED is due annually according to a set rate, based on vehicle type, and either CO2 emissions or engine size. For registrations from 1 April 2017, this system has changed significantly for cars5, which in 2016, accounted for 79% of all first registrations. As planned, revisions to the VED system were running as of 1 April 2017, and DVLA has communicated the changes through multiple channels. DVLA will need to ensure that the effects of the changes, which introduce additional complexity in calculating VED rates, are properly monitored, both in terms of assuring the proper operation of the new system in practice and in evaluating the effect of these changes on compliance levels.
The revised VED rules for new car registrations
Under the new regime the amount of VED payable in the first year for new cars varies heavily based on CO2 emissions, following which the tax reverts to a set rate, for the car’s fuel type. Cars with a list price of more than £40,000 also pay an additional rate for 5 years from the second time they are taxed. The changes are set out in full on the GOV.UK 6 and summarised in the following table (amounts assume single payments for a 12 month period).
| Petrol or Diesel | Alternative Fuel7 | Electric | ||
|---|---|---|---|---|
| VED due in year 1 | £0 - £2,000 depending on CO2 emissions | £0 - £1,990 depending on CO2 emissions | Nil | |
| VED due in years 2 to 6 | List price below £40,000 | £140 | £130 | Nil |
| List price above £40,000 | £450 (including £310 additional rate) | £440 (including £310 additional rate) | £310 | |
| VED due in year 7 onwards | £140 | £130 | Nil | |
In preparation for these reforms, DVLA has focused its efforts in 2 areas: working with stakeholders and investing in IT systems to ensure they are ready to accurately process the VED rates and rules.
Working with stakeholders
DVLA put significant effort into communicating the upcoming changes. In July 2016, the test version of the new V55 Vehicle Registration pack was issued to dealers and manufacturers, with amendments to First Registration forms and leaflets finalised in October 2016. From November 2016, DVLA began to implement its stakeholder communication strategy, which included a social media campaign, changes to the GOV.UK website and campaigns targeted at car dealers and the second-hand market.
The reforms introduce additional complexity which involves obtaining additional data from stakeholders. Specifically, determining the list price as an input to the VED calculation involves adding to the retail price certain items, such as the price of non-standard option fitted by the manufacturer, delivery charges and the cost price of any leased battery for electric cars. As a result, DVLA has needed to develop closer working relationships with car manufacturers to ensure the list price for all new cars is accurately captured in the VED database. As before, car dealers are responsible for the collection of the VED payable in year 1 (which in many cases will now be at an enhanced level) and for passing it to DVLA.
DVLA’s performance in the administration and collection of VED following the current round of reforms will continue to rely on the efficiency of these industry partnerships.
IT development
In response to the 2017 VED reforms, DVLA implemented a new cloud-based VED calculation service designed to handle the new rules, together with new interfaces with the updated vehicles database and dealers, to ensure that the correct tax is charged. This has involved a significant degree of change and required integration of new code with existing systems.
The revised system was running from 1 April 2017 and management are monitoring its availability. During the first month of operation, reported system downtime was minimal.
DVLA is also planning internal assurance work in the coming year to check that the updated system properly reflects new statutory requirements; this will also provide a focus for my work in 2017-18 both on the Trust Statement and in support of my Section 2 Report.
Conclusion
Based on their examination, my team found that the systems in place for the administration and collection of VED, managed by DVLA through a range of channels, are reasonable in their design and were operated effectively throughout the year.
It is too early to say whether DVLA has begun to reverse the trend in VED compliance seen in the 2015 Roadside Survey. While the 2015 figures for non-compliance, at 1.4%, are far below the tax gap estimate for other revenue streams, it is right that DVLA make returning to previous levels a high priority. The 2017 Survey will provide valuable data on which to base DVLA’s next steps. As the survey is to be performed only once every 2 years it would be sensible to consider whether data – for example from the ANPR camera fleet – could be used to provide indications of evasion trends, so that DVLA can evaluate the effectiveness of enforcement measures on a more timely basis.
Future performance will depend to some extent on DVLA’s success in managing through a period of transformation. The agency is rightly looking to adapt systems and work with stakeholders to address issues emerging from the 2014 reforms. At the same time, it maintains a high pace of organisational change geared towards transacting more business online and bringing IT expertise in house and has just completed the implementation of a more complex VED regime for new car registrations.
As well as keeping its focus on user experience and service availability, DVLA should ensure that – in line with the VED Strategy agreed this year – it gives sufficient priority to the available mitigations to exchequer losses. This will mean:
- quickly gathering and applying intelligence on the causes of both evasion and unintentional non-compliance, including any newly arising from the April 2017 reforms
- ensuring the nature and level of enforcement activity is fit for purpose both in maximising the recovery of funds owed and in providing a deterrent
- allocating sufficient priority and resource to resolving known issues affecting collection,
- working effectively with partners in both industry and government and
- actively monitoring progress towards the 99% compliance target, including through the use of data available between Roadside Surveys (for example, ANPR detections) which could provide indications of evasion trends.
Footnotes
1 Office for Budget Responsibility, Economic and Fiscal Outlook March 2016, available at: http://cdn.budgetresponsibility.org.uk/March2016EFO.pdf.
2In addition to VED, the Trust Statement includes the much smaller HGV Road User Levy revenue stream, collected by the DVLA on behalf of the Consolidated Fund. In accordance with my statutory responsibilities, this report focuses purely on VED. Exceptionally, cash collections quoted here are, consistent with the Trust Statement, on an aggregated basis for both revenue streams. Both this report and the Trust Statement report VED revenue separately on an accruals basis.
3Department for Transport, Roadside Survey of Vehicles series, available at: https://data.gov.uk/dataset/roadside-survey-of-vehicles.
4DVLA, Annual Report and Accounts 2015-16, HC373, pp65-70.
5Some motorhomes are also affected.
6https://www.gov.uk/vehicle-tax-rate-tables/vehicles-registered-on-or-after-1-april-2017
7Alternative fuel vehicles include hybrids, and those powered by bioethanol or Liquid Petroleum Gas.
Sir Amyas C E Morse
Comptroller and Auditor General
National Audit Office
157-197 Buckingham Palace Road
Victoria
London
SW1W 9SP
13 July 2017
6. Financial Statements
DVLA Business Account for 2016-17
Statement of comprehensive net expenditure for the year ended 31 March 2017
| Note | 2016-17 £000 |
2015-16 £000 |
|
|---|---|---|---|
| Income | 2 | 564,035 | 541,051 |
| Operating costs | 3 | (241,778) | (276,653) |
| Staff costs (i) | (180,347) | (167,459) | |
| Depreciation, amortisation and impairment | 5&6 | (27,115) | (39,454) |
| Net operating Income | 114,795 | 57,485 | |
| Finance costs | 4 | (1,694) | (1,242) |
| Net Income for the year | 113,101 | 56,243 | |
| Other comprehensive expenditure | |||
| Items that will not be reclassified to net operating costs: | |||
| Net gain on revaluation of property, plant and equipment | 5 | 2,783 | 99 |
| Net gain on revaluation of intangibles | 6 | 153 | - |
| Total comprehensive income for the year ended 31 March 2017 | 116,037 | 56,342 |
All income and expenditure are derived from continuing operations.
(i) A breakdown of staff costs is shown in the Accountability report.
Statement of financial position as at 31 March 2017
| Note | 31 March 2017 £000 |
31 March 2016 £000 |
|
|---|---|---|---|
| Non-current assets | |||
| Property, plant and equipment | 5 | 64,372 | 64,397 |
| Intangible assets | 6 | 27,912 | 43,658 |
| Total non-current assets | 92,284 | 108,055 | |
| Current assets | |||
| Trade and other receivables | 7 | 33,887 | 31,446 |
| Cash and cash equivalents | 8 | 49,212 | 31,684 |
| Total current assets | 83,099 | 63,130 | |
| Total assets | 175,383 | 171,185 | |
| Current liabilities | |||
| Trade and other payables due within one year | 9 | (78,121) | (72,297) |
| Provisions for liabilities and charges | 11 | (2,996) | (3,325) |
| Total current liabilities | (81,117) | (75,622) | |
| Non-current assets less net current liabilities | 94,266 | 95,563 | |
| Non-current liabilities | |||
| Trade and other payables due after more than one year | 9 | (20,134) | (22,436) |
| Provisions for liabilities and charges | 11 | (14,190) | (16,121) |
| Total non-current liabilities | (34,324) | (38,557) | |
| Assets less liabilities | 59,942 | 57,006 | |
| Taxpayers’ equity | |||
| General fund | 7,534 | 7,534 | |
| Revaluation reserve | 52,408 | 49,472 | |
| Total taxpayers’ equity | 59,942 | 57,006 |
Oliver Morley CBE
Accounting Officer and Chief Executive, DVLA
28 June 2017
Statement of cash flows for the year ended 31 March 2017
| Note | 2016-2017 £000 |
2015-2016 £000 |
|
|---|---|---|---|
| Cash flows from operating activities | |||
| Net operating income | 113,101 | 56,243 | |
| Adjustments for non cash items: | |||
| Loss on disposal, depreciation, amortisation and impairment | 5&6 | 27,115 | 39,454 |
| Net financing costs | 4 | 1,694 | 1,242 |
| (Increase) in trade and other receivables | 7 | (2,441) | (3,224) |
| (Decrease)/Increase in trade payables | 9 | (3,792) | 7,819 |
| Auditor’s remuneration – notional charges | 3 | 122 | 122 |
| (Decrease) in provisions | 11 | (2,669) | (4,598) |
| Net cash inflow from operating activities | 133,130 | 97,058 | |
| Cash flows from investing activities | |||
| Purchase of property, plant and equipment | 5 | (2,962) | (686) |
| Purchase of intangible assets | 6 | (5,446) | (14,105) |
| Proceeds from sale of property, plant and equipment | 5 | 13 | |
| Net cash outflow from investing activities | (8,408) | (14,778) | |
| Cash flows from financing activities | |||
| Finance costs | 4 | (1,285) | (1,405) |
| Capital element of payments in respect of finance leases and on-balance sheet PFI contracts | 9 | (2,285) | (1,976) |
| DfT Supply funding received in year | 90,210 | 93,000 | |
| Net cash received in financing activities | 86,640 | 89,619 | |
| Payments of amounts due to the Consolidated Fund | (193,834) | (163,900) | |
| Net increase in cash and cash equivalents in the year | 8 | 17,528 | 7,999 |
| Cash and cash equivalents at the beginning of the year | 8 | 31,684 | 23,685 |
| Cash and cash equivalents at the end of the year</b> | 8 | 49,212 | 31,684 |
Statement of changes in taxpayers’ equity for the year ended 31 March 2017
| General Fund £000 |
Revaluation Reserve (i) £000 |
Total Reserves £000 |
|
|---|---|---|---|
| Balance at 31 March 2015 | 30,068 | 49,373 | 79,441 |
| Net income for the year to 31 March 2016 | 56,243 | - | 56,243 |
| Non cash charge – auditor’s remuneration | 122 | - | 122 |
| DfT Supply funding | 84,976 | - | 84,976 |
| Consolidated Fund Extra Receipts (CFERs) payable: | |||
| - Cherished transfers | (67,218) | - | (67,218) |
| - Personalised registrations | (96,657) | (96,657) | |
| Other Comprehensive Income | |||
| - Net gain on revaluation of property, plant and equipment | - | 99 | 99 |
| - Net gain on revaluation of intangible assets | - | - | - |
| Balance at 31 March 2016 | 7,534 | 49,472 | 57,006 |
| Net income for the year to 31 March 2017 | 113,101 | - | 113,101 |
| Non cash charge – auditor’s remuneration | 122 | - | 122 |
| DfT Supply funding | 88,330 | - | 88,330 |
| Consolidated Fund Extra Receipts (CFERs) payable: | |||
| - Cherished transfers | (91,493) | - | (91,493) |
| - Personalised registrations | (110,060) | - | (110,060) |
| Other Comprehensive Income | |||
| - Net gain on revaluation of property, plant and equipment | - | 2,783 | 2,783 |
| - Net gain on revaluation of intangible assets | - | 153 | 153 |
| Balance at 31 March 2017 | 7,534 | 52,408 | 59,942 |
(i) The Revaluation Reserve reflects the accumulated revaluation gains relating to non-current assets. The amount of the revaluation reserve that relates to intangible assets at 31 March 2017 is £16.9 million (31 March 2016: £16.8 million).
Notes to the accounts
Note 1. Statement of accounting policies
The financial statements have been prepared in accordance with the 2016-17 Government Financial Reporting Manual (FReM) issued by HM Treasury. The accounting policies contained in the FReM apply International Financial Reporting Standards (IFRS) as adapted or interpreted for the public sector context.
Where the FReM permits a choice, the accounting policy which has been judged to be the most appropriate to the particular circumstances of our Business Account for the purpose of giving a true and fair view has been selected. The particular policies adopted by the agency are described below. They have been applied consistently in dealing with items that are considered material to the accounts.
Adoption of new and revised standards
No new accounting standards became effective for the first time in 2016-17.
A number of new standards, amendments to standards and interpretations are not yet effective for the year ended 31 March 2017 and have not been applied in these financial statements. The following new standards may affect the accounts if they are adopted by the Financial Reporting Manual, after further consultation:
IFRS 9 addresses classification, measurement and impairment of financial instruments and is still subject to analysis and consideration by HM Treasury with a view to include in the 2018-19 FReM. It is thought that IFRS 9 will result in terminology changes, however there should be no changes to how DVLA measures its financial assets and liabilities.
IFRS 15 covers the recognition of revenues from contracts with customers. HM Treasury released an exposure draft for inclusion in the 2018-19 FReM. It is not thought that this will materially affect the timing of recognition or amounts recognised.
IFRS 16 provides a single lessee accounting model, requiring lessees to recognise assets and liabilities for all leases unless the lease term is 12 months or less, or the underlying asset has a low value. The probable impact is that there will be earlier recognition of expenditure in relation to leases (amortisation and interest). It is not yet clear when or with what degree of adaptation this standard will be reflected in the FReM. The IFRS will become effective in the private sector for accounting periods commencing on or after 1 January 2019.
IFRS9 and IFRS 15 have been endorsed by the EU to date. The full impact will not be known until the FReM adopts or adapts these standards.
We do not consider that any other new or revised standard or interpretation will have a material impact.
Accounting convention
These accounts have been prepared under the historical cost convention modified to account for the revaluation of property, plant and equipment, intangible assets and inventories and certain financial assets and liabilities.
The financial statements have been prepared in accordance with the revised accounts direction issued by HM Treasury on 19 December 2016. They meet the relevant requirements of the FReM adapted IFRS. We are not aware of any disclosures or circumstances where these are inappropriate. The financial statements have been prepared on the going concern basis.
The Business Account does not include any amounts collected by the DVLA where it was acting as an agent of the Consolidated Fund rather than as principal. Full details of income collected as Agent for the Consolidated Fund are in the Trust Statement published separately from but alongside these financial statements.
Income
Income from the sale of registration marks is recognised on receipt of payment for fixed price sales and on the fall of the auctioneer’s hammer for sales at auction. Uncompleted sales are provided for after 90 days and are written out of sales after twelve months, with the related marks becoming available for resale. Fee income from the assignment, transfer and retention of cherished registration marks is recognised on receipt, when the transaction is processed, as is that from fee-bearing statutory services. All other income is recognised when the services and goods are issued.
Finance income and finance costs
As an Executive Agency, we do not earn interest on funds invested.
Finance costs comprise interest expense on borrowings and unwinding of the discount on provisions. Borrowing costs are recognised in net operating cost or income using the effective interest method.
Taxation
We are not liable to pay Corporation Tax. Expenditure is shown net of recoverable VAT. Irrecoverable VAT is charged to the relevant expenditure category or, if appropriate, capitalised with additions to non-current assets. Income and expenditure is otherwise shown net of VAT.
Cash and cash equivalents
Cash and cash equivalents comprise cash balances in non-interest bearing accounts. We do not have any bank overdrafts.
Non-current assets: property, plant and equipment
We revalue our non-current asset portfolio on 31 March each financial year in accordance with the requirements of the FReM. A full valuation of our estate is carried out every 5 years. The last full valuation was undertaken on 31 March 2014 by Joseph M L Funtek BSc (Hons) MRICS of Gerald Eve LLP.
The existing use valuation basis was applied to the majority of assets save for those which are considered to be specialised in which case those assets were valued on a depreciated replacement cost basis.
A desktop valuation exercise was carried out for land and buildings in the interim period at 31 March 2017.
Plant and machinery, fixtures and fittings, computer equipment, motor vehicles and office equipment are revalued in accordance with price indices published by the Office of National Statistics (MM22 Producer Price Indices). Surpluses and deficits arising on revaluation are charged to the Revaluation Reserve. Where it is not possible for any such deficit to be offset by previous surpluses in the Revaluation Reserve, it is charged to revenue as are permanent diminutions in the value of fixed assets. Ownership of our assets is vested in the Secretary of State for Transport. The minimum level for capitalisation is £5,000.
Non-current assets: intangible assets
The value of licences to operate the driver and vehicle systems is capitalised. Software development costs are capitalised, excluding any costs incurred in the planning and design stages of the project, which are clearly defined and separate from the build phase of a project. New expenditure on IT systems development is written off in the period in which it is incurred, unless a beneficial relationship to a future period can be established with reasonable certainty, in which case the charge is capitalised. We review our projects and operational software for impairment and revalue our intangible assets annually based on Depreciated Replacement Cost.
The value of the driver and vehicle databases cannot be estimated. Our personalised registrations database, including unallocated vehicle registration marks, is a very large store of possible combinations of alpha-numeric characters and is affected by changes in opinion, taste and judgement. As a result, the potential future sales value is not recognised in our statement of financial position, as it cannot be reliably estimated.
Depreciation and amortisation
Depreciation is provided on intangible and tangible non-current assets from the date they are commissioned into operational service, except for computer equipment, which is provided for at the date of purchase. When assets are revalued the depreciation continues on the revised value over the remaining useful life of the relevant asset. The estimated useful lives from new of the main categories of non-current assets are:
| Years | |
|---|---|
| Plant and machinery | 3 - 10 |
| IT equipment | 3 - 5 |
| Purchased software | up to 10 |
| Office equipment | 5 - 10 |
| Software licences/development | 3 - 15 |
| Fixtures and fittings | 5 - 10 |
| Motor vehicles | 5 - 10 |
The estimated remaining useful lives of buildings on 31 March 2017 are:
- 32 years , Morriston site (excluding J and E blocks)
- 17 years, J and E blocks (Morriston site)
- 27 years, Richard Ley Development Centre at Swansea Vale.
The estimated useful lives of assets are reviewed regularly and when necessary, revised. Land (freehold and leasehold) is not depreciated.
Leases
Operating lease rentals are charged to the statement of comprehensive net expenditure on a straight-line basis over the lease term.
Leases in which the agency assumes substantially all the risks and rewards of ownership are classified as finance leases. Upon initial recognition the leased asset is measured at an amount equal to the lower of its fair value and the present value of the minimum lease payments. Subsequent to initial recognition, the asset is accounted for in accordance with the accounting policy applicable to that asset. Minimum lease payments made under finance leases are apportioned between the finance expense and the reduction of the outstanding liability. The finance expense is allocated to each period during the lease term so as to produce a constant periodic rate of interest on the remaining balance of the liability.
Provisions
The agency makes provision for liabilities and charges in accordance with IAS 37 where, at the end of the current reporting period, a legal or constructive liability (for example a present obligation from past events) exists, the transfer of economic benefits is probable and a reasonable estimate can be made. Where the effect of the time value of money is material, the estimated risk-adjusted cash flows are discounted using the rates set by HM Treasury. When the discount is unwound, the adjustment is recognised as an interest expense. Further details are provided in respect of our most significant provisions below.
Modernisation of network services provision
In 2012-13 we implemented plans for the phased closure of 39 local offices and 10 enforcement area offices to centralise operations in Swansea by December 2013.
Future payments to be made under the provision for the modernisation of network services are discounted at the HM Treasury advised rates for General Provisions.
Early departure costs provision
We provide for future annual compensation payments to certain former employees who have taken early retirement. Compensation is payable from the date of retirement until age 60.
We are responsible for 20% of the liability to former employees that took early retirement between 1 October 1994 and 31 March 1996 and met certain criteria. This liability is provided for within the early departure provision. The remaining liability is met centrally by the Civil Superannuation Vote.
For departures between April 1996 and March 1997, HM Treasury introduced capping arrangements that limit the central contribution for these departures to a maximum of £99,000 per annum.
We announced a Voluntary Early Retirement (VER) scheme in 2005-06 and a Flexible Early Retirement (FER) scheme in 2009-10. We are responsible in full for the liability to former employees who take early retirement under the VER and FER schemes and provides for the liability within the Early Departure Costs provision.
Future payments to be made under the Early Departure and Voluntary Retirement schemes are discounted at the HM Treasury advised rate of 0.24% (2015-16: 1.37%).
Tax officers’ pensions and compensation payments provision
We make payments in relation to costs of former taxation officers employed by local authorities before the creation of the Driver and Vehicle Licensing Centre in 1972. Certain individuals remained within the Local Government Pension Scheme. We contribute to the local authorities concerned towards the annual cost of these pensions. We also make compensation payments to a number of individuals in respect of loss of emoluments when the Local Taxation Offices closed. A provision has been made for future costs. An actuarial valuation is carried out every 3 years to determine future liabilities, with the latest valuation carried out on the 31 March 2016.
Pensions
Present and past employees are covered by the provisions of PCSPS and the CSOPS known as ‘alpha’, which is described in the Remuneration Report. We recognise the expected cost of providing pensions on a systematic and rational basis over the period during which it benefits from employees’ services by payment to the PCSPS of amounts calculated on an accruing basis. Liability for payment of future benefits is a charge on the PCSPS and alpha. In respect of the defined contribution schemes, we recognise the contributions payable for the year.
Research and development
We consider our expenditure each year to determine if any is considered to be research and development.
In accordance with IAS 38 Intangible Assets, expenditure incurred on pure and applied research is treated as an operating charge in the year in which it is incurred. Development expenditure is for the development of specific business systems. Expenditure which does not meet the criteria for capitalisation is treated as an operating cost in the year in which it is incurred. Development costs meeting the criteria for capitalisation are treated as intangible fixed assets and amortised as explained in the intangible non-current asset note (note 6). Non-current assets acquired for use in development are depreciated over the expected useful life of the underlying system.
Private Finance Initiative (PFI) contract for estates
On the 4 April 2005, we entered into a 20-year service concession agreement with Telereal Trillium (formerly Land Securities Trillium). This agreement falls within the scope of IFRIC 12 Service Concession Arrangements and has been set up to provide the following property outsourcing solutions:
- building maintenance
- office moves
- cleaning
- catering and vending
- furniture repair
- furniture replacement
- grounds maintenance
- waste management and pest control.
We are invoiced on a monthly basis and this revenue expenditure is recorded as a service charge in the Statement of comprehensive net expenditure.
At the start of the contract, Telereal Trillium undertook a refurbishment of the Morriston site. Where the work is capital in nature (air conditioning, double-glazing, lifts and specialist cabling), the costs were capitalised on Independent Assessors’ sign off for each floor as complete and ready for use. The air conditioning, double-glazing and lifts are depreciated over the length of the PFI contract. The cabling is depreciated over its expected useful life of 10 years. A PFI liability was created to reflect the liabilities relating to property, plant and equipment paid for under the PFI unitary charge. This creditor is reduced over the life of the contract as payments are made. In accordance with HM Treasury Financial Reporting Manual requirements, the interest part of the unitary charge relating to the assets capitalised has been calculated using the actuarial method.
Financial instruments
Financial instruments are contractual arrangements that give rise to a financial asset of one entity and a financial liability or equity instrument of another entity. Financial assets are typically cash or rights to receive cash or equity instruments in another entity. Financial liabilities are typically obligations to transfer cash. A contractual right to exchange financial assets or financial liabilities with other entities will also be a financial asset or liability, depending on whether the conditions are potentially favourable or adverse to the reporting entity.
Non-derivative financial assets comprise trade and other receivables and cash equivalents. These are classified as loans and receivables. We initially recognise these assets on the date that they are originated, and derecognises them when the contractual rights to the cash flows from the asset expire.
Trade and other receivables are recognised initially at fair value on the date that they originated. Fair value is usually at the original invoiced amount. Subsequent to initial recognition they are measured at amortised cost using the effective interest method less any impairment losses.
Non-derivative financial liabilities comprise trade and other payables, obligations under finance leases and obligations under on-balance sheet PFI contracts. We recognise these liabilities initially on the trade date at which we become a party to the contractual provisions of the instrument and derecognise when our contractual obligations are discharged or cancelled or expired. Trade and other payables are recognised initially at fair value. Fair value is usually at the original invoiced amount. Subsequent to initial recognition they are measured at amortised cost.
Impairment of financial assets
We assess at each balance sheet date whether there is objective evidence that financial assets are impaired. This could be as a result of one or more loss events that occurred after the initial recognition of the asset and before the balance sheet date, and the loss event or events has had an impact on the estimated future cash flows of the financial asset or the portfolio that can be reliably estimated.
The amount of the impairment loss is measured as the difference between the asset’s carrying amount and the present value of estimated future cash flows. The methodology and assumptions used for estimating future cash flows are reviewed regularly to reduce any differences between loss estimates and actual loss experience.
We do not hold any derivative financial instruments.
Contingent liabilities
In accordance with IAS 37, we disclose as contingent liabilities potential future obligations arising from past obligating events, where the existence of such obligations remains uncertain pending the outcome of future events outside of our control, unless their likelihood is considered to be remote. Guarantees, indemnities and undertakings are treated as contingent liabilities.
In addition to contingent liabilities disclosed in accordance with IAS 37, we disclose for Parliamentary reporting and accountability purposes certain statutory and non-statutory contingent liabilities where the likelihood of a transfer of economic benefit is remote, but which have been reported to Parliament in accordance with the requirements of Managing Public Money.
Where the time value of money is material, contingent liabilities which are required to be disclosed under IAS 37 are stated at discounted amounts and the amount reported to Parliament separately noted.
Contingent assets
In accordance with IAS 37, we disclose contingent assets that arise from past events whose existence will be confirmed only by the occurrence or non-occurrence of one or more uncertain future events not wholly within the control of the agency and where an inflow of economic benefits is probable.
Use of estimates and judgements
The preparation of the financial statements in conformity with IFRS requires management to make judgements, estimates and assumptions that affect the application of accounting policies and the reported amounts of assets, liabilities, income and expenses. Actual results may differ from these estimates.
Estimates and underlying assumptions are reviewed on an ongoing basis. Revisions to accounting estimates are recognised in the period in which the estimates are revised and in any future periods affected.
Information about critical judgements in applying accounting policies that have the most significant effect on the amounts recognised in the financial statements are set out below.
Provisions for liabilities and charges – the main estimates relate to the discount rate which is provided by HM Treasury and estimates of future spend in the Modernising Network Services provision, in particular regarding the elements relating to onerous leases.
The critical assumptions and estimation uncertainties that have a significant risk of resulting in a material adjustment within the next financial year relate to the estimated useful economic life of intangible assets. These are based on management’s judgement of assets of a similar nature and historical trends and are revised where appropriate. Where material, the cost of untaken staff leave has been estimated and accrued.
Consolidated fund extra receipts
Payments due to the Consolidated Fund from the Business Account represent amounts in excess of costs for our personalised registration/cherished transfer transactions. The income from these transactions is only deemed as due to the Consolidated Fund after the recovery of these costs. The surplus Consolidated Fund Extra Receipts are recognised in the statement of taxpayers’ equity in compliance with the 2016-17 FReM.
Supply funding
Supply funding is provided by DfT and is recognised as financing within the statement of changes in taxpayers’ equity.
Note 2. Statement of Income/ (Cost) by Operating Segment
| 2016-17 Operating Segments | Fees and charges £000 |
DVLA personalised registrations £000 |
VED Collection and Enforcement £000 |
Other Government Departments £000 |
Total £000 |
|---|---|---|---|---|---|
| External revenue | 432,726 | 113,969 | 7,657 | 9,683 | 564,035 |
| Expenditure | (311,047) | (3,910) | (126,294) | (9,683) | (450,934) |
| Net income/(cost) | 121,679 | 110,059 | (118,637) | - | 113,101 |
| 2015-16 Operating Segments | Fees and charges £000 |
DVLA personalised registrations £000 |
VED Collection and Enforcement £000 |
Other Government Departments £000 |
Total £000 |
|---|---|---|---|---|---|
| External revenue | 423,110 | 102,183 | 6,828 | 8,930 | 541,051 |
| Expenditure | (326,944) | (5,526) | (143,408) | (8,930) | (484,808) |
| Net income/(cost) | 96,166 | 96,657 | (136,580) | - | 56,243 |
The segments used reflect how management information is provided to the ET. An analysis of assets and liabilities by segment is not regularly provided to the Chief Executive or ET. The information on the nature of the segments and the significant income streams are provided in the Performance Report – Finance and Efficiency.
Within net operating income/ (cost) are Consolidated Fund Extra Receipts (CFERs) of:
- £91.5 million (2015-16: £67.2 million) in respect of cherished transfer transactions brought to account in fees and charges and
- £110.1 million (2015-16: £96.7 million) in respect of our personalised registrations
We comply with the cost allocation and charging requirements set out in the HM Treasury Fees and Charges guide. Our financial objective is to recover the full cost of keeping the vehicle and driver registers and fees (where applicable) are set to cover these costs. For fee setting purposes, rather than ring-fencing fees and related expenditure, we have a Section 102 order that allows us to pool these fees and costs; the total fees, costs and surplus are disclosed in the above note.
Note 3. Operating costs
| Operating costs | 2016-17 £000 |
2015-16 £000 |
|---|---|---|
| ICT Services | ||
| - Operational | 72,722 | 70,367 |
| - Programme | 15,225 | 55,308 |
| Agents’ fees | 37,004 | 34,573 |
| Postage & printing | 40,223 | 40,729 |
| PFI Estates unitary charge | 18,839 | 18,714 |
| Credit card charges | 11,573 | 15,334 |
| Accommodation | 5,672 | 5,609 |
| Medical practitioners | 17,971 | 16,273 |
| Shared Services (i) | 10,229 | 8,930 |
| Professional services | 1,815 | 2,669 |
| Maintenance of machinery and vehicles | 2,954 | 3,234 |
| Travel & subsistence | 1,171 | 1,171 |
| Staff related | 3,052 | 1,604 |
| Consultancy | 257 | 335 |
| Auditor’s remuneration (ii) | 122 | 122 |
| Other | 2,332 | 2,242 |
| Net increase/(decrease) in provisions | 617 | (561) |
| Total Operating costs | 241,778 | 276,653 |
(i) Shared Services includes expenditure on Shared Services Arvato and GIAA.
(ii) As an Executive Agency, the auditor’s remuneration is a notional fee for our Business Account of £91,000 (2015-16: £91,000) along with a notional fee for the statutory audit of the Trust Statement of £31,000 (2015-16: £31,000).
Note 4. Finance costs
| 2016-17 £000 |
2015-16 £000 |
|
|---|---|---|
| Finance costs | ||
| Interest on imputed finance lease part of on-balance sheet PFI contracts | 1,284 | 1,399 |
| Interest on finance lease liabilities | 1 | 6 |
| Unwinding/(Creation) of discount and impact of changes in discount rate on provisions (i) | 409 | (163) |
| Total finance costs | 1,694 | 1,242 |
(i) Discount rate changes made to reflect future liability payments at today’s prices, based on the latest discount rates published by HM Treasury.
Note 5. Property, plant and equipment
| 2016-17 | Land £000 |
Buildings (excl PFI fit out) £000 |
IT hardware £000 |
Plant and machinery £000 |
Furniture and fittings (incl PFI fit out £000 |
Motor vehicles £000 |
Total £000 |
|---|---|---|---|---|---|---|---|
| Cost or valuation | |||||||
| At 1 April 2016 | 4,080 | 64,648 | 7,335 | 25,940 | 23,891 | 880 | 126,774 |
| Additions | - | - | 2,962 | - | - | - | 2,962 |
| Disposals | - | - | (102) | (114) | (296) | - | (512) |
| Revaluations | - | 2,475 | 424 | 508 | 97 | 25 | 3,529 |
| At 31 March 2017 | 4,080 | 67,123 | 10,619 | 26,334 | 23,693 | 905 | 132,753 |
| Depreciation | |||||||
| At 1 April 2016 | - | 14,468 | 4,637 | 22,429 | 20,052 | 791 | 62,377 |
| Charged in year | - | 1,755 | 765 | 1,617 | 1,542 | 91 | 5,770 |
| Disposals | - | - | (102) | (114) | (296) | - | (512) |
| Revaluations | - | - | 266 | 415 | 42 | 23 | 746 |
| At 31 March 2017 | - | 16,223 | 5,566 | 24,347 | 21,340 | 905 | 68,381 |
| Net book value at 31 March 2016 | 4,080 | 50,180 | 2,698 | 3,511 | 3,839 | 89 | 64,397 |
| Net book value at 31 March 2017 | 4,080 | 50,900 | 5,053 | 1,987 | 2,353 | - | 64,372 |
| Asset financing | |||||||
| Owned | 3,500 | 27,525 | 5,053 | 1,987 | 536 | 38,601 | |
| Finance Lease | - | - | - | - | - | - | - |
| On-balance sheet PFI contracts | 580 | 23,375 | - | - | 1,817 | - | 25,771 |
| Net book value at 31 March 2017 | 4,080 | 50,900 | 5,053 | 1,987 | 2,353 | - | 64,372 |
| 2015-16 | Land £000 |
Buildings (excl PFI fit out) £000 |
IT hardware £000 |
Plant and machinery £000 |
Furniture and fittings (incl PFI fit out £000 |
Motor vehicles £000 |
Total £000 |
|---|---|---|---|---|---|---|---|
| Cost or valuation | |||||||
| At 1 April 2015 | 4,080 | 64,648 | 6,719 | 25,636 | 23,836 | 911 | 125,830 |
| Additions | - | - | 512 | 106 | 68 | - | 686 |
| Disposals | - | - | - | - | (33) | (36) | (69) |
| Transfer | - | - | - | - | - | - | - |
| Revaluations | - | - | 104 | 198 | 20 | 5 | 327 |
| At 31 March 2016 | 4,080 | 64,648 | 7,335 | 25,940 | 23,891 | 880 | 126,774 |
| Depreciation | |||||||
| At 1 April 2015 | - | 12,712 | 3,910 | 19,091 | 18,510 | 643 | 54,866 |
| Charged in year | - | 1,756 | 666 | 3,193 | 1,557 | 180 | 7,352 |
| Disposals | - | - | - | - | (35) | (34) | (69) |
| Transfer | - | - | - | - | - | - | - |
| Revaluations | - | - | 61 | 145 | 20 | 2 | 228 |
| At 31 March 2016 | - | 14,468 | 4,637 | 22,429 | 20,052 | 791 | 62,377 |
| Net book value at 31 March 2015 | 4,080 | 51,936 | 2,809 | 6,545 | 5,326 | 268 | 70,964 |
| Net book value at 31 March 2016 | 4,080 | 50,180 | 2,698 | 3,511 | 3,839 | 89 | 64,397 |
| Asset financing | |||||||
| Owned | 3,649 | 28,366 | 2,698 | 3,511 | 633 | - | 38,857 |
| Finance Lease | - | - | - | - | - | 89 | 89 |
| On-balance sheet PFI contracts | 431 | 21,814 | - | - | 3,206 | - | 25,451 |
| Net book value at 31 March 2016 | 4,080 | 50,180 | 2,698 | 3,511 | 3,839 | 89 | 64,397 |
Valuation of assets
The net book value of land includes freehold £3.5 million (2015-16: £3.5 million) and leasehold £0.6 million (2015-16: £0.6 million). Leasehold is made up of Richard Ley Development Centre £0.2 million (125 year lease) and Fforestfach £0.4 million (999 year lease). The net book value of buildings relates to our property with PFI buildings/refurbishment having a net book value of £23 million (2015-16: £22 million).
Analysis of depreciation, amortisation and impairment line in statement of comprehensive net expenditure.
| 2016-17 | 2015-16 | |
|---|---|---|
| £000 | £000 | |
| Depreciation of property, plant and equipment | 5,770 | 7,352 |
| (Profit) on disposal of property, plant and equipment and intangibles | - | (13) |
| Amortisation of intangible assets (note 6) | 21,345 | 32,115 |
| 27,115 | 39,454 |
Note 6. Intangible assets
| 2016-17 | Software licences £000 |
Software development £000 |
Assets under construction £000 |
Total £000 |
|---|---|---|---|---|
| Cost or valuation | ||||
| At 1 April 2016 | 18,474 | 265,243 | 732 | 284,449 |
| Additions | 1,241 | - | 4,205 | 5,446 |
| Disposals | (4,022) | (9,843) | - | (13,865) |
| Transfer | - | 767 | (767) | - |
| Revaluation | 53 | 100 | - | 153 |
| At 31 March 2017 | 15,746 | 256,267 | 4,170 | 276,183 |
| Amortisation | ||||
| At 1 April 2016 | 6,550 | 234,241 | - | 240,791 |
| Charged in year | 4,488 | 16,857 | - | 21,345 |
| Disposals | (4,022) | (9,843) | - | (13,865) |
| At 31 March 2017 | 7,016 | 241,255 | - | 248,271 |
| Net book value at 31 March 2016 | 11,924 | 31,002 | 732 | 43,658 |
| Net book value at 31 March 2017 | 8,730 | 15,012 | 4,170 | 27,912 |
| 2015-16 | Software licences £000 |
Software development £000 |
Assets under construction £000 |
Total £000 |
|---|---|---|---|---|
| Cost or valuation | ||||
| At 1 April 2015 | 5,501 | 252,854 | 8,037 | 266,392 |
| Additions | - | - | 18,057 | 18,057 |
| Transfer | 12,973 | 12,389 | (25,362) | - |
| At 31 March 2016 | 18,474 | 265,243 | 732 | 284,449 |
| Amortisation | ||||
| At 1 April 2015 | 4,506 | 204,170 | - | 208,676 |
| Charged in year | 2,044 | 30,071 | - | 32,115 |
| At 31 March 2016 | 6,550 | 234,241 | - | 240,791 |
| Net book value at 31 March 2015 | 995 | 48,684 | 8,037 | 57,716 |
| Net book value at 31 March 2016 | 11,924 | 31,002 | 732 | 43,658 |
Intangible additions of £5.4 million (2015-16: £18.1 million) have been included in respect of software under development which is due to be completed and brought into use in future years.
There were no contractual commitments for intangibles as at 31 March 2017 or 31 March 2016.
Significant intangible assets controlled by DVLA are detailed below:
| Asset | 31 March 2017 | 31 March 2016 | ||
|---|---|---|---|---|
| Remaining useful economic life | Net book value | Remaining useful economic life | Net book value | |
| (months) | £000 | (months) | £000 | |
| DVLA personalised registrations | - | - | 1 | 85 |
| Smart Tachographs – Phase 1 | - | - | 9 | 430 |
| Drivers casework system (CASP) - Technical Refresh | 11 | 4,450 | 23 | 9,239 |
| Weblogic | - | - | 3 | 313 |
| Payment Card Data Security | - | - | 5 | 371 |
| Abolition of Tax Disc | 12 | 346 | 24 | 687 |
| VED Direct Debits | 12 | 1,120 | 24 | 2,225 |
| IBM Extended Licence Agreement | 21 | 7,621 | 33 | 11,892 |
| Vehicle Management and Personalised Registrations | 12 | 1,064 | 24 | 2,113 |
| Digital Services Platform | 105 | 2,059 | 117 | 2,278 |
| Others | 11,252 | 14,025 | ||
| Total | 27,912 | 43,658 |
Remaining useful economic lives are in accordance with our IT transformation strategy.
Note 7. Trade and other receivables
| 31 March 2017 £000 |
31 March 2016 £000 |
|
|---|---|---|
| Amounts falling due within one year: | ||
| Trade receivables(i) | 2,798 | 3,110 |
| Other receivables | 194 | 264 |
| Public sector receivables | 12,099 | 9,569 |
| Concentrix/IBM prepayment – service delivery | - | 931 |
| Other prepayments | 11,268 | 4,443 |
| Accrued income | 7,528 | 13,129 |
| Total | 33,887 | 31,446 |
(i) Trade receivables 2016-17 of £2.8 million (2015-16: £3.1 million) includes £1.9 million (2015-16: £1.1 million) in relation to our personalised registration auctions.
This amount will, after deduction of costs, be paid over to HM Treasury during the subsequent financial year.
Note 8. Cash and cash equivalents
| 31 March 2017 £000 |
31 March 2016 £000 |
|
|---|---|---|
| At 1 April | 31,684 | 23,685 |
| Net change in cash and cash equivalent balances | 17,528 | 7,999 |
| At 31 March | 49,212 | 31,684 |
Note 9. Trade and other payables of which: current/non current
| 31 March 2017 £000 |
31 March 2016 £000 |
|
|---|---|---|
| Amounts falling due within one year | ||
| Trade payables | 13,926 | 9,988 |
| Accruals and deferred revenue | 26,818 | 36,076 |
| Current part of finance leases | - | 104 |
| Current part of imputed finance lease part of on balance sheet estates PFI contract | 2,302 | 2,181 |
| Cash balance payable to the Consolidated Fund | 25,627 | 17,909 |
| Amounts due to DfT in respect of Supply Funding | 3,655 | 1,775 |
| Other – capital accrual | 3,986 | 3,974 |
| VAT | 1,807 | 290 |
| 78,121 | 72,297 | |
| Amounts falling due after more than one year: | ||
| Imputed finance lease part of on-balance sheet estates PFI contract | 20,134 | 22,436 |
| Total | 98,255 | 94,733 |
The movements relating to the overall finance lease part of the Estates PFI contract are as follows:
| Imputed finance lease part of on-balance sheet Estates PFI contract | 2016-17 £000 |
2015-16 £000 |
|---|---|---|
| At 1 April 2016 | 24,617 | 26,682 |
| Amount paid in relation to assets capitalised | (2,181) | (2,065) |
| At 31 March 2017 | 22,436 | 24,617 |
Note 10. Financial instruments
Fair values
Due to the short-term nature of the financial instruments held, with the exception of Finance Lease and PFI liabilities, the carrying value is considered to represent the fair values. The other financial instruments, where carrying value is considered to represent fair values, are accounts payables, accounts receivables and cash. The fair values of our financial liabilities which differ from carrying amount as at 31 March are shown below.
| 2016-17 Fair value £000 |
2016-17 Carrying amount £000 |
2015-16 Fair value £000 |
2015-16 Carrying amount £000 |
|
|---|---|---|---|---|
| Financial liabilities | ||||
| Imputed finance lease part of on-balance sheet PFI contracts | 21,901 | 21,901 | 24,023 | 24,616 |
| Finance leases | - | - | 101 | 105 |
| Total financial liabilities | 21,901 | 21,901 | 24,124 | 24,721 |
The fair values above have been calculated using the discount rate implicit in the finance leases and PFI contract.
We have examined our contracts to identify embedded derivatives and concluded that where identified these are closely linked to the host contract and therefore need no adjustment.
Financial risk management
Our activities expose us to the following financial risks:
- credit risk – the possibility that the other parties might fail to pay amounts due to the agency
- liquidity risk – the possibility that we might not have funds available to meet our commitments to make payments
- market risk – the possibility that financial loss might arise for us as a result of changes in such measures as interest rates movements or foreign exchange rate movements.
Credit risk
Credit risk is the risk of suffering financial loss, should any of our customers or counterparties fail to fulfil their contractual obligations to us. Some of our customers and counterparties are other public sector organisations. There is no credit risk from these organisations.
For those customers and counterparties that are not public sector organisations, we have policies and procedures in place to ensure credit risk is kept to a minimum.
Exposure to credit risk
The carrying amount of the agency’s financial assets is consistent with fair value and represents the maximum credit exposure.
| Financial Assets | 31 March 2017 £000 |
31 March 2016 £000 |
|---|---|---|
| Cash and cash equivalents (note 8) | 49,212 | 31,684 |
| Loans and receivables (note 7) | ||
| - Trade receivables | 2,798 | 3,110 |
| - Other receivables | 194 | 264 |
| - Public sector receivables (includes VAT) | 12,099 | 9,569 |
| - Accrued income | 7,528 | 13,129 |
| Total loans and receivables | 22,619 | 26,072 |
| Total financial assets | 71,831 | 57,756 |
The ageing of receivables (gross) at the reporting date was:
| 31 March 2017 £000 |
31 March 2016 £000 |
|
|---|---|---|
| Not past due | 21,170 | 24,121 |
| Past due 0-30 days | 556 | 1,660 |
| Past due 31-120 days | 838 | 221 |
| More than 120 days | 55 | 70 |
| Total | 22,619 | 26,072 |
There is no impairment provision in either year as we believe that no allowance is necessary in respect of any of the trade receivables.
Liquidity risk
As our cash requirements are met through funds voted by Parliament, financial instruments play a more limited role in creating and managing risk than would apply to a non-public sector body.
Market risk
We are exposed to very limited market risk. We do not deal in financial transactions and also have very limited exposure to foreign exchange as the business is based in the UK. In addition, cash balances are held in non-interest bearing bank accounts.
Note 11. Provisions for liabilities and charges
| 2016-17 | Modernisation of network services (i) £000 |
Early departure costs £000 |
Tax officers’ pension costs £000 |
Other £000 |
Total £000 |
|---|---|---|---|---|---|
| Balance at 1 April 2016 | 14,609 | 893 | 2,603 | 1,341 | 19,446 |
| Provided in the year | 28 | 712 | - | 57 | 796 |
| Provision not required written back | - | - | (179) | - | (179) |
| Provisions utilised in the year | (1,635) | (1,143) | (383) | (126) | (3,287) |
| Unwinding of discount and impact of changes in discount rate (ii) | 266 | 9 | 165 | (31) | 409 |
| Balance at 31 March 2017 | 13,268 | 471 | 2,206 | 1,241 | 17,186 |
(i) The carrying value of the modernisation of network services provision relates to estates costs.
(ii) Discount rate changes made to reflect future liability payments at today’s prices, based on the latest rates published by HM Treasury.
| 2015-16 | Modernisation of network services (i) £000 |
Early departure costs £000 |
Tax officers’ pension costs £000 |
Other £000 |
Total £000 |
|---|---|---|---|---|---|
| Balance at 1 April 2015 | 17,802 | 1,687 | 3,198 | 1,520 | 24,207 |
| Provided in the year | - | 401 | - | - | 401 |
| Provision not required written back | (628) | - | (270) | (64) | (962) |
| Provisions utilised in the year | (2,359) | (1,206) | (349) | (123) | (4,037) |
| Unwinding of discount and impact of changes in discount rate (ii) | (206) | 11 | 24 | 8 | (163) |
| Balance at 31 March 2016 | 14,609 | 893 | 2,603 | 1,341 | 19,446 |
Analysis of expected timing of discounted cash flows
| 2016-17 | Modernisation of network services £000 |
Early departure costs £000 |
Tax officers’ pension costs £000 |
Other £000 |
Total £000 |
|---|---|---|---|---|---|
| Not later than one year | 2,181 | 291 | 394 | 130 | 2,996 |
| Later than one year and not later than five years | 6,580 | 180 | 1,050 | 598 | 8,408 |
| Later than five years | 4,507 | - | 762 | 513 | 5,782 |
| Balance at 31 March 2017 | 13,268 | 471 | 2,206 | 1,241 | 17,186 |
| 2015-16 | Modernisation of network services £000 |
Early departure costs £000 |
Tax officers’ pension costs £000 |
Other £000 |
Total £000 |
|---|---|---|---|---|---|
| Not later than one year | 2,362 | 438 | 397 | 128 | 3,325 |
| Later than one year and not later than five years | 6,300 | 455 | 1,283 | 569 | 8,607 |
| Later than five years | 5,947 | - | 923 | 644 | 7,514 |
| Balance at 31 March 2017 | 14,609 | 893 | 2,603 | 1,341 | 19,446 |
Modernisation of network services
Future payments to be made under the provision for the modernisation of network services are discounted at the HM Treasury advised rates for General Provisions as shown below:
| Discount rates | 31 March 2017 | 31 March 2016 |
|---|---|---|
| 0 to 5 years | -2.70% | -1.55% |
| 5 to 10 years | -1.95% | -1.00% |
| More than 10 years | -0.80% | -0.80% |
Early departure costs
We meet the additional costs of benefits beyond the normal PCSPS/stakeholder scheme benefits in respect of employees who retire early by paying the required amounts annually to the PCSPS/Stakeholder schemes over the period between early departure and normal retirement date of age 60. We provide for this in full when the early retirement programme becomes binding by establishing a provision for the estimated payments discounted by the HM Treasury discount rate of 0.24% (2015-16: 1.37%) in real terms.
Tax officer pension costs
Under the Pension Increase Act 1971, we have a liability to contribute to the pensions of ex local taxation office staff. These staff were employed on driver and vehicle licensing work before the creation of the Driver and Vehicle Licensing Centre. Under the Vehicle and Driving Licence (Compensation to Officers) Regulations 1977, we make compensation payments to local authority staff in respect of loss of emoluments when the local taxation offices closed. The provision is based on advice from the Government Actuary’s Department, and is re-assessed normally every three years with a full revaluation last carried out on 31 March 2016.
Following the estimations of future cash flows provided by the Government Actuary’s Department future payments to be made in relation to this provision have been discounted at the HM Treasury advised rate of 0.24% (2015-16: 1.37%).
Other – Shared Services
We have a contractual obligation to pay an ‘unavoidable cost’ for a property occupied by Shared Services Arvato (previously occupied by DfT Shared Service Centre before divestment on 1 June 2013), in the form of a monthly unitary charge. The carrying value of the provision at the end of the 2016-17 financial year is £1.2 million (2015-16: £1.3 million).
Note 12. Commitments under leases
Operating leases
| Future payments under operating leases comprise: | 31 March 2017 £000 |
31 March 2016 £000 |
|---|---|---|
| Buildings | ||
| Not later than one year | 299 | 293 |
| Later than one year and not later than five years | 107 | 232 |
| 406 | 525 |
| Other: | 31 March 2017 £000 |
31 March 2016 £000 |
|---|---|---|
| Not later than one year | 355 | 166 |
| Later than one year and not later than five years | 185 | - |
| 540 | 166 |
Finance leases
| Future payments under finance leases comprise: | 31 March 2017 £000 |
31 March 2016 £000 |
|---|---|---|
| Other | ||
| Not later than one year | - | 105 |
| Later than one year and not later than five years | - | - |
| Less interest element | - | (1) |
| - | 104 |
Expenditure is capitalised and depreciated over the life of the associated asset and the finance lease creditor is released over the five year life of the agreement. Finance lease interest is expensed at a constant periodic rate on the outstanding balance of the liability.
Note 13. Commitments under Private Finance Initiative (PFI) on-balance sheet contracts
On-balance sheet
| 31 March 2017 | 31 March 2016 | |
|---|---|---|
| Future payments under on-balance sheet estates PFI contract for the following periods comprise: | £000 | £000 |
| Not later than one year | 3,464 | 3,464 |
| Later than one year and not later than five years | 13,857 | 13,857 |
| Later than five years | 10,392 | 13,857 |
| 27,713 | 31,178 | |
| Less interest element | (5,277) | (6,561) |
| 22,436 | 24,617 |
Charge to the statement of comprehensive net expenditure and future commitments
The total amount charged to the statement of comprehensive net expenditure in respect of the service part of on-balance sheet PFI transactions was £19.4 million (2015-16: £18.7 million). The payments to which we are committed during the next year, excluding amounts already provided for in the modernisation of network services provision (note 11), analysed by the date of payment are as follows:
| 2016-17 £000 |
2015-16 £000 |
|
|---|---|---|
| Not later than one year | 19,598 | 18,298 |
| Later than one year and not later than five years | 85,164 | 79,639 |
| Later than five years | 70,563 | 89,536 |
| 175,325 | 187,473 | |
Our estates development and refurbishment programme is delivered through the Estates PFI contract with Telereal Trillium. Assets are capitalised in line with our capitalisation policy and a corresponding PFI liability recognised. The annual unitary charge is separated between capital repayments, finance interest and a service charge element.
PFI finance interest is expensed at a constant periodic rate on the outstanding balance of the liability.
Note 14. Other financial commitments
We have entered into non-cancellable contracts (which are not leases or PFI contracts); the most significant are in relation to the following:
- front office counter services including vehicle licensing, driver licence application checking, renewal of photo licence
- wheelclamping services.
The key payments to which we are committed, analysed by the date of payment are as follows:
| 2016-17 £000 |
2015-16 £000 |
|
|---|---|---|
| Not later than one year | 39,276 | 26,573 |
| Later than one year and not later than five years | 39,872 | 43,145 |
| 79,148 | 69,718 | |
Note 15. Contingent liabilities
There are no contingent liabilities.
Note 16. Contingent assets
There are no contingent assets.
Note 17. Related parties
We are sponsored by the Roads, Devolution and Motoring Group at DfT that also sponsors one Trading Fund, Driver and Vehicle Standards Agency (DVSA).
DfT is regarded as a related party and we have a significant number of material transactions with DfT, most notably in respect of the supply funding. In addition, we have had a significant number of material transactions with other government departments and central government bodies. Most of these transactions have been with Department of Work and Pensions, DVSA, Home Office, HM Passport Office and Post Office.
None of the ET members or key managerial staff or other related parties has undertaken any material transactions with the agency during the year.
Note 18. Events after the reporting period
There have been no events since the balance sheet date that impact on the understanding of these financial statements.
These financial statements are laid before the House of Commons by DfT. IAS 10 requires us to disclose the date on which the accounts are authorised for issue. This is the date that the Comptroller and Auditor General signs the certificate.
DVLA Trust Statement for 2016-17
Statement of revenue and expenditure for the year ended 31 March 2017
| Note | 2016-17 £m |
2015-16 £m |
|
|---|---|---|---|
| Revenue | |||
| Licence fees and taxes - VED | 3 | 5,876 | 5,930 |
| Fines and penalties - enforcement | 4 | 41 | 31 |
| HGV Road User Levy | 5 | 211 | 197 |
| Total revenue and other income | 6,128 | 6,158 | |
| Expenditure | |||
| Payment to HM Revenue and Customs | 6 | - | (3) |
| Credit losses – amounts written off | 7 | - | (1) |
| Total expenditure | - | (4) | |
| Net revenue for the Consolidated Fund | 6,128 | 6,154 |
There were no recognised gains or losses accounted for outside the above statement of revenue and expenditure.
Statement of financial position as at 31 March 2017
| Note | 31 March 2017 £m |
31 March 2016 £m |
|
|---|---|---|---|
| Current assets | |||
| Trade and other receivables | 7 | 53 | 96 |
| Cash and cash equivalents | 44 | 65 | |
| Total current assets | 97 | 161 | |
| Current liabilities | |||
| Deferred revenue | 8 | (2,018) | (2,126) |
| Trade payables | 8 | (14) | (14) |
| Total current liabilities | (2,032) | (2,140) | |
| Total net liabilities | (1,935) | (1,979) | |
| Represented by: | |||
| Balance on Consolidated Fund | |||
| Account as at 31 March 2017 | 9 | (1,935) | (1,979) |
Oliver Morley CBE
Accounting Officer and Chief Executive, DVLA
28 June 2017
Statement of cash flows for the year ended 31 March 2017
| 2016-17 £m |
2015-16 £m |
|
|---|---|---|
| Net cash flow from revenue activities | 6,063 | 5,903 |
| Cash paid to Consolidated Fund | (6,084) | (5,933) |
| (Decrease) in cash in this period | (21) | (30) |
Notes to the statement of cash flows
Reconciliation of net cash flow to movement in net funds
| 2016-17 £m |
2015-16 £m |
|
|---|---|---|
| Net revenue for the Consolidated Fund | 6,128 | 6,154 |
| Decrease/(Increase) in trade and other receivables | 43 | (19) |
| (Decrease) in trade and other payables | (108) | (232) |
| Net cash flow from revenue activities | 6,063 | 5,903 |
Analysis of changes in net funds
| 2016-17 £m |
2015-16 £m |
|
|---|---|---|
| (Decrease) in cash in this period | (21) | (30) |
| Net funds as at 1 April | 65 | 95 |
| Net funds as at 31 March | 44 | 65 |
Notes to the Trust Statement
Note 1. Statement of accounting policies
Basis of accounting
We prepare a Trust Statement (‘the Statement’) for the financial year ended 31 March 2017 for the revenue and other income, as directed by HM Treasury, collected by the agency as an agent for others. It is done in compliance with the accounting principles and disclosure requirements of the edition of the Government Financial Reporting Manual by HM Treasury (‘FReM’) which is in force for 2016-17.
The Trust Statement is prepared in accordance with the accounts direction issued by HM Treasury under Section 2 of the Exchequer and Audit Departments Act 1921. The Trust Statement is prepared in accordance with the accounting policies detailed below. These have been agreed between DVLA, DfT and HM Treasury and have been developed with reference to International Financial Reporting Standards and other relevant guidance.
The accounting policies have been applied consistently in dealing with items considered material in relation to the accounts.
The revenue and associated expenditure contained in these statements are those flows of funds which we handle on behalf of the Consolidated Fund and where it is acting as agent rather than as principal. Although showing net liabilities because of the differences between the recognition of revenue and the payment of cash these accounts are prepared on a going concern basis.
The financial information contained in the statements and in the notes is rounded to the nearest £million.
Accounting convention
These accounts have been prepared on an accruals basis and in accordance with the historical cost convention.
General accounting policies
Revenue
VED, fines and penalties and HGV Levy are measured in accordance with IAS 18. They are measured at the fair value of amounts received or receivable net of repayments. Revenue is recognised when:
- a taxable event has occurred, the revenue can be measured reliably and it is probable that the economic benefits from the taxable event will flow to the Exchequer. A taxable event occurs in the case of VED and UK HGV Levy when it is collected from a taxpayer (non UK levy at point of purchase), as under FReM 8.2.3, we do not recognise income in relation to evasion. Licence fees are deemed to accrue evenly over the period for which the licence is valid. Repayments are accounted for on a cash basis and recognised in the year in which payment is made
- a penalty is validly imposed and an obligation to pay arises
Late Licensing Penalty (LLP) letters are issued to vehicle keepers who fail to relicense or declare Statutory off Road Notification (SORN) within 2 months of licence expiry. Fine payments are made through our contact centre. We also employ debt collectors to recover fines not recovered directly.
Debt collection agents are issued cases monthly from us to pursue further. Revenue is either recovered by agents and paid over to DVLA gross or paid directly to us from customers. Commission earned by agents is invoiced to us separately. We pay LLP income net of commission to HM Treasury as Consolidated Fund Extra Receipts under a specific arrangement.
Continuous Insurance Enforcement (CIE) was introduced in 2011-12 when it became an offence to be the registered keeper of an uninsured vehicle. A registered vehicle must be insured at all times unless it is being kept off road and a SORN made.
Fixed penalty notices are issued to registered keepers who fail either to insure or are not CIE exempt through vehicle status or tax class. The £100 penalty notice is reduced to £50 if paid within 21 days.
Other income
The HGV Road User Levy applies to HGVs weighing 12 tonnes or more and is aimed at ensuring these vehicles make a contribution to the wear and tear of the UK road network. UK hauliers make levy payments in accordance with pre-existing arrangements for VED. Non-UK hauliers make levy payments through a third party, Northgate Public Services. The role of Northgate is to administer this charge and to make pay-overs to HM Treasury, which are accounted for within the Trust Statement.
Business Account
The following transactions are accounted for in the Business Account set out earlier in this document and are covered by its related accounting policies:
a) Fixed assets
b) Losses
c) Cost of collection and enforcement of VED.
Use of estimates and judgements
The preparation of the financial statements in conformity with International Financial Reporting Standards requires management to make judgements, estimates and assumptions that affect the application of accounting policies, and the reported amounts of assets, liabilities, income and expenses. Actual results may differ from these estimates.
Estimates and underlying assumptions are reviewed on an ongoing basis. Revisions to accounting estimates are recognised in the period in which the estimates are revised and in any future periods affected.
Information about critical judgements in applying accounting policies that have the most significant effect on the amounts recognised in the financial statements is included in note 7.
Bad and doubtful debts
To give a true and fair view, it is necessary to make allowance for those VED and enforcement receivables that we believe will be unlikely to be received in the future.
A provision has been estimated using analysis of historic trends in debt recovery and write-offs and is supported by management judgement.
Evasion
The costs of VED evasion are outside the scope of the Trust Statement.
Related party disclosure
We are part of DfT. We have a large number of VED transactions with both local and central government bodies; at present these are not separately identifiable by DVLA.
Deferred revenue
The deferred revenue balance relates to VED for one off payments of 6 or 12 months received in 2016-17 relating to 2017-18.
Deferred revenue is based on the data collected at source using the period of the VED licence purchased.
A proportion of the deferred revenue balance will be claimed as a refund of duty during 2017-18. The value of refunds for 2016-17 is shown in note 3.
Note 2. Direct Debit
Motorists have the option of either paying a one-off amount in respect of 6 or 12 months VED or alternatively, paying for 12 months VED in monthly instalments. As at 31 March 2017, £0.9 billion (2015-16: £0.9 billion) was due in respect of VED monthly instalments to be settled in the next financial year. This balance is not recognised within the statement of financial position as these monies will not be collected should the vehicles be sold or declared off road and all the balance represents VED income to be recognised in the next financial year.
Note 3. Licence fees and taxes - VED
| 2016-17 £m |
2015-16 £m |
|
|---|---|---|
| Total Gross VED | 6,214 | 6,287 |
| Amounts refunded | (338) | (357) |
| Total | 5,876 | 5,930 |
Licence fees and taxes includes £7.3 million (2015-16: £9.7 million) of receipts from DfT in respect of Reduced Pollution Certificate (RPC) discounts. These receipts meet the short-fall in VED payments from UK hauliers, eligible for the RPC, following implementation of the HGV Road User Levy.
Note 4. Analysis of enforcement fines and penalties
| Vehicle Excise Duty | Continuous Insurance (CIE) | Totals | |||
|---|---|---|---|---|---|
| Late Licensing Penalties (LLP) | Traditional enforcement | wheel clamping | |||
| 2016-17 | £m | £m | £m | £m | £m |
| Offences in: | |||||
| 2015-16 | 1 | 1 | - | - | 2 |
| 2016-17 | 19 | 9 | 10 | 5 | 43 |
| Commission paid | (4) | - | - | - | (4) |
| Total | 16 | 10 | 10 | 5 | 41 |
| Vehicle Excise Duty | Continuous Insurance (CIE) | Totals | |||
|---|---|---|---|---|---|
| Late Licensing Penalties (LLP) | Traditional enforcement | wheel clamping | |||
| 2015-16 | £m | £m | £m | £m | £m |
| Offences in: | |||||
| 2014-15 | - | 1 | - | - | 1 |
| 2015-16 | 12 | 7 | 8 | 5 | 35 |
| Commission paid | (2) | - | - | - | (2) |
| Total | 10 | 8 | 8 | 5 | 31 |
LLP income collected by debt collectors is included in the LLP figures. Amounts collected by debt collectors totalled £12.1million in 2016-17 (2015-16: £9.8 million).
Note 5. HGV Road User Levy
| 2016-17 £m |
2015-16 £m |
|
|---|---|---|
| UK hauliers | 157 | 148 |
| Non-UK hauliers | 54 | 49 |
| Total | 211 | 197 |
Note 6. Payments to HM Revenue and Customs – Shipbuilders’ Relief
Payments to HMRC total £0.1 million (2015-16: £2.8 million).
Shipbuilders’ Relief is a payment to HM Revenue and Customs (HMRC) under the Finance Act 1966, to provide assistance to the shipbuilding industry. It aims to relieve shipbuilders of VED, the duty on hydrocarbon oil and Value Added Tax incurred in the course of constructing a vessel.
On the 12 January 2004, the Economic Secretary to the Treasury confirmed the abolition, in full and with immediate effect, of the Shipbuilders’ Relief. This announcement means that Shipbuilders’ Relief will not be paid in respect of any contracts for vessels signed after 12 January 2004.
We have a contingent liability (which cannot be quantified at this time) with respect to contracts signed on or before that date. We will honour all claims in respect of:
- contracts signed on or before 31 December 2000 in respect of classes of vessel explicitly covered by EC Regulation 1540/98
- contracts signed on or before 12 January 2004 in respect of classes of vessel not explicitly covered by EC Regulation 1540/98.
Note 7. Trade and other receivables
| 31 March 2017 £m |
31 March 2016 £m |
|
|---|---|---|
| Licence fees and taxes – VED | 42 | 63 |
| Fines and penalties – enforcement | 12 | 15 |
| HGV Road User Levy | 4 | 25 |
| Total before estimated impairments | 58 | 103 |
| Less estimated provision for impairments | (5) | (7) |
| Total | 53 | 96 |
The Licence Fees and Taxes – VED receivable includes amounts due from the Post Office, £29 million (2015-16: £46 million).
Direct Debit defaulters who have failed to honour their mandates amounted to £6.5 million (2015-16: £7.3 million). This equates to 0.36% of total Direct Debit income (2015-16: 0.5%).
All debt will be due to the Consolidated Fund when realised.
Change to impairments
| 2016-17 £m |
2015-16 £m |
|
|---|---|---|
| Balance as at 1 April 2016 | (7) | (8) |
| Change in estimated value of impairments | 2 | 1 |
| Balance as at 31 March 2017 | (5) | (7) |
A provision is made for potential bad debts based on the value of open cases as at 31 March 2017 and historical data on recovery of VED and enforcement receivables.
Receivables in the balance sheet are reported after the deduction of the estimated value of impairments.
A provision of 1.5% is made for doubtful dishonoured cheque VED cases resulting in a movement of £0.1 million in 2016-17 (31 March 2016: £0.1 million).
Credit losses – amounts written off
| 2016-17 £m |
2015-16 £m |
|
|---|---|---|
| VED | 1 | 1 |
| VED enforcement | 1 | 1 |
| Change in the value of impairments | (2) | (1) |
| Total recognised in SRE | - | 1 |
Amounts written off in respect of VED Enforcement relate to waived and abandoned fines and penalties during 2016-17.
Note 8. Trade and other payables
| Trade payables 31 March 2017 |
Deferred revenue 31 March 2017 |
Total 31 March 2017 |
31 March 2016 | |
|---|---|---|---|---|
| £m | £m | £m | £m | |
| VED | - | (2,018) | (2,018) | (2,126) |
| Motor trade | (2) | - | (2) | (4) |
| Other | (12) | - | (12) | (10) |
| Total | (14) | (2,018) | (2,032) | (2,140) |
Motor trade payables are where customers hold pre-payment accounts, or payments have been made but the service has not yet been provided.
Other payables include an accrued cost to HMRC for a payment of Shipbuilders’ Relief of £0.1 million (2015-16: £2.8 million) and also £10.8 million relating to cash collected in the Trust Statement due to the Business Account (31 March 2016: £7 million).
There are no trade or other payables in respect of VED enforcement.
Note 9. Balance on Consolidated Fund account
| 2016-17 £m |
2015-16 £m |
|
|---|---|---|
| Balance as at 1 April | (1,979) | (2,200) |
| Net revenue for the Consolidated Fund | 6,128 | 6,154 |
| Less amount paid to Consolidated Fund | (6,084) | (5,933) |
| Balance on the Consolidated Fund Account as at 31 March 2017 | (1,935) | (1,979) |
Note 10. Events after the reporting period
There have been no events since the balance sheet date that impact on the understanding of these financial statements.
These financial statements are laid before the House of Commons by DfT. IAS 10 requires us to disclose the date on which the accounts are authorised for issue. This is the date that the Comptroller and Auditor General signs the certificate.
6.1 Appendix A
Accounts Direction given by the Treasury in accordance with section 7 (2) of the Government Resources and Accounts Act 2000
-
This direction applies to those executive agencies listed in this appendix.
-
These executive agencies shall prepare accounts for the year ended 31 March 2017 in compliance with the accounting principles and disclosure requirements of the edition of the Government Financial Reporting Manual issued by HM Treasury (‘the FReM’) which is in force for 2016-17.
-
The accounts shall be prepared so as to:
(a) give a true and fair view of the state of affairs as at 31 March 2017 and of the income and expenditure (or, as appropriate, net resource outturn), changes in taxpayers’ equity and cash flows of the agency for the financial year then ended; and
(b) provide disclosure of any material expenditure or income that has not been applied to the purposes intended by Parliament or material transactions that have not conformed to the authorities which govern them.
- Compliance with the requirements of the FReM will, in all but exceptional circumstances, be necessary for the accounts to give a true and fair view. If, in these exceptional circumstances, compliance with the requirements of the FReM is inconsistent with the requirement to give a true and fair view, the requirements of the FReM should be departed from only to the extent necessary to give a true and fair view. In such cases, informed and unbiased judgement should be used to devise an appropriate alternative treatment which should be consistent with both the economic characteristics of the circumstances concerned and the spirit of the FReM. Any material departure from the FReM should be discussed in the first instance with HM Treasury.
Vicky Rock
Deputy Director
Government Financial Reporting
HM Treasury
19 December 2016
Application of the Accounts Direction
This Accounts Direction applies to the following executive agencies:
| Name | Department |
|---|---|
| Treasury Solicitor’s Department Agency | Attorney General |
| Insolvency Service | BEIS |
| National Measurement and Regulation Office | BEIS |
| UK Space Agency | BEIS |
| Oil and Gas Authority | BEIS |
| Planning Inspectorate | DCLG |
| Royal Parks | DCMS |
| Animal and Plant Health Agency | DEFRA |
| Centre for the Environment, Fisheries and Aquaculture Science | DEFRA |
| Food and Environment Research Agency (Fera) | DEFRA |
| Rural Payments Agency | DEFRA |
| Veterinary Medicines Directorate | DEFRA |
| Standards and Testing Agency | DFE |
| National College for Teaching and Leadership | DFE |
| Education Funding Agency | DFE |
| Driver and Vehicle Licensing Agency | DfT |
| Maritime and Coastguard Agency | DfT |
| Vehicle Certification Agency | DfT |
| Wilton Park | FCO |
| Forest Research | Forestry Commission |
| Valuation Office Agency | HMRC |
| UK Debt Management Office | HMT |
| Government Internal Audit Agency | HMT |
| The National Infrastructure Commission | HMT |
| Criminal Records Bureau | HO |
| Identify and Passport Service | HO |
| National Fraud Authority | HO |
| HM Courts and Tribunals Service | MOJ |
| National Offender Management Service | MOJ |
| Office of the Public Guardian | MOJ |
| Legal Aid Agency | MOJ |
| Criminal Injuries Compensation Authority | MOJ |
| Public Health England | DH |
| Defence Electronic Components Agency | MOD |
Accounts Direction given by HM Treasury in accordance with Section 2 of the Exchequer and Audit Departments Act 1921
-
The agency shall prepare a Trust Statement (‘the Statement’) for the financial year ended 31 March 2017 for the revenue and other income, as directed by the Treasury, collected by the agency as an agent for others, in compliance with the accounting principles and disclosure requirements of the edition of the Government Financial Reporting Manual by HM Treasury (‘FReM’) which is in force for 2016-17.
-
The statement shall be prepared so as to give a true and fair view of (a) the state of affairs relating to the collection and allocation of taxes, licence fees, fines and penalties and other income by the agency as agent and of the expenses incurred in the collection of those taxes, licence fees, fines and penalties insofar as they can properly be met from that revenue and other income; (b) the revenue and expenditure; and (c) the cash flows for the year then ended.
-
The statement shall also be prepared so as to provide disclosure of any material expenditure or income that has not been applied to the purposes intended by Parliament or material transactions that have not conformed to the authorities which govern them.
-
When preparing the statement, the agency shall comply with the guidance given in the FReM (Chapter 8). The agency shall also agree with HM Treasury the format of the Principal Accounting Officer’s Foreword to the statement, and the supporting notes, and the accounting policies to be adopted, particularly in relation to revenue recognition. Regard shall also be given to all relevant accounting and disclosure requirements in Managing Public Money and other guidance issued by HM Treasury, and to the principles underlying International Financial Reporting Standards.
-
Compliance with the requirements of the FReM will, in all but exceptional circumstances, be necessary for the accounts to give a true and fair view. If, in these exceptional circumstances, compliance with the requirements of the FReM is inconsistent with the requirement to give a true and fair view, the requirements of the FReM should be departed from only to the extent necessary to give a true and fair view. In such cases, informed and unbiased judgement should be used to devise an appropriate alternative treatment which should be consistent with both the economic characteristics of the circumstances concerned and the spirit of the FReM. Any material departure from the FReM should be discussed in the first instance with HM Treasury.
-
The statement shall be transmitted to the Comptroller and Auditor General for the purpose of his examination and report by a date agreed with the Comptroller and Auditor General and HM Treasury to enable compliance with the administrative deadline for laying the audited accounts before Parliament before the Summer Recess.
-
The Trust Statement, together with this direction (but with the exception of the related appendices) and the Report produced by the Comptroller and Auditor General, under Section 2 of the Exchequer and Audit Departments Act 1921 shall be laid before Parliament at the same time as the Department’s Resource Accounts for the year unless the Treasury have agreed that the Trust Statement may be laid at a later date.
Vicky Rock
Deputy Director
Government Financial Reporting
HM Treasury
19 December 2016
Trust Statement for the year ended 31 March 2017
1.The Trust Statement shall include:
- Foreword by the Principal Accounting Officer
- Statement of the Principal Accounting Officer’s Responsibilities
- Governance Statement
- Statement of Revenue, Other Income and Expenditure
- Statement of Financial Position
- Cash Flow Statement
- such notes as may be necessary to present a true and fair view.
2.The notes shall include among other items:
- the accounting policies, including the policy for revenue recognition and estimation techniques and forecasting techniques together with statements explaining any significant uncertainty surrounding estimates and forecasts
- a breakdown of material items within the accounts
- any assets, including intangible assets and contingent liabilities
- summaries of losses, write-offs and remissions
- post balance sheet events
- any other notes agreed with HM Treasury and the National Audit Office.
| Sponsoring department | Income stream | Responsible entity |
|---|---|---|
| Department for Transport | Vehicle Excise Duty (VED) and VED enforcement i.e. fines and penalties | DVLA |