Wild bird populations in the UK and England, 1970 to 2025
Updated 13 October 2026

© Crown copyright 2026
This publication is licensed under the terms of the Open Government Licence v3.0 except where otherwise stated. To view this licence, visit nationalarchives.gov.uk/doc/open-government-licence/version/3 or write to the Information Policy Team, The National Archives, Kew, London TW9 4DU, or email: psi@nationalarchives.gov.uk.
Where we have identified any third party copyright information you will need to obtain permission from the copyright holders concerned.
This publication is available at https://www.gov.uk/government/statistics/wild-bird-populations-in-the-uk/wild-bird-populations-in-the-uk-and-england-1970-to-2025
Use of the data
This information is licensed under the Open Government Licence v3.0. To view visit the Open Government Licence for public sector information or write to the:
Information Policy Team,
The National Archives,
Kew,
London TW9 4DU
or e-mail: psi@nationalarchives.gsi.gov.uk
Accredited Official Statistics
Accredited official statistics are called National Statistics in the Statistics and Registration Service Act 2007. An explanation can be found on the Office for Statistics Regulation website. Our statistical practice is regulated by the Office for Statistics Regulation (OSR). OSR sets the standards of trustworthiness, quality and value in the Code of Practice for Statistics that all producers of official statistics should adhere to. You can read about how Official Statistics in Defra comply with these standards on the Defra Statistics website.
These accredited official statistics were independently reviewed by the Office for Statistics Regulation in February 2012, with an additional compliance check in 2023. See Assessment Report 173 Statistics on Sustainability and the Environment in England and the UK. They comply with the standards of trustworthiness, quality and value in the Code of Practice for Statistics and should be labelled ‘Accredited Official Statistics’. Since that assessment by the Office for Statistics Regulation, we have continued to comply with the Code of Practice for Statistics.
You are welcome to contact us directly with any comments about how we meet these standards (see contact details below). Alternatively, you can contact OSR by emailing regulation@statistics.gov.uk or via the OSR website.
Responsible Statistician: Clare Betts
Contact details
Email: biodiversity.statistics@defra.gov.uk
Tel: 03459 335577 (Defra enquiries) Find out more about call charges at – GOV.UK (www.gov.uk)
Biodiversity and wildlife statistics - GOV.UK (www.gov.uk)
Key changes to the UK and England wild bird publication
Updates for this publication are:
- All chapters have been updated using the latest available data. Breeding bird trends extend to 2025, while wintering waterbird trends extend to winter 2024/2025.
- The UK and England overall breeding bird indicators have been revised to correct the treatment of species time series and duplicated trends, and to incorporate updated species trends and start dates. Two species have also been added to the UK indicator. See Revisions to the overall breeding bird indicators for the UK and England for more information.
- Following a review of the classification approach for species trends, the method for long-term trend classification has been updated. Long-term trends are now based on total population change across the full time series, using thresholds derived from the Birds of Conservation Concern status assessment. The approach to short-term trends is unchanged, and continues to apply these thresholds to mean annual change. This change to the classification of long-term trends will result in more species being classed as declining or increasing. Care should therefore be taken when comparing these results with trends published in 2025. See Revised calculation of long-term trends for individual species for more information.
- A review of habitat sub indicators has led to the removal of six sub indicators: three from the water and wetland bird chapter (birds of fast flowing water, reedbeds and slow flowing and standing water), one from the upland bird chapter (riparian birds) and both sub indicators from the seabird chapter (subsurface feeders and surface feeders). See Removal of habitat sub-indicators for more information.
- A recent review by the BTO of the analytical methods used in the Seabird Monitoring Programme (SMP) species population indices, including confidence estimation, has led to the development of revised approaches. The revised trends have been incorporated into the aggregate seabird indicators, which now include 95% confidence intervals. See Revised seabird trend methodology for more information.
Summary
Since 1970, the breeding bird indicator has declined by 19% in the UK and by 15% in England, indicating a long-term reduction in the abundance of common wild birds. Most of this decline occurred between the late 1970s and early 1990s, driven largely by decreases in woodland and farmland bird populations. Since the mid-2010s, the indicators have shown a renewed downward trend. Recent declines have been particularly evident among seabirds and farmland birds, although several other bird groups have also decreased over this period.
Throughout this publication, you will find chapters on:
- The overall breeding bird indicators chapter 1
- Farmland birds chapter 2
- Woodland birds chapter 3
- Water and wetland birds chapter 4
- Seabirds chapter 5
- Upland birds chapter 6
- Wintering waterbirds chapter 7
Introduction
Why monitor bird populations
Bird populations have long been considered to provide a good indication of the broad state of wildlife in the UK. This is because they occupy a wide range of habitats and respond to environmental pressures that also operate on other groups of wildlife. In addition, there are considerable long-term data on trends in bird populations, allowing for comparison between trends in the short term and long term. Because they are a well-studied taxonomic group, drivers of change for birds are better understood than for many other species groups, which enables better interpretation of any observed changes. Birds also have huge cultural importance and are highly valued as a part of the UK’s natural environment by the general public. Although bird indicators can reflect the health of the natural environment more widely, those presented in this publication should not be used in isolation to infer the status of all other species groups.
It is not practical to determine changes in the actual number of birds for each species in the UK and England each year, but it is possible to reliably assess the status of many species by calculating relative change, based on counts on representative sample plots surveyed as part of national monitoring schemes (see Main notes at the end for more details of the survey sources used).
Trends in bird populations are used by policy makers, government agencies and non-governmental organisations as part of the evidence base with which to assess the effects of environmental management, such as agricultural practices or woodland management, on bird populations. The trends are also used to assess the effectiveness of environmental interventions intended to address declines, such as agri-environment schemes targeted at farmland birds. See the Guide to species indicators for more information about other species indicators published by Defra.
Understanding the bird population indices
Individual bird species population trends, based on carefully designed surveys undertaken largely by volunteer experts, are calculated as a series of annual indices. These relate the population in a given year to a ‘baseline’ – the first year that data are available – which is given a value of 100. Thereafter, the index is expressing the population as a percentage of this ‘baseline’.
This annual Defra Accredited Official Statistics Release presents data trends up to 2025 in populations of common birds (species with a population of at least 500 breeding pairs in the UK, or 300 breeding pairs in England) that are native to, and breed in, the UK, with trends overall as well as for six main habitat groups (see relevant data sets published alongside this update for a list of birds in each group). The release also presents trends up to 2024/2025 for wintering waterbird populations, some of which also breed in the UK. In each chapter there are species that are included in the overall indicator, but not the habitat breakdowns, or are present in multiple habitat breakdowns.
The charts presented combine individual species indices into a single indicator to provide an overall trend for each group mentioned above using a geometric mean - an average calculated by multiplying a set of index values and taking the nth root, where n is the number of index values. More information can be found in A Brief Introduction to the Wild Birds Populations Indicator. The indices are considered to give reliable medium to long-term trends, but strong reliance should not be attached to short-term changes from year to year.
Assessing trends
The text refers to smoothed trends, which are used to assess formally the statistical significance of change over time. Smoothed trends are used for both long and short-term assessments as they reduce the short-term peaks and troughs resulting from, for example, year-to-year weather and sampling variations as well as good or bad breeding seasons. For more information on the analytical methods see the BTO website (Fewster et al. 2000. Ecology 81: 1970-1984). The final data points in smoothed trends, and in particular the most recent point, that is, 2025 in this update, can change in subsequent publications due to the smoothing process being applied and to additional data included in future updates (see BTO Research Report on ‘Production of smoothed population trends when a year of data is missing’ on the BTO’s ‘Bird Indicators’ web page). Results and estimates of change are based on smoothed indices but unsmoothed trends are also provided in the associated data sheets.
These trends are based on estimates from surveys. Smoothed trends are presented with 95% confidence intervals, which are a measure of the precision of these survey estimates: a 95% confidence interval means users can expect that the true change in abundance relative to the baseline year falls within the confidence interval around it 95% of the time, were the surveys repeated on different random samples of the population. The width of the confidence intervals varies between habitat indicators because it is influenced by the number of species in each indicator and the precision of the individual species trends that make up the indicator, with wider confidence intervals indicating greater uncertainty. For the indicators derived from species trends that cannot be statistically evaluated by this method (wintering waterbirds), a threshold is used to evaluate the significance of the change. For wintering waterbirds this threshold is set at 5%.
Throughout this release, assessment periods are referred to as:
- ‘Long-term’ – an assessment of change since the earliest date for which data are available; this varies among indicators and among individual species.
- ‘Short-term’ – an assessment of change over the latest five years for which data are available.
The data sets published alongside this update show long-term and short-term assessments for each individual bird species. Individual species assessments are calculated up to the penultimate year of data to account for uncertainty in the final year estimate.
Alongside each combined indicator, the publication shows the percentage of species whose populations have increased, declined or shown little change. Long-term categories are based on the total estimated population change across the full available time series. Short-term categories are based on mean annual change over the latest five-year period, expressed as the change that would occur over 25 years if that annual rate continued.
The thresholds are asymmetrical because equal proportional declines and increases are not numerically equal. For example, the opposite of a 50% decrease is a 100% increase, which represents a doubling. The thresholds are derived from those used in the Birds of Conservation Concern status assessment.
The five categories are:
- strong increase: an increase of 100% or more
- weak increase: an increase of more than 33% but less than 100%
- little change: a decrease of no more than 25% or an increase of no more than 33%
- weak decline: a decrease of more than 25% but less than 50%
- strong decline: a decrease of 50% or more
For long-term assessments, these thresholds are applied to the total change across the full available time series. The long-term period begins when suitable data first become available and can vary between species. For short-term assessments, they are applied to the change derived from the mean annual rate over the latest five-year period. The combined indicators and individual species trends describe how bird populations have changed. They do not, by themselves, identify the causes of those changes.
The bird population indices have been compiled by the British Trust for Ornithology (BTO), in partnership with the Royal Society for the Protection of Birds (RSPB), and the Joint Nature Conservation Committee (JNCC), and with contributions from the Rare Breeding Bird Panel (RBBP) and the Statutory Nature Conservation Bodies (SNCBs).
1. Native breeding wild bird populations
The breeding bird indicator trend description
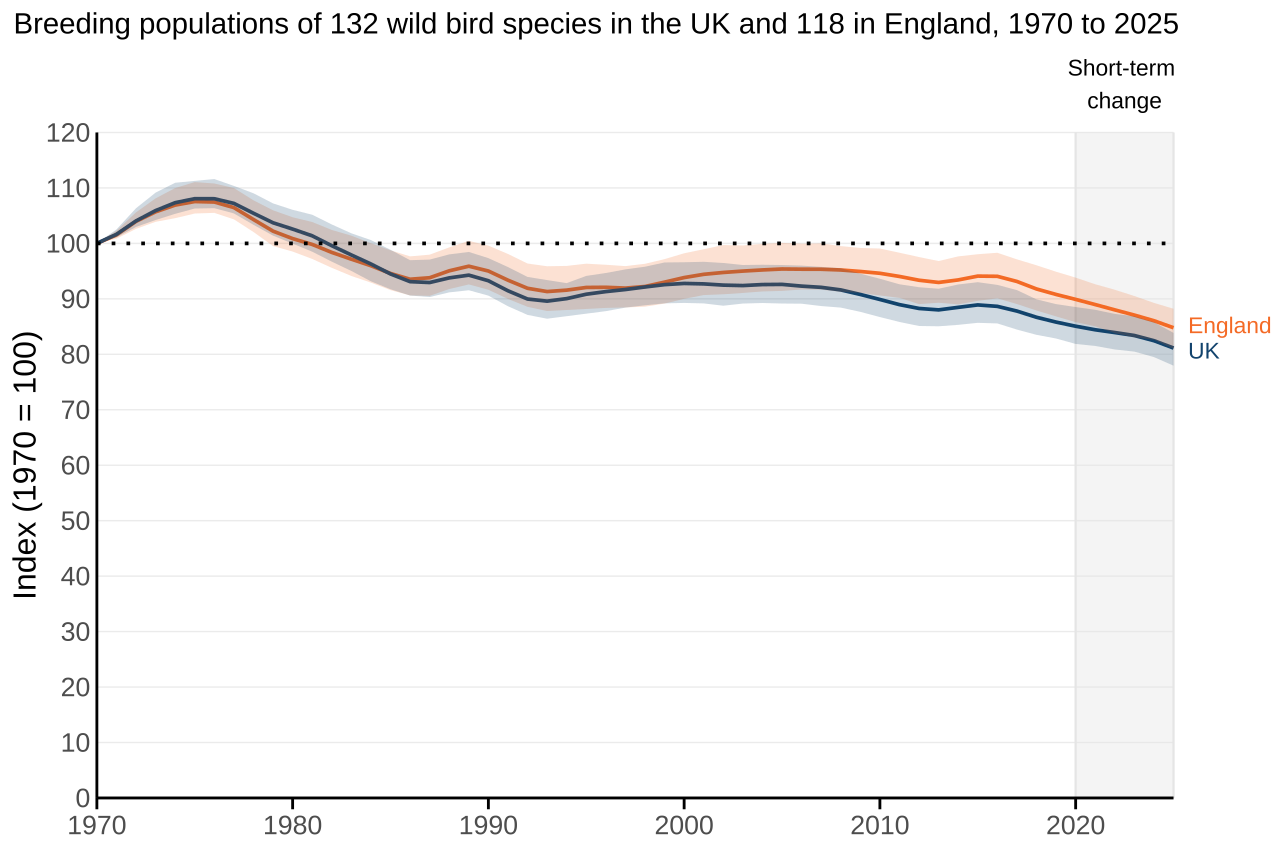
The UK breeding bird index has declined by 19% since 1970. The England breeding bird index has declined by 15% over the same period. Following an initial increase, both indicators declined gradually from the mid-1970s to the late 1980s. They then remained comparatively stable until around 2015, before declining again. Between 2020 and 2025, the UK index declined by 5% and the England index by 6%. These aggregate indices, each based on more than 100 species, mask substantial differences between habitats and individual species.
Figure 1.1: Long-term declines continue for breeding bird populations in the UK and England
Source: British Trust for Ornithology (BTO), Royal Society for the Protection of Birds (RSPB), and the Joint Nature Conservation Committee (JNCC).
Notes for Figure 1.1:
- The indicators are based on the aggregated population trends of 132 species of breeding birds in the UK and 118 species in England
- The smoothed trends with their 95% confidence intervals, which provide a measure of uncertainty, are represented by the lines and shaded areas for UK and England.
- The five-year assessment period over which short-term change in the indicator is calculated is signified by the grey box. For this indicator, it spans the time period 2020 to 2025.
Variation in habitat index trends
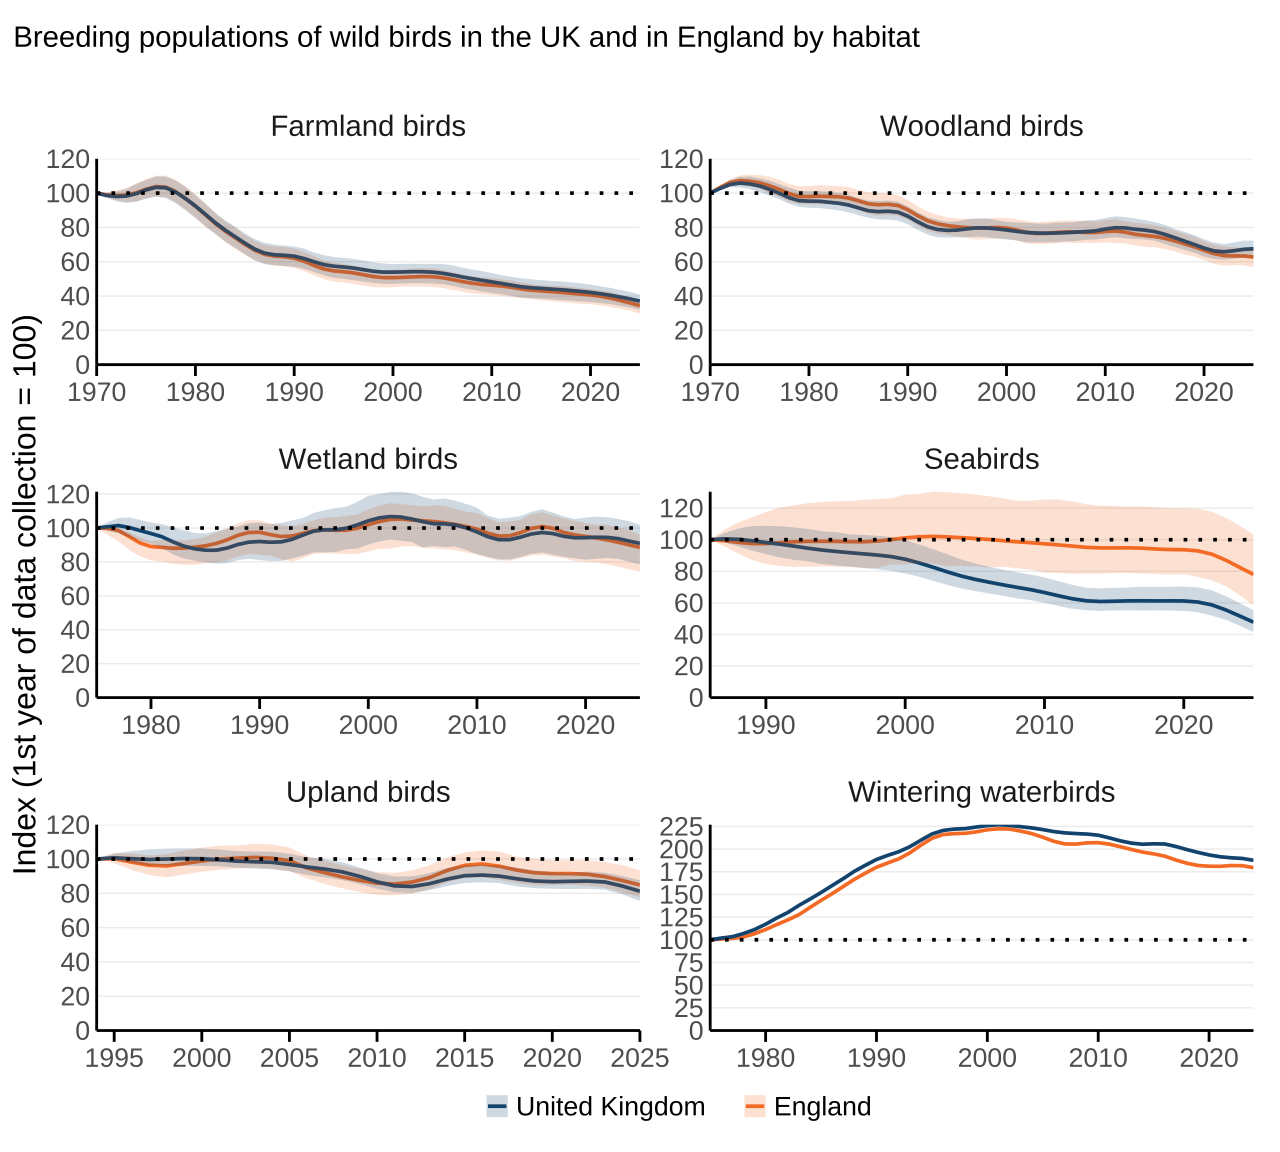
The variation observed in the index trends for different bird habitats is summarised in Figure 1.2 and Table 1, whilst the detailed habitat indices (including indices for the different subgroups within each habitat) are shown in the individual habitat sections later in this publication. A summary of each habitat is provided here:
-
Farmland bird populations have declined on average by 63% since 1970 and by 12% since 2020. The indicator trend has been driven largely by long-term declines among farmland specialist species, including turtle dove and tree sparrow. However, severe declines among some generalist species, including yellow wagtail and greenfinch, in recent decades have also contributed to the continued fall in the indicator.
-
Woodland bird populations have declined on average by 32% in the UK and 37% in England since 1970. Since 2020, the UK indicator has shown little or no overall change, but the England indicator has declined by 6%. Long-term declines have been driven largely by woodland specialist species, such as willow tit and spotted flycatcher. Recent trends show that the specialist indicator shows little or no change, while the generalist indicator has declined.
-
Breeding water and wetland bird populations on average have experienced little overall change in the UK since 1975. In England, populations have declined by 11% since 1975, and by 7% since 2020. These aggregate trends mask considerable variation between species, with strong declines in species such as the wetland populations of yellow wagtail, reed bunting and redshank, alongside substantial increases in species such as Cetti’s warbler, little egret and goosander.
-
Seabird populations have on average declined by 52% in the UK since 1986, while the England indicator has shown little long-term change. Since 2020, populations have declined by 22% in the UK and by 17% in England. Differences between the UK and England indicators are reflected in the differences in species composition and some species populations are faring better in England than overall in the UK. Examples of seabirds in long-term decline include Arctic skua, herring gull and shag.
-
Upland bird populations have declined by around 19% in the UK and 15% in England since 1994. Populations have also declined over the short-term in both countries. These aggregate trends mask variation between species groups. Upland generalists, such as red kite, have increased over the long-term, while upland specialists, including dotterel and whinchat, have declined substantially. More recently, some specialist species, such as red grouse, have also declined.
-
Most wintering waterbird populations have increased markedly over the long-term, by 88% in the UK and 80% in England. However, the trajectory changed around 2000 and both indicators subsequently declined gradually. Since 2020, both indicators have shown little or no overall change.
Figure 1.2: Farmland and seabird indicators show the largest long-term declines
Source: British Trust for Ornithology (BTO), Royal Society for the Protection of Birds (RSPB), and the Joint Nature Conservation Committee (JNCC).
Notes for Figure 1.2:
- The indicators are based on the aggregated population trends for each habitat and each country.
- Figure 1.2 shows the smoothed trends for all habitats together with their 95% confidence intervals (a measure of uncertainty) represented by the lines and shaded areas for the UK and England. No confidence intervals are available for the wintering waterbird indicator.
- The wintering waterbirds data is not included in the overall breeding bird indicators as this index is based on wintering numbers, whether or not any of the species in it also have breeding populations in the UK, with a single exception where a trend from the summer months is used to represent the trend in the wintering numbers of British/Irish greylag goose.
Table 1: Long and short-term trends at a glance for the UK and England
| Index | Long-term trend UK |
Short-term trend UK |
Long-term trend England |
Short-term trend England |
|---|---|---|---|---|
| Breeding birds | Deteriorating | Deteriorating | Deteriorating | Deteriorating |
| Farmland | Deteriorating | Deteriorating | Deteriorating | Deteriorating |
| Seabirds | Deteriorating | Deteriorating | Little or no overall change | Deteriorating |
| Upland | Deteriorating | Deteriorating | Deteriorating | Deteriorating |
| Wetland | Little or no overall change | Little or no overall change | Deteriorating | Deteriorating |
| Wintering waterbirds | Improving | Little or no overall change | Improving | Little or no overall change |
| Woodland | Deteriorating | Little or no overall change | Deteriorating | Deteriorating |
Source: British Trust for Ornithology (BTO), Royal Society for the Protection of Birds (RSPB), and the Joint Nature Conservation Committee (JNCC).
Notes for Table 1:
- Assessment of change is based on a 3% threshold of change and statistical significance is determined using the 95% confidence intervals associated with the indicator trends.
- The wintering waterbird indicator trends are assessed using an arbitrary 5% threshold as confidence intervals are not currently available for these species trends.
Species trends
The breeding bird index includes aggregated population trends for 132 species of birds in the UK and 118 for England. The species list is compiled using mainly widespread species which each have a population of at least 500 breeding pairs (or 300 in England), and have sufficient data to calculate a trend. Species trends vary widely, from species increasing several-fold in the long-term (for example, Cetti’s warbler, avocet, blackcap, buzzard, great spotted woodpecker, red kite and collared dove) to those having declined to less than a tenth of 1970 numbers (for example, turtle dove, capercaillie, willow tit, grey partridge, tree sparrow and spotted flycatcher).
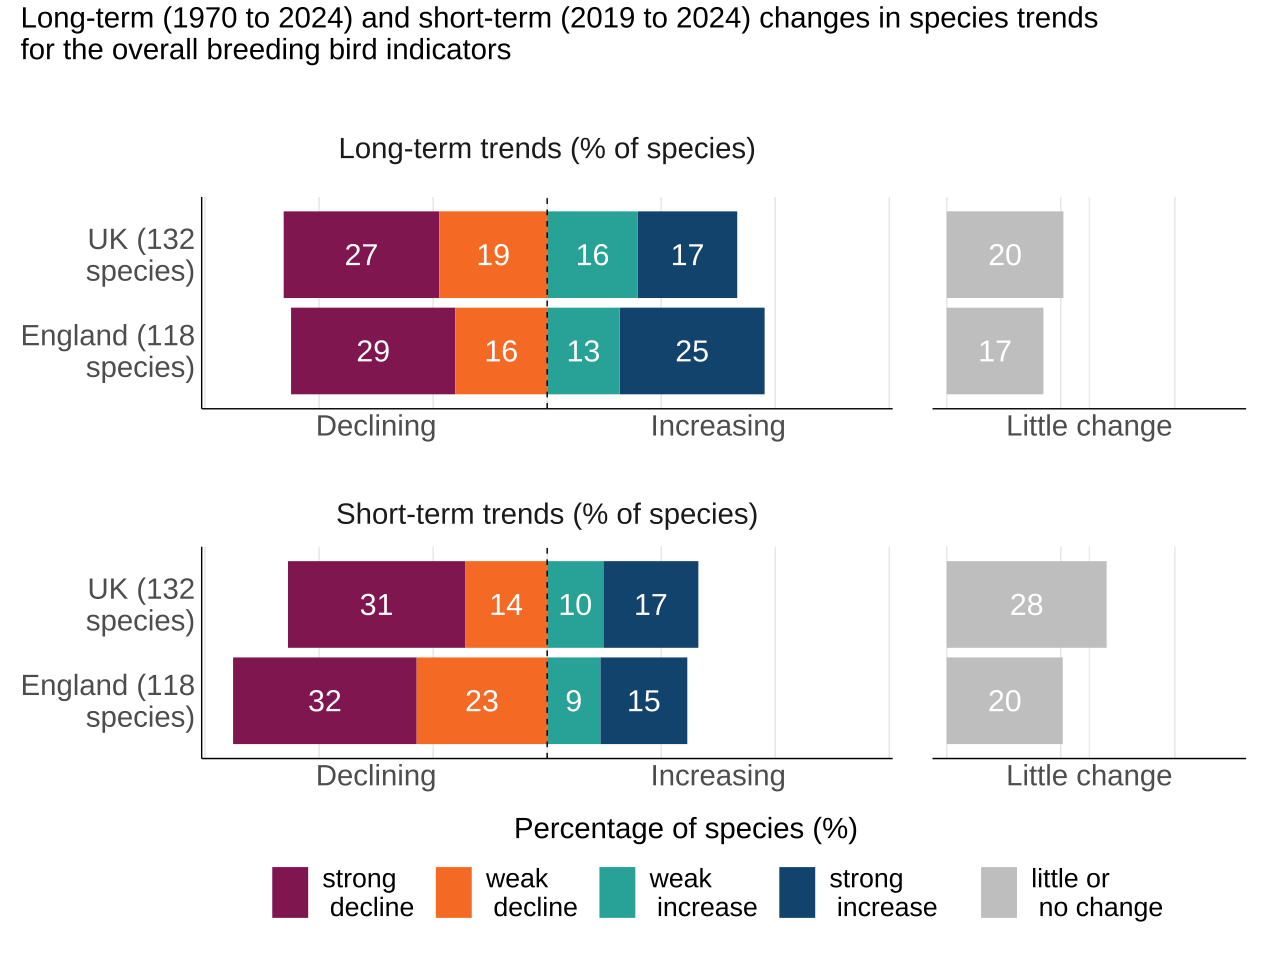
To summarise long-term and short-term changes in individual species, we present bar charts showing the proportion of species that are increasing, declining, or showing little or no change.
- In the UK, 46% of species have declined since 1970 and 33% of species have increased.
- The short-term trends show 45% of species have declined compared with 27% of species that have increased.
Similar patterns are observed in England, except for a higher (55%) proportion of species in short-term decline.
Figure 1.3: More bird species are declining than increasing in both the long-term and short-term
Source: British Trust for Ornithology (BTO), Royal Society for the Protection of Birds (RSPB), and the Joint Nature Conservation Committee (JNCC).
Notes for Figure 1.3:
- The indicators are based on the aggregated population trends of 132 species of wild birds in the UK and 118 species in England.
- Each row represents all of the species for which we have data. Some species do not have short-term assessments because no survey has been carried out within the last five years
- Each stack within a bar shows the percentage of species within the indicator that are categorised as showing an increase (strong or weak increase), a decrease (strong or weak decline) or little or no change.
- Change estimates for species are assessed to the penultimate year, the short-term five-year change for species spans 2019 to 2024.
- Long-term trends are based on total population change across the full time series. Data for some species starts after the baseline year and so for these species the long-term change represents a shorter time period. Short-term trends are based on mean annual change over the most recent five-year period. In both cases thresholds derived from the Birds of Conservation Concern status assessment are applied.
Variation in individual species trends for different habitats
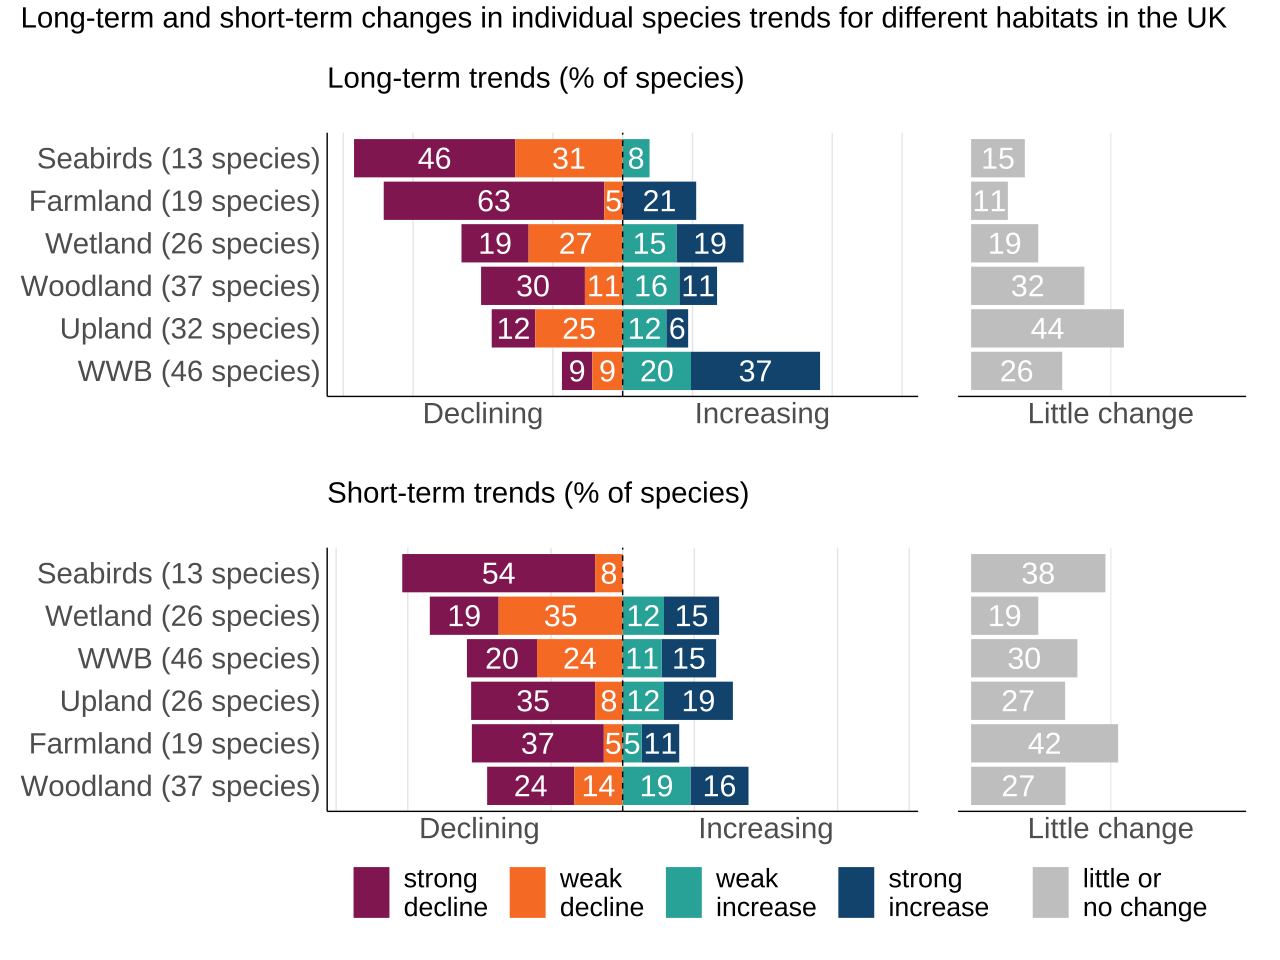
The overall breeding bird indicators also mask variation in individual species trends between habitats. Detailed results, including breakdowns for specialist and generalist species, are presented in the habitat-specific chapters. Figure 1.4 summarises the distribution of long-term and short-term trends across individual species within each habitat in the UK. The key findings are:
-
Species declines remain widespread across most habitats: over the long-term, more species have declined than increased in all habitats except wintering waterbirds. Seabirds and farmland birds show the highest proportion of species in long-term decline, with over two thirds of species showing declines.
-
Recent declines are most evident among seabirds and wetland birds: over the short-term, more than half of seabird and wetland species are in decline, representing the highest proportions of declining species across the habitat groups.
-
Many species show little or no overall change: a substantial proportion of species show little or no change, particularly within upland habitats over the long-term and farmland habitats over the short-term.
-
Wintering waterbirds show contrasting long-term and short-term patterns: over the long-term, increases are more common than declines among wintering waterbird species. In contrast, over the short-term, declining species outnumber increasing species, reflecting the broader downturn in wintering waterbird populations since the early 2000s.
In England, the long-term pattern is broadly similar to that seen in the UK. Over the short-term there are some notable differences:
-
Declines are particularly widespread among wetland, farmland and upland species, with around three fifths or more species in decline in each habitat.
-
Woodland species also show a higher proportion of declining species than in the UK.
Figure 1.4: Species declines remain widespread across habitats, particularly among farmland and seabird species
Source: British Trust for Ornithology (BTO), Royal Society for the Protection of Birds (RSPB), and the Joint Nature Conservation Committee (JNCC).
Notes for Figure 1.4:
- WWB: Wintering waterbirds.
- The bars in each row sum to 100% and show the proportion of species categorised as showing an increase (strong or weak), a decrease (strong or weak), or little or no change.
- Change estimates for species are assessed to the penultimate year of data.
- Long-term trends are based on total population change across the full time series. Data for some species starts after the baseline year and so for these species the long-term change represents a shorter time period. Short-term trends are based on mean annual change over the most recent five-year period. In both cases thresholds derived from the Birds of Conservation Concern status assessment are applied.
- Over the long-term, 32 upland species were assessed but only 26 could be assessed over the short-term.
- Habitats are ranked by highest percentage of species in decline.
2. Breeding farmland bird populations in the UK and England
Indicator trend description: Farmland birds
Farmland bird populations have declined by 63% in the UK and 66% in England since 1970, with turtle dove and tree sparrow showing the steepest declines. For most species, the most severe population declines occurred between the late 1970s and the early 1980s, largely due to the negative impact of rapid changes in farmland management during this period. Populations continue to decline at a fast rate, declining by 12% in the five years since 2020. The long-term decline of the farmland bird indicator in the UK has been driven mainly by the decline of those species that are restricted to, or highly dependent on, farmland habitats (the ‘specialists’). However, in the last 20 years, severe declines in some of the generalist species, reflecting their additional association with other habitats, have contributed to the fast decline observed in the farmland bird indicator.
Farmland refers to the 70% of land in the UK and 68% of land in England which is devoted to agriculture. Farmland also provides semi-natural habitats such as hedgerows and field margins that provide food and shelter to birds.
Figure 2.1: Farmland birds decline by around two thirds in the UK and England, since 1970
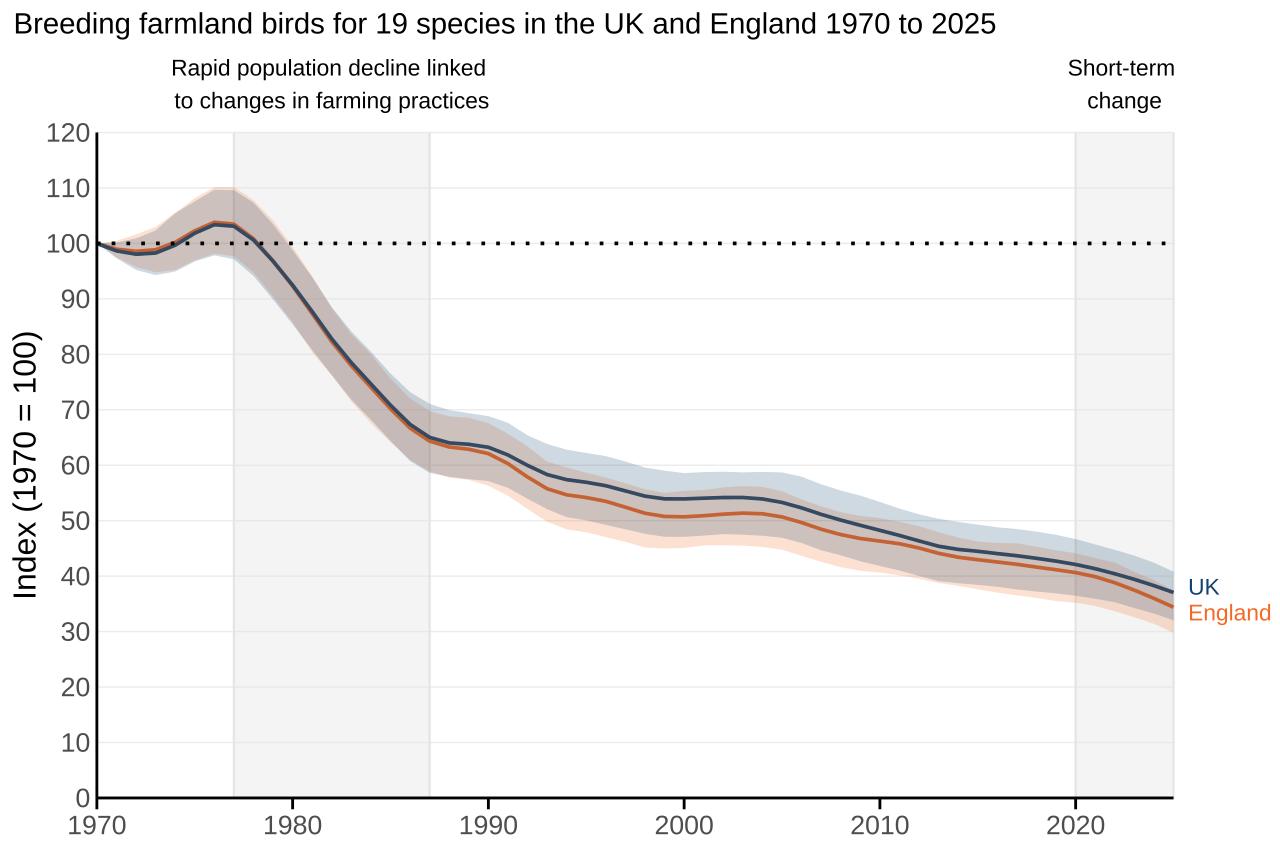
Source: British Trust for Ornithology (BTO), Royal Society for the Protection of Birds (RSPB), and the Joint Nature Conservation Committee (JNCC).
Notes for Figure 2.1:
- The indicators are based on the aggregated population trends of species of farmland birds in the UK and England (of which 12 species are farmland specialists and 7 are generalists).
- Figure 2.1 shows the smoothed trends with their 95% confidence intervals, which provide a measure of uncertainty, represented by the lines and shaded areas for UK and England.
- The five-year assessment period over which short-term change in the indicator is calculated is signified by the grey box. For this indicator, the period spans 2020 to 2025.
Figure 2.2: Specialist species show sustained drastic decline since 1970, whilst generalists show large decline in the past two decades
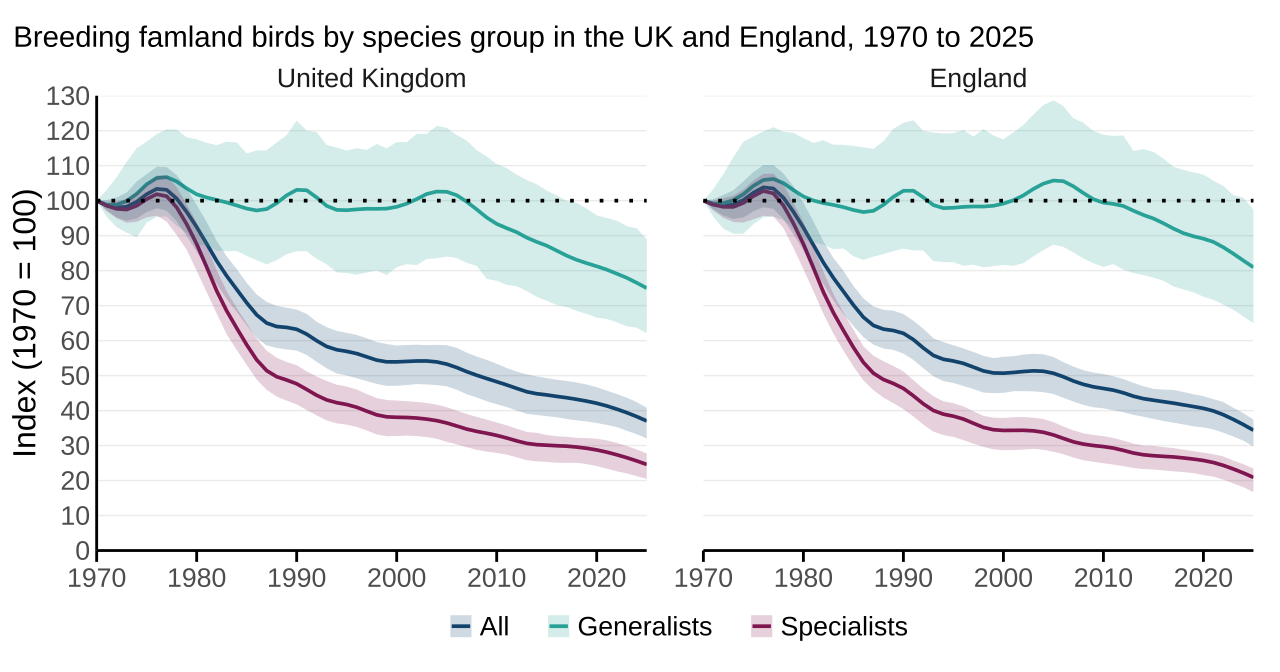
Source: British Trust for Ornithology (BTO), Royal Society for the Protection of Birds (RSPB), and the Joint Nature Conservation Committee (JNCC).
Notes for Figure 2.2:
- The indicators are based on the aggregated population trends of 19 species of farmland birds in the UK and England (of which 12 species are farmland specialists and 7 are generalists).
- Figure 2.2 shows the smoothed indicator together with its 95% confidence interval for the different subgroups of birds. The UK and England indicators are plotted side by side.
Table 2: Long and short-term indicator trends at a glance for farmland birds in the UK and England
| Index | Country | Species number | Long-term change (%) | Short-term change (%) |
|---|---|---|---|---|
| All | England | 19 | -65.6 * | -15.4 * |
| UK | 19 | -63 * | -12 * | |
| Generalists | England | 7 | -19 * | -9.2 * |
| UK | 7 | -25 * | -7.7 * | |
| Specialists | England | 12 | -79.1 * | -18.8 * |
| UK | 12 | -75.4 * | -14.4 * |
Source: British Trust for Ornithology (BTO), Royal Society for the Protection of Birds (RSPB), and the Joint Nature Conservation Committee (JNCC).
Notes for Table 2:
- Assessment of change is based on a 3% threshold of change and statistical significance is determined using the 95% confidence intervals associated with the indicator trends.
- Indicator trends that show significant declines or increases are denoted by an asterisk next to the percentage value.
Species trends: Farmland birds
The farmland bird index for both the UK and England includes individual measures for 19 species of farmland birds, of which 12 species are farmland specialists and 7 species are farmland generalists. In the UK:
Long-term declines have been widespread among farmland birds, particularly specialist species. Three-quarters of specialist species have declined since 1970, indicating that species most closely associated with farmland habitats have experienced the greatest losses. Generalist species have also shown more declines than increases over the same period.
In the most recent five-year period, trends have been more mixed. Most generalist species have shown little or no change, while declines remain more common among specialist species than increases.
England shows a similar overall pattern to the UK. However, a greater proportion of species have declined over the most recent five-year period, affecting both specialist and generalist farmland birds.
Figure 2.3: Most generalist and specialist species show sustained declines with a few species showing notable increases
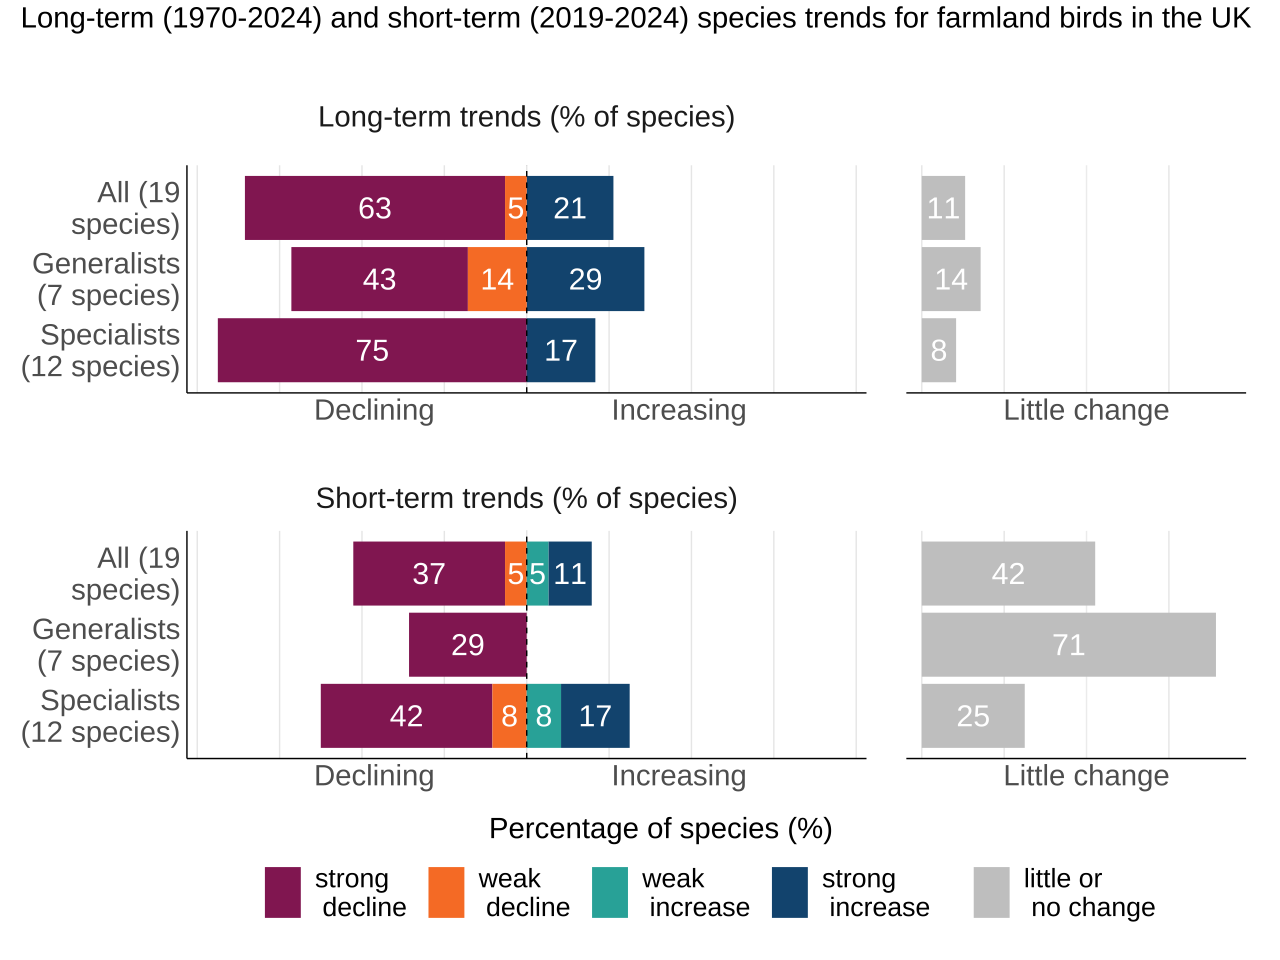
Source: British Trust for Ornithology (BTO), Royal Society for the Protection of Birds (RSPB), and the Joint Nature Conservation Committee (JNCC).
Notes for Figure 2.3:
- The figure shows the population trends of 19 species of farmland birds in the UK (12 species are farmland specialists and 7 species are farmland generalists).
- The bars in each row sum to 100% and show the proportion of species categorised as showing an increase (strong or weak), a decrease (strong or weak), or little or no change.
- Change estimates for species are assessed to the penultimate year of data, the short-term (five-year) change for species spans 2019 to 2024.
- Long-term trends are based on total population change across the full time series. Data for some species start after 1970 and so for these species the long-term change represents a shorter time period.
- Short-term trends are based on mean annual change over the most recent five-year period. In both cases thresholds derived from the Birds of Conservation Concern status assessment are applied.
Species breakdown: Farmland birds
Farmland generalists
Generalist species use a wider range of habitats than specialist farmland species. Four generalist species have shown strong declines over the long-term period: yellow wagtail by 75%, greenfinch by 65%, kestrel by 51% and reed bunting by 39%. Whilst yellow wagtail and reed bunting continue to decline over the short-term, greenfinch and kestrel show little or no change.
Populations of woodpigeon and jackdaw have more than doubled relative to 1970 levels but have shown little or no change over the most recent five years.
Farmland specialists
Five farmland specialists (turtle dove, tree sparrow, grey partridge, corn bunting, and starling) have experienced severe declines in excess of 85% since 1970 across the UK and England. Most of these, particularly turtle dove, continue to decline over the short-term. Corn bunting is the exception, having increased by 25% over the short-term.
Species such as lapwing, yellowhammer, linnet and skylark also remain a concern, having declined by over 50% over the longer period. Lapwing and yellowhammer are continuing to strongly decline in the most recent five years across both England and the UK, whilst skylark showed a weak increase and linnet has shown little or no change in this period.
In contrast, numbers of two other farmland specialists (stock dove and goldfinch) have more than doubled since 1970. Stock dove continues to show a strong increase over the most recent five years, but goldfinch shows little or no change in the UK. This shows how responses to changes in farmland can vary among species.
Figure 2.4: Severe declines in most farmland birds
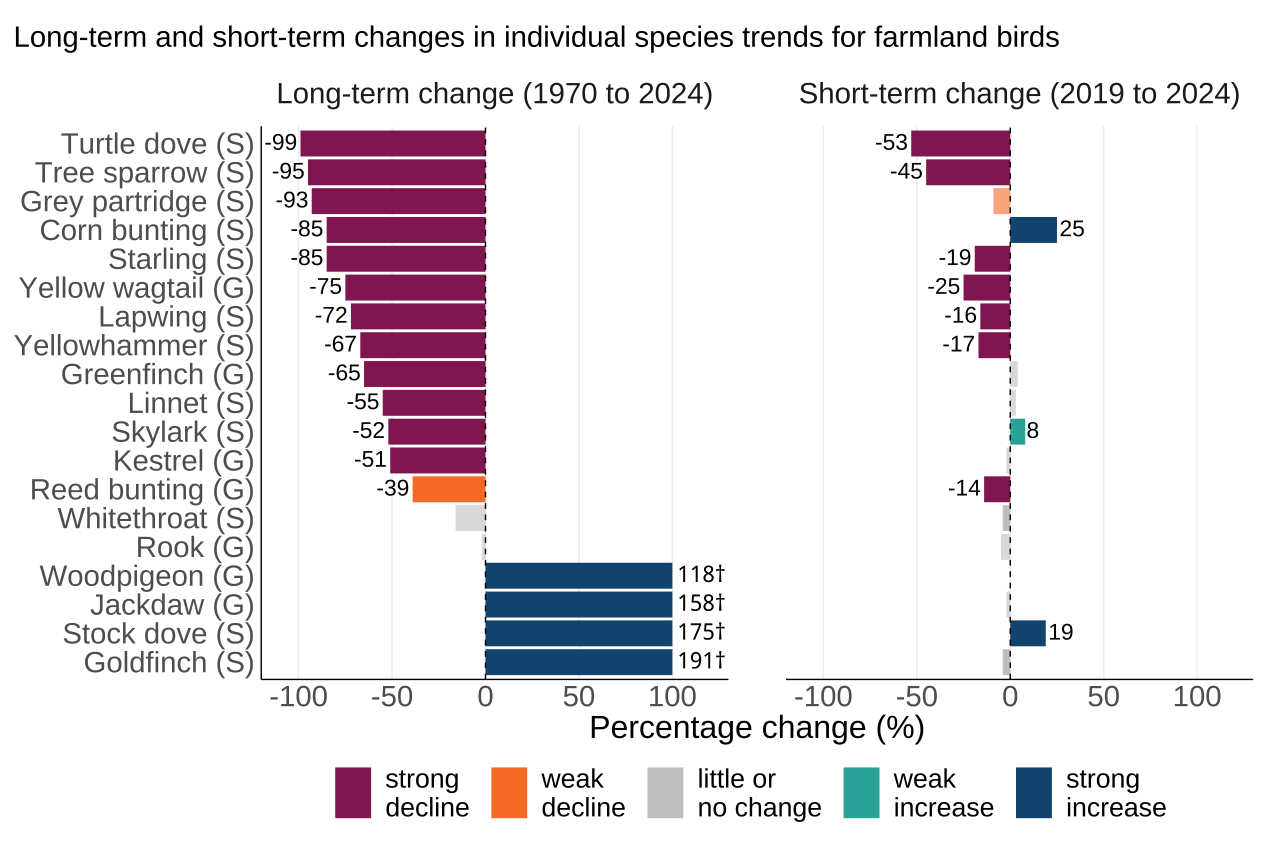
Source: British Trust for Ornithology (BTO), Royal Society for the Protection of Birds (RSPB), and the Joint Nature Conservation Committee (JNCC).
Notes for Figure 2.4:
- Figure 2.4 shows the individual population changes of 19 species of farmland birds in the UK and in England (12 species are farmland specialists and 7 species are farmland generalists).
- Data for some species start after 1970 and so for these species the long-term change represents a shorter time period.
- Species names are labelled with the associated habitat specificity: G - farmland generalist species; S - farmland specialist species.
- Only those species for which the change was significant and whose rate of change placed it outside of the ‘little or no change’ category are labelled with their percentage change.
- For visualisation purposes the axis has been truncated to between -100% and +100%. For species that exceed the +100% limit, the exact percentage change is labelled next to the bars and marked with a † symbol. In figure 2.4 woodpigeon, stock dove, jackdaw and goldfinch all exceed 100%.
- Change estimates for species are assessed to the penultimate year of data. The short-term (five-year) change for species spans 2019 to 2024.
- Long-term trends are based on total population change across the full time series for the species trend. Short-term trends are based on mean annual change in the most recent five-year period. In both cases thresholds derived from the Birds of Conservation Concern status assessment are applied.
Factors affecting farmland bird populations
Farmland provides semi-natural habitats such as hedgerows and field margins that provide food and shelter to birds. The large declines in the abundance of many farmland birds have a number of known and potential causes. For a large part, declines have been caused by the changes in farming practices that have taken place since the 1950s and 1960s, such as the loss of mixed farming, a move from spring to autumn sowing of arable crops, change in grassland management (for example, a switch from hay to silage production), increased pesticide and fertiliser use, and the removal of non-cropped features such as hedgerows. The rate of these changes, which resulted in the loss of suitable nesting and suitable feeding habitats, and a reduction in available food, was greatest during the late 1970s and early 1980s, the period during which many farmland bird populations declined most rapidly. However, some generalist species such as woodpigeon have benefited from increased availability of their food throughout the winter owing to the autumn sowing of crops.
Some farming practices continue to have negative impacts on bird populations, but most farmers can and do take positive steps to conserve birds on their land. In particular, a number of incentive schemes encourage improved environmental stewardship in farming, with some measures specifically designed to help stabilise and recover farmland bird populations. These include the provision of over-wintered stubble and planted wild bird crop covers to provide seed in the winter, uncropped margins on arable fields and sympathetic management of hedgerows. There is growing evidence that such action can deliver local recoveries in farmland bird populations and thus, if delivered at appropriate scale, wider recovery. Changes in numbers experienced by some species may be further driven by other pressures. Concern about turtle dove has led to international action in the form of hunting restrictions in areas where these birds migrate in winter, which together with habitat management in the UK is hoped to help save this endangered species. The rapid decline in Greenfinch numbers since 2005 has been attributed to the adverse impact of the disease trichomoniasis, which has also impacted other species and has prompted new advice on garden feeding birds.
For more information about the evidence for this indicator, see the evidence statement Annex 1.03 Evidence Statement for C5a Farmland Birds. More information about individual species is available from BirdFacts.
3. Breeding woodland bird populations in the UK and England
Indicator trend description: Woodland birds
Woodland bird populations have declined by 32% in the UK and 37% in England since 1970. The indicator shows little or no change in the UK and a decline of 6% in England in the five years since 2020. The long-term decline of the woodland bird indicator in the UK has been driven mainly by the decline of those species that are restricted to, or highly dependent on, woodland habitats (the ‘specialists’), such as willow tit and spotted flycatcher. In the short-term, there is little or no change in the specialist indicators for the UK and England, while the generalist species have continued to decline in both the UK and in England.
Woodland covers 14% of the UK land area and 10% of England’s, providing trees and other vegetation suitable for nesting, as well as foraging opportunities and cover from predators.
Figure 3.1: Breeding woodland birds have declined on average by around a third in the UK and England since 1970
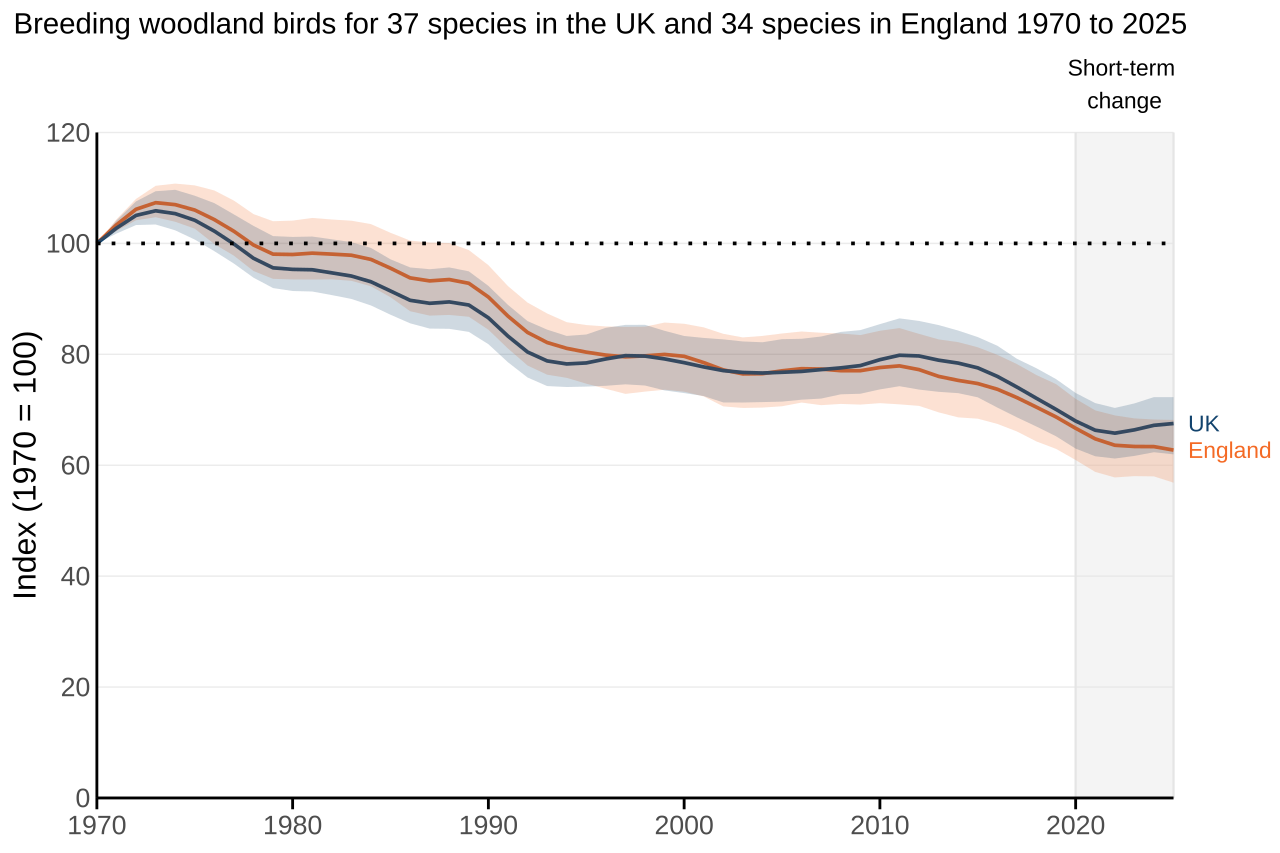
Source: British Trust for Ornithology (BTO), Royal Society for the Protection of Birds (RSPB), and the Joint Nature Conservation Committee (JNCC).
Notes for Figure 3.1:
- The indicators are based on the aggregated population trends of species of woodland birds in the UK and England, of which 25 species are woodland specialists (22 in England) and 12 are generalists in the UK and England.
- Figure 3.1 shows the smoothed trends with their 95% confidence intervals, which provide a measure of uncertainty, represented by the lines and shaded areas for UK and England.
- The five-year assessment period over which short-term change in the indicator is calculated is signified by the grey box. For this indicator, it spans the time period 2020 to 2025.
Figure 3.2: Populations of specialist woodland birds have declined on average by nearly half since 1970, and the generalist species indicator shows recent decline
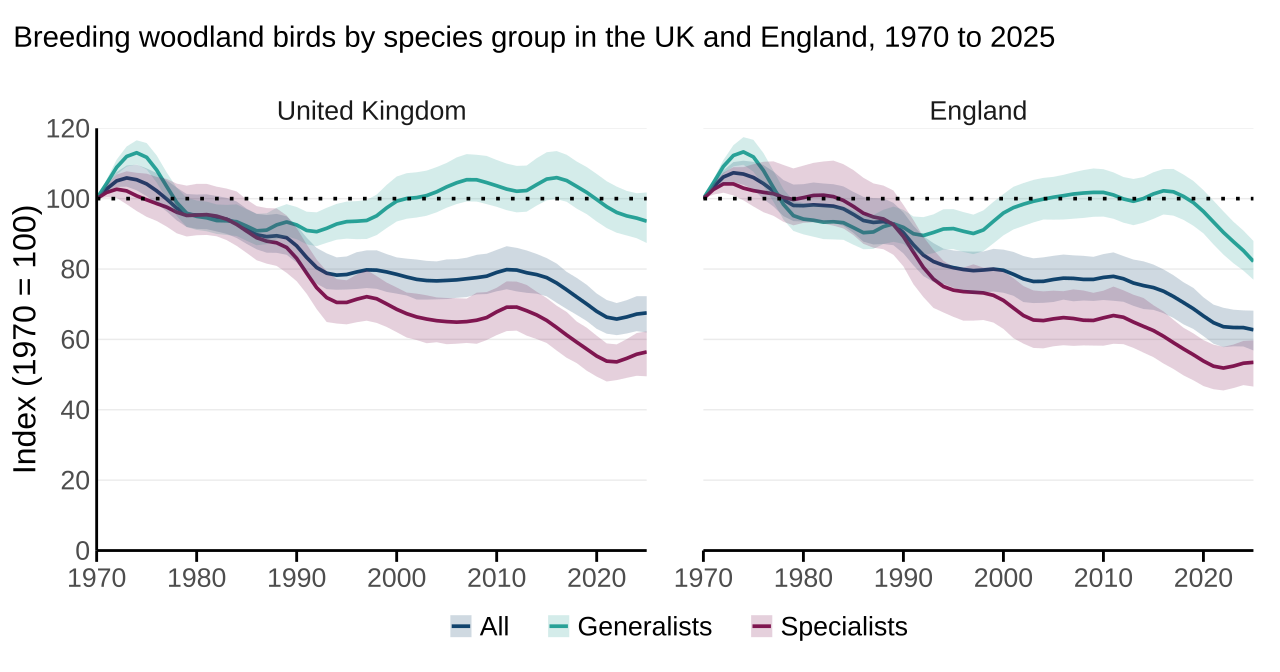
Source: British Trust for Ornithology (BTO), Royal Society for the Protection of Birds (RSPB), and the Joint Nature Conservation Committee (JNCC).
Notes for Figure 3.2:
- The indicators are based on the aggregated population trends of 37 species of woodland birds in the UK and 34 in England, of which 25 species are woodland specialists (22 in England) and 12 are generalists in the UK and England.
- Figure 3.2 shows the smoothed indicator together with its 95% confidence interval for the different subgroups of birds. The UK and England indicators are plotted side by side.
Table 3: Long-term (1970-2025) and short-term (2020-2025) indicator trends at a glance for woodland birds in the UK and England
| Index | Country | Species number | Long-term change (%) | Short-term change (%) |
|---|---|---|---|---|
| All | England | 34 | -37.3 * | -5.9 * |
| UK | 37 | -32.5 * | -0.7 | |
| Generalists | England | 12 | -17.8 * | -14.7 * |
| UK | 12 | -6.4 | -6.2 * | |
| Specialists | England | 22 | -46.5 * | -0.7 |
| UK | 25 | -43.6 * | 2.1 |
Source: British Trust for Ornithology (BTO), Royal Society for the Protection of Birds (RSPB), and the Joint Nature Conservation Committee (JNCC).
Notes for Table 3:
- Assessment of change is based on a 3% threshold of change and statistical significance is determined using the 95% confidence intervals associated with the indicator trends.
- Indicator trends that show significant declines or increases are denoted by an asterisk next to the percentage value.
Species trends: Woodland birds
The woodland bird index for both the UK and England includes individual measures for 37 species of woodland birds in the UK and 34 in England, of which 25 species are woodland specialists (22 in England) and 12 are generalists in the UK and England. The overall trend masks different underlying trends for specialist species, those which are highly dependent on woodland habitats, and generalist species, which are found in a wide range of habitats, including woodland.
In the UK, long-term declines have been more common among woodland specialists than generalists. Almost half of specialist species have declined since 1970, while generalist species are more evenly split between increases, declines and little change.
Over the most recent five-year period, trends are more mixed. A larger proportion of generalist species have declined than increased, while specialist species are more evenly divided between increases, declines and little change.
England shows a similar pattern to the UK, although a greater proportion of both specialist and generalist species have declined, particularly in the most recent five-year period.
Figure 3.3: Long-term declines persist in woodland bird species, with more mixed short-term trends
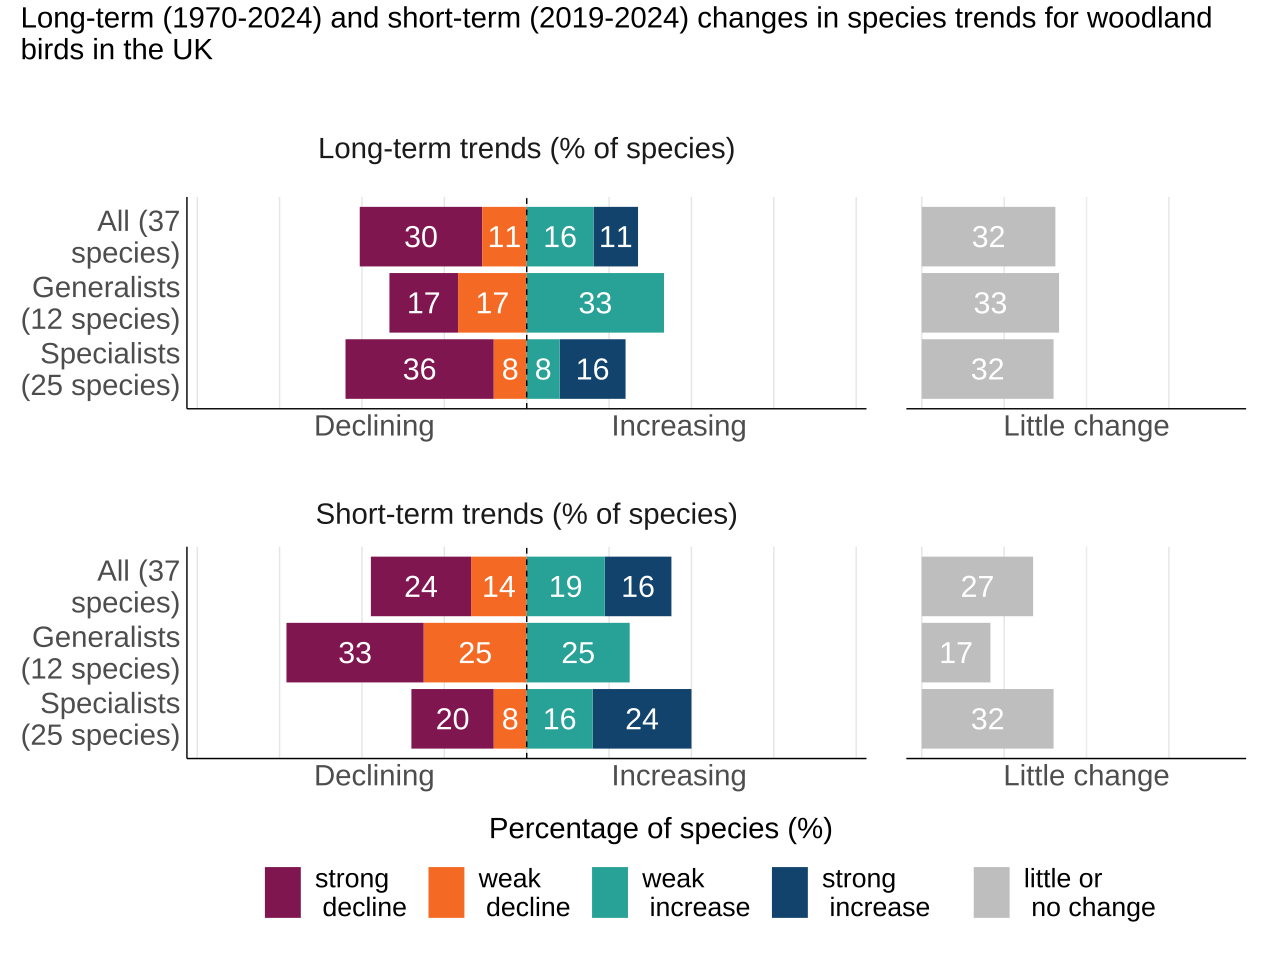
Source: British Trust for Ornithology (BTO), Royal Society for the Protection of Birds (RSPB), and the Joint Nature Conservation Committee (JNCC).
Notes for Figure 3.3:
- The figure shows the population trends of 37 species of woodland birds in the UK (25 species are woodland specialists and 12 species are woodland generalists).
- The bars in each row sum to 100% and show the proportion of species categorised as showing an increase (strong or weak), a decrease (strong or weak), or little or no change.
- Change estimates for species are assessed to the penultimate year of data. The short-term, (five-year) change for species spans 2019 to 2024.
- Long-term trends are based on total population change across the full time series. Data for some species start after 1970 and so for these species the long-term change represents a shorter time period.
- Short-term trends are based upon mean annual change in the most recent five-year period.
- In both cases thresholds derived from the Birds of Conservation Concern status assessment are applied.
Species breakdown: Woodland birds
Woodland generalists
Four woodland generalist species have experienced a long-term decline in the UK: bullfinch, tawny owl, song thrush and dunnock. Of these, only song thrush appears to be doing better over the short-term period, whilst bullfinch, dunnock, chaffinch, blue tit and great tit are all in decline over the most recent five-year period.
Four woodland generalist species showed a long-term increase in the UK: great tit, robin, wren and long-tailed tit. Robin and wren also show an increase over the most recent five-year period. However, great tit is in strong decline over this period.
Similar patterns are observed for these species in England, except that chaffinch and blackbird are also in long-term decline, and more species are in short-term decline (including tawny owl, blackbird, lesser whitethroat and long-tailed tit).
Figure 3.4: Mixed long‑term change across woodland generalists, with more species in short‑term decline
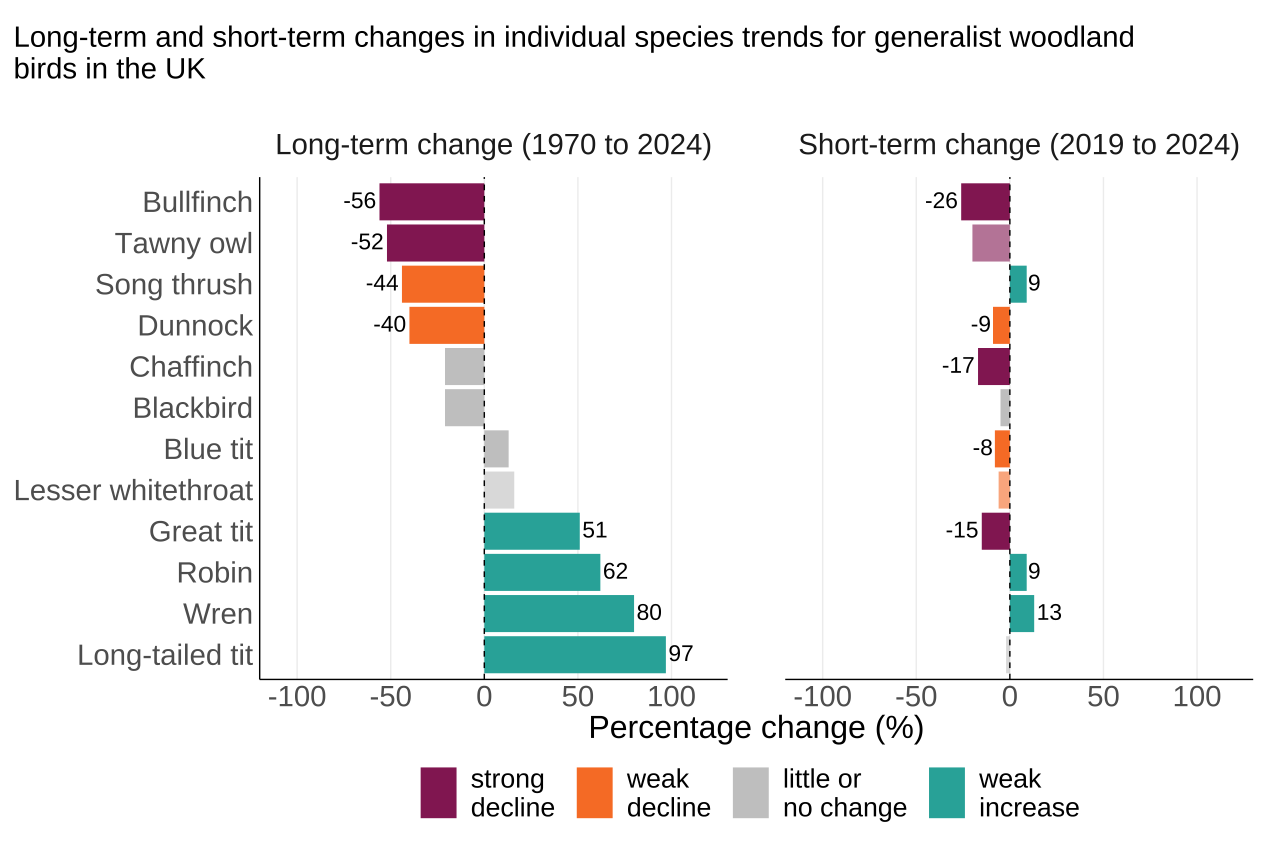
Source: British Trust for Ornithology (BTO), Royal Society for the Protection of Birds (RSPB), and the Joint Nature Conservation Committee (JNCC).
Notes for Figure 3.4:
- Figure 3.4 shows the individual population changes of 12 species of generalist woodland birds in the UK.
- Only those species for which the change was significant and whose average rate of change placed it outside of the ‘little or no change’ category are labelled with their percentage change.
- Change estimates for species are assessed to the penultimate year. The short-term, five-year change for species spans 2019 to 2024.
- Long-term trends are based on total population change across the full time series. Data for some species start after 1970 and so for these species the long-term change represents a shorter time period.
- Short-term trends are based on mean annual change in the most recent five-year period. In both cases thresholds derived from the Birds of Conservation Concern status assessment are applied.
Woodland specialists
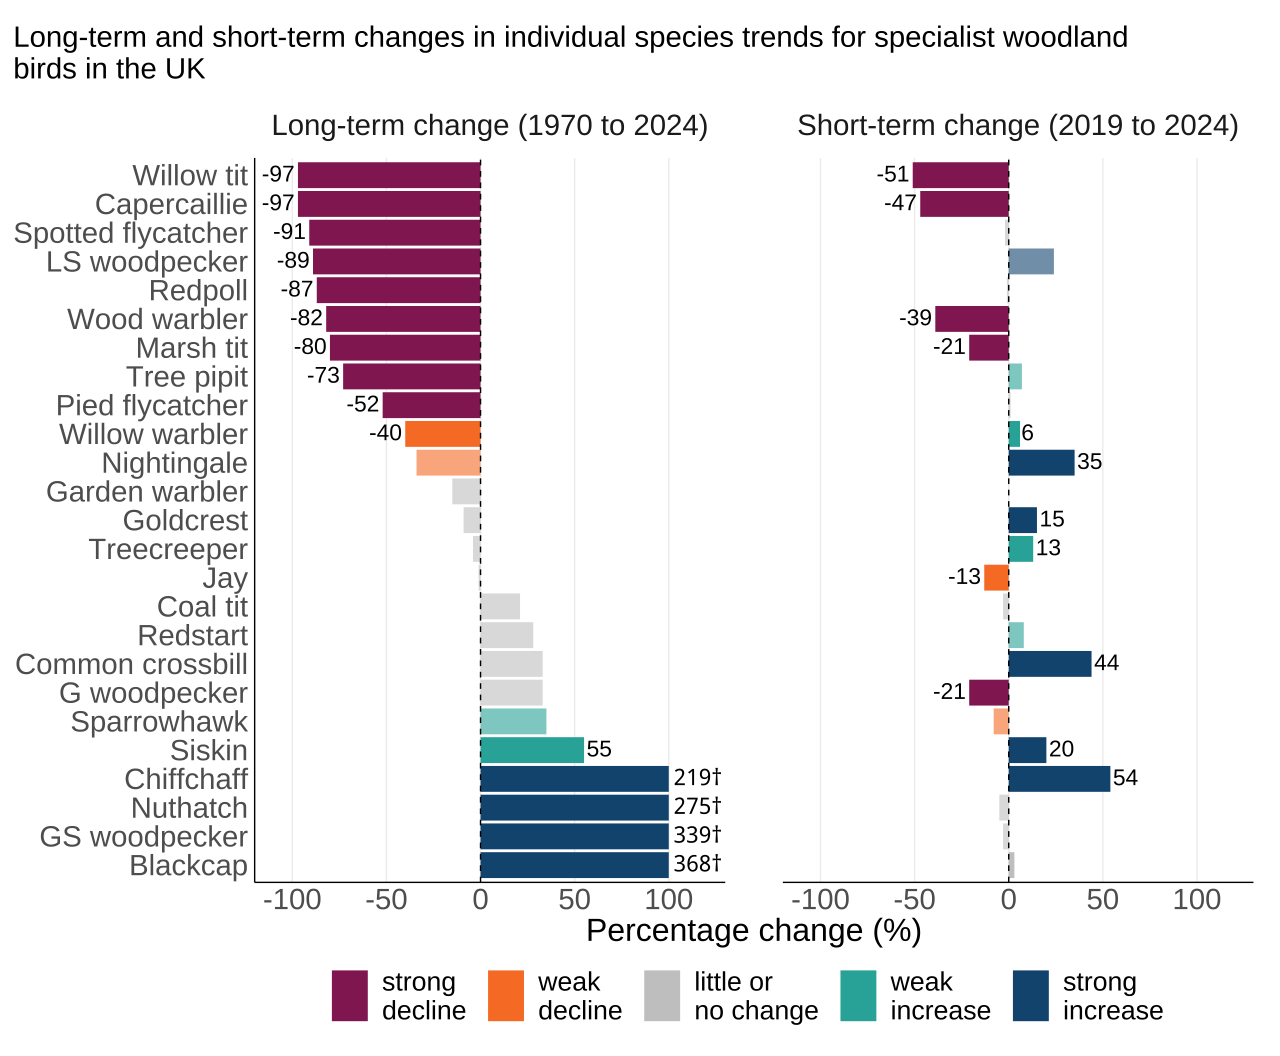
Ten woodland specialist species experienced declines across the UK over the long-term period, with seven species declining by over 80% relative to 1970 levels (spotted flycatcher, lesser spotted woodpecker, redpoll, willow tit, capercaillie, wood warbler and marsh tit). The latter four species also show a sustained strong decline across the most recent five-year period. Jay and green woodpecker, although showing little or no change over the long-term period, also show a recent decline.
In contrast, over the long-term, siskin has increased by 55%, populations of chiffchaff and nuthatch have more than trebled and both blackcap and great spotted woodpecker have more than quadrupled in numbers. This shows how responses to changes in environmental conditions vary among species. Over the recent five-year period, willow warbler, nightingale, goldcrest, treecreeper, common crossbill, siskin and chiffchaff have all increased by varying degrees.
In England similar patterns were observed, except that green woodpecker populations also showed a long-term increase. Over the recent five-year period, fewer species increased: nightingale, goldcrest, redstart, siskin and chiffchaff. More species declined over this period: willow tit, wood warbler, marsh tit, jay, coal tit, green woodpecker, sparrowhawk, nuthatch and great spotted woodpecker.
Figure 3.5: Long‑term declines in woodland specialists dominate, despite long-term increases for some species
Source: British Trust for Ornithology (BTO), Royal Society for the Protection of Birds (RSPB), and the Joint Nature Conservation Committee (JNCC).
Notes for Figure 3.5:
- Figure 3.5 shows the individual population changes of 25 species of specialist woodland birds in the UK.
- Only those species for which the change was significant and whose average rate of change placed it outside of the ‘little or no change’ category are labelled with their percentage change.
- For visualisation purposes the axes have been truncated to between -100% and +100%. For species that exceed these limits, the exact percentage change is labelled next to the bars and marked with a † symbol. In Figure 3.5, chiffchaff, nuthatch, great spotted woodpecker and blackcap all exceed 100%.
- Some woodpecker species names have been shortened for this plot: LS is lesser spotted, GS is great spotted and G is green.
- Change estimates for species are assessed to the penultimate year. The short-term, five-year change for species spans 2019 to 2024.
- Long-term trends are based on total population change across the full time series. Data for some species start after 1970 and so for these species the long-term change represents a shorter time period.
- Short-term trends are based upon mean annual change in the most recent five-year period. In both cases thresholds derived from the Birds of Conservation Concern status assessment are applied.
Factors affecting woodland bird populations
Woodland covers 14% of the UK’s land area, providing trees and other vegetation suitable for nesting, foraging opportunities and cover from predators.
The declines in woodland birds have several known and potential causes, such as a lack of woodland management (including the reduction of traditional practices such as coppicing) and increased deer browsing pressure, both of which result in a reduced diversity of woodland structure and reduced availability of suitable nesting and foraging habitats. Changes in farmland management, such as the removal of hedgerows, have adversely affected many of the species in the indicator which have substantial populations outside of woodland, for example, in farmland and gardens. In addition, several declining woodland birds are long-distance migrants, and a decline in the extent or quality of habitats used outside of the UK in the non-breeding season (in stop-over sites or African wintering areas) may be a significant factor affecting these species. Many woodland species also occupy urban and rural habitats and populations may be affected by habitat deterioration, non-native and feral predators and diseases, such as trichomonosis affecting finches and other species, or Usutu virus in blackbirds. Potential positive factors include the increasing area of woodland cover and milder winters potentially having a beneficial impact for some species, the latter likely having facilitated northward shifts in the distribution of species such as willow warbler and tree pipit, and higher abundance particularly in Scotland driving the differences between the UK and England trends. Drier and hotter summers in southern England are more likely to have negative impacts.
For more information about the evidence for this indicator, see the evidence statement Annex 1.05 Evidence Statement for C5b Woodland Birds. More information about individual species is available from BirdFacts.
4. Breeding water and wetland bird populations in the UK and England
Indicator trend description: Water and wetland
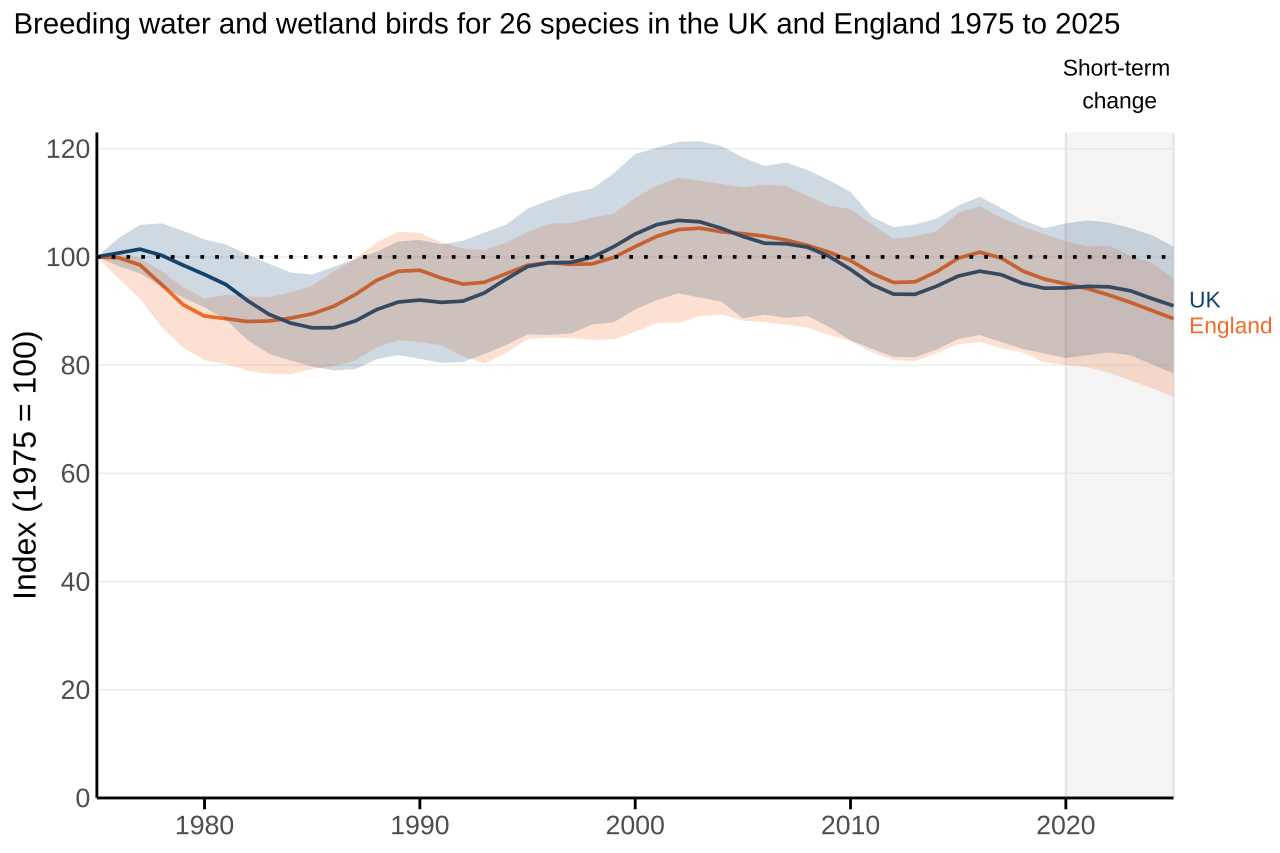
The water and wetland bird indicator for the UK has shown little or no change and the indicator for England has declined by 11% since 1975. The UK and England indicators follow a similar trajectory across the time period with an initial decline in the 1980s, followed by a relative return to baseline levels. More recently, since 2020, water and wetland bird populations have experienced little or no change across the UK and a decline of 7% in England. The indicators for both the UK and England include substantial variation among the species that make up this bird group, contributing to the wider confidence intervals around the composite indicators. These contrasting species trends include large declines in species such as yellow wagtail and substantial increases in species such as Cetti’s warbler.
Water and wetlands include rivers, lakes, ponds, reedbeds, coastal marshes, other wet grasslands, and lowland raised bogs. Together these total 3% of the UK’s area and provide important habitats for birds. The species included in the wetland indicator are those defined as having a positive association with waterways or wetlands, but in practice, these overlap markedly with those classified as ‘lowland wetland’ species and also include some upland birds and those also associated with farmland, for example reed bunting and yellow wagtail.
In this year’s publication, three previously published habitat subgroup indicators have been removed. These include the fast-flowing water, reedbeds, and slow-flowing and standing water habitat indices. Only the wetland meadow and wet grassland habitat subgroup is now published alongside the overall water and wetland bird composite indicator. Please see the main notes chapter for more information. We are keen to hear from users that may be impacted by the removal of these sub-indicators, please email us
Figure 4.1: Water and wetland bird populations on average have remained broadly stable since 1975 in the UK and declined more recently in England
Source: British Trust for Ornithology (BTO), Royal Society for the Protection of Birds (RSPB), and the Joint Nature Conservation Committee (JNCC).
Notes for Figure 4.1:
- The indicators are based on the aggregated population trends of 26 species of wetland birds in the UK and England, of which 8 are birds of wetland meadow and wet grassland.
- The smoothed trends with their 95% confidence intervals, which provide a measure of uncertainty, are represented by the lines and shaded areas for UK and England.
- The five-year assessment period over which short-term change in the indicator is calculated is signified by the grey box. For this indicator, it spans the time period 2020 to 2025.
Key results for wetland meadow and wet grassland habitat indicator:
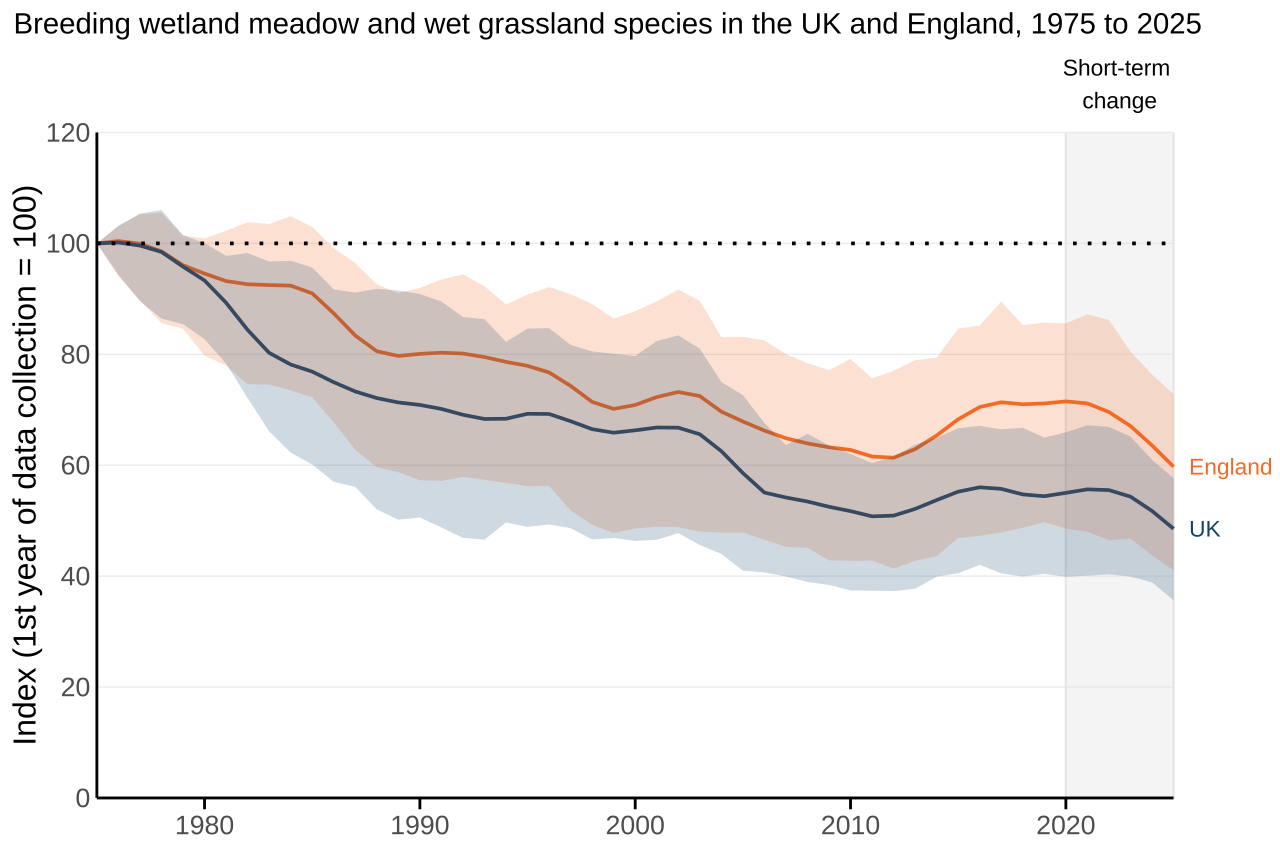
- In 2025, the index for birds associated with wetland meadow and wet grassland habitats was 51% lower in the UK and 40% lower in England than the 1975 baseline.
- In the most recent five-year period the indicators both declined, by 12% in the UK and 16% in England.
Figure 4.2: Wetland meadow and wet grassland bird populations have declined substantially since 1975 in both the UK and England
Source: British Trust for Ornithology (BTO), Royal Society for the Protection of Birds (RSPB), and the Joint Nature Conservation Committee (JNCC).
Notes for Figure 4.2:
- The wetland meadow and wet grassland bird indicator is based on the aggregated population trends of 8 bird species associated with this habitat.
- Figure 4.2 shows the smoothed trends together with their 95% confidence intervals for birds associated with wetland meadow and wet grassland habitats in the UK and England.
Table 4: Long and short-term trends at a glance for water and wetland birds in the UK and England, 1975 to 2025
| Index | Country | Species number | Long-term change (%) | Short-term change (%) |
|---|---|---|---|---|
| All | England | 26 | -11.4 * | -6.8 * |
| UK | 26 | -9 | -3.5 | |
| Wetland meadow and wet grassland | England | 8 | -40.3 * | -16.5 * |
| UK | 8 | -51.5 * | -11.8 * |
Source: British Trust for Ornithology (BTO), Royal Society for the Protection of Birds (RSPB), and the Joint Nature Conservation Committee (JNCC).
Notes for Table 4:
- Assessment of change is based on a 3% threshold of change and statistical significance is determined using the 95% confidence intervals associated with the indicator trends.
- Indicator trends that show significant declines or increases are denoted by an asterisk next to the percentage value.
Species trends: Water and wetland birds
The overall wetland indicator comprises 26 species. 8 of these are also included in the wetland meadow and wet grassland habitat indicator.
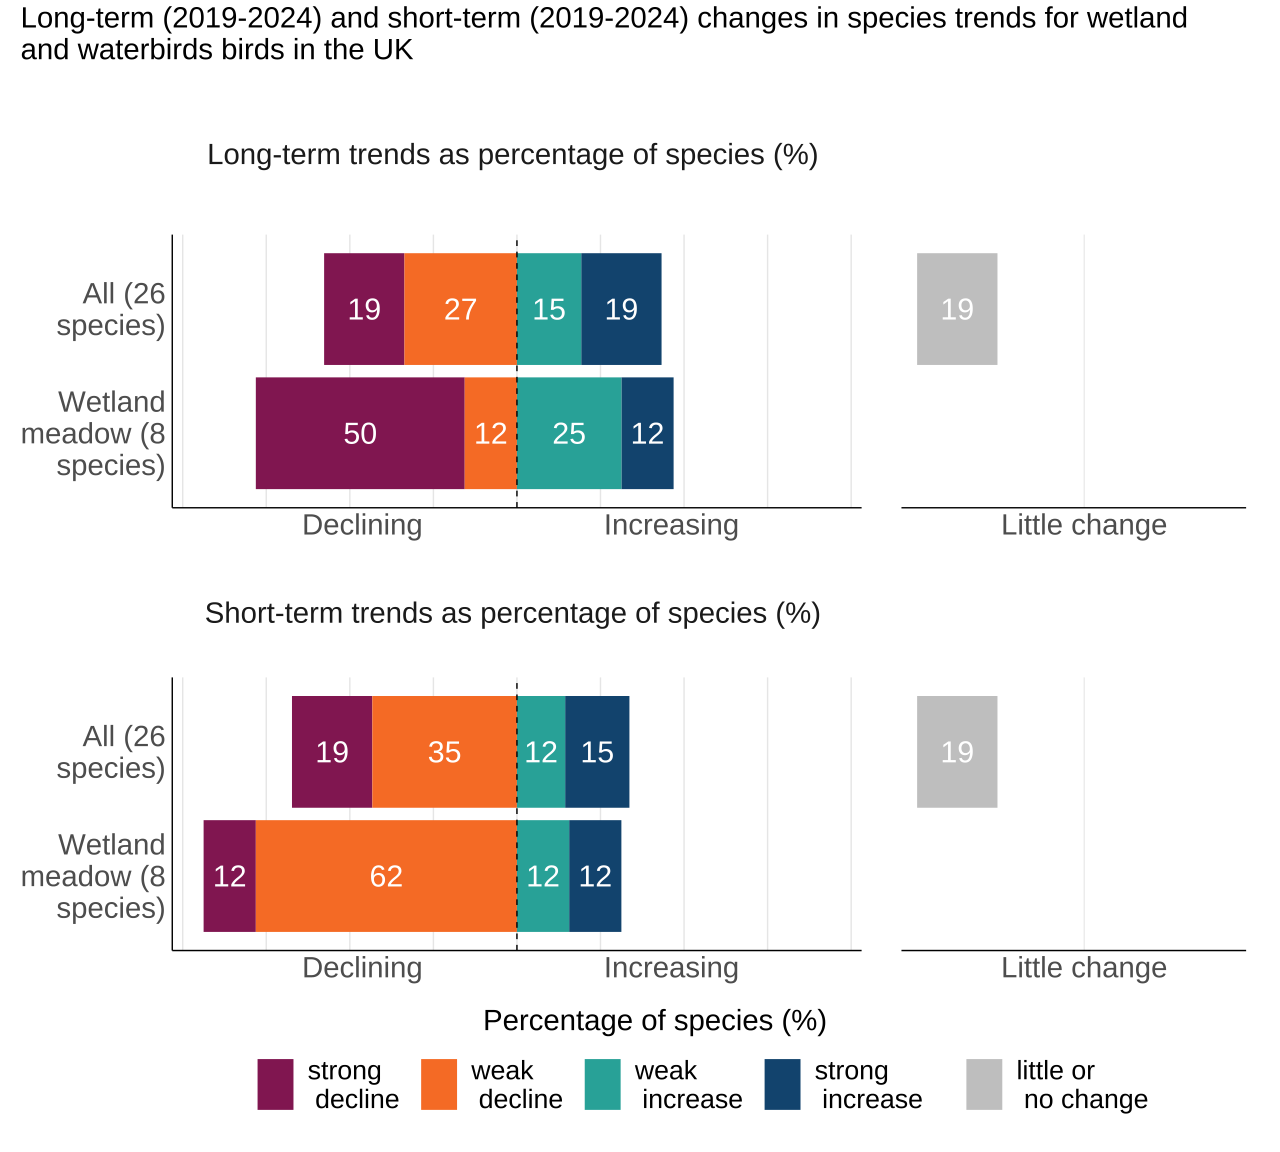
Long-term declines have been common among water and wetland bird species. These declines have been particularly widespread among wetland meadow species. A similar pattern is evident over the most recent five-year period. In England, a similar pattern is observed, although declines are more widespread over both the long and short term.
Figure 4.3: Long-term and short-term trends vary among species, but declines are more common
Source: British Trust for Ornithology (BTO), Royal Society for the Protection of Birds (RSPB), and the Joint Nature Conservation Committee (JNCC).
Notes for Figure 4.3:
- The figure shows the population trends of 26 species of wetland birds in the UK, including 8 species associated with wetland meadow and wet grassland habitats.
- The bars in each row sum to 100% and show the proportion of species categorised as showing an increase (strong or weak), a decrease (strong or weak), or little or no change.
- Change estimates for species are assessed to the penultimate year. The short-term, five-year change for species spans 2019 to 2024.
- Long-term trends are based on total population change across the full time series. Data for some species start after 1975 and so for these species the long-term change represents a shorter time period.
- Short-term trends are based upon mean annual change in the most recent five-year period.
- In both cases thresholds derived from the Birds of Conservation Concern status assessment are applied.
Species breakdown: Water and wetland birds
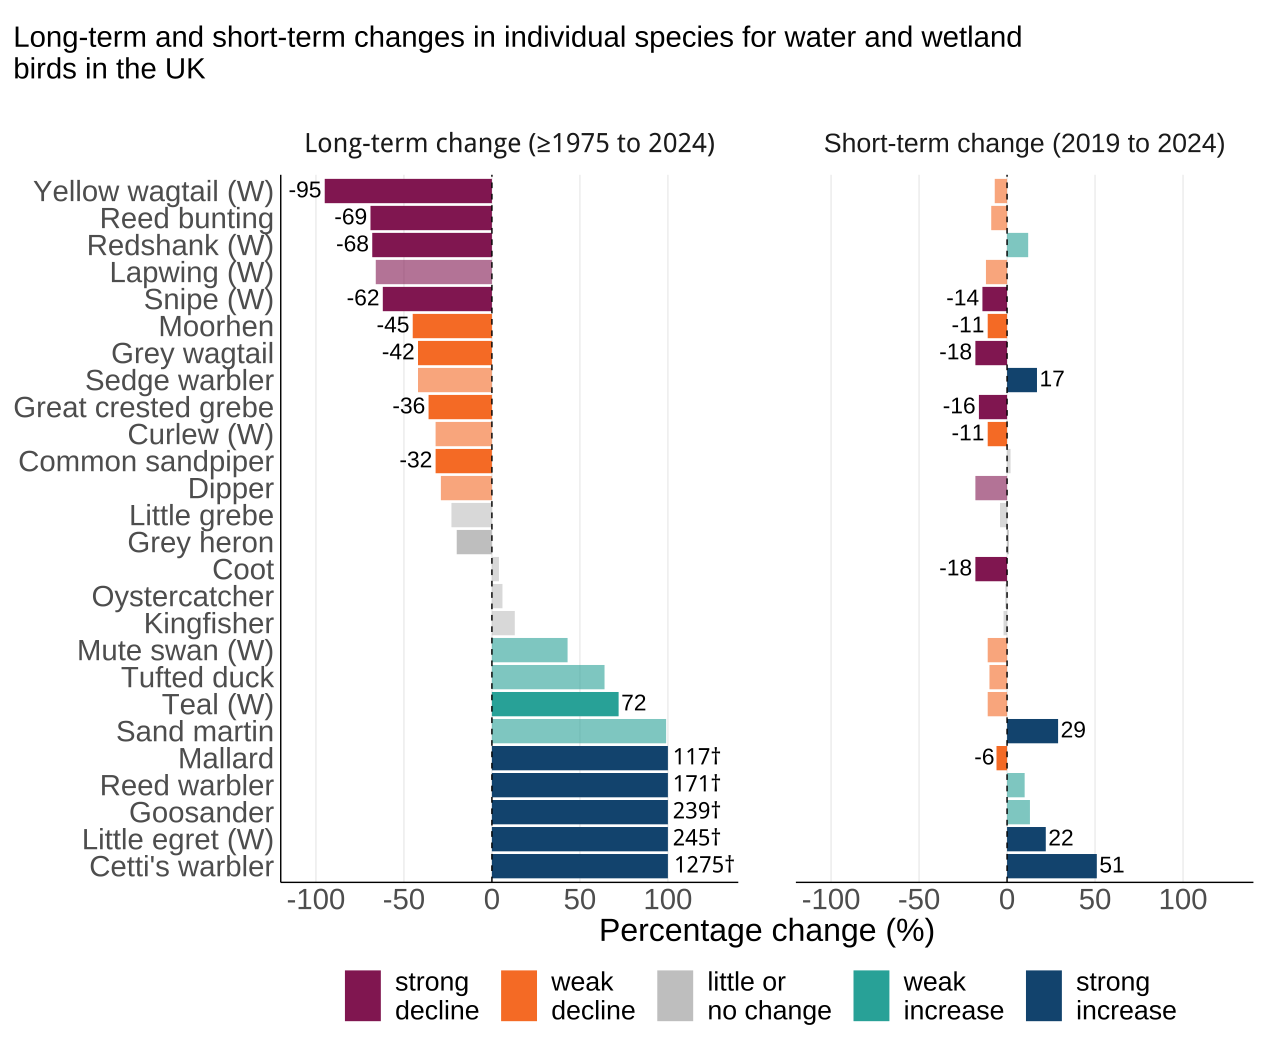
Over the long-term yellow wagtail, reed bunting, redshank and snipe have all declined strongly by over 60% in the UK and England. Other species in decline include lapwing, moorhen, grey wagtail, sedge warbler, great crested grebe, curlew, common sandpiper and dipper, although some of the UK population estimates for these species are uncertain.
In contrast, several species have shown long-term increases in both the UK and England. Most notably, there has been an extremely strong increase in the numbers of Cetti’s warbler, with more than a 10-fold increase since 1988, when the species exceeded the threshold for inclusion in the indicator, following the colonisation of the UK in 1972. In the UK, goosander and little egret numbers have more than tripled, while numbers of mallard and reed warbler have more than doubled. Other species showing increases include teal, mute swan, tufted duck and sand martin, although there is some uncertainty in the estimates of some of these species.
Figure 4.4: Long-term changes in UK water and wetland birds vary widely between species
Source: British Trust for Ornithology (BTO), Royal Society for the Protection of Birds (RSPB), and the Joint Nature Conservation Committee (JNCC).
Notes for Figure 4.4:
- Figure 4.4 shows the individual population changes of 26 species of water and wetland birds in the UK.
- Long-term trends were calculated from as early as 1975, although for some species data collection started later.
- The habitat subgroup birds of wetland meadow and wet grasslands are denoted by (W)
- Only those species for which the change was significant and whose average rate of change placed it outside of the ‘little or no change’ category are labelled with their percentage change.
- For visualisation purposes the axis has been truncated to between -100% and +100%. For species that exceed these limits, the exact percentage change is labelled next to the bars and marked with a † symbol. In Figure 4.4, goosander, reed warbler, little egret, mallard and Cetti’s warbler all exceed 100%.
- Change estimates for species are assessed to the penultimate year. The short-term, five-year change for species spans 2019 to 2024.
- Long-term trends are based on total population change across the full time series. Data for some species start after 1975 and so for these species the long-term change represents a shorter time period.
- Short-term trends are based upon mean annual change in the most recent five-year period.
- In both cases, thresholds derived from the Birds of Conservation Concern status assessment are applied.
Factors affecting wetland bird populations
The historical declines in breeding waders resulted from land management changes such as drainage, the intensification of grassland management and the conversion of coastal and floodplain grazing marshes to arable land. Where populations persist in small fragments of high-quality habitat, their nests and young can be vulnerable to predation, which is currently thought to be limiting the recovery of several species of breeding wader. However, a range of species, particularly those associated with standing water bodies, have benefited from habitat creation, especially from the restoration of post-extraction gravel pits. Additionally, there has been a net positive impact from improved survival rates due to the trend in climate towards milder winters.
For more information about the evidence for this indicator, see the evidence statement Annex 1.05 Evidence Statement for C5c Wetland birds. More information about individual species is available at BirdFacts.
5. Breeding seabird populations in the UK and England
Indicator trend description: Seabirds
Important changes have been made to the seabird indicators since last year’s publication, these include a methodological update to the underlying trends to improve confidence estimates, removal of gannet from the England index, and the removal of subgroup indicators based on feeding habits. For more information, please see the main notes chapter and Technical Background document associated with this release. We are keen to hear from users that may be impacted by the removal of these sub-indicators, please email us.
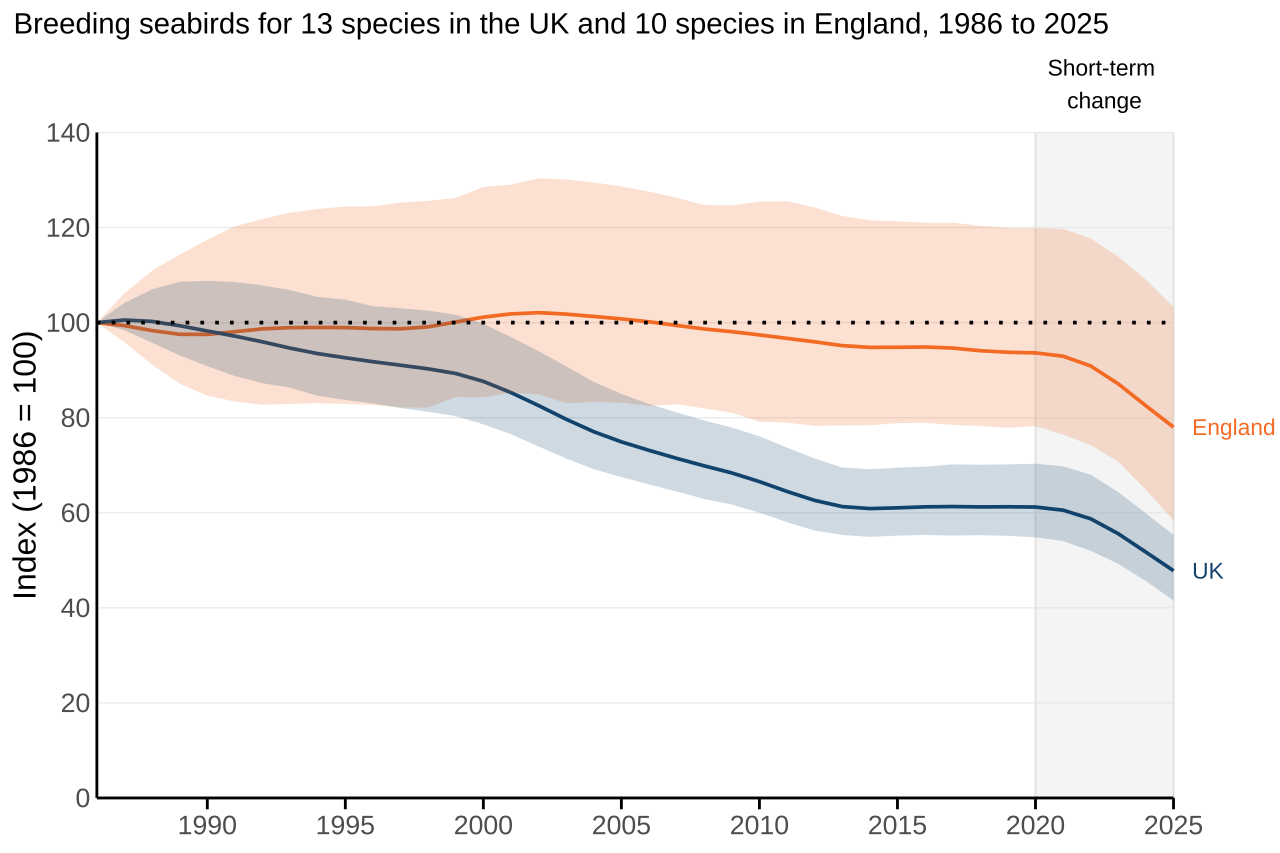
The UK seabird indicator has declined by 52% since 1986. The population showed a steady decline until 2013 and then more recently a sharp decline of 22% in the five years since 2020. The England index showed little or no change since 1986 but a 17% decline in the five years since 2020.
The indicators for seabirds in the UK and England show divergent trends, particularly in the early part of the time series. Although seabird population trends will vary by region and between colonies, species included in both indicators generally show similar long-term patterns of increase and decline. Much of the difference between the indicators reflects variation in species coverage. Some species, such as Arctic skua, breed only in Scotland, while others are concentrated in northern parts of the UK and lack sufficient data to produce England-only trends.
The UK coast consists of a wide variety of habitats such as sea cliffs, sand dunes, shingle ridges, machair and intertidal areas. Additionally, the area of sea around the UK amounts to three and a half times the land area of the UK (not including overseas territories). The marine habitats used for foraging by this group of birds include coastal lagoons and shallow coastal waters as well as deeper offshore waters throughout the UK. Although inland populations of seabird species are largely excluded, some species will also exploit terrestrial food sources.
Data collection for seabirds was impacted by the COVID-19 pandemic but differences in annual coverage are accounted for in the analyses. Trends in some seabird species have been negatively impacted by the onset of Highly Pathogenic Avian Influenza (HPAI) since 2020, and large annual differences in the numbers of affected birds at different colonies have added to the instability in some trends.
Figure 5.1: Populations of UK seabird species have declined on average by around a half since 1986, with recent declines observed in English populations
Source: British Trust for Ornithology (BTO), Royal Society for the Protection of Birds (RSPB), and the Joint Nature Conservation Committee (JNCC).
Notes for Figure 5.1:
- The indicators are based on the aggregated population trends of 13 species of seabirds in the UK and 10 species in England.
- Figure 5.1 shows the smoothed trends with their 95% confidence intervals, which provide a measure of uncertainty, represented by the lines and shaded areas for UK and England.
- The five-year assessment period over which short-term change in the indicator is calculated is signified by the grey box. For this indicator, it spans the time period 2020 to 2025.
Table 5: Long and short-term trends at a glance for Seabirds in the UK and England
| Index | Country | Species number | Long-term change (%) | Short-term change (%) |
|---|---|---|---|---|
| Seabirds | England | 10 | -22 | -16.7 * |
| UK | 13 | -52.2 * | -21.9 * |
Source: British Trust for Ornithology (BTO), Royal Society for the Protection of Birds (RSPB), and the Joint Nature Conservation Committee (JNCC).
Notes for Table 5:
- Assessment of change is based on a 3% threshold of change and statistical significance is determined using the 95% confidence intervals associated with the indicator trends.
- Indicator trends that show significant declines or increases are denoted by an asterisk next to the percentage value.
Species trends: Seabirds
The seabird index for the UK includes individual measures for 13 species of seabirds while the index for England includes individual measures for 10 species of seabirds.
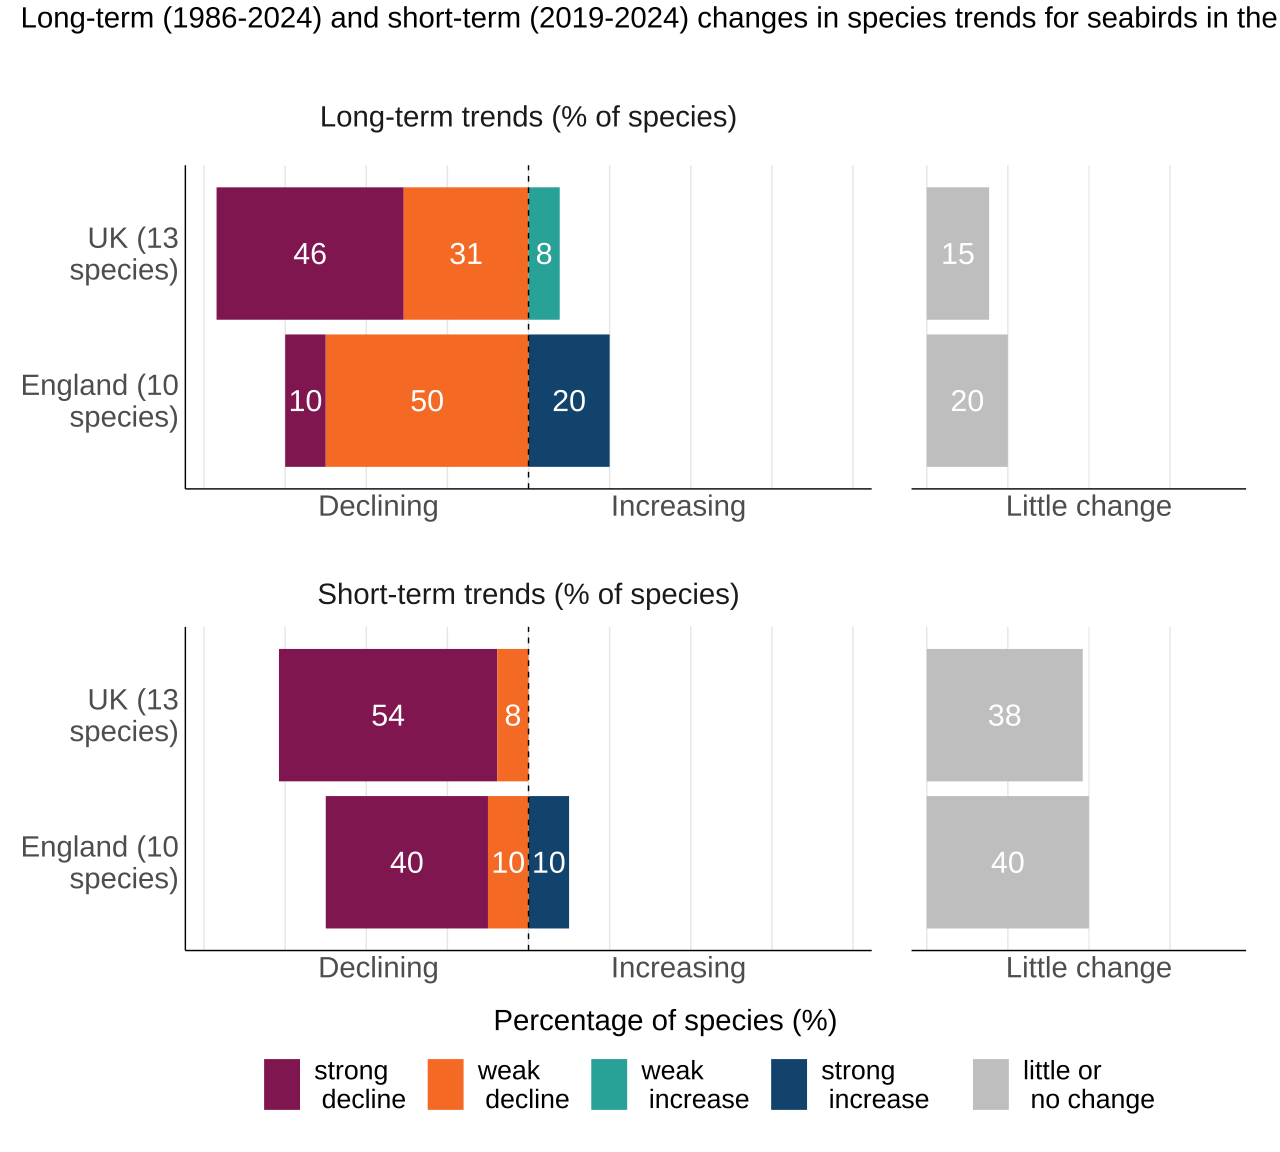
Declines have been widespread among seabird species since 1986. Most species in both the UK and England have declined over the long term, while relatively few have increased.
Recent trends show a similar pattern, with declines continuing to outnumber increases. However, some species have shown little or no change in the most recent five-year period.
The proportion of declining species is higher in the UK than in England, indicating more widespread declines across the UK seabird community.
Figure 5.2: Seabird population declines remain prevalent in the UK and England
Source: British Trust for Ornithology (BTO), Royal Society for the Protection of Birds (RSPB), and the Joint Nature Conservation Committee (JNCC).
Notes for Figures 5.2:
- The figure shows the population trends of 13 species of seabirds in the UK and 10 species in England.
- The bars in each row sum to 100% and show the proportion of species categorised as showing an increase (strong or weak), a decrease (strong or weak), or little or no change.
- Change estimates for species are assessed to the penultimate year. The short-term, five-year change for species spans 2019 to 2024.
- Long-term trends are based on total population change across the full time series. Data for some species start after 1986 and so for these species the long-term change represents a shorter time period.
- Short-term trends are based upon mean annual change in the most recent five-year period.
- In both cases thresholds derived from the Birds of Conservation Concern status assessment are applied.
Species breakdown: Seabirds
The species-level breakdown of seabirds is released in the Seabird Monitoring Programme annual report.
Factors affecting seabird populations
Seabird populations are impacted by a range of pressures including:
- climate change and fisheries-induced changes in prey availability;
- mortality and displacement associated with the expansion of offshore windfarms;
- introduced mammalian predators on islands;
- general disturbance of nesting or feeding sites.
Since 2020, the onset of HPAI in Britain’s seabirds has had devastating effects on many species. Particular impacts were seen among Arctic skua and many of the tern species (Tremlett, Morley and Wilson, 2024). Incidences of high mortality of species such as shag during the winter (seabird wrecks) are also likely due to a combination of weakened condition in infected birds and severe winter weather making it difficult to feed. Recent declines in populations of three of the terns, cormorant and shag are also likely attributable to avian flu impact. Additionally, some of the most impacted species, such as Great skua, are not included in this indicator, which only includes around half of the species of breeding seabirds in the UK (see the seabird colony count for a broader picture).
For more information about the evidence for this indicator, see the evidence statement Annex 1.06 Evidence Statement for C5d Seabirds. More information about individual species is available at BirdFacts and the Seabirds Count – the fourth Breeding Seabird Census
6. Breeding upland bird populations in the UK and England
Indicator trend description: Upland birds
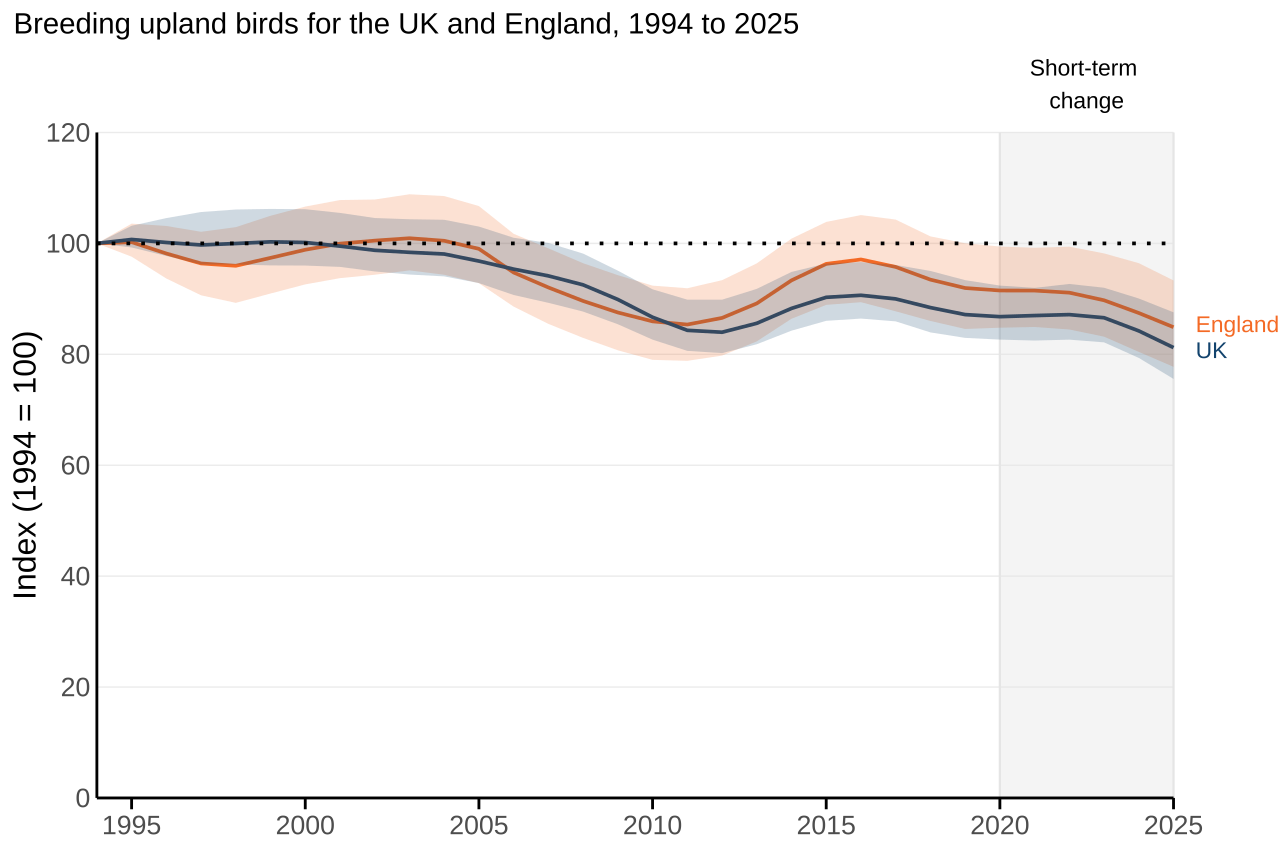
Upland bird populations have declined by 19% in the UK and 15% in England since 1994. These populations have also declined by 6% in the UK and 7% in England over the short-term. There is some variation in the indicator trends of upland specialists and upland generalists. Upland generalists, like red kite, have increased over the long-term, whereas upland specialists, such as dotterel and whinchat have shown strong declines over the long-term and red grouse have declined over the past five years.
The upland areas in the UK are wild and isolated, providing the ideal open habitat for a variety of bird groups. In England, these comprise mainly of large areas in the north as well as pockets in the southwest, but are comparatively less widespread than in other UK countries. Largely open and often grazed with livestock, these areas provide open habitats for waders and specialist moorland birds to breed or forage.
Due to its heavy reliance on the Breeding Bird Survey introduced in 1994, as well as relevant national single-species surveys during the same period, this indicator covers the period 1994 to 2025. Therefore, this indicator does not cover the period during which significant change was observed in some of the other habitat indicators, such as farmland and woodland.
In this year’s publication, we have removed the riparian habitat indicator. This indicator consisted of only four species, which remain included in the overall upland indicator. Please see the main notes chapter for more information. We are keen to hear from users that may be impacted by the removal of this sub-indicator, please email us.
Figure 6.1: Upland bird populations have declined in the UK and England
Source: British Trust for Ornithology (BTO), Royal Society for the Protection of Birds (RSPB), and the Joint Nature Conservation Committee (JNCC).
Notes for Figure 6.1:
- The indicators are based on the aggregated population trends of 32 species of upland birds in the UK and 28 in England. 15 of these species are upland specialists (12 in England), and 13 are generalists in the UK (12 in England).
- Figure 6.1 shows the smoothed trend together with its 95% confidence interval (a measure of uncertainty) represented by the shaded areas on the chart, for UK and England.
- The five-year assessment period over which short-term change in the indicator is calculated is signified by the grey box. For this indicator, it spans the time period 2020 to 2025.
Key results for individual habitat indices:
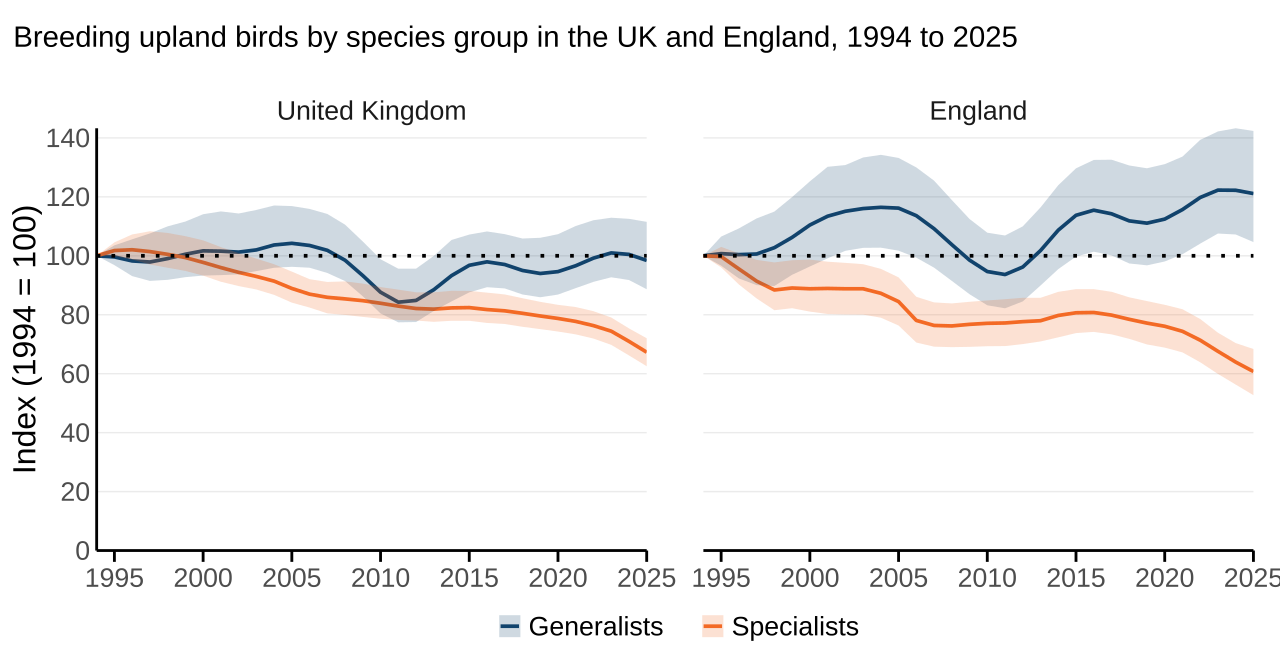
- The index for upland specialists in the UK was 33% lower in 2025 than in 1994. It has continued to decrease steadily over the most recent period, by 15% since 2020. For England, the most recent five years show a steep decline of 20% and these specialist species have declined much further overall, by 39% since 1994.
- The index for upland generalists in the UK has shown little change in the long and short-term. Generalist species in England have shown an increase of 21% since 1994 but show little change over the last five years.
Figure 6.2: Long-term declines in upland bird populations are driven by specialist species
Source: British Trust for Ornithology (BTO), Royal Society for the Protection of Birds (RSPB), and the Joint Nature Conservation Committee (JNCC).
Notes for Figure 6.2:
- The indicators are based on the aggregated population trends of 32 species of upland birds in the UK and 28 in England. 15 of these species are upland specialists (12 in England), and 13 species are generalists in the UK (12 in England).
- Figure 6.2 shows the smoothed trend together with its 95% confidence interval for the different bird subgroups. Trends for the UK and England are plotted side by side.
Table 6: Long-term and short-term trends at a glance for upland birds in the UK and England
| Index | Country | Species number | Long-term change (%) | Short-term change (%) |
|---|---|---|---|---|
| All | England | 28 | -15.1 * | -7.2 * |
| UK | 32 | -18.8 * | -6.4 * | |
| Generalists | England | 12 | 21.1 * | 7.7 |
| UK | 13 | -1.6 | 4 | |
| Specialists | England | 12 | -39.3 * | -20.2 * |
| UK | 15 | -32.7 * | -14.6 * |
Source: British Trust for Ornithology (BTO), Royal Society for the Protection of Birds (RSPB), and the Joint Nature Conservation Committee (JNCC).
Notes for Table 6:
- Assessment of change is based on a 3% threshold of change and statistical significance is determined using the 95% confidence intervals associated with the indicator trends.
- Indicator trends that show significant declines or increases are denoted by an asterisk next to the percentage value.
- Short-term change cannot be calculated for species with limited data.
Species trends: Upland birds
The upland bird indices for the UK and England include individual measures for 32 species of upland birds in the UK and 28 species in England. These are disaggregated into 2 subgroups: specialists and generalists. The upland specialist indices are comprised of the population trends for 15 species in the UK (12 species in England) characteristic of and strongly associated with upland areas, typically open moorland habitats. Upland generalists (13 species in the UK and 12 species in England) are widespread and often common in uplands but also found in other habitats such as lowland farms or woodland. For these species, most of which are known to occupy several different habitats, the population trends used are derived solely from surveys in upland habitat.
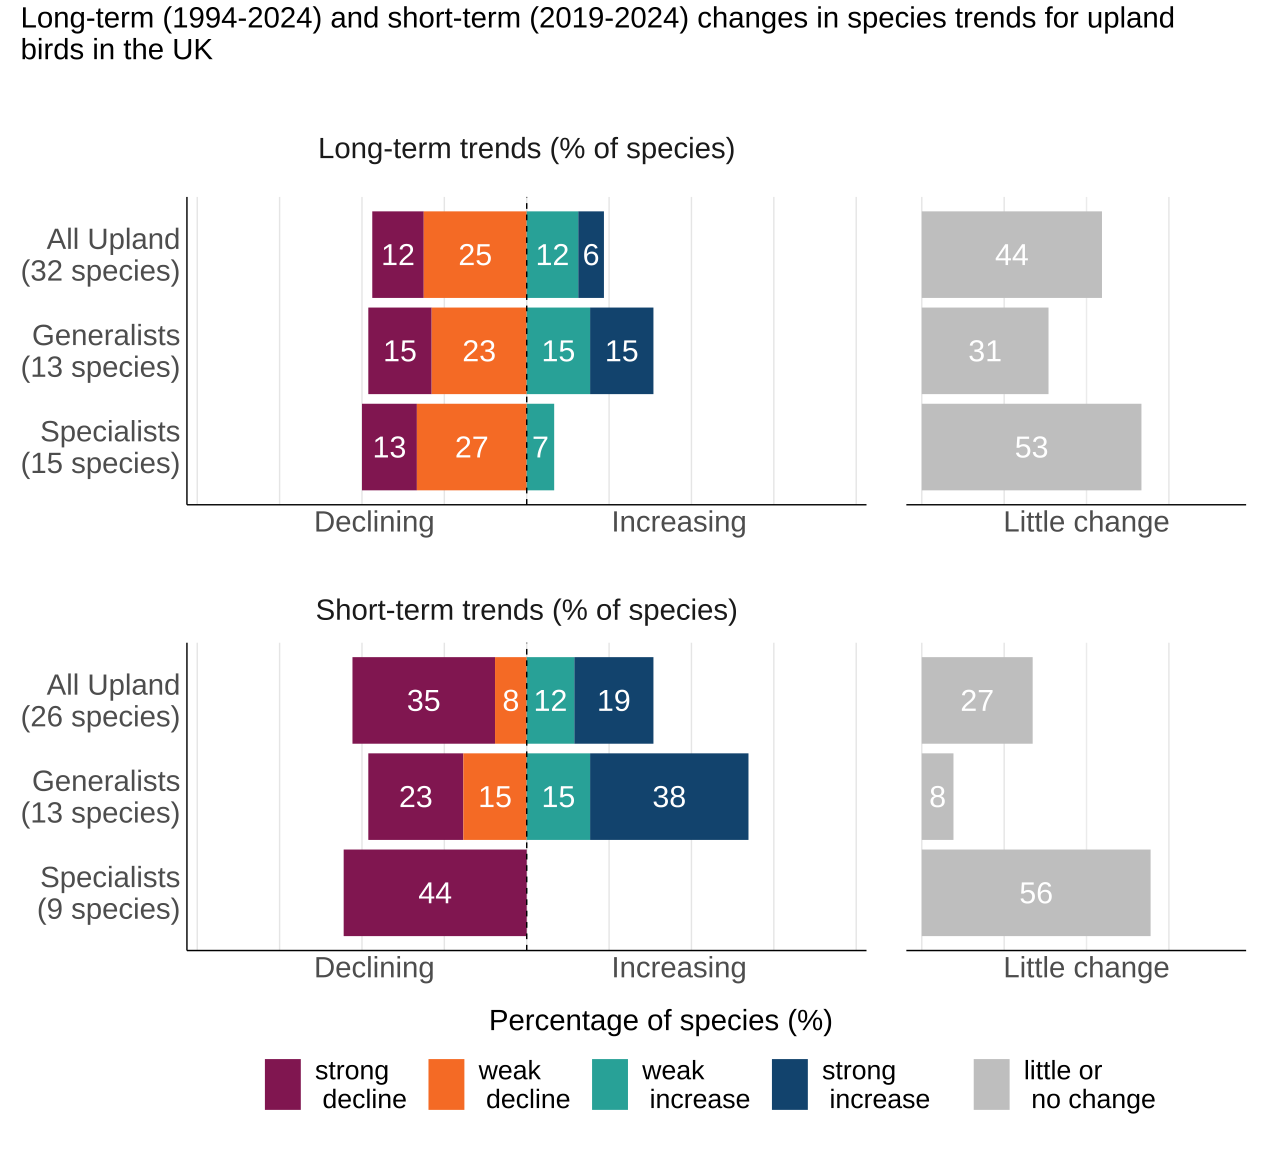
In the UK, long-term trends are mixed, with many upland bird species showing little or no change since 1994. Generalist species have experienced a balance of increases and declines, while declines have been more common among specialist species.
In the most recent five-year period, trends have differed between the two groups. Many upland generalist species have increased, while upland specialists have continued to show less favourable trends, with declines remaining more common than increases.
The pattern in England is similar to that in the UK. However, a greater proportion of upland specialist species have declined in the short term.
Figure 6.3: Most upland bird species have either declined or shown little change since 1994
Source: British Trust for Ornithology (BTO), Royal Society for the Protection of Birds (RSPB), and the Joint Nature Conservation Committee (JNCC).
Notes for Figures 6.3:
- The figure shows the population trends of 32 species of upland birds in the UK (15 species are upland specialists and 13 species are upland generalists).
- Over the long-term, 32 upland species were assessed but only 26 could be assessed over the short-term.
- The bars in each row sum to 100% and show the proportion of species categorised as showing an increase (strong or weak), a decrease (strong or weak), or little or no change.
- Change estimates for species are assessed to the penultimate year. The short-term, five-year change for species spans 2019 to 2024. Short-term change cannot be calculated for species with limited data.
- Long-term trends are based on total population change across the full time series. Data for some species start after 1994, so for these species the long-term change represents a shorter time period.
- Short-term trends are based on mean annual change in the most recent five-year period.
- In both cases thresholds derived from the Birds of Conservation Concern status assessment are applied.
Species breakdown: Upland birds
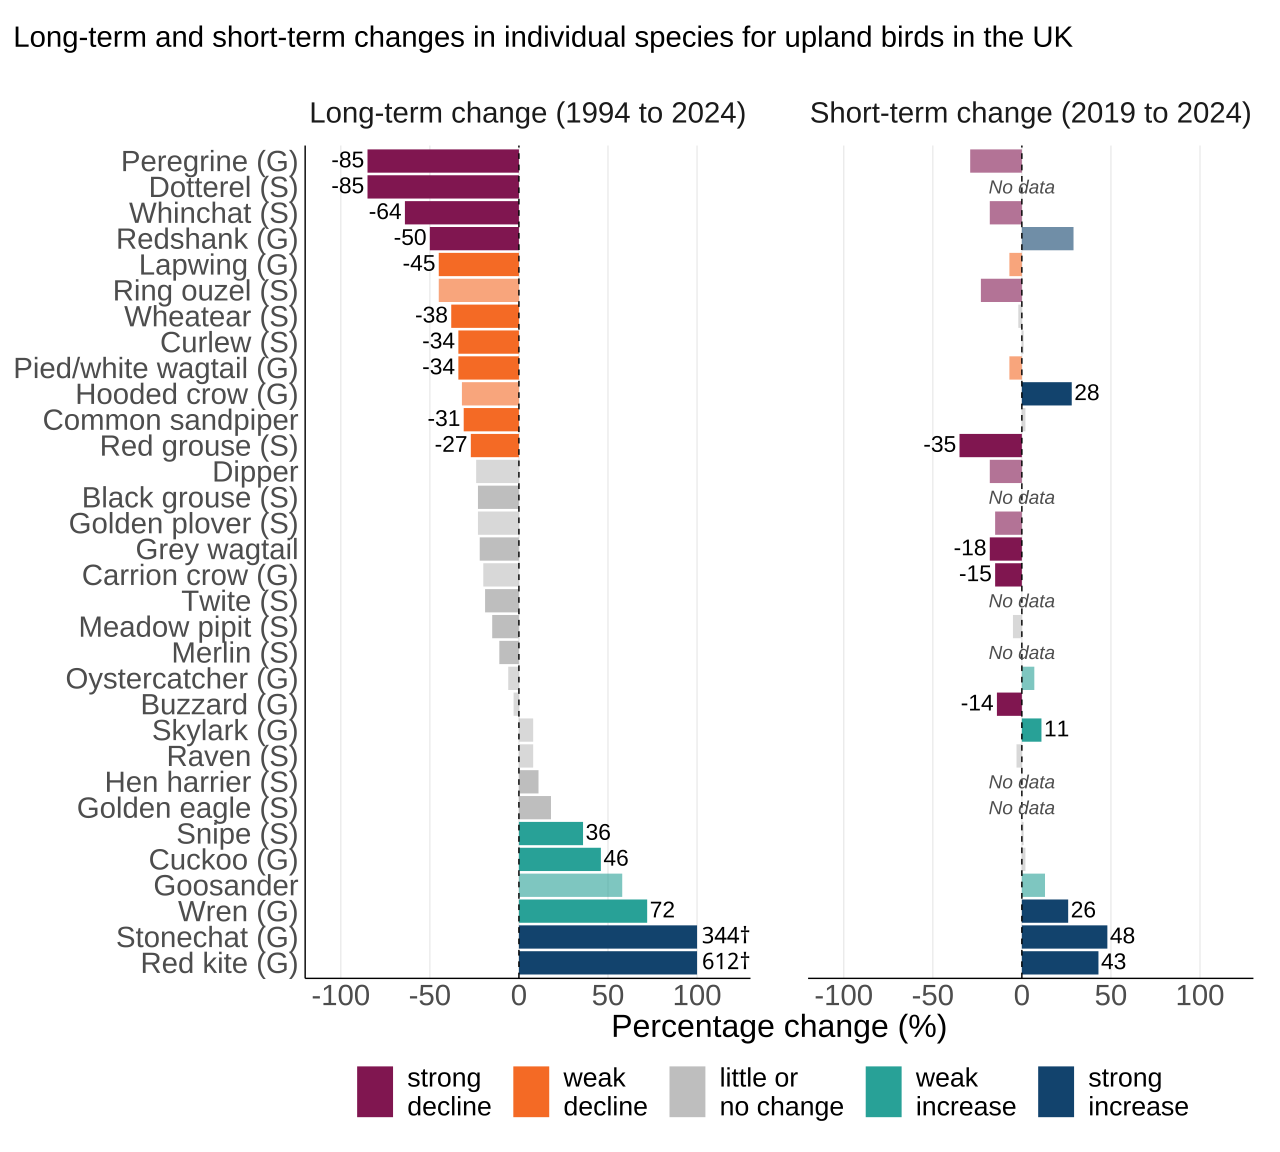
Since 1994, several upland bird species have increased substantially in the UK. Among the upland generalists, red kite and stonechat populations have increased by more than 600% and 300%, respectively, in the UK and have continued to increase over the short-term. Skylark is also increasing over the most recent five-year period.
By contrast, several species have experienced substantial declines. Among upland generalists, peregrine and redshank populations have more than halved since 1994, while among upland specialists, dotterel, whinchat and red grouse have all declined. In England, whinchat and twite show strong long-term declines, while red grouse, raven, lapwing and golden plover have declined markedly in the short term. Common sandpiper has declined in both the UK and England over the long term, while grey wagtail and dipper have shown more recent declines.
Figure 6.4: Around twice as many upland bird populations have declined as have increased in the UK since 1994
Source: British Trust for Ornithology (BTO), Royal Society for the Protection of Birds (RSPB), and the Joint Nature Conservation Committee (JNCC).
Notes for Figure 6.4:
- Figure 6.4 shows the individual population changes of 32 species of upland birds in the UK.
- Habitat subgroups are denoted by the letters in brackets at the end of each species: G = upland generalist species; S = upland specialist species.
- Only those species for which the change was significant and whose average rate of change placed them outside of the ‘little or no change’ category are labelled with their percentage change.
- For visualisation purposes the axis has been truncated to between -100% and +100%. For species that exceed these limits, the exact percentage change is labelled next to the bars and marked with a † symbol. In figure 6.4, stonechat and red kite both exceed 100% increase in the long-term.
- Change estimates for species are assessed to the penultimate year. The short-term, five-year change for species spans 2019 to 2024. Short-term change cannot be calculated for species with limited data.
- Long-term trends are based on total population change across the full time series. Data for some species start after 1994, so for these species the long-term change represents a shorter time period.
- Short-term trends are based on mean annual change in the most recent five-year period.
- In both cases thresholds derived from the Birds of Conservation Concern status assessment are applied.
Factors affecting upland bird populations
Upland birds are vulnerable to a number of pressures contributing to the pattern of overall decline, particularly among the upland specialists. UK uplands have a long history of intensive sheep grazing, game management and commercial afforestation. Reviews of the causes of change have identified changes in grazing pressure, forest expansion (particularly of non-native conifers), reductions in site-based predator control, and climate change impacts such as drought and rising temperatures as major pressures on open-nesting moorland species. Upland passerines are primarily affected by changes in vegetation structure and composition. Reduced persecution has contributed to the recovery of several raptor species, although it remains an ongoing pressure. Population recovery has also been supported by targeted conservation initiatives, including species recovery, reintroduction and reinforcement programmes.
More information about individual species is available at BirdFacts.
7. Wintering waterbird populations in the UK and England
Indicator trend description: Wintering waterbirds
Wintering waterbird populations have increased by 88% in the UK and 80% in England since 1975/1976. However, since the early 2000s the indicators have been in decline, although this has stabilised with little or no change over the most recent five-year period. The decline since 2000 is mostly driven by wildfowl, such as Bewick’s swan and scaup, rather than wader species. While a number of wildfowl species continue to show declines, this is contrasted by recent increases in several wader species including dunlin and purple sandpiper. These indicators relate to numbers of these species during the winter period from September to the following March each year for wildfowl and from November to March for waders.
The term waterbird is used to describe all birds that inhabit or depend on water and wetland habitats; this chapter is about waterbirds that over-winter in the UK, some of which also breed here. The wintering waterbird trends in this chapter are not included in the overall breeding bird index, but that index does include breeding population trends for species in the wintering waterbird indicator which also breed in the UK and for which breeding trends are available. Wintering populations typically originate from breeding populations outside the UK, and may represent different populations or races to those of UK breeders.
Data from wintering waterbirds monitoring schemes are based largely on full counts at colonies or at wetland and coastal sites of markedly varying size. This means that bootstrapping methods cannot be applied reliably and hence trends for these groups are currently presented without confidence intervals. As a result, the uncertainty associated with estimated changes cannot be quantified. Instead, the wintering waterbird indicator trends are assessed using a 5% threshold, which is a pragmatic rule of thumb rather than a statistical measure of significance. This is particularly relevant for short-term assessments, where natural year-to-year variation may influence estimated trends and produce apparent increases or declines that may not persist over longer time periods. Reported changes should therefore be interpreted with appropriate caution.
Figure 7.1: Wintering waterbird populations on average remain above 1975/1976 levels despite recent declines
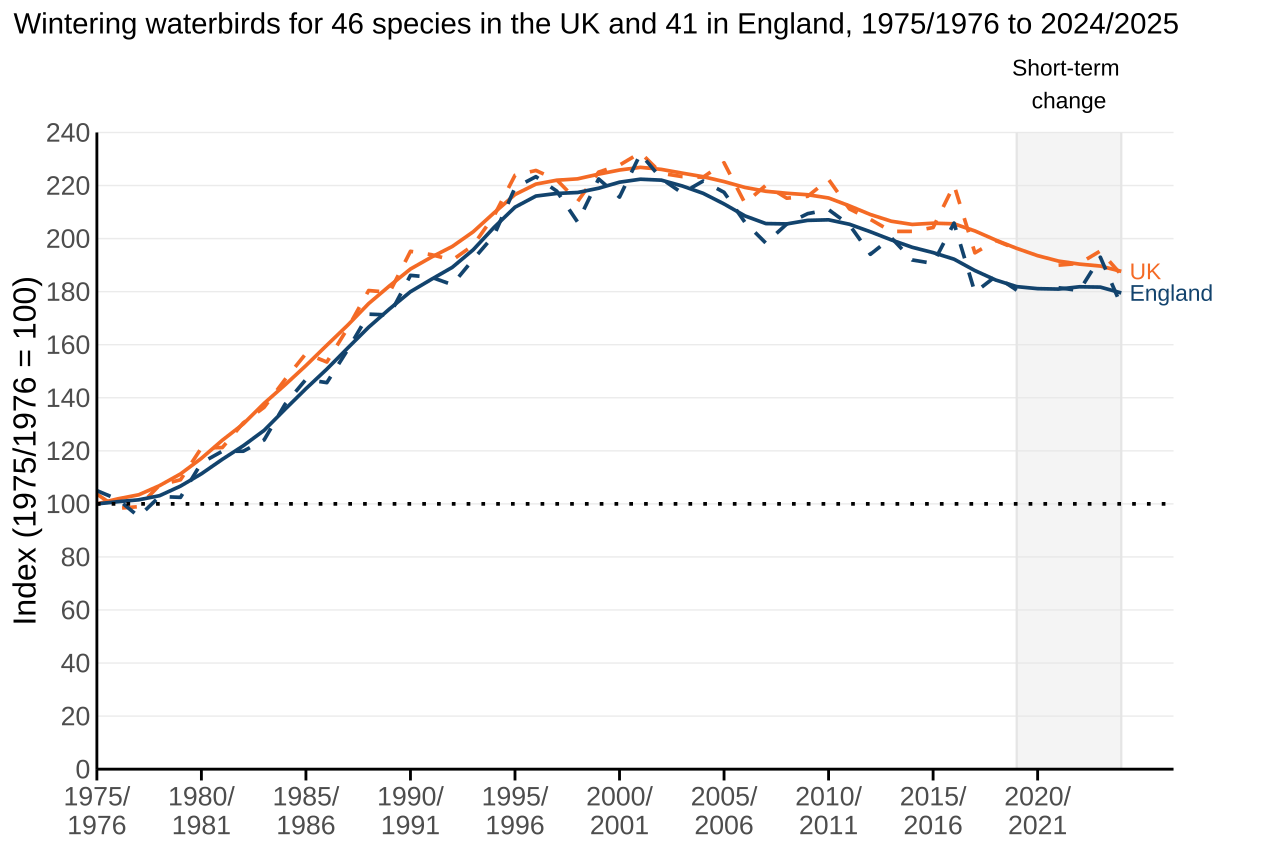
Source: British Trust for Ornithology (BTO), Royal Society for the Protection of Birds (RSPB), and the Joint Nature Conservation Committee (JNCC).
Notes for Figure 7.1:
- The indicators are based on the aggregated population trends of 46 species or races of wintering waterbirds in the UK and 41 in England, of which 15 species are waders in the UK and in England and 31 species or races are wildfowl in the UK (26 in England).
- Figure 7.1 shows the smoothed trend (solid line) together with the unsmoothed trend (dashed line) for UK and England.
- As there are no 95% confidence intervals for wintering waterbirds, we instead provide the unsmoothed index as a view of the underlying variability of the data.
- Each year of data corresponds to a wintering period from September of that year to the following March.
- The five-year assessment period over which short-term change in the indicator is calculated is signified by the grey box. For this indicator, it spans the time period 2019/2020 to 2024/2025.
Key results for individual habitat indices:
- The index for waders in the UK was 87% higher in 2024/2025 than in 1975/1976. The index has been relatively stable or declining very slowly since the late 90s, and shown little change over the last five years. For England, the waders show a very similar trend, with an 80% increase since 1975/1976, a decline since the early 2000s but an increase of 5% over the last five years.
- The index for wildfowl in the UK was 91% higher in 2024/2025 than in 1975/1976. The index has been in decline since the early 2000s, with a decrease of 9% in the most recent five years. For England, wildfowl show a very similar trend, with an 82% increase since 1975/1976 and a decrease of 5% over the last five years.
Figure 7.2: Indicators for wildfowl and waders both increased strongly in the long-term, but recent trends differ
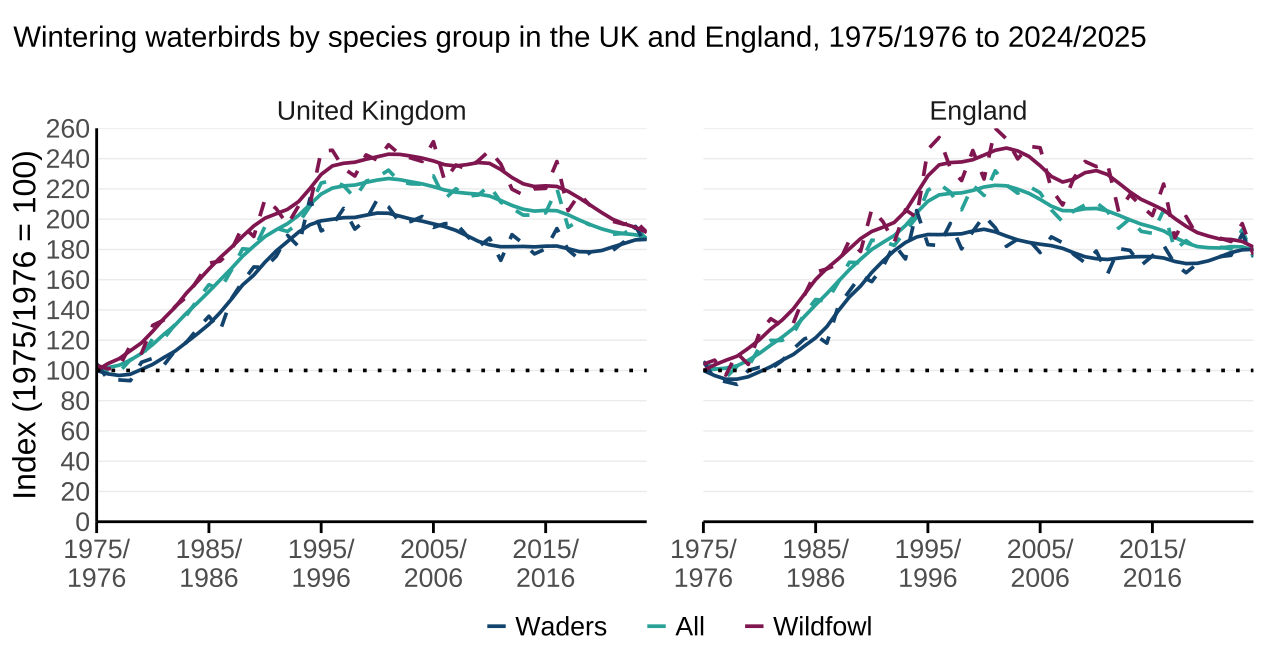
Source: British Trust for Ornithology (BTO), Royal Society for the Protection of Birds (RSPB), and the Joint Nature Conservation Committee (JNCC).
Notes for Figure 7.2:
- The indicators are based on the aggregated population trends of 46 species or races of wintering waterbirds in the UK and 41 in England, of which 15 species are waders in the UK (15 in England) and 31 species or races are wildfowl in the UK (26 in England).
- Figure 7.2 shows the smoothed trend (solid line) together with the unsmoothed trend (dashed line) for the different subgroups of birds. Trends for the UK and England are plotted side by side.
- As there are no 95% confidence intervals for wintering waterbirds, we instead provide the unsmoothed index as a view of the underlying variability of the data.
- Each year of data corresponds to a wintering period from September of that year to the following March for wildfowl, and from November to March for waders.
Table 7: Long and short-term trends at a glance for wintering waterbirds in the UK and England
| Index | Country | Species number | Long-term change (%) | Short-term change (%) |
|---|---|---|---|---|
| All | England | 41 | 79.5 | -1.3 |
| UK | 46 | 87.6 | -4.4 | |
| Waders | England | 15 | 80.1 | 5.4 |
| UK | 15 | 86.7 | 4.7 | |
| Wildfowl | England | 26 | 81.6 | -5 |
| UK | 31 | 91.3 | -8.5 |
Source: British Trust for Ornithology (BTO), Royal Society for the Protection of Birds (RSPB), and the Joint Nature Conservation Committee (JNCC).
Notes for Table 7:
- The wintering waterbird indicator trends are assessed using a 5% threshold as confidence intervals are not currently available for these species trends.
Species trends: Wintering waterbirds
The wintering waterbirds index for both the UK and England includes individual measures for 46 species (or races) of wintering waterbirds in the UK and 41 in England, of which 15 species are waders in the UK (15 in England) and 31 species (or races) are wildfowl in the UK (26 in England). The overall trend masks different underlying trends for wader species and wildfowl species.
In the UK, the wintering waterbird populations show a marked contrast between long-term and recent trends. Since 1975/76, increases have been more common than declines for both waders and wildfowl, indicating long-term growth in many wintering populations.
In the most recent five-year period, however, declines have become more widespread. This change is driven largely by wildfowl populations, where over half the species are declining. Wader populations have generally fared better, with more species increasing, or showing little or no change.
England broadly mirrors the UK pattern, with long-term increases in many wintering waterbird populations but more recent increases and less widespread decline over the most recent five-year period.
Figure 7.3: Most wintering waterbird species increased in the long-term, but short-term declines are concentrated in wildfowl
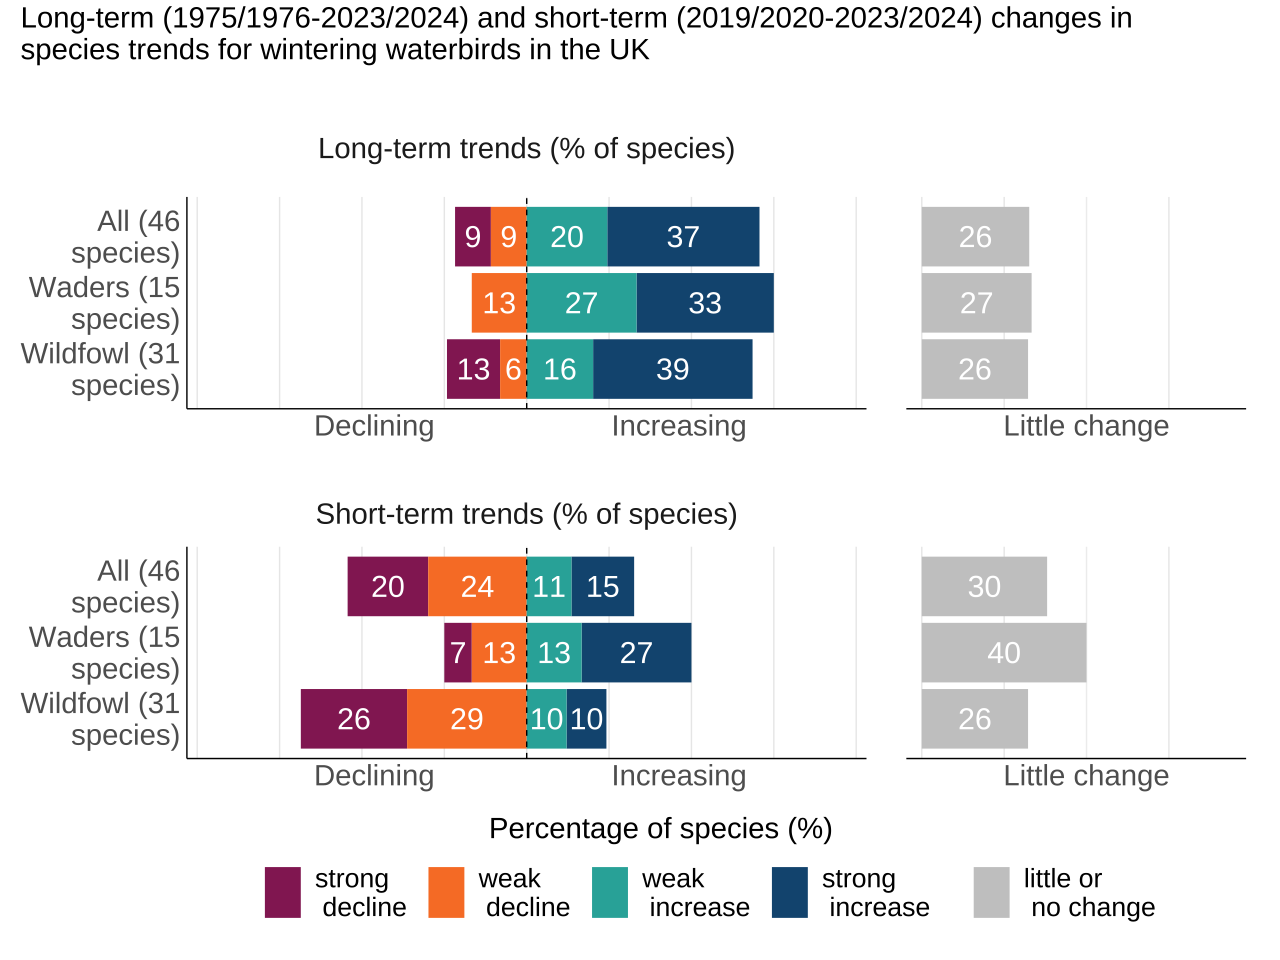
Source: British Trust for Ornithology (BTO), Royal Society for the Protection of Birds (RSPB), and the Joint Nature Conservation Committee (JNCC).
Notes for Figure 7.3:
- The figure shows the population trends of 46 species or races of wintering waterbirds in the UK and 41 in England, of which 15 species are waders in the UK (15 in England) and 31 species or races are wildfowl in the UK (26 in England).
- The bars in each row sum to 100% and show the proportion of species categorised as showing an increase (strong or weak), a decrease (strong or weak), or little or no change.
- Change estimates for species are assessed to the penultimate year for the species trend. The short-term, five-year change for species spans 2018/2019 to 2023/2024.
- Long-term trends are based on total population change across the full time series. Data for some species start after 1975/76 and so for these species the long-term change represents a shorter time period.
- Short-term trends are based upon mean annual change in the most recent five-year period.
- In both cases thresholds derived from the Birds of Conservation Concern status assessment are applied.
Species breakdown: Wintering waterbirds
The wintering waterbird indicator breaks down some species (barnacle goose, brent goose, greylag goose and white-fronted goose) into distinct races and/or flyway populations. These populations breed and winter in different areas within and outside the UK, and hence are treated separately here, as in most conservation assessments and initiatives.
The UK and England versions of the wintering waterbird indicator have different species compositions. Icelandic greylag goose, Greenland white-fronted goose, light-bellied brent goose (of Nearctic origin), and both populations of barnacle goose (Greenland and Svalbard) only appear for the UK indicator.
Waders
Since the winter of 1975/1976 in the UK, wintering numbers of waders have now increased substantially. The indices for avocet and black-tailed godwit showed the strongest increases and avocet is only included in the indicator since 1989/1990. Golden plover, grey plover and sanderling also show strong increases, more than doubling over the long-term period, although golden plover has declined by 14% in the most recent five-year period.
Species of concern in the more recent period are the curlew and lapwing, both of which have declined since the winter of 2018/2019.
The figures for England are very similar over both the long- and short-term, with small differences in some species trends.
Figure 7.4: Most wintering wader populations have increased substantially since 1975/1976, although recent changes vary between species
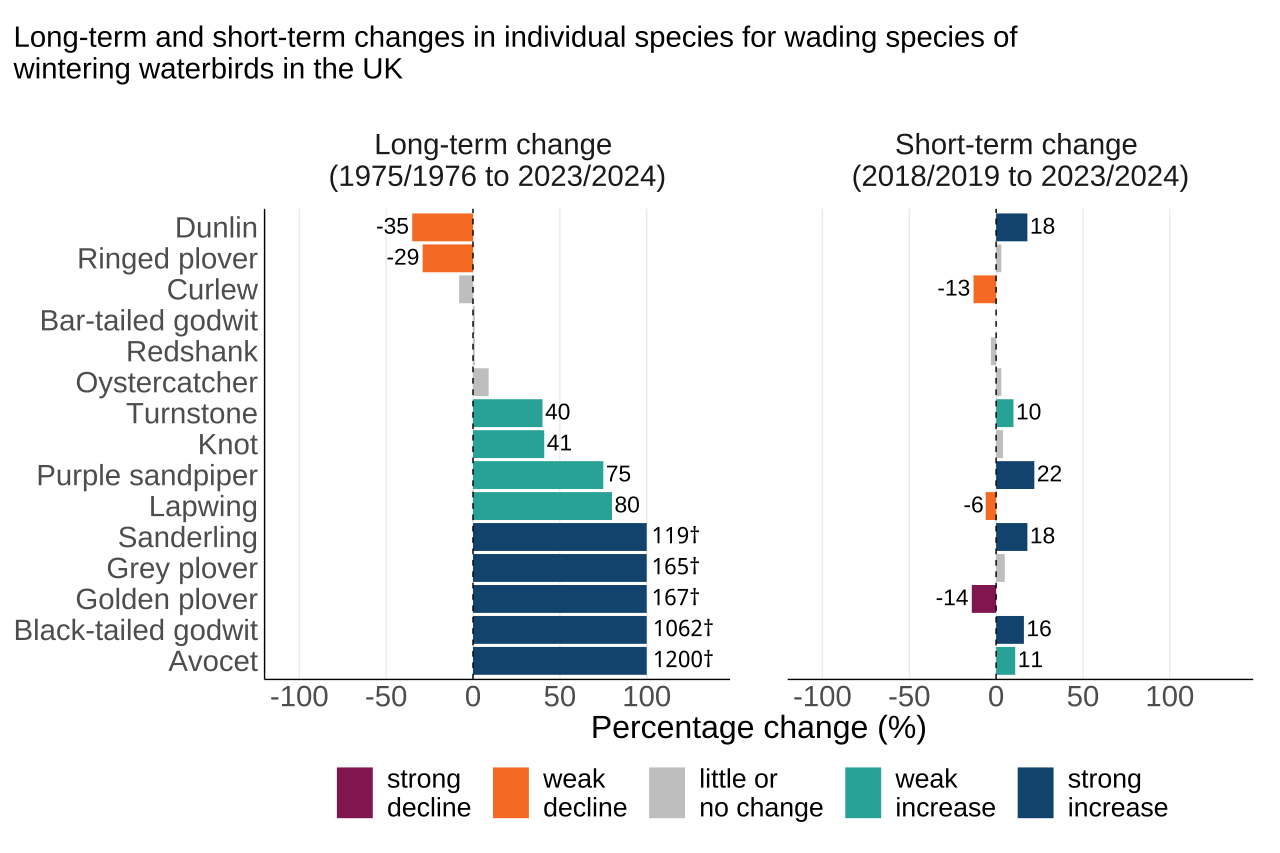
Source: British Trust for Ornithology (BTO), Royal Society for the Protection of Birds (RSPB), and the Joint Nature Conservation Committee (JNCC).
Notes for Figure 7.4:
- Figure 7.4 shows the individual population changes of 15 wader species in the UK.
- Only those species whose average rate of change placed them outside of the ‘little or no change’ category are labelled with their percentage change.
- For visualisation purposes the axis has been truncated to between -100% and +100%. For species that exceed these limits, the exact percentage change is labelled next to the bars and marked with a † symbol.
- Change estimates for species are assessed to the penultimate year. The short-term, five-year change for species spans 2018/2019 to 2023/2024.
- Long-term trends are based on total population change across the full time series. Data for some species start after 1975/76 and so for these species the long-term change represents a shorter time period.
- Short-term trends are based upon mean annual change in the most recent five-year period.
- In both cases thresholds derived from the Birds of Conservation Concern status assessment are applied.
Wildfowl
For wildfowl there are many more species strongly increasing since the winter of 1975/1976, with the strongest increases experienced by British/Irish greylag goose (over a 30-fold increase), gadwall and Svalbard light-bellied Brent goose (both over a 10-fold increase) and whooper swan (around a 10-fold increase). The short-term period since the winter of 2018/2019 shows a much more mixed picture.
Since the winter of 1975/1976, decreases were observed for Bewick’s swan, scaup, European white-fronted goose and pochard in the UK. These decreases have continued in the short-term period and remain classified as strong decrease.
Although the Icelandic greylag goose population has not declined enough over the long term to be classified as declining, it has decreased by 19% over the short term. A similar pattern can be seen in England for the great crested grebe.
In general, similar trends are observed in England. However, several species have shown strongly positive recent trends. Eider populations, which had previously been declining, have increased by 14% since the winter of 2018/2019.
Figure 7.5: Many wintering wildfowl populations have increased substantially since 1975/1976, but recent declines are widespread
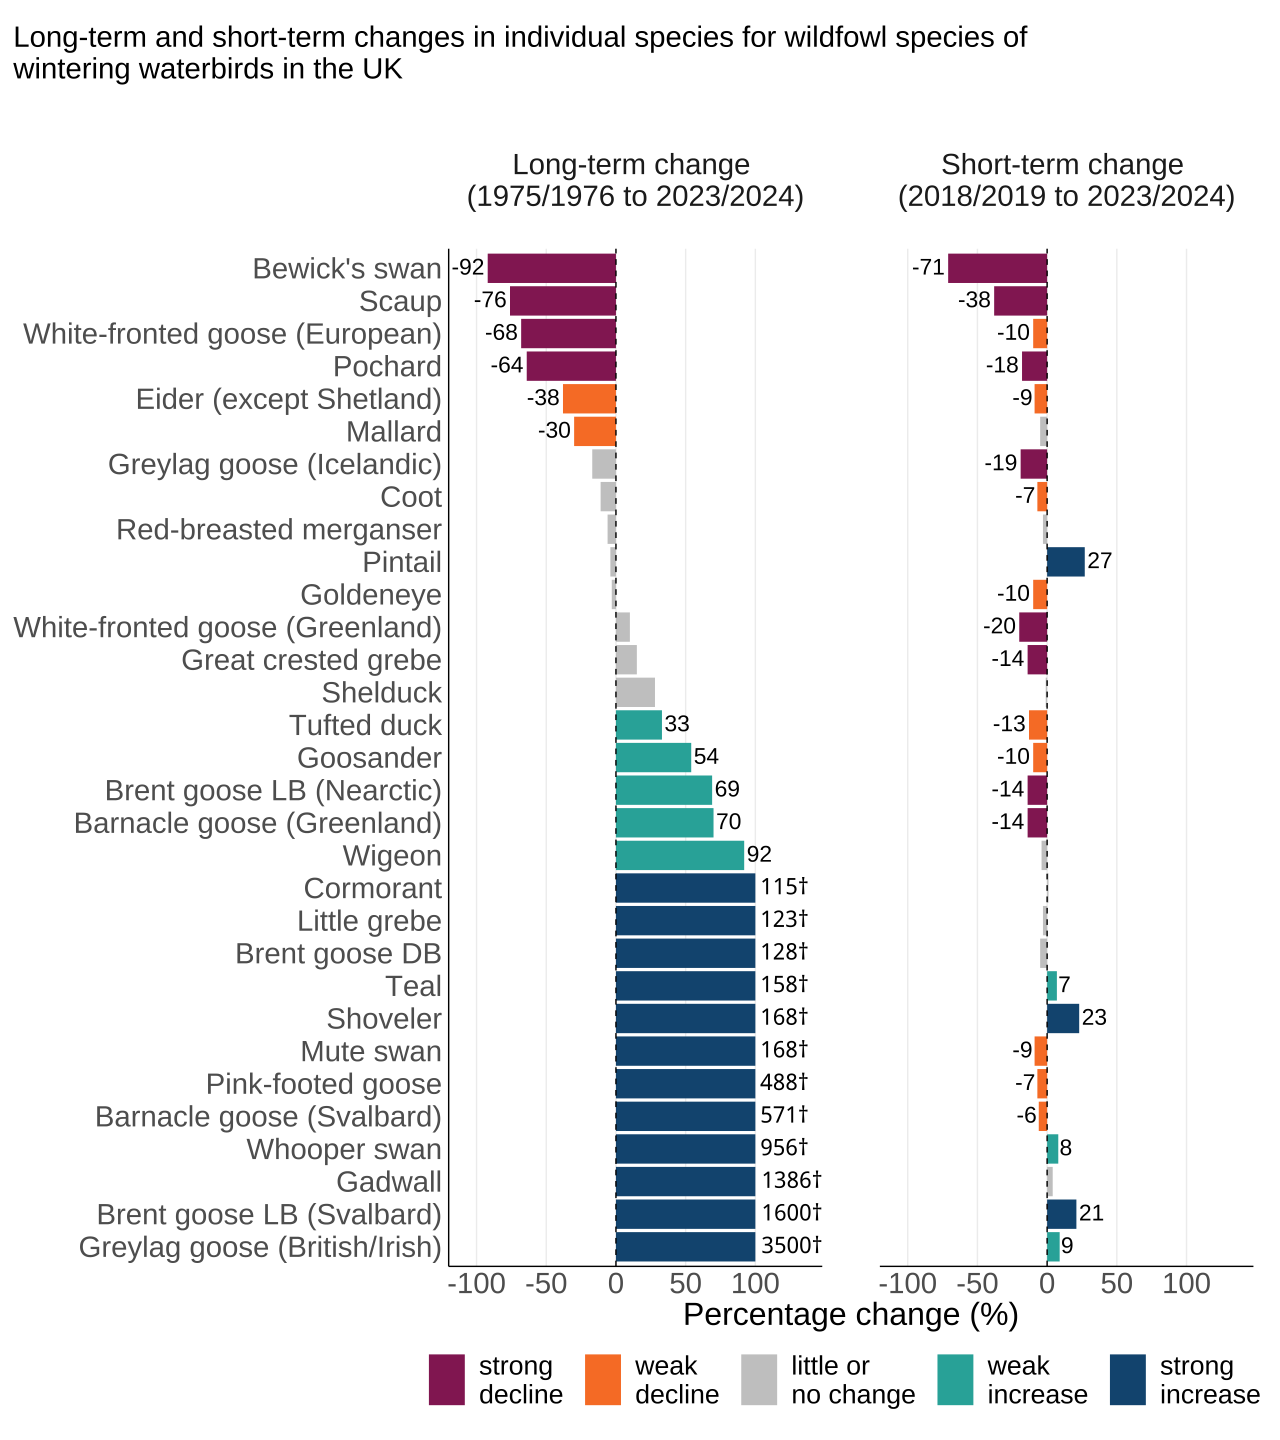
Source: British Trust for Ornithology (BTO), Royal Society for the Protection of Birds (RSPB), and the Joint Nature Conservation Committee (JNCC).
Notes for Figure 7.5:
- Figure 7.5 shows the individual population trends of 31 wildfowl species or races in the UK.
- Some species names have been shortened for this plot: LB is light-bellied, DB is dark-bellied. Regions have been included in brackets to describe the origin of any sub-populations of species.
- Only those species whose average rate of change placed them outside of the ‘little or no change’ category are labelled with their percentage change.
- For visualisation purposes the axis has been truncated to between -100% and +100%. For species that exceed these limits, the exact percentage change is labelled next to the bars and marked with a † symbol.
- Change estimates for species are assessed to the penultimate year. The short-term, five-year change for species spans 2018/2019 to 2023/2024.
- Long-term trends are based on total population change across the full time series. Data for some species start after 1975/76 and so for these species the long-term change represents a shorter time period.
- Short-term trends are based upon mean annual change in the most recent five-year period.
- In both cases thresholds derived from the Birds of Conservation Concern status assessment are applied.
Factors affecting wintering waterbird populations
Populations of wintering wetland birds are affected by a range of factors including conditions in the high latitude countries where they breed, with breeding productivity increasing for species including black-tailed godwit but decreasing for others such as Greenland white-fronted geese. There is good evidence of a strong climate change impact on the indicator in recent years, with milder winters leading to the wintering ranges of many species, including mallard, pintail, goldeneye, pochard, Bewick’s swan, ringed plover, curlew and bar-tailed godwit, increasingly shifting away from the UK. In addition, local changes, such as wetland creation and changes in agricultural management, have had an impact on waterbird populations within the UK.
Like seabirds, wintering waterbirds have been impacted by the Highly Pathogenic Avian Influenza (HPAI) outbreak. In winter 2021/22, around one third of Svalbard barnacle geese died in the Solway Firth in Scotland. The following winter, thousands of Greenland barnacle geese died on Islay in Scotland, and there have been reports of significant mortality in pink-footed and greylag geese and in mute swan. It remains to be seen whether HPAI has longer term impacts on wintering populations of ducks, swans or geese.
For more information about the evidence for this indicator, see the evidence statement Annex 1.07 Evidence Statement for C5e Wintering Waterbirds. More information about individual species is available at BirdFacts.
Main notes: methodological detail, caveats and limitations, important changes in this year’s publication and further information
Important changes in this year’s publication
Changes between annual publications should not automatically be interpreted as evidence of a new change in bird populations. Differences can arise from the addition of a year of data, retrospective revisions to species indices, changes in species coverage or changes to the analytical method. The comparisons in this section separate these effects where possible and identify where current results are not directly comparable with those published previously.
Table 8.1: Summary of important changes in the 2026 publication. More detail of each of these changes is provided below.
| Change | Reason | Impact on the publication |
|---|---|---|
| Removal of habitat sub-indicators | Several habitat sub-indicators had very small sample sizes and therefore provided limited interpretability and a risk of misinterpretation | Removal of six habitat sub-indicators from water and wetland birds, seabirds and upland birds chapters |
| Revisions to the overall breeding bird indicators for the UK and England | To correct the treatment of species time series and duplicate trends, incorporate revised species trends and start dates, and add species where suitable trend data are now available. | The shapes of the UK and England indicators differ from those published in 2025. The final estimate for the updated England indicator is notably higher than last year's index. The UK indicator also contains 132 species rather than 130. Figure 8.1 compares the complete previous and revised series. |
| Revised calculation of long-term trends for individual species | To calculate change consistently across each species' full available time series to the penultimate year. | Some species have a different long-term trend classification. Figures 8.2 to 8.4 and Table 8.2 compare the classifications produced by the previous and revised methods using the same data. |
| Revised seabird trend methodology | The Seabird Monitoring Programme revised its method for estimating species trends and associated confidence intervals. | The revised series is not directly comparable with that published previously. The effect varies by species, Figure 8.5 compares the previous and revised series. |
Source: British Trust for Ornithology (BTO), Royal Society for the Protection of Birds (RSPB) and Joint Nature Conservation Committee (JNCC).
Removal of six habitat sub-indicators
Habitat sub-indicators with very small sample sizes provide limited interpretability and risk misinterpretation by users. Therefore six habitat sub-indicators were removed, including: three sub-indicators from wetland and waterbirds (birds of fast flowing water, birds of reedbeds, and birds of slow flowing and standing water); one from upland birds (riparian); and two from seabirds (sub-surface feeders and surface feeders). The broader wetland and waterbird, upland bird and seabird indicators remain in the publication.
We are keen to hear from users that may be impacted by the removal of the sub-indicators from the Wild bird publication indicator suite, please email us.
Revisions to the overall breeding bird indicators for the UK and England
The UK breeding bird indicator includes 132 species in this publication, compared with 130 species in the previous publication. The England indicator continues to include 118 species. However, the addition of two UK species is one of several differences between the indicators published in 2025 and 2026.
The analytical pipeline used to produce the overall breeding bird indicators has been corrected, as previously some species time series were not truncated before smoothing. The previous treatment was not consistent with that used for the farmland and woodland indicators and had a disproportionate effect on the early years of some species trends which were used for the breeding bird indicator.
Duplicate wetland trends that were included in the 2024 and 2025 overall breeding bird indicators in error have also been removed. In particular, the riverine trend for yellow wagtail, derived from the Waterways Bird Survey and Waterways Breeding Bird Survey, has been removed. This trend declined to around 5% of its baseline value by the late 1990s and then remained broadly stable. The breeding bird indicator now includes only the wider-countryside trend for yellow wagtail, as this covers a larger proportion of the population derived from the Common Birds Census and Breeding Bird Survey, which shows a less marked decline.
Other differences arise from revisions to the upstream data sources, specifically, the Seabird Monitoring Programme trends and changes to the format of the Rare Breeding Birds Panel data and therefore the years which some species enter the indicator. These appear to have had a smaller overall effect. For example, bearded tit now enters the indicator later and therefore no longer contributes to the higher values in the early years to the same extent.
Figure 8.1 compares the indicators published in 2025 and 2026 to illustrate the combined impact of these changes, revisions and the inclusion of new data.
Figure 8.1: Breeding bird indicators in the 2025 and 2026 publications
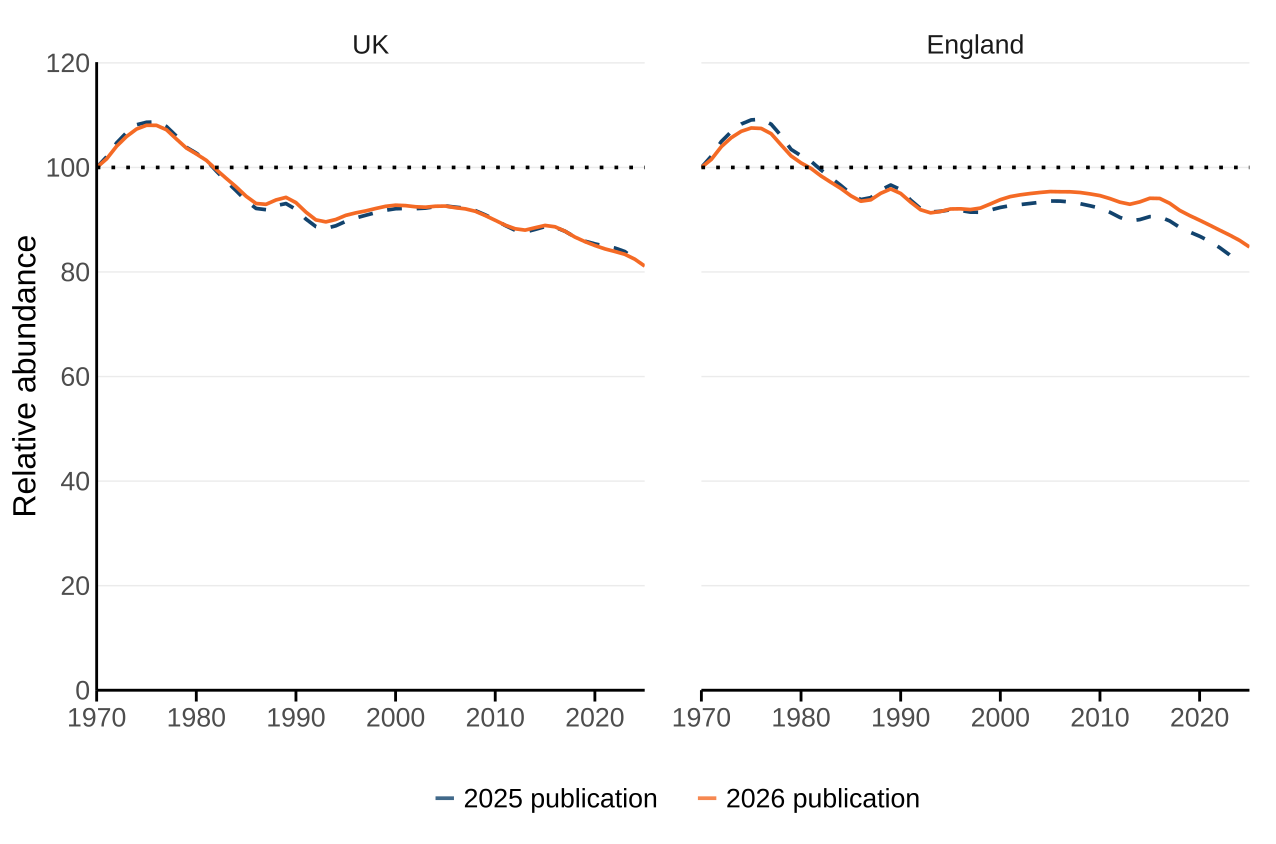
Source: British Trust for Ornithology (BTO), Royal Society for the Protection of Birds (RSPB) and Joint Nature Conservation Committee (JNCC).
Notes for Figure 8.1:
- The figure compares the overall breeding bird indicators published in 2025 and 2026.
- Differences between the series reflect retrospective revisions including, the correction to the treatment of species time series before smoothing, the removal of duplicate wetland trends, revised species trends and start dates, changes in species coverage, an additional year of data.
Revised calculation of long-term trends for individual species
This publication introduces a revised approach for assessing long-term trends in individual species. Short-term trends continue to be based on the mean annual rate of change over the most recent five-year period. Previously, long-term and short-term trends were assessed using the mean annual rate of change over each species’ available time series. Species were assigned to trend categories by comparing this annual rate with thresholds equivalent to changes of -50%, -25%, +33% and +100% over a 25-year period (see Table 8.1 in the technical paper).
Under the revised method, the long-term trend is calculated directly as the total percentage change in the species index across its full available time series, from the first year for which data are available to the penultimate year. This total percentage change is then compared directly with the corresponding thresholds of -50%, -25%, +33% and +100% to assign the species to a trend category.
Most species have time series extending beyond 25 years, with many exceeding 40 years. The revised method therefore allows the long-term assessment to reflect the total change over each species’ full available time series, rather than assessing this change against thresholds based on a 25-year period.
The change in method can alter the long-term trend category assigned to a species, but it does not alter the underlying annual species index. Figure 8.2 shows that the revised method has changed the long-term trend classification of 59 of the 132 UK species (45%) assessed under both methods. Figure 8.3 shows the direction of these changes.
Figure 8.2: The revised method changes the distribution of long-term trend classifications for some UK bird species
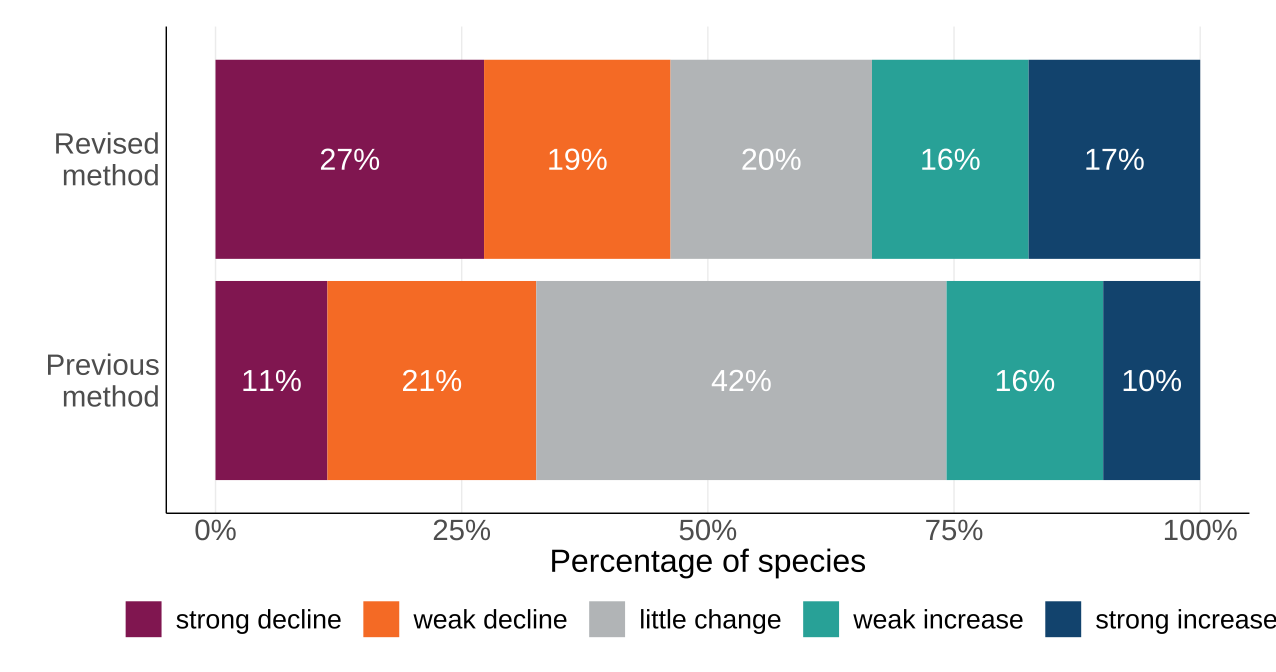
Source: British Trust for Ornithology (BTO), Royal Society for the Protection of Birds (RSPB) and Joint Nature Conservation Committee (JNCC).
Notes for Figure 8.2:
- The comparison applies the previous and revised long-term classification methods to the same species data used in the 2026 publication.
- Percentages are based on UK species in the breeding bird index with a long-term assessment available under both methods.
- Percentages may not sum to 100 because of rounding.
Of the 132 species compared, 73 retained the same long-term classification under the revised method. Of the 59 species whose classification changed, all 59 moved by only one category and none moved by more than one category. Overall, 20 species moved to a more positive classification and 39 moved to a more negative classification. Most species therefore retained the same classification. Where classifications changed, all changes were between adjacent categories and towards a classification of stronger change.
Figure 8.3: Most species retain the same long-term trend classification under the revised method
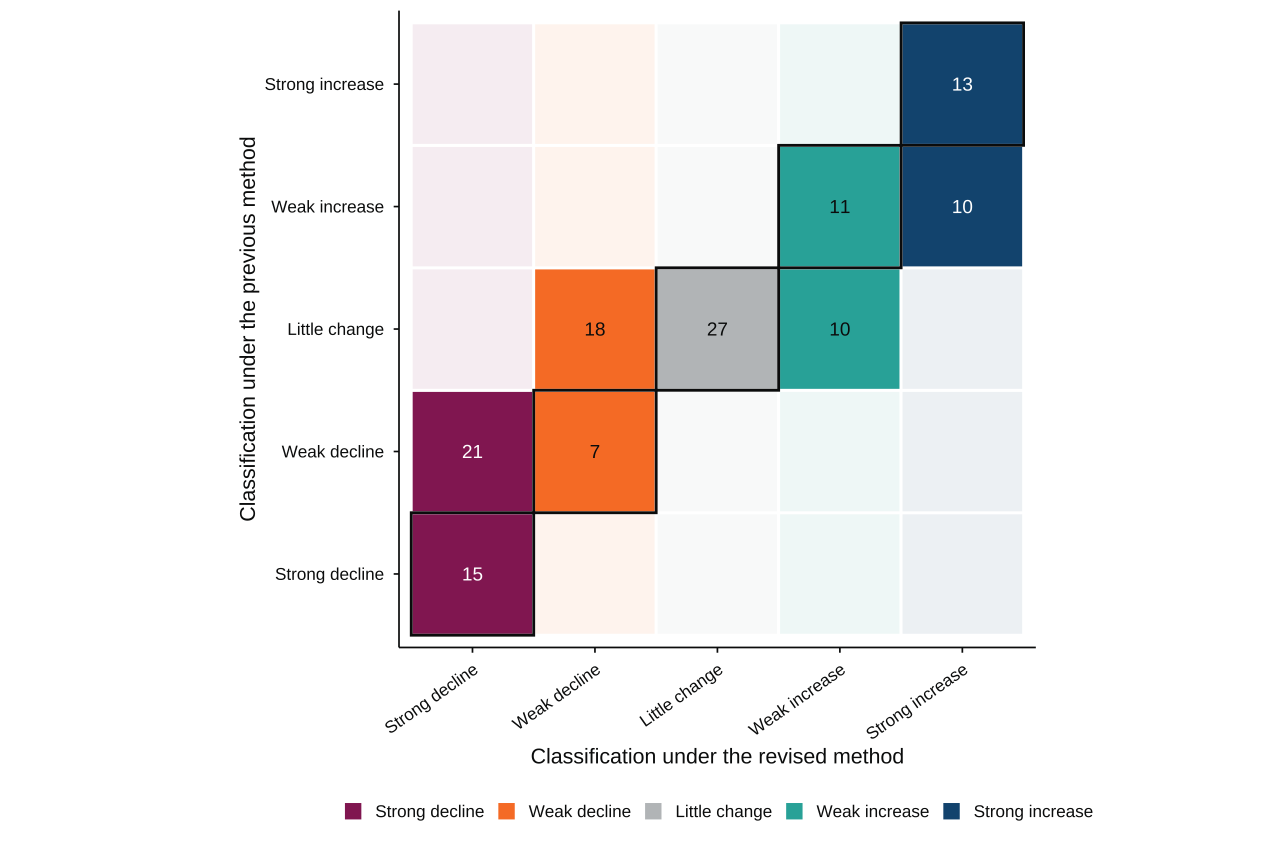
Source: British Trust for Ornithology (BTO), Royal Society for the Protection of Birds (RSPB) and Joint Nature Conservation Committee (JNCC).
Notes for Figure 8.3:
- The comparison applies the previous and revised classification methods to the same species data used in the 2026 publication.
- Each cell shows the number of species classified in the corresponding categories under the two methods.
- Cell colours represent the classification under the revised method and correspond to the colours used in Figure 8.2.
- Cells on the diagonal represent species whose classification did not change.
- Cells outside the diagonal represent species whose classification changed.
- The comparison covers UK species in the breeding bird index with a long-term assessment available under both methods.
The revised method provides a more direct summary of the total percentage change observed over each species’ available time series. Figure 8.4 below compares the total percentage change for each species over their respective long-term trend period with the classification assigned by each method.
Table 8.2 shows whether changes in classification are associated with the length of the available time series. This checks whether differing start years materially affect the comparison. It should be considered alongside Figure 8.5 because time-series length is unevenly distributed across species.
Figure 8.4: Total percentage change is more directly reflected in classifications under the revised method
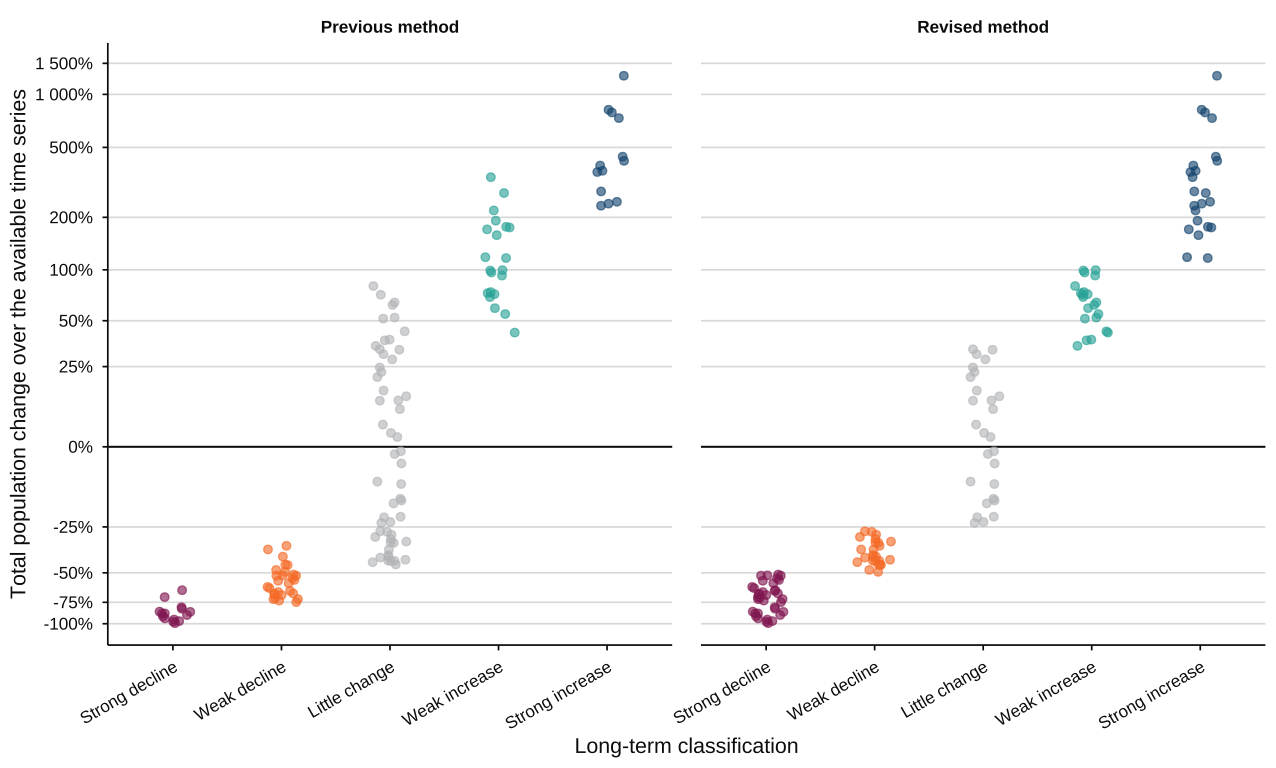
Source: British Trust for Ornithology (BTO), Royal Society for the Protection of Birds (RSPB) and Joint Nature Conservation Committee (JNCC).
Notes for Figure 8.4:
- Each point represents one UK species with a long-term assessment available under both methods.
- The same total percentage change is plotted against the category assigned by the previous and revised methods.
- Total percentage change is calculated across each species’ available time series to the penultimate year.
- The vertical scale uses a pseudo-logarithmic transformation so that large increases and declines can be shown in the same figure. Values remain expressed as percentages.
Table 8.2: Changes in classification by length of the available species time series
| Length of species time series | Number of species | Number whose classification changed | Percentage whose classification changed |
|---|---|---|---|
| 25 years or less | 7 | 0 | 0% |
| 26 to 35 years | 23 | 3 | 13% |
| 36 to 45 years | 7 | 3 | 43% |
| More than 45 years | 95 | 53 | 56% |
Notes for Table 8.2:
- Time-series length is calculated from the start year to the end year, inclusive.
- The comparison applies the previous and revised long-term classification methods to the same UK species data.
Revised seabird trend methodology
The seabird indicators use data from the Seabird Monitoring Programme. Trend analyses prior to 2026 used a chain index method developed by Thomas (1993), which imputed missing counts at any SMP site based on the mean of the observed counts at that site weighted by corresponding year-to-year comparisons with other sites. This method did not allow for the construction of confidence intervals around annual indices. For the forthcoming SMP report the Thomas method was replaced by a model-based approach to trend calculation to better accommodate the high level of sparsity in the SMP data. The new approach has been applied retrospectively, so values across the series can differ from those published previously. The forthcoming report will be published on the SMP website.
Gannet has been removed from the England indicator, to make the indicator more comparable to the UK seabird indicator. Unlike most seabird species, Gannet had experienced strong population growth in all UK regions prior to recent HPAI outbreaks. The Gannet trend therefore had a strong effect on the England indicator, but this was not reflected in the UK indicator despite similar population dynamics, because of data unavailability for Gannet trends outside of England. The current indicators contain 13 species for the UK and 10 for England.
Figure 8.5 shows that the revisions have changed the shape and magnitude of the indicator trend lines, but not the overall downward trajectory. For both the UK and England, the revised indicators show a greater decline and have a lower final estimate than under the previous method.
Figure 8.5: The revised indicators show a greater decline and have a lower final estimate than under the previous method
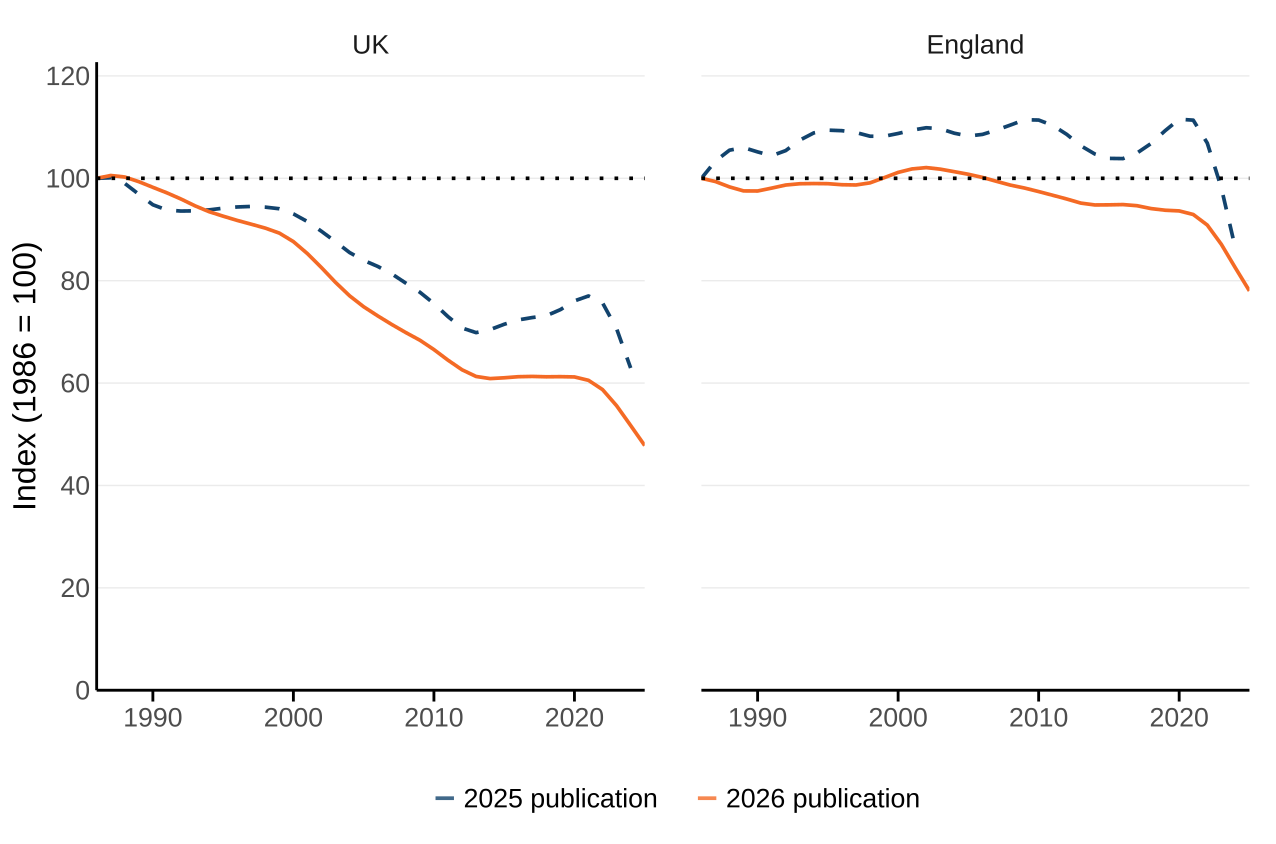
Notes for Figure 8.5:
- The figure compares the two published series and therefore includes updated data and retrospective revisions.
- The revised seabird method has been applied retrospectively, so differences can occur throughout the series.
- For England, the comparison also reflects the removal of gannet from the current indicator.
Methodological detail
Data sources
The bird population indices have been compiled with the British Trust for Ornithology (BTO), the Joint Nature Conservation Committee (JNCC) and the Royal Society for the Protection of Birds (RSPB). The principal data sources are:
- the Common Birds Census (1966 to 2000)
- the BTO/JNCC/RSPB Breeding Bird Survey (1994 to 2025)
- the BTO Waterways Bird Survey (1974 to 2007)
- the BTO/JNCC/RSPB Waterways Breeding Bird Survey, with support from the Environment Agency (1998 to 2025)
- the BTO/RSPB/JNCC Wetland Bird Survey counts (1975/1976 to 2024/25)
- the BTO/JNCC/NatureScot Goose & Swan Monitoring Programme
- the BTO/JNCC/RSPB Seabird Monitoring Programme (1986 to 2025)
- periodic seabird censuses supplied by JNCC, RSPB, the Seabird Group, SOTEAG (Shetland Oil Terminal Environmental Advisory Group) and other partners
- monitoring of scarce and rare breeding birds through the Statutory Conservation Agency and RSPB Annual Breeding Bird Scheme (SCARABBS) and the Rare Breeding Birds Panel (1970 to 2025).
For species informed by periodic censuses, the census results provide an estimate of the average annual rate of change between censuses. This rate is assumed to apply to each intervening year.
Construction of the indicators
The indices cover birds that are native to the UK, excluding rare (less than 500 breeding pairs, or 300 in England) and introduced species. The indices portray the annual changes in abundance. Within the indices, each species is given equal weighting, and the overall index is the geometric mean of the individual species trends. Individual species populations within the index may be increasing or decreasing, irrespective of the overall index. Species trends are derived by modelling count data and estimates are revised when new data or improved methodologies are developed and applied retrospectively to earlier years.
The individual species included within each indicator are given in the relevant data sets published alongside this update for a list of birds in each group.
Smoothing is a standard procedure in the generation and reporting of bird population trends. The smoothing methodology involves the application of a thin plate smoothing spline to remove the short-term peaks and troughs due to weather effects and any between year sampling error. Research by the BTO and RSPB further developed this procedure to enable the production of an indicator based on smoothed individual species’ trends.
Bootstrapping over sampling locations, a standard statistical technique, is used to calculate 95% confidence intervals for most terrestrial species in the indicators and in change over any specified period. The width of the confidence interval for a given indicator is influenced by the number of species in that indicator and the precision of the individual species trends that make up that indicator. The precision of trends varies between species; this is true even for species for which trends come from the same source, due to the variation in sample size. Therefore, the size of confidence intervals varies among habitat indicators.
For species where the annual results are published up to two years after the year of data collection (for example, species with data from the Rare Birds Breeding Panel), we apply a short extrapolation based on the most recent trend period to allow these species to be included in the indicators.
For more information on the indicator methodology, please see the Technical Background document associated with this release
Further information
More information about individual species trends, including photographs and background on population change, is available from the BTO website. The Breeding Bird Survey also provides regional analyses, including analyses for other constituent countries of the UK.
Further information is available from:
- the Rare Breeding Birds Panel, which provides information on monitoring and annual reports for scarce and rare breeding birds
- the BTO research report Production of smoothed population trends when a key year of data is missing, which explains how a smoothed trend is produced when a year of data is missing
- the BTO research report Development of an Upland Bird Indicator for the UK and for England
Caveats and limitations
The indicators summarise average change across selected species. They do not represent every species or population. An individual species trend may increase or decrease irrespective of the direction of the composite indicator.
The indicators are considered reliable measures of medium-term and long-term trends. Strong reliance should not be placed on changes from one year to the next. Short-term estimates are more affected by annual variation, sampling error and revisions near the end of a smoothed series.
Species composition, baseline years and data availability differ between indicators. These differences should be considered when comparing the UK and England indicators or different habitat groups.
The width of confidence intervals differs between indicators because the number of species and the precision of the constituent species trends vary. The Wetland Bird Survey design does not currently allow confidence intervals to be calculated reliably for wintering waterbird indicators, so formal tests are not applied to those indicators.
The seabird indicator includes only species with sufficiently robust and representative trends, rather than all breeding seabirds. Coverage differs between colonies and years. Data collection was affected by the COVID-19 pandemic, and the short-term assessment may not yet capture the full effects of Highly Pathogenic Avian Influenza since 2020.
Although 20 species were originally selected for the farmland bird index, a reliable annual index is not available for barn owl and is therefore excluded from the index.
Development plan
Future developments to be implemented over the coming years are:
- Review the species to be included in all measures and incorporate any additional species where data availability allows. This includes considering species lists for each habitat breakdown, balancing the latest available data with the consistency of the indicator.
- Consider alternative methods for assessing change at the species level. This includes considering the time period over which long and short term assessments are carried out, as well as the current Birds of Conservation Concern thresholds for individual species trends.
Feedback and User Engagement
In line with Defra’s User Engagement for Statistics Policy Statement and the Code of Practice for Statistics, we are committed to ensuring that our statistics are of value and meet user needs and welcome any feedback or suggestions regarding this publication.
To provide feedback, you can email us at: biodiversity.statistics@defra.gov.uk
You can also register as a user of the biodiversity and wildlife statistics publications. Registering as a user means we will be able to contact you regarding any user engagement activities that we may run, such as seeking feedback on proposed changes.