Adult substance misuse treatment statistics 2021 to 2022: report
Updated 4 October 2023
Applies to England

© Crown copyright 2023
This publication is licensed under the terms of the Open Government Licence v3.0 except where otherwise stated. To view this licence, visit nationalarchives.gov.uk/doc/open-government-licence/version/3 or write to the Information Policy Team, The National Archives, Kew, London TW9 4DU, or email: psi@nationalarchives.gov.uk.
Where we have identified any third party copyright information you will need to obtain permission from the copyright holders concerned.
This publication is available at https://www.gov.uk/government/statistics/substance-misuse-treatment-for-adults-statistics-2021-to-2022/adult-substance-misuse-treatment-statistics-2021-to-2022-report
1. Summary
1.1 Trends in treatment numbers
There were 289,215 adults in contact with drug and alcohol services between April 2021 and March 2022. This is a rise compared to the previous year (275,896).
The number of adults entering treatment in 2021 to 2022 was 133,704, which is similar to the previous 2 years’ figures (130,490 and 132,124). The numbers of people entering treatment continues to be relatively stable after falling steadily since 2013 to 2014.
1.2 Trends in substance use treatment
The number of people in treatment for opiate use was very similar to last year (going down slightly from 140,863 to 140,558). Nearly half (49%) the adults in treatment were there for problems with opiates, and this remains the largest substance group. Section 2.1 has more information about what the different substance groups are.
People in treatment for alcohol alone make up the next largest group (29%) of all adults in treatment. The number of those rose by 10% from the previous year (from 76,740 to 84,697) but this increase comes after a decline from a peak of 91,651 in 2013 to 2014.
There were increases in the other 2 substance groups (a 7% increase in the non-opiate group and 12% in the non-opiate and alcohol group). This follows a similar small rise last year.
Following the pattern of last year, there has been a fall in the overall number of adults entering treatment for crack cocaine. This fall only includes people who are using crack with opiates (21,308 to 18,832). Those who are using crack without opiates saw a small increase (4,545 to 4,711).
The number of people entering treatment for crack is now at the lowest level since 2015 to 2016.
People starting treatment in 2021 to 2022 with powder cocaine problems increased by 11% (from 19,209 to 21,298). This is close to the peak number of 21,396 in 2019 to 2020.
New entrants to treatment for cannabis problems increased again this year, which saw a 4% rise (from 27,304 in 2020 to 2021 to 28,263 this year). New entrants with benzodiazepine problems fell 11% (from 4,321 in 2020 to 2021 to 3,848 this year), after increasing every year since 2018 to 2019.
Although the numbers are relatively low, there was an increase in adults entering treatment in 2021 to 2022 with ketamine problems (from 1,444 in 2020 to 2021 to 1,551 this year). This is part of a trend in rising numbers entering treatment over the last 8 years. The total is now 3.5 times higher than it was in 2014 to 2015.
1.3 Housing and mental ill health
One-sixth (16%, or 20,812) of adults entering treatment last year said they had a housing problem. This proportion varied by substance group, ranging from 9% (5,031) of those starting treatment for alcohol problems alone to almost a third (29%, or 9,435) of those starting treatment for problems with opiate use. As in previous years, people starting treatment for problems with new psychoactive substances (NPS) had the highest proportion of housing need of any substance group (42%).
Over two-thirds (70%, or 93,380) of adults starting treatment said they had a mental health treatment need. This is part of a trend of rising numbers over the previous 3 years (from 53% in 2018 to 2019). Two-thirds of new starters in all substance groups needed mental health treatment. This need ranged from 66% in the opiate group to over three-quarters (76%) of the non-opiates and alcohol group.
1.4 Treatment exits and deaths in treatment
There were 126,118 people who exited the drug and alcohol treatment system in 2021 to 2022. Nearly half (49%) of those left having successfully completed their treatment, free from dependence. This is similar to the proportion of people who successfully completed treatment in the previous year (from 50% to 49%).
The total number of people who died while in contact with treatment services in 2021 to 2022 was 3,742 (1.3% of all adults in treatment). This represents a 0.4% increase of deaths in treatment compared to last year (3,726, or 1.4% of all adults in treatment).
Last year, all substance groups saw an increase in deaths in treatment compared to the previous year. By contrast, the proportion of people dying in treatment this year increased only in the non-opiate only group (17%) and the opiate group (1%).
1.5 Smoking among people in treatment
Nearly 46,000 people (53%) said they had smoked tobacco in the 28 days before starting treatment. Across all substance groups, the level of smoking for men and women was substantially higher than the smoking rate of the general adult population in England, which was 15.8% for men and 12.1% for women.
Despite the high levels of smoking, only 4% of people were recorded as having been offered referrals for smoking cessation interventions. However, this is an increase from 2% in 2020 to 2021.
1.6 The effect of the coronavirus pandemic
The coronavirus (COVID-19) pandemic has had a lingering effect on drug and alcohol treatment services, as it has other services. In 2020 to 2021, most services had to restrict face-to-face contact, which affected the types of interventions that service users received. This, and other changes to service provision during the pandemic, may have affected the data in last year’s report.
COVID-19 related restrictions were still in place in early April 2021, but these began to be gradually relaxed until almost all restrictions were lifted in July 2021. However, COVID-19 had a continued effect on services throughout 2021 to 2022. Effects included:
- service users testing positive for COVID-19 and not being able to access treatment
- staff testing positive and not being able to go to work
- service users and staff getting ill with COVID-19
- the above and other factors causing longer waits and reduced access to healthcare
So, like 2020 to 2021, the restrictions and COVID-19 itself might have affected the data in this report.
2. People in treatment: substance, sex, age
2.1 Overview
The National Drug Treatment Monitoring System (NDTMS) statistics report presents information on adults (aged 18 and over) who were receiving help in England for problems with drugs and alcohol in the year between 1 April 2021 and 31 March 2022.
Many people experience difficulties with, and receive treatment for, both substances. While they often share many similarities, they also have clear differences, so this report divides people in treatment into 4 substance groups:
- Opiate: people who are dependent on or have problems with opiates, mainly heroin.
- Non-opiate: people who have problems with non-opiate drugs only, such as cannabis, crack and ecstasy.
- Non-opiate and alcohol: people who have problems with both non-opiate drugs and alcohol.
- Alcohol only: people who have problems with alcohol but do not have problems with any other substances.
Figure 1: how people are classified into substance reporting group
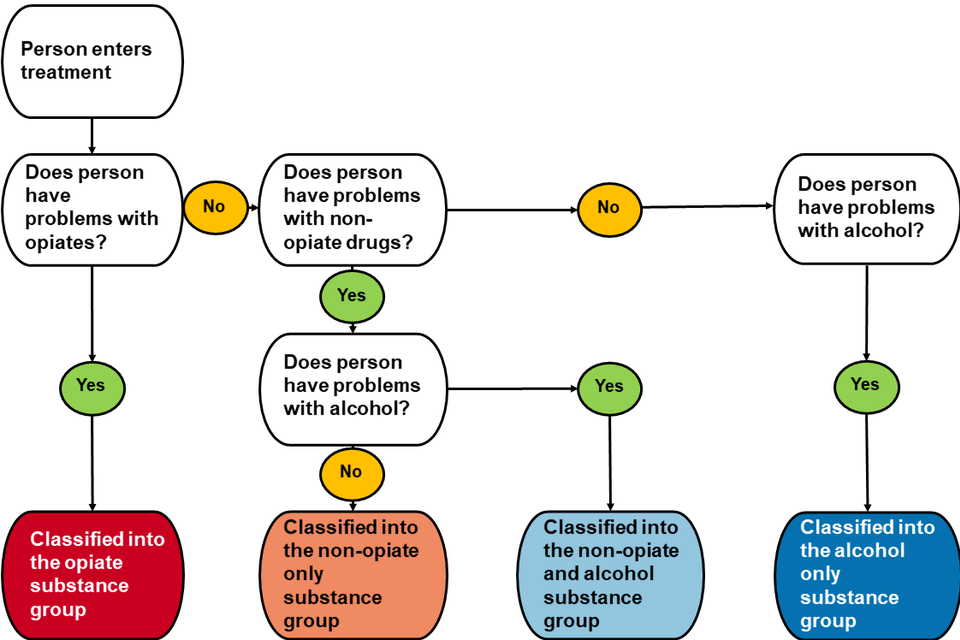
Figure 1 shows how people are classified into a substance reporting group after entering treatment and undergoing initial assessment.
People with an opiate problem are placed in the ‘opiate’ substance group regardless of whether other substances are also problematic. For all other individuals, they are categorised as ‘non-opiate only’, ‘non-opiate and alcohol’ or ‘alcohol only’.
Question 1: Does the person have problems with opiates?
Yes: person is classified into the opiate substance group.
No: go to question 2.
Question 2: Does the person have a problem with non-opiate drugs?
Yes: go to question 3.
No: go to question 4.
Question 3: Does the person have problems with alcohol?
Yes: person is classified into non-opiate and alcohol substance group.
No: person is classified into non-opiate only substance group.
Question 4: Does the person have problems with alcohol?
Yes: person is classified into alcohol only substance group.
2.2 Substance use, sex and age of people in treatment
Figure 2: breakdown of people in treatment by sex and substance group

| Substance group | Male | Female | Total |
|---|---|---|---|
| Opiate | 101,822 (72.4%) | 38,736 (27.6%) | 140,558 |
| Non-opiate only | 19,821 (67.0%) | 9,761 (33.0%) | 29,582 |
| Non-opiate and alcohol | 24,079 (70.0%) | 10,299 (30.0%) | 34,378 |
| Alcohol only | 49,358 (58.3%) | 35,339 (41.7%) | 84,697 |
| Total | 195,080 (67.5%) | 94,135 (32.5%) | 289,215 |
There were 289,215 people in contact with drug and alcohol services between 1 April 2021 and 31 March 2022.
Nearly half of all adults (49%) received treatment for problems with opiates. A further 22% had problems with other drugs, and over a quarter (29%) had problems with alcohol only. These proportions are similar to previous years and you can find more detailed information on trends in chapter 12 (Trends over time).
More than two-thirds of people in treatment were men and less than one-third were women (67% men to 33% women). This proportion varies greatly by substance group. For the drug groupings, men make up just over two-thirds (opiate 72%, non-opiate only 67%, non-opiate and alcohol 70%). But in the alcohol only group the divide is smaller with men making up 58% and women 42%.
2.3 Problem substances for people in treatment
Figure 3: substances by group for people in treatment (count of problem substances reported)
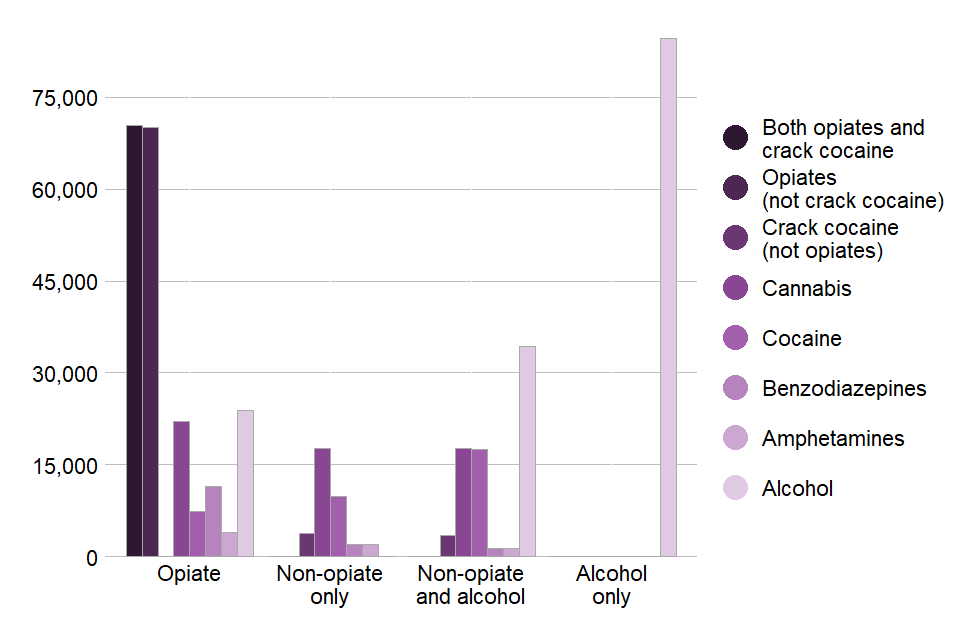
Figure 3 shows a breakdown of the substances reported by people in treatment in 2021 to 2022, split into the 4 treatment groups. Up to 3 substances can be recorded at the start of treatment, so one person could be counted for several substances in their substance group (for example, somebody who uses cocaine, cannabis and alcohol, would appear in the non-opiate and alcohol group for these 3 substances).
The numbers show that opiates were the most frequently reported drug with slightly more people using opiates alone compared to opiates along with crack. Out of all people in treatment, 51% said they had a problem with opiates, crack or both. Almost half (49%) of people said they had problems with alcohol, with most of these being in the alcohol only group. One-fifth (20%) said they used cannabis, most commonly in the opiate substance group. Cocaine was reported by 12% of people, the largest proportion of these being categorised into the non-opiate and alcohol substance group. The next most frequently reported substances were benzodiazepines at 5% and amphetamines (excluding ecstasy) at 3%.
You can find a more detailed breakdown of reported substances in the accompanying data tables.
2.4 Age groups
Figure 4: age of people in treatment
| Age group | Opiate | Non-opiate only | Non-opiate and alcohol | Alcohol only | Total |
|---|---|---|---|---|---|
| 18 | 98 | 810 | 696 | 181 | 1,785 |
| 19 | 156 | 820 | 570 | 271 | 1,817 |
| 20 to 24 | 1,895 | 5,348 | 3,819 | 2,354 | 13,416 |
| 25 to 29 | 6,164 | 5,889 | 5,150 | 4,733 | 21,936 |
| 30 to 34 | 15,109 | 5,777 | 6,694 | 8,524 | 36,104 |
| 35 to 39 | 24,905 | 4,165 | 5,977 | 10,891 | 45,938 |
| 40 to 44 | 31,370 | 2,866 | 4,298 | 11,673 | 50,207 |
| 45 to 49 | 26,310 | 1,810 | 3,125 | 12,323 | 43,568 |
| 50 to 54 | 18,706 | 1,104 | 2,312 | 12,354 | 34,476 |
| 55 to 59 | 9,990 | 617 | 1,159 | 9,959 | 21,725 |
| 60 to 64 | 3,878 | 219 | 415 | 6,260 | 10,772 |
| 65 to 69 | 1,457 | 94 | 117 | 3,102 | 4,770 |
| 70+ | 520 | 63 | 46 | 2,072 | 2,701 |
Figure 4 shows that the age of people in treatment has continued the trend from previous years showing an increase in older age groups. More than half of the people in treatment (58%) were over 40 years old (compared to 56% in 2020 to 2021 and 51% in 2016 to 2017), with:
- 50,207 people in the 40 to 44 age group
- 43,568 people in the 45 to 49 age group
- 34,476 people in the 50 to 54 age group
- 21,725 people in the 55 to 59 age group
- 18,243 people aged 60 and over
Less than 10% of people in treatment for opiates or alcohol only were under 30 (6% for opiates and 9% for alcohol only). Across all substance groups there were:
- 21,936 people in the 25 to 29 age group
- 13,416 people in the 20 to 24 age group
- 3,602 people aged 18 or 19
The median age of people in treatment in the 4 substance groups ranged from 46 for the alcohol only group to 31 for non-opiates only. People in treatment for opiates had a median age of 43. You can find a detailed breakdown of age statistics in the accompanying data tables.
A large proportion of opiate users in treatment will have started using heroin in the epidemics of the 1980s and 1990s and are now over 40 years old. In 2021 to 2022, 69% said they first used heroin before 2001 and only 9% first used heroin since 2011.
People who reported using substances other than opiates or alcohol tended to be younger. You can find more information about this in the Home Office’s Crime Survey for England and Wales.
3. People starting treatment: substances, age and referral source
3.1 Substances reported by people starting treatment
Figure 5: substances by group for people starting treatment in 2021 to 2022 (count of problem substances reported)
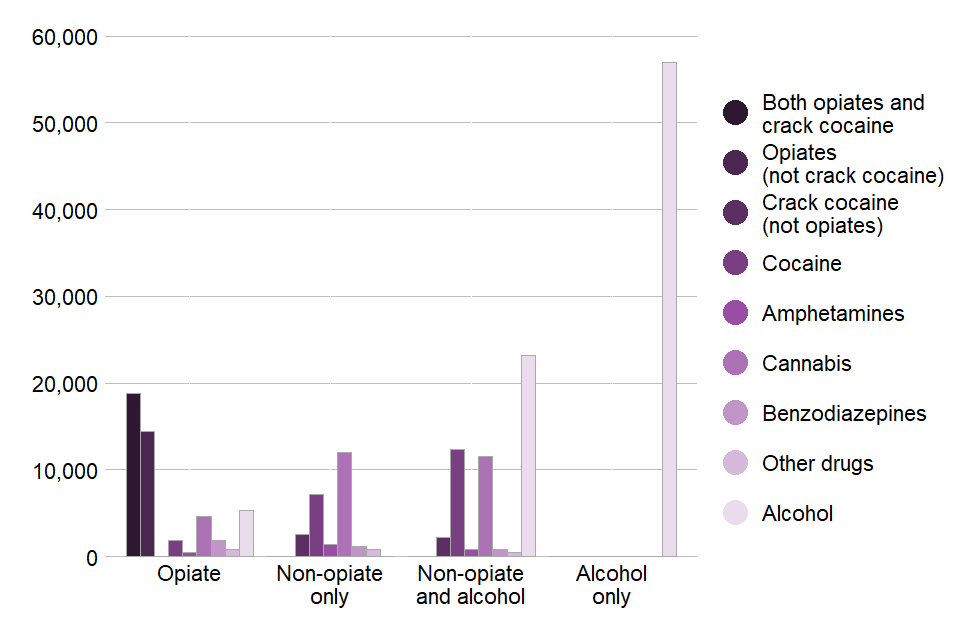
In 2021 to 2022, 133,704 people started treatment for drug and alcohol problems. This is where a person started a new treatment journey, either for the first time or returning to treatment having had a break of over 21 days.
Of the people starting treatment:
- 64% said they had a problem with alcohol
- 25% said they had a problem with opiates
- 18% said they had a problem with crack cocaine
- 21% said they had a problem with cannabis
- 16% said they had a problem with cocaine
Also, of the people who said they had a problem with alcohol, two-thirds (67%, or 56,995) said it was their only problem substance.
Figure 5 shows the number of people starting treatment who reported problems with each substance, divided into the 4 substance groups. Most people with alcohol problems were in the alcohol only group. However, alcohol was the third most frequently reported substance in the opiate group and 53% of people starting treatment in the remaining 2 groups reported alcohol as a problem substance.
In the non-opiate and alcohol group, cocaine was the second most frequently reported drug, followed closely by cannabis. Cannabis was the most frequently reported drug in the non-opiate substance group, followed by cocaine. The numbers show that most people in the opiates group used both opiates and crack. Opiates without crack was the second most commonly reported substance in this group.
People starting treatment with cannabis problems increased again this year, with a 4% increase (from 27,304 in 2020 to 2021 to 28,263 this year). New entrants with benzodiazepine problems fell 11% (from 4,321 in 2020 to 2021 to 3,848 this year), after increasing every year since 2018 to 2019.
Although the numbers are relatively low, there was a small increase in adults entering treatment in 2021 to 2022 with ketamine problems (from 1,444 in 2020 to 2021 to 1,551 this year). There was also a small rise in methamphetamine treatment numbers this year (from 505 last year to 558), which has been increasing gradually since reporting began in 2005 to 2006.
You can find more information on the breakdown of club drugs by substance group in the accompanying data tables.
3.2 Age of people starting treatment
Figure 6: people starting treatment by age
| Age group | Opiate | Non-opiate only | Non-opiate and alcohol | Alcohol only | Total |
|---|---|---|---|---|---|
| 18 to 19 | 151 | 1,049 | 824 | 343 | 2,367 |
| 20 to 24 | 949 | 3,743 | 2,737 | 1,685 | 9,114 |
| 25 to 29 | 2,597 | 4,109 | 3,581 | 3,368 | 13,655 |
| 30 to 34 | 5,345 | 4,040 | 4,653 | 5,911 | 19,949 |
| 35 to 39 | 6,895 | 2,876 | 4,052 | 7,363 | 21,186 |
| 40 to 44 | 7,073 | 1,911 | 2,840 | 7,822 | 19,646 |
| 45 to 49 | 4,895 | 1,198 | 2,034 | 8,040 | 16,167 |
| 50 to 54 | 3,082 | 719 | 1,446 | 8,167 | 13,414 |
| 55 to 59 | 1,459 | 399 | 709 | 6,520 | 9,087 |
| 60 to 64 | 509 | 137 | 262 | 4,233 | 5,141 |
| 65+ | 258 | 81 | 96 | 3,543 | 3,978 |
Figure 6 shows the number of people starting treatment in each age group, categorised into the 4 substance groups.
The most common age group was 35 to 39, with 21,186 people starting treatment. This was followed by the 30 to 34 age group, with 19,949 people, then the 40 to 44 age group with 19,646 people. Within these 3 groups, the alcohol only substance group was the largest, a change from last year, when the opiate substance group was the largest in these categories. Half of people starting treatment (50%) were 40 years and over. Of those aged 55 years and over, 79% said they had problems with alcohol only. This is a decrease of 6% compared to the previous year.
The non-opiate only and non-opiate and alcohol groups had the largest proportion of people under 30 years old starting treatment, at 35% and 28% respectively.
3.3 Referral sources
Figure 7: referral sources for people starting treatment in 2021 to 2022
| Substance group | Self, family and friends | Health and social care | Criminal justice | Substance misuse service | Other | Total |
|---|---|---|---|---|---|---|
| Opiate | 54% | 9% | 25% | 7% | 6% | 100% |
| Non-opiate only | 62% | 18% | 11% | 2% | 7% | 100% |
| Non-opiate and alcohol | 59% | 19% | 12% | 3% | 7% | 100% |
| Alcohol only | 62% | 23% | 6% | 3% | 6% | 100% |
Of the people starting treatment in 2021 to 2022, 59% self-referred (which may be following advice from a healthcare professional) or were referred by family and friends. This was the most common referral source in all 4 substance groups.
Referral from healthcare was the second most common referral source and made up 18% overall. This includes referrals from GPs, which accounted for 6% of all referrals, but was higher in the alcohol only group at 8%. Hospitals made up 5% of all referrals while only 3% of referrals came from social services. Referrals from healthcare varied between the individual substance groups. Only 9% of opiate referrals came from healthcare compared to 23% of alcohol only referrals.
Collectively, referrals from the criminal justice system made up 13%. But there was a big difference between substance groups, with 25% of opiate referrals coming from the criminal justice system compared to just 7% for those with only alcohol problems. Prison referrals accounted for 5% of all referrals.
You can find a further breakdown of these groups in the accompanying data tables.
4. Housing
Around 1 in 9 people (11%) starting treatment said they had a housing problem and a further 5% had an urgent problem. For people with opiate problems, the proportion with a housing problem was 17% and an additional 13% had an urgent housing problem.
Figure 8: housing need for people starting treatment in 2021 to 2022
| Substance group | Urgent housing problem | Housing problem |
|---|---|---|
| Opiate | 4,088 | 5,347 |
| Non-opiate only | 594 | 2,158 |
| Non-opiate and alcohol | 939 | 2,655 |
| Alcohol only | 1,112 | 3,919 |
Around 1 in 9 people (11%) starting treatment said they had a housing problem and a further 5% had an urgent problem. For people with opiate problems, the proportion with a housing problem was 17% and an additional 13% had an urgent housing problem.
Figure 8 shows the numbers of people starting treatment who had a housing problem or an urgent housing problem, separated into the 4 substance groups. The opiate substance group had the highest number with 9,435 people saying they had a housing problem or an urgent housing problem. The alcohol only group had the second highest numbers with 3,919 people saying they had a housing problem and 1,112 people saying they had an urgent housing problem.
The people in treatment with NPS problems had the highest proportion of housing need, with 42% saying they had a housing problem (urgent or otherwise) when starting treatment.
Figure 9: housing need for people with problems with new psychoactive substances starting treatment in 2021 to 2022
| Housing need | NPS | All |
|---|---|---|
| Housing problem | 22% | 11% |
| Urgent housing problem | 20% | 5% |
Figure 9 shows the proportion of people with NPS problems who reported housing problems, compared to the proportion of all people starting treatment. It shows that 20% of people with NPS problems said they had an urgent housing problem, compared to 5% of all people starting treatment. For non-urgent housing problems, the proportions were 22% of people with NPS problems and 11% for all people starting treatment.
5. Mental health
Figure 10: mental health need and treatment received for people starting treatment in 2021 to 2022
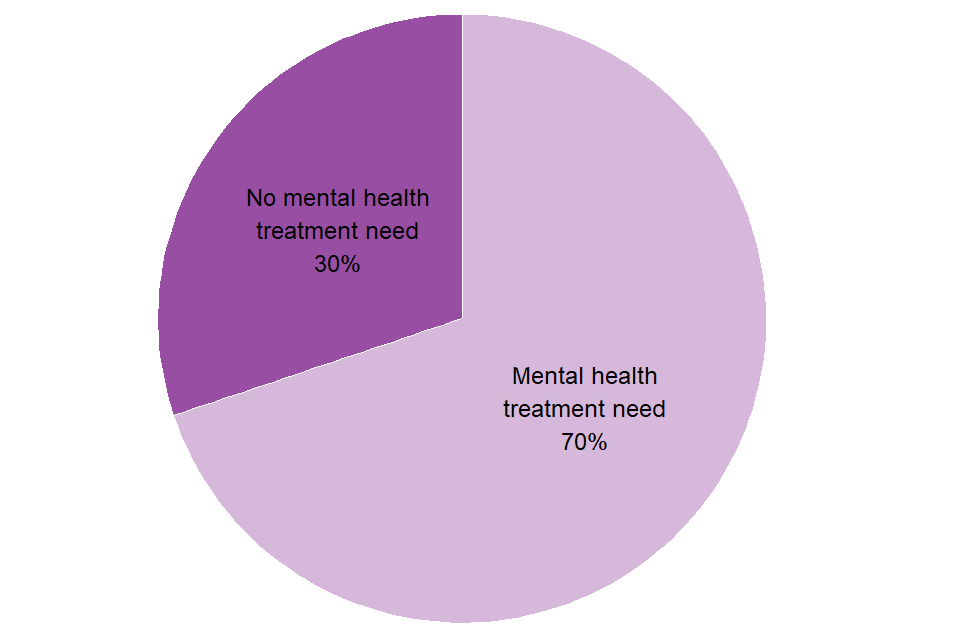
Over two-thirds of people starting treatment said they had a mental health need (70%). When looking at the 4 substance groups, the proportions of people reporting a mental health need were:
- 66% of people in the opiates group
- 70% of people in the non-opiate only group
- 70% of people in the alcohol only group
- 76% of people in the non-opiate and alcohol group
Over one-fifth (22%) of people who had a mental health need were not receiving any treatment to meet this need. Of those receiving mental health treatment:
- 60% received it in a primary care setting, such as a GP surgery
- 20% were engaged with the local community mental health services
- 2% were engaged with Improving Access to Psychological Therapies programmes
- 1.4% received National Institute for Health and Care Excellence recommended psychosocial interventions provided for the treatment of a mental health problem in drug or alcohol services
- 0.8% had an identified space in a health-based place of safety for mental health crises
6. Injecting status
Figure 11: injecting status of people starting treatment in 2021 to 2022
| Substance group | Currently injecting | Previously injected | Not currently injecting, unknown previous | Never injected | Total |
|---|---|---|---|---|---|
| Opiate | 21% | 32% | 0.5% | 47% | 100% |
| Non-opiate only | 2% | 6% | 0.4% | 92% | 100% |
| Non-opiate and alcohol | 1% | 6% | 0.4% | 93% | 100% |
| Alcohol only | 0.5% | 2% | 0.6% | 96% | 100% |
Seventeen per cent of all people starting treatment were currently injecting or had previously injected drugs. This is much higher for people with opiate problems, with 21% currently injecting and 32% having previously injected. In the other 3 substance groups, over 90% of people had never injected drugs. In the non-opiate only and non-opiate and alcohol groups, 6% said they had previously injected, respectively.
Only very small numbers outside of the opiate substance group were currently injecting with just 2% of people in the non-opiate only group, and 1% of the non-opiate and alcohol group. Only 2% of people with alcohol only problems had previously injected drugs.
7. Parental status and safeguarding children
Figure 12: parental status of people starting treatment in 2021 to 2022
| Parental status | Percentage of people starting treatment |
|---|---|
| Not a parent and not in contact with children | 64% |
| Parent not with children | 16% |
| Other contact living with children | 2% |
| Parent living with children | 18% |
In 2021 to 2022, 20% (26,570) of people starting treatment were living with children, either their own or someone else’s. A further 16% were parents who were not living with their children. This was highest among men in treatment for non-opiates and alcohol, where 21% were parents who were not living with their children.
Twenty-eight per cent of women reported either living with a child or being a parent when they started treatment, compared to 16% of men.
The average number of children per household where people in treatment live with a child was 1.9.
The total number of children of people starting treatment was 49,748. This includes children who:
- live with parents in treatment
- have parents in treatment that they do not live with
- are living with someone in treatment who is not their parent
Figure 13: children receiving early help or in contact with children’s social care
| Help received or in contact with children’s social care | Children receiving early help or in contact with children’s social care |
|---|---|
| Early help | 7% |
| Child in need | 8% |
| Child protection plan | 12% |
| Looked after child | 7% |
| No early help | 65% |
Sixty-five per cent of children of people starting treatment were receiving no early help. Early help services provide support to children and their families as soon as problems emerge. In contrast, 12% of the children of all people starting treatment had a child protection plan and this figure was highest in the non-opiate group, at 20%.
8. Smoking
Figure 14: smoking rates at the start of treatment
| Substance group | Women | Men |
|---|---|---|
| Opiate | 64% | 66% |
| Non-opiate only | 59% | 56% |
| Non-opiate and alcohol | 63% | 62% |
| Alcohol only | 40% | 42% |
| General population | 12.1% | 15.8% |
Nearly 46,000 people (53%) said they had smoked tobacco in the 28 days before starting treatment. This is based on information collected at the start of treatment and a 6-month review using the treatment outcomes profile (TOP), which is part of a set of outcome monitoring forms.
Across all substance groups, men and women reported smoking at similar levels. And in all cases, the level of smoking was substantially higher than the smoking rate of the general adult population in England, which is 15.8% for men and 12.1% for women .
Despite the high levels of smoking, only 4% of people were recorded as having been offered referrals for smoking cessation interventions. However, this is an increase from 2% in 2020 to 2021.
9. Treatment interventions
Figure 15: breakdown of settings where people’s treatment took place
| Setting | Prescribing | Psychosocial |
|---|---|---|
| Community | 94% | 98% |
| Primary care | 11% | 4% |
| Inpatient unit | 5% | 3% |
| Residential | 1% | 1% |
We have excluded settings with proportions of less than 1% from figure 15, but the information is available in the accompanying data tables.
Almost all (99%) people in treatment received some form of structured treatment. You can find a definition of structured treatment in the business definitions guidance.
Of the people that did receive structured treatment:
- 98% received a community-based treatment
- 6% received treatment in a primary care setting
- 3% received treatment in an inpatient setting
- 1% received treatment in a residential setting
The number of people receiving treatment in inpatient and residential settings has increased, from 13,214 in 2020 to 2021 to 14,105 this year. However, this is still 45% lower than the peak of people receiving treatment in these settings in 2014 to 2015 (25,847).
Figure 16: breakdown of type of treatment that people received
| Substance group | Prescribing |
|---|---|
| Opiate | 94% |
| Non-opiate only | 7% |
| Non-opiate and alcohol | 12% |
| Alcohol only | 16% |
| Substance group | Psychosocial |
|---|---|
| Opiate | 99% |
| Non-opiate only | 100% |
| Non-opiate and alcohol | 100% |
| Alcohol only | 100% |
Figure 16 shows the breakdown of the main type of intervention received, either prescribing or psychosocial interventions, by people in treatment for the 4 main substance groups.
Ninety-nine per cent of people received a psychosocial intervention while 53% received at least one prescribing intervention.
Over 99% of people in the non-opiate only, non-opiate and alcohol, and alcohol only groups received a psychosocial intervention. People with problems with opiates were the lowest proportion of people receiving a psychosocial intervention, with just below 99%.
Of the number of people receiving prescribing interventions:
- 87% were in the opiate group
- 9% were in the alcohol only group
- 3% were in the non-opiate and alcohol group
- 1% were in the non-opiate only group
Of the people starting treatment, 98% did so within 3 weeks of being referred to treatment.
10. Treatment outcomes
10.1 Treatment exits
Figure 17: breakdown of latest treatment exits in 2021 to 2022
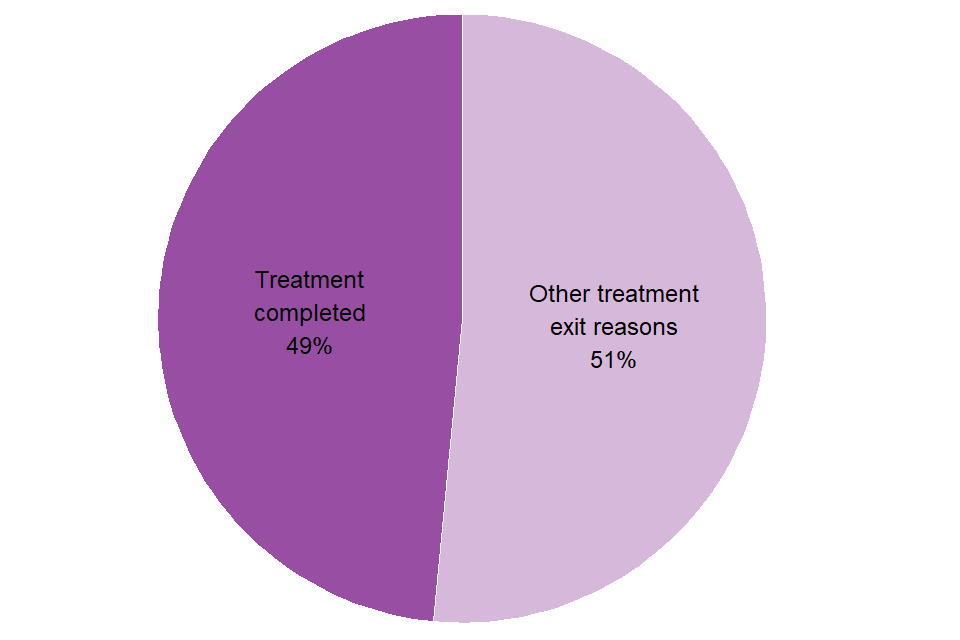
A total of 126,118 people left drug and alcohol treatment in 2021 to 2022.
Of the people who left treatment, 49% completed their treatment successfully and were discharged as ‘treatment completed’. The alcohol only group had the highest rate of treatment completed at 59%. This was closely followed by the non-opiate group (55%) and the non-opiate and alcohol group (51%). The opiate only group had a completion rate of 24%.
Of the people who left treatment for other reasons, over a third (36%) of people dropped out or left treatment without completing it. Fifteen per cent of people left treatment because they were transferred somewhere else (to prison custody or other services). These transfers include 11% of people who left either due to unsuccessful transfers between services or the person declining further treatment.
10.2 Time taken to successfully complete treatment
On average (mean), people who completed treatment successfully did so within a year of starting treatment (306 days).
The average time in treatment for people with opiate problems who completed treatment successfully was around 3 years (1,096 days) and around 6 months for the other substance groups (173 days for non-opiate only, 209 days for non-opiate and alcohol and 201 days for alcohol only).
10.3 Deaths in treatment
Every year, people die while they are in an alcohol and drug treatment programme, but these deaths might not be alcohol or drug related.
There were 3,742 recorded deaths in treatment in 2021 to 2022, which was 1.3% of all people in treatment. Compared to 2020 to 2021, this is a 0.4% increase in the number of deaths (from 3,726) but it is a decrease in the proportion of people in treatment dying (from 1.4%).
People with opiate problems accounted for nearly two-thirds (65%) of these deaths, and the alcohol only group had a further 28% of deaths.
Figure 18: map of deaths in drug treatment (mortality ratio between 2019 to 2020 and 2021 to 2022)
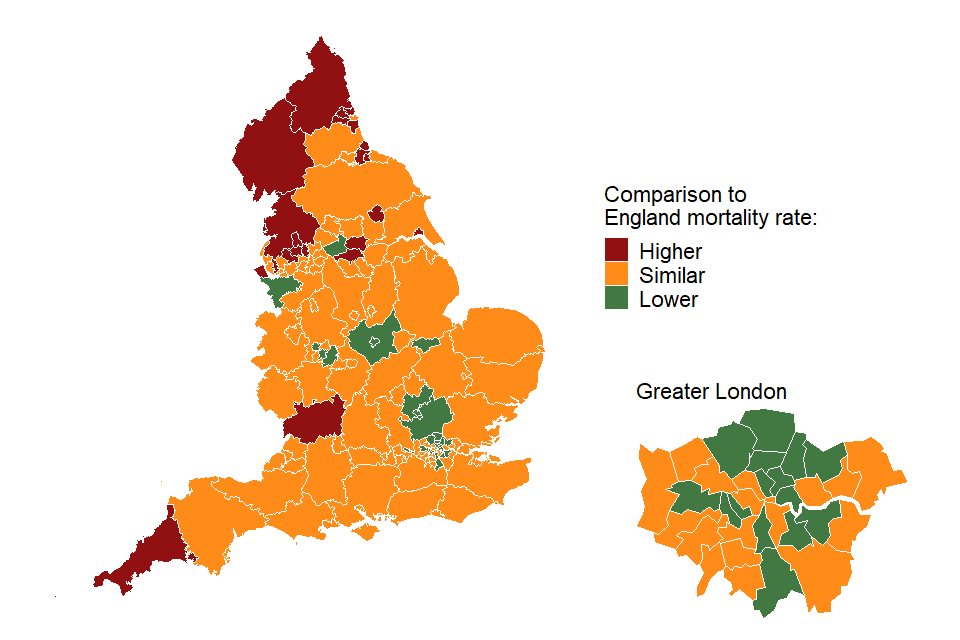
Figure 18 is a map showing the local authorities where the number of deaths of people in drug and alcohol treatment are higher than, lower than, or similar to the mortality rate for England overall. This data includes deaths in treatment between April 2019 and March 2022. Figures used in this map were calculated as indirectly age-standardised ratios for each local authority and are available in the data tables that accompany this report.
Ratios greater than 1.0 show a higher mortality rate than the overall mortality rate for England and ratios lower than 1.0 show a lower mortality rate. The higher mortality ratios are concentrated in the north-west and north-east of England. Ratios ranged from 0.3 in Redbridge to 2.0 in Hartlepool.
Drug use is a significant cause of premature death in England, as the Office for National Statistics (ONS) drug poisoning data has shown. In England, the number of deaths from drug misuse registered in 2021 was 2,846, which is the highest level since records began.
Data from ONS on deaths related to drug poisoning by date of occurrence in England and Wales shows that rates of drug misuse deaths continue to be higher among people born in the 1970s, with the highest rate in those aged 45 to 49. Among men, there were 110.3 drug poisoning deaths which occurred per million in 2020 (3,123 registered deaths), compared with 50.2 deaths per million among women (1,463 deaths).
Alcohol use is a significant cause of premature death in England, as the ONS alcohol-specific deaths data shows. In England, the number of alcohol-specific deaths registered in 2021 was 9,641, a rise of 27.4% since 2019.
10.4 Self-reported outcomes: substance use
Figure 19: change in self-reported number of days use between start of treatment and 6-month review
| Substance | Baseline | Review |
|---|---|---|
| Opiate use (opiate only clients) | 23.7 days | 6.5 days |
| Opiate use (opiate and crack cocaine clients) | 22.5 days | 10.1 days |
| Crack cocaine use (all drug clients) | 17.2 days | 8.8 days |
| Alcohol use (alcohol only clients) | 21.3 days | 11.9 days |
The Office for Health Improvement and Disparities (OHID) collects information about the outcomes for people who use drug and alcohol treatment services. This includes the treatment outcome profile, which measures change and progress in important areas of their lives.
People in treatment for opiate problems reported a fall in the number of days they used opiates. When they started treatment, they reported an average of 23 days using opiates in the previous 28 days. At their 6-month treatment review, this number had fallen to 8.6 days.
The alcohol only group reported a fall in the number of days that they used alcohol. When they started treatment, they reported an average of 21.3 days drinking in the previous 28 days. But at their 6-month review, this number had fallen to 11.9 days.
11. Self-reported outcomes: education, employment and injecting
Figure 20: change in self-reported injecting, employment and education between start of treatment and 6-month review
| Category | Baseline | Review |
|---|---|---|
| Education (all) | 11.8 days | 10.9 days |
| Employment (all) | 18 days | 18.2 days |
| Injecting (opiate) | 20.5 days | 7.8 days |
For people in education at the start of treatment and at their 6-month review, the average number of days that they reported being in education fell from 11.8 at the start to 10.9 at the review.
For people in employment at the start of treatment and at their 6-month review, the average number of days they were in employment in the last 28 days increased. This rose from 18 days at the start of treatment to 18.2 days at their review.
For people with opiate problems who were injecting at the start of treatment, the average number of days of injecting dropped from 20.5 days per month at the start of treatment to 7.8 days per month at the 6-month review.
12. Trends over time
12.1 Numbers in treatment
Figure 21: trends in numbers in treatment by substance group between 2005 to 2006 and 2021 to 2022
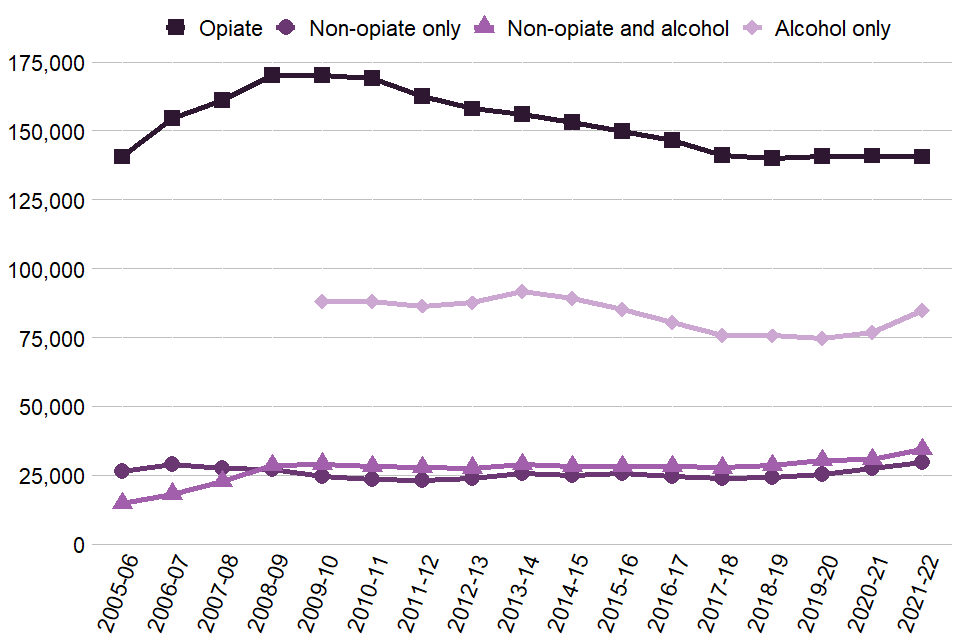
The overall number of people in treatment increased by 5% since last year, with 289,215 people in treatment, the highest amount since 2014 to 2015.
The alcohol only group saw the highest overall rise of all the substance groups, with a 10% increase (7,957). The non-opiate group had the highest number of people (29,582) in treatment since reporting started, 3% higher than the previous peak in 2006 to 2007 (28,777). The non-opiate and alcohol group continued an upward trend from 27,684 in 2017 to 2018, to 34,378 this year, a 24% increase. The opiate group has remained stable since 2017 to 2018 with a 0.4% decrease.
Numbers for people in treatment who said they had a problem with alcohol only are shown from 2009 to 2010 onwards when national alcohol treatment data collection started.
You can find these trends over time on the NDTMS website using the ViewIt tool. You can choose to display either England or local authority level data, as well as split the data by substance, sex and age groups.
12.2 People leaving treatment
Figure 22: trends in people successfully completing treatment as a proportion of exits in the year between 2005 to 2006 and 2021 to 2022
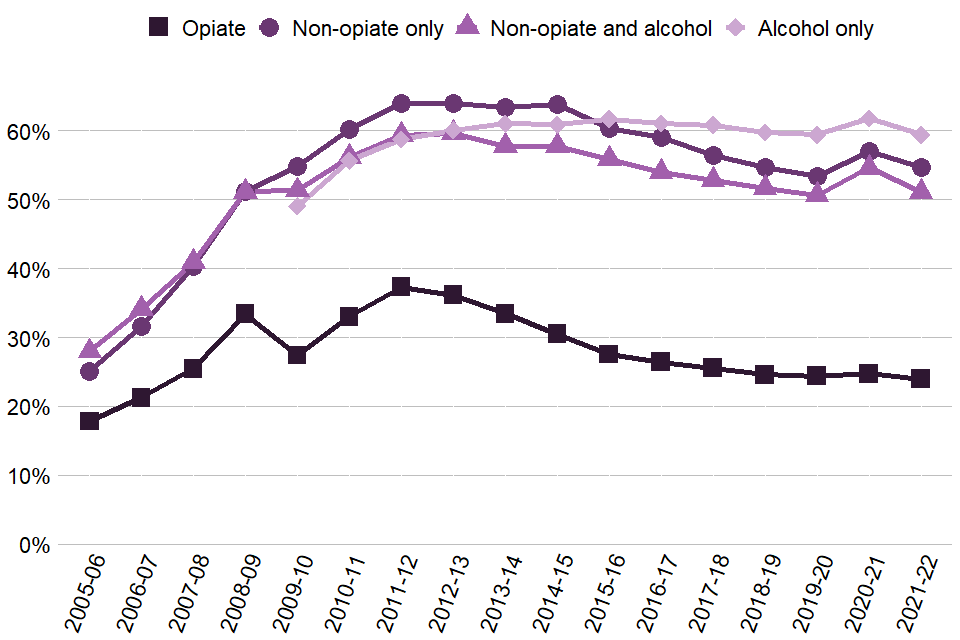
The percentage of people leaving treatment free of dependence fell slightly in 2021 to 2022 to 48.5%. This overall proportion is comparable with the proportions in the previous years since 2015 to 2016 (50.5%). There were decreases in each group’s successful completion rate, and the decreases were most pronounced in the non-opiate and alcohol group (3.5% decrease).
12.3 Trends in substance use
Figure 23: trends of people starting treatment with opiate and/or crack problems between 2005 to 2006 and 2021 to 2022
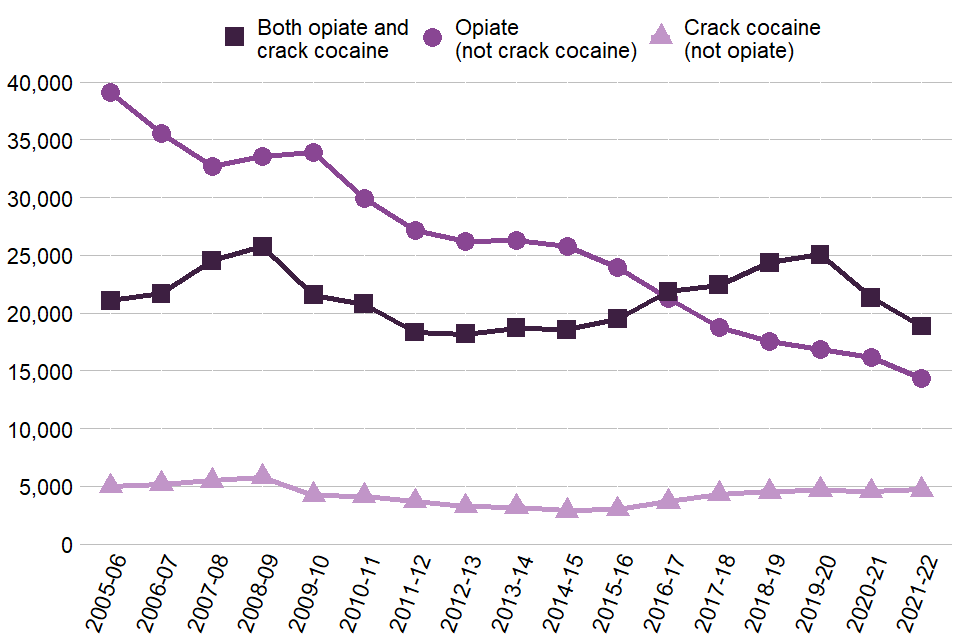
The number of people entering treatment for problems with opiates but not crack continued on a downward trend that started in 2009 to 2010. It has decreased by 58% over the last 12 years.
The number of people entering treatment for both crack and opiates dropped by 12% this year, and it is now at 18,832, which is the lowest number since 2014 to 2015. The number of people entering treatment for crack without opiates has been stable since 2018 to 2019 but has increased 63% since the lowest point in 2014 to 2015.
The total number of people entering treatment for crack without opiates (4,711) is a slight increase on the previous year and the highest since 2008 to 2009.
The number of people starting treatment for NPS (1,116 this year) has remained relatively stable since 2017 to 2018 (1,223).
The number of people with ecstasy problems continued to fall, with 555 people starting treatment this year, compared to a high of 2,399 in 2007 to 2008.
There was a continued rise in ketamine numbers, with 1,551 people starting treatment, compared to 426 in 2014 to 2015. The number of people with methamphetamine problems also rose, reaching 558 compared to 131 in 2011 to 2012.
You can find more detailed data on the drugs people had problems with in the accompanying data tables.
12.4 Deaths in treatment
Figure 24: trends in deaths of people in treatment between 2005 to 2006 and 2021 to 2022
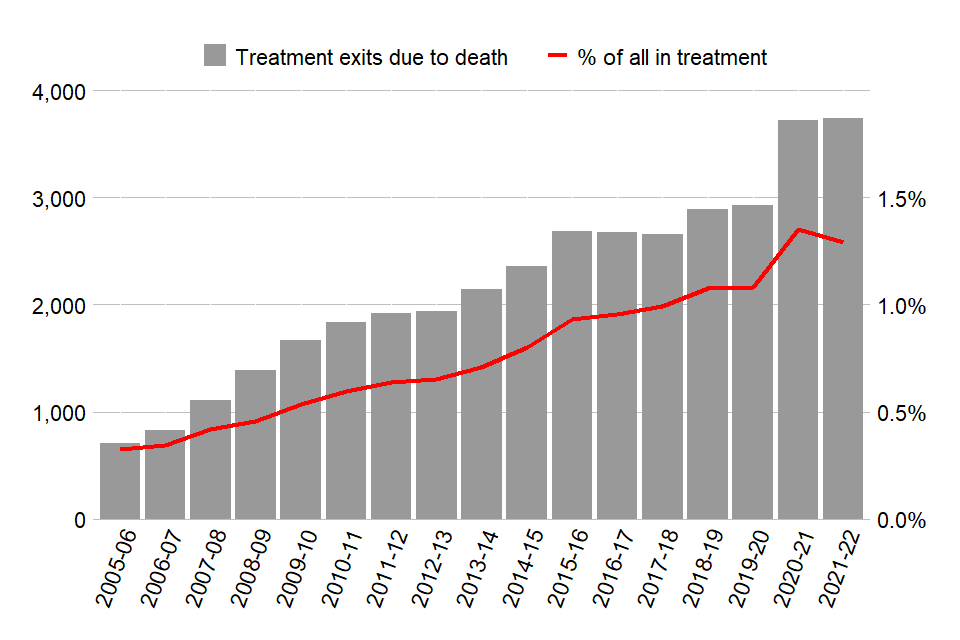
In 2021 to 2022, deaths as a proportion of all in treatment fell slightly to 1.3%. But this follows last year’s increase from 1.1% to 1.4%, which was the largest rise in the proportion of people dying in treatment since NDTMS data has been collected.
The trend of people dying in treatment has increased from 711 deaths in 2005 to 2006 to 3,742 deaths this year, which is more than a 5-fold increase. Although this is the largest number of deaths in treatment on record, as numbers in treatment also increased this represents a smaller proportion of people in treatment.
12.5 Deaths in treatment by substance
Figure 25: percentages of deaths in treatment between 2005 to 2006 and 2021 to 2022
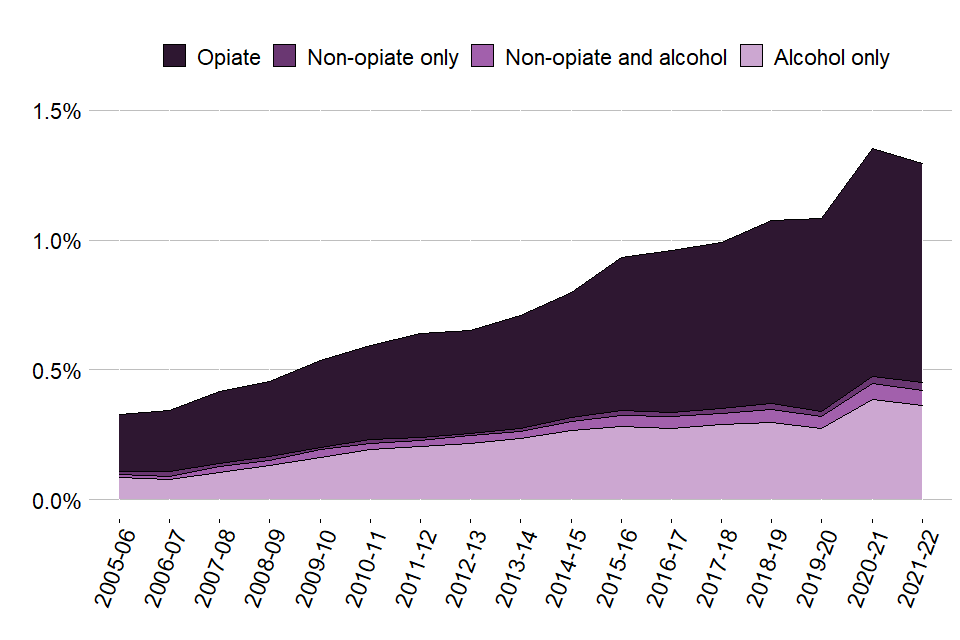
In 2021 to 2022, the proportion of deaths in treatment stayed stable in all substance groups, with the:
- opiate group increasing from 1.72% to 1.73%
- non-opiate only group increasing from 0.27% to 0.3%
- non-opiate and alcohol group decreasing from 0.55% to 0.48%
- alcohol only group decreasing from 1.39% to 1.25%
13. A 17-year analysis
13.1 People in treatment
Figure 26: most recent status of all people in treatment between 2005 to 2006 and 2021 to 2022
| Status | People in treatment between 2005 to 2006 and 2021 to 2022 |
|---|---|
| Still in treatment 31 March 2022 | 14% |
| Left and not completed treatment | 39% |
| Completed treatment and not returned | 47% |
In the 17 years of treatment data starting from 2005 to 2006, there has been a total of 1,104,927 people in contact with drug and alcohol treatment services. By 31 March 2022:
- 153,306 (14%) were still engaged in treatment
- 435,840 (39%) had left before they completed their treatment and had not returned
- 515,781 (47%) had completed their treatment and not returned
13.2 Treatment journeys
Figure 27: number of previous journeys for people still in treatment at the end of 2021 to 2022
| Treatment journeys | People still in treatment at the end of 2021 to 2022 |
|---|---|
| More than 4 journeys since first starting treatment | 47,208 |
| 4 journeys since first starting treatment | 16,692 |
| 3 journeys since first starting treatment | 22,284 |
| 2 journeys since first starting treatment | 28,963 |
| Continuous journey | 38,159 |
Of the people still in treatment at the end of March 2022, well over a third (42%) have had 4 or more treatment journeys. A quarter (25%) have been in treatment continuously since their treatment started, 51% of those people started treatment in 2021 to 2022, and 31% have been in treatment for 5 years or more.
You can find more information on the methodology of this analysis in the NDTMS annual statistics quality and methodology document.
14. Background and policy context
14.1 Background to the data
This report presents statistics on the availability and effectiveness of alcohol and drug treatment in England and the profile of people accessing this treatment.
The statistics in this publication come from analysis of the NDTMS.
The NDTMS collects data from about 600 sites providing structured substance misuse interventions, covering every local authority in England. Treatment centres returning data include:
- community-based drug and alcohol services
- specialist outpatient services
- GP surgeries
- residential rehabilitation centres
- inpatient units
The data collected includes information on the demographics and personal circumstances of people receiving treatment, as well as details of the interventions delivered and their outcomes.
You can find more details on the methodology used in the report in the NDTMS annual statistics quality and methodology document.
Alcohol and drug treatment statistics reports for previous years can be found in OHID’s Alcohol and drug misuse and treatment statistics collection.
OHID will update the existing estimates for opiate and crack use prevalence in England using an updated methodology in 2023. We will also update the existing estimates of alcohol dependence prevalence in England this year, using the existing methodology.
14.2 Policy context
Alcohol and drug treatment in England is commissioned by local authorities using the public health grant. They are responsible for assessing local need for treatment and commissioning a range of services and interventions to meet that need.
The public health grant conditions make it clear that:
A local authority must, in using the grant: have regard to the need to improve the take up of, and outcomes from, its drug and alcohol misuse treatment services, based on an assessment of local need and a plan which has been developed with local health and criminal justice partners
OHID works with local authorities and provides them with bespoke data, guidance, tools and other support to help them commission services more effectively.
Guidance for alcohol and drug treatment is available in the Alcohol and drug misuse prevention and treatment guidance collection.
A wide range of NDTMS data is available on the NDTMS website, including some data reports that are only available to local authority commissioners (via login).