Port freight annual statistics 2025: Domestic trends
Published 29 July 2026

© Crown copyright 2026
This publication is licensed under the terms of the Open Government Licence v3.0 except where otherwise stated. To view this licence, visit nationalarchives.gov.uk/doc/open-government-licence/version/3 or write to the Information Policy Team, The National Archives, Kew, London TW9 4DU, or email: psi@nationalarchives.gov.uk.
Where we have identified any third party copyright information you will need to obtain permission from the copyright holders concerned.
This publication is available at https://www.gov.uk/government/statistics/port-freight-annual-statistics-2025/port-freight-annual-statistics-2025-domestic-trends
You can use our maritime interactive dashboard to explore port freight trends.
These are accredited official statistics and were independently reviewed by the Office for Statistics Regulation in December 2018. For more information, see the About these statistics section
Domestic tonnage traffic
Definitions
Coastwise: traffic carried around the coast from one UK port to another, including domestic ferry services. Figures are double-counted in the port freight data for this type of traffic. For example, data of a shipment from Liverpool to Belfast is collected from both Liverpool’s and Belfast’s perspectives (one being an inward, the other record being an outward voyage).
One-Port: traffic to and from offshore locations such as oil rigs and sea dredging.
Main freight units: a subset of unitised goods are main freight units – this group consists of all containers and those roll-on, roll-off (Ro-Ro) units which are designed to carry freight (categories 51, 61 and 63 in the cargo categorisation flowchart. The purpose of the main freight unit classification is that it excludes those Ro-Ro units which are not freight carrying – such as passenger vehicles, trade vehicles, and other specialised vehicles and trailers.
Tonnage carried on domestic routes continues to account for 20% of all traffic handled by UK major ports, totaling 83.3 million tonnes in 2025. This proportion has been similar since 2012. Overall, domestic tonnage in 2025 declined by 3% (2.9 million tonnes) compared to 2024. Coastwise traffic made up the majority (84%) of domestic tonnage in 2025 compared to one-port traffic (16%).
Chart 18 is a line chart showing the trend in domestic traffic by coastwise and one-port over time. From 2005 to 2017, coastwise traffic broadly declined, mainly because of a fall in liquid bulk traffic, but from 2017 to 2025, the trend has remained relatively level. One-port traffic levels are lower and have broadly declined over time.
Chart 18: Domestic traffic by type from 2000 to 2025 (PORT0706)
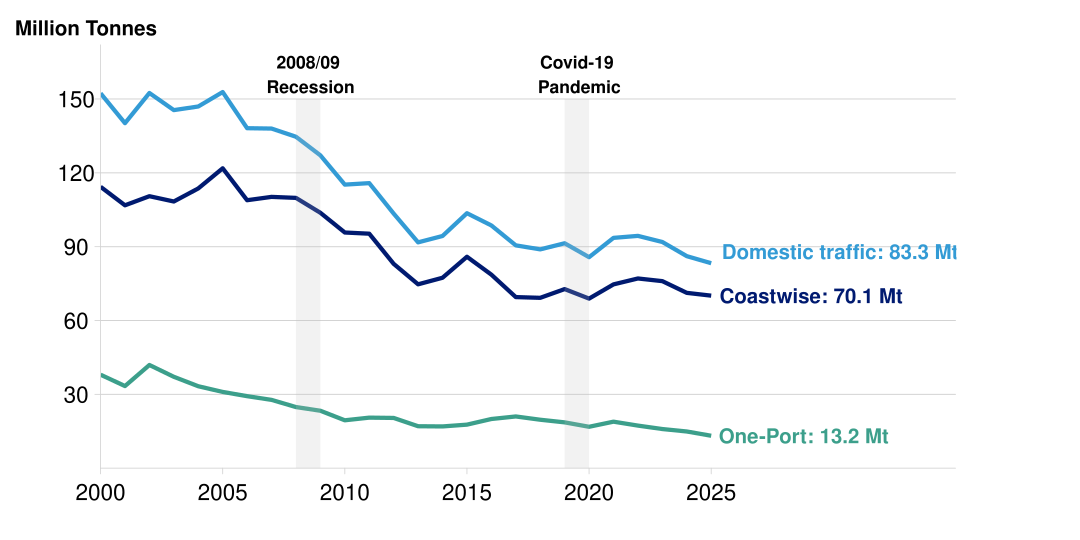
Chart note Domestic traffic is the total of Coastwise and One-Port.
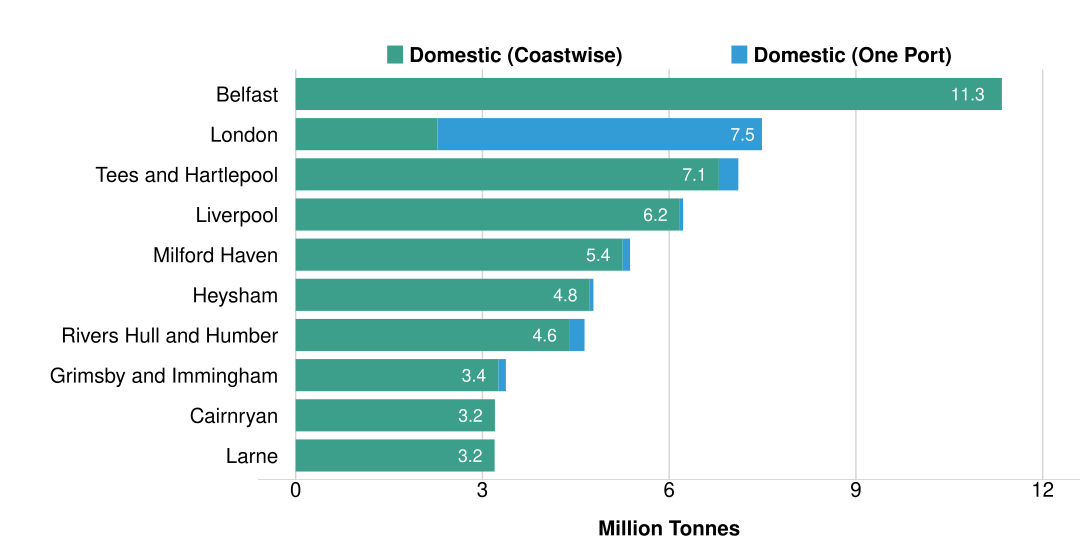
In 2025, Belfast remained the UK port that handled the largest share (14%) of all UK domestic traffic, handling a total of 11.3 million tonnes (all of which was coastwise traffic). This is shown in Chart 19, a stacked bar chart of the 10 ports handling the most domestic traffic split by one-port and coastwise. London was the second largest domestic port and handled the most one-port traffic, the majority of which was dry bulk. London one-port traffic alone accounted for 40% of all domestic one port traffic in 2025.
Chart 19: Top 10 UK major ports by domestic tonnage in 2025 (PORT0499)
Domestic cargo type trends
While the overall decline in domestic traffic was driven by declines in dry bulk and Ro-Ro traffic, container traffic increased. Chart 20 is a line chart showing the trends in domestic traffic by cargo groups over the last decade.
Chart 20: Domestic traffic by cargo group from 2015 to 2025 (PORT0706)
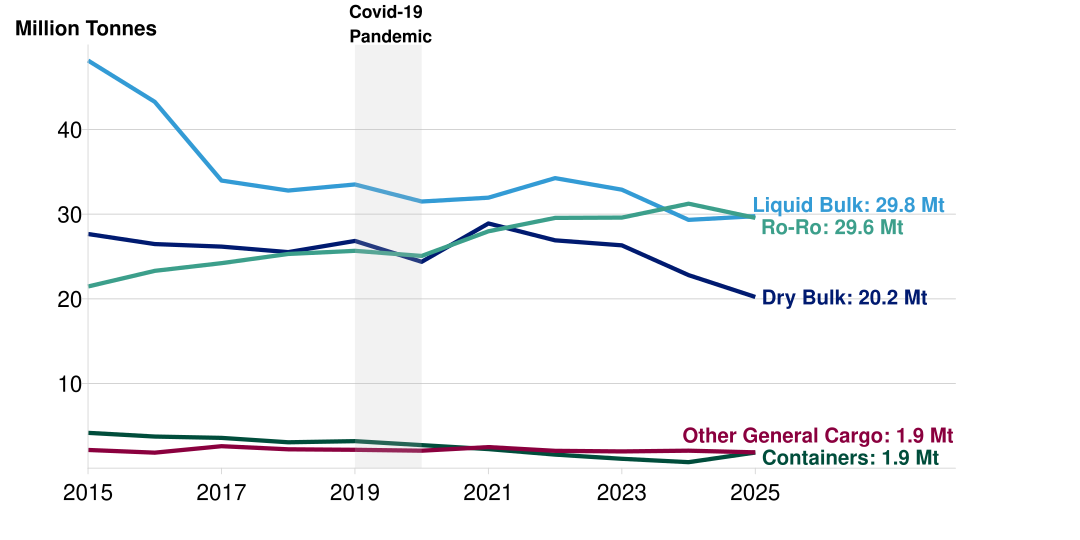
Dry bulk had the largest absolute decline of all domestic traffic, down 2.6 million tonnes (11%) in 2025 compared to 2024, accounting for over half of the total domestic decline across all cargo groups. The decline in domestic dry bulk was driven by a 2.5 million tonnes drop in other dry bulk (an 11% fall). This differs from the international trend, which saw a slight increase of 0.4 million tonnes (1%) in dry bulk from 2024 to 2025.
Ro-Ro tonnage also contributed to the overall fall in domestic traffic in 2025, falling by 5% from 2024, largely driven by reductions in accompanied vehicles and unaccompanied road goods vehicles. Other general cargo also saw a drop in 2025, falling by 9% to its lowest level since 2016.
Domestic container traffic showed the largest absolute increase of all domestic traffic, rising 1.1 million tonnes (161%) in 2025 compared to 2024. This increase reverses the trend of the last 10 years where volumes had been steadily declining year-on-year. It also follows the international trend in 2025, where container traffic has similarly increased.
Liquid bulk also saw a small increase in 2025 (up 1% from 2024), following a couple years of decline. All domestic liquid bulk groups declined, except for crude oil which increased by 1 million tonnes (9%). This was primarily driven by an increase in crude oil at Tees and Hartlepool (up 27% from 2024). This domestic trend contrasts the UK international crude oil trend, which declined by 15% from 2024 to 2025.
For more detail on trends by cargo type internationally, go to the cargo trends chapter.
Coastwise traffic
In 2025, 70.1 million tonnes of domestic traffic was coastwise, a decrease of 2% compared to 2024. This coastwise decline was largely driven by a 1.3 million tonnes decline in dry bulk (mostly other dry bulk, such as cement and aggregates) and a 1.7 million tonnes decline in Ro-Ro traffic.
Coastwise container traffic increased to 1.9 million tonnes in 2025 with notable increases at Liverpool (up 0.7 million tonnes from 2024 to 2025), Felixstowe (up 0.3 million tonnage) and London (up 0.3 million tonnes). This growth likely reflects increased UK container handling capacity following the recent opening of London Gateway’s fourth berth in December 2024. London international container traffic increased substantially, by 5.1 million tonnes (36%) from 2024 to 2025, alongside a decline in Liverpool and Felixstowe’s international container tonnage (in contrast to domestic trends at these ports). This may suggest that more containers were first imported to London, then moved domestically to other ports (such as Liverpool and Felixstowe), rather than imported directly there, as in previous years.
Liquid bulk tonnage saw an increase of 0.7 million tonnes (a 3% rise), driven by crude oil movements. This was largely due to a 1.2 million tonnes increase of crude oil at Tees and Hartlepool. Other liquid bulk categories saw declines in coastwise movements, including LNG (down 10%) and other liquid bulk (down 32%).
In line with previous years, Belfast handled the most coastwise tonnage of all UK ports in 2025 at 11.3 million tonnes, the majority of which was Ro-Ro (8.2 million tonnes), mostly made up of unaccompanied road goods vehicles. Tees and Hartlepool handled the second most coastwise domestic traffic in 2025 at 6.8 million tonnes, mostly crude oil.
One-port traffic
One-port tonnage decreased 12% from 2024 to 13.2 million tonnes in 2025. One-port tonnage consists of traffic to and from offshore locations, including sea dredging and oil rigs. Crude oil one-port tonnage has declined considerably since 2000 – the general reduction in North Sea oil and gas production in this time is likely to have been a contributory factor. According to DESNZ Energy Trends, UK oil production reached its lowest level in 2025 since North Sea production began in the 1970s, consistent with the longer-term decline in crude oil volumes handled by UK ports. Declines in other dry bulk (such as aggregates from sea dredging) also contributed to the one port decline.
Domestic unitised traffic
Domestic unitised traffic broadly stayed the same in 2025, remaining at 3.8 million units. Small increases in container units were offset by small declines in accompanied vehicles and unaccompanied road goods vehicles.
Domestic waterborne freight
About domestic waterborne freight
Domestic waterborne freight (DWF) covers freight moved by water in the UK and includes traffic on inland waterways in addition to coastwise and one-port traffic. These are based on analysis of the port freight statistics and inland waterway movements collected from barge operators and minor ports. In contrast to the domestic figures above, coastwise traffic between 2 ports is only counted in 1 direction, and international traffic which travels on inland waters is included. Figures in this section are not directly comparable to the rest of port freight statistics.
For further information regarding the figures in this section, see the domestic waterborne freight technical note. Data tables for domestic waterborne freight can be found in the PORT07 section.
Definitions
Inland waterways traffic: movement of freight on a ship or barge along one of British inland waterways, such as rivers or canals. Where coastwise or one-port traffic is handled by a port classified as being on inland waters (for example, on a river), this is also included in the inland waters within this section.
Goods moved: the weight of goods carried, multiplied by the distance hauled, measured in tonne kilometres. This is a measure of the total freight activity, accounting for both the distance travelled and the weight of goods carried.
Goods lifted: the weight of goods carried, measured in tonnes. This is a measure of the amount of goods transported around the UK.
Water transport accounts for a relatively small share of domestic goods moved across all modes in the UK - the majority of goods are moved by road. Based on data for 2024 published in Transport Statistics Great Britain, 10% of goods moved and 5% of goods lifted were by water.
The total volume of goods lifted by water within the UK decreased by 6% from 2024 to 84.2 million tonnes in 2025. Goods moved (measured in billion tonne-kilometres, btk) decreased by 5% to 19.8 btk. This reduction was driven primarily by lower domestic dry bulk movement (down 19%).
These trends are shown in Charts 21 and 22 – line charts showing the trends in domestic waterborne freight goods lifted, and goods moved, over time.
Chart 21: Domestic waterborne freight goods lifted from 2001 to 2025 (PORT0701)
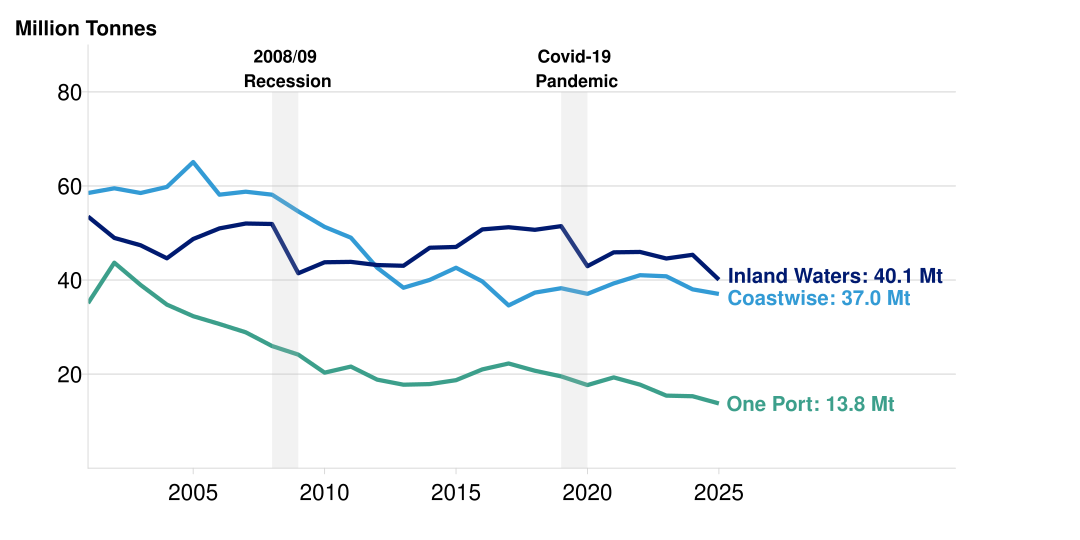
Chart 22: Domestic waterborne freight goods moved from 2001 to 2025 (PORT0701)
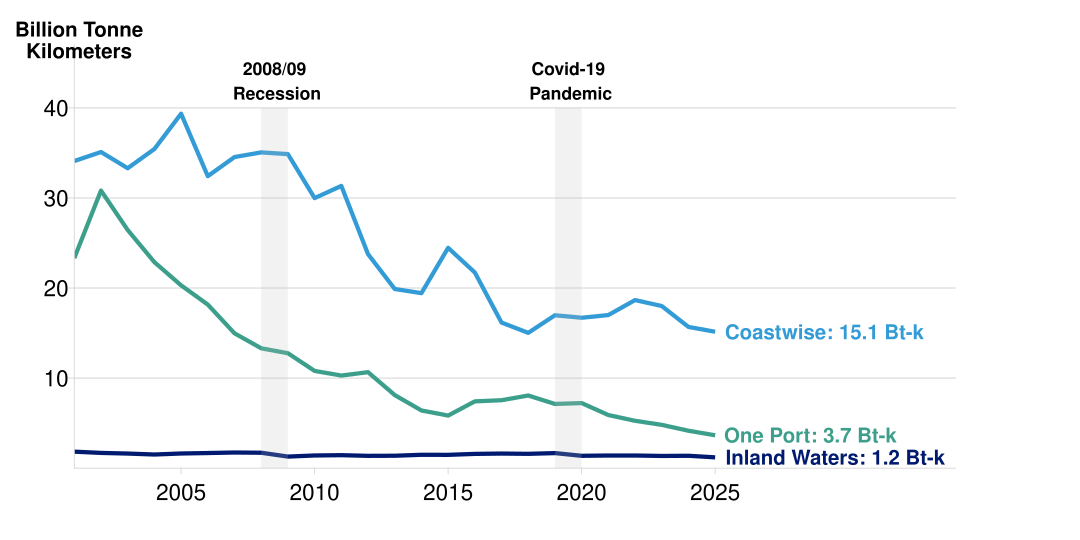
Chart note Coastwise and one-port traffic which travels on inland waterways is counted twice in the Charts 21 and 22 above (so total goods lifted is less than the sum of the 3 individual categories).
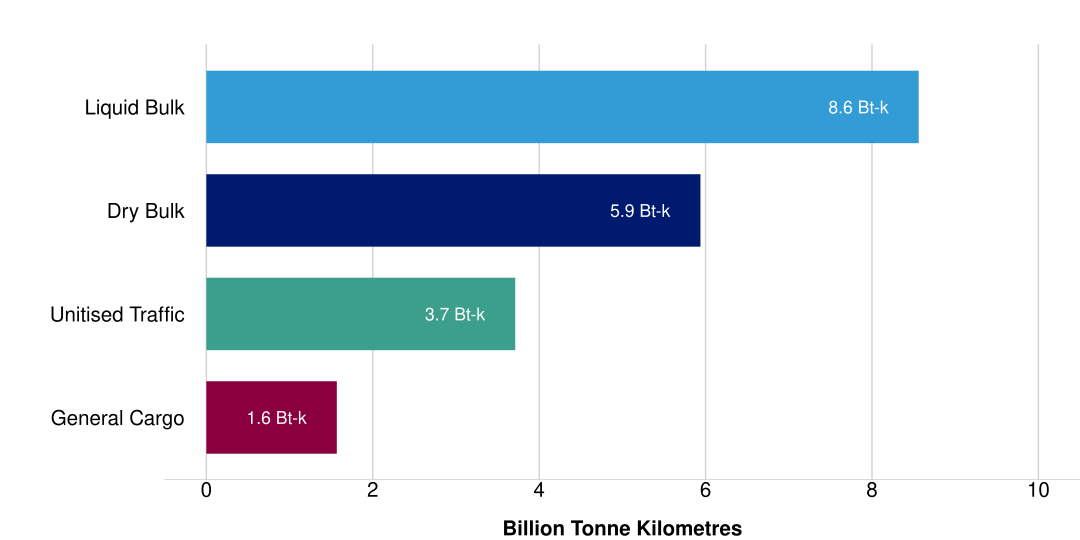
Chart 23 is a bar chart of goods moved in 2025 by cargo type. In terms of goods moved, liquid bulk traffic remains the most transported cargo type along domestic waterborne routes (43%) in 2025, followed by dry bulk (39%), consistent with the previous year trends. Despite the declining trend in liquid bulk overall since 2000 (associated with the decline in North Sea oil), the majority of the liquid bulk cargo movements continues to involve crude oil and oil products. In 2025, unitised traffic (Ro-Ro and container) accounted for 19% of all tonne-kilometres.
Chart 23: Domestic waterborne freight goods moved by cargo type, 2025 (PORT0702)
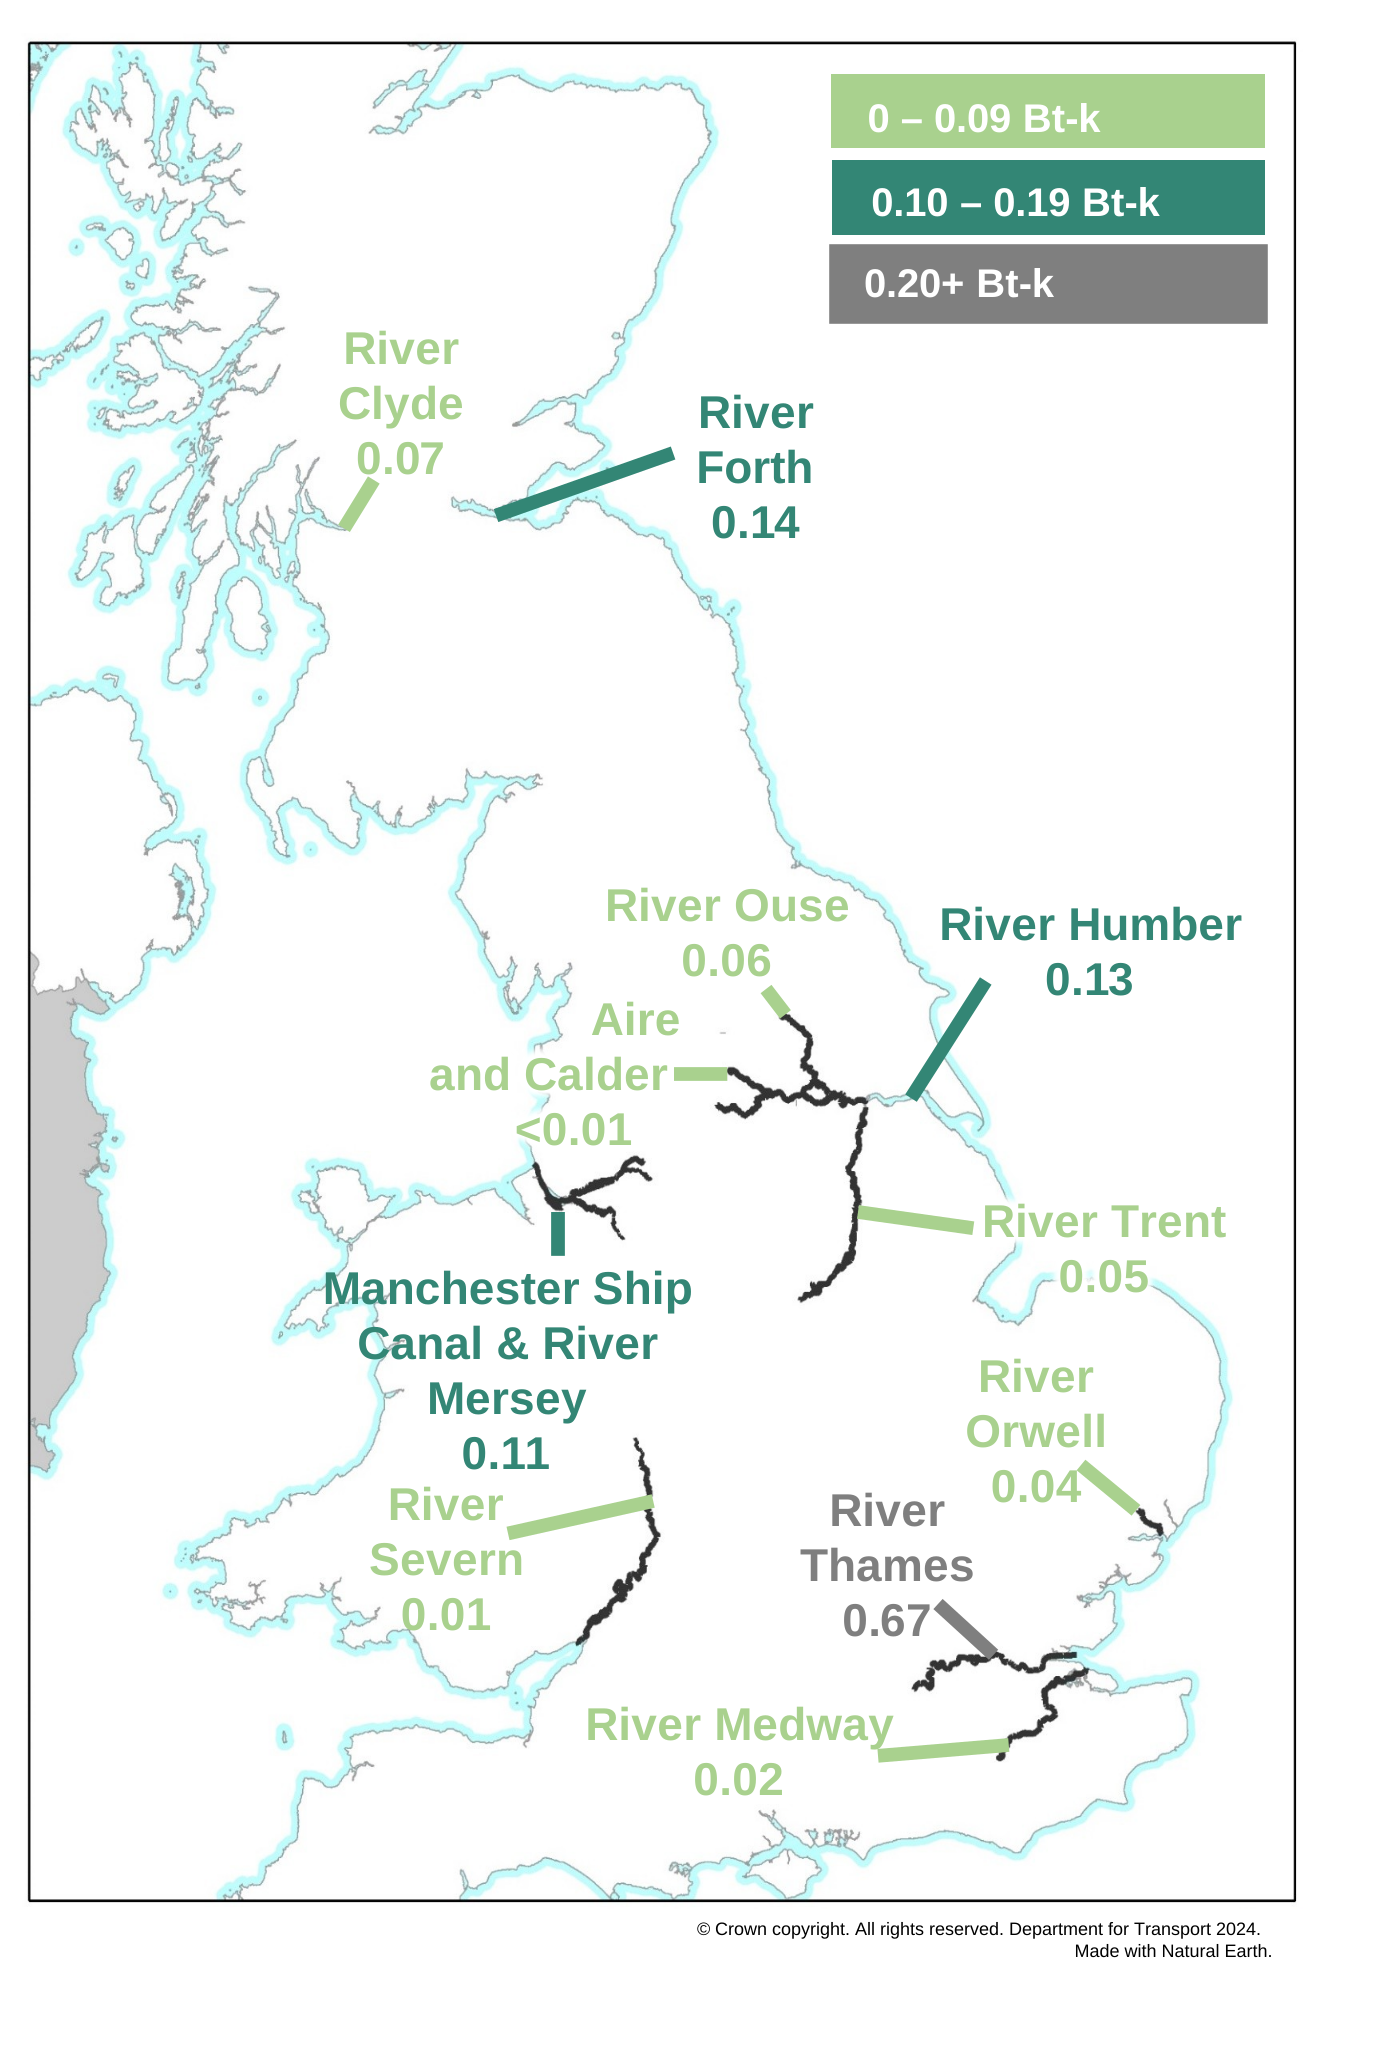
Inland waters traffic is that carried by barges or seagoing vessels on UK inland waterways. In 2025, total goods moved by all UK waterways decreased to 1.2 billion tonnes-kilometres (down 13% from 2024).
Chart 24 is a map of the navigable waterways alongside the associated tonnage moved. The Thames handled the most domestic traffic in the UK (in terms of goods moved), accounting for over half (55%) of all goods moved by inland waterways in 2025, followed by River Forth (12%).
In terms of goods lifted, the Thames handled 20.0 million tonnes of freight, representing 50% of all traffic on UK inland waterways, followed by River Forth (17%).
Chart 24: Map of domestic waterborne freight goods moved by waterway (PORT0705)
Background information
The PORT data tables give further detail of the key results presented in this statistical release. They are available from port and domestic waterborne freight statistics.
These notes provide further information such as definitions and a list of UK ports is available in the accompanying port list.
The background quality report provides further information on how the data is collected, quality assured and comparisons with relevant data sources.
Details of Ministers and officials who receive pre-release access to these statistics up to 24 hours before release can be found on the pre-release access list.
Related data sources
His Majesty’s Revenue and Customs (HMRC) publishes data on tonnage and value to a much more granular commodity level for goods traded internationally. Comparisons between port freight and this source, specifically for certain cargo categories, are explored further in our notes and definitions.
The Department for Energy Security and Net Zero (formerly Department for Business, Energy and Industrial Strategy) publish the Digest of UK Energy Statistics (DUKES) which covers the production and consumption of fuels and energy in the UK.
Information on freight moved by different modes, including a breakdown of domestic freight is available in Transport Statistics Great Britain.
Eurostat publish comparative port freight data for European Union countries, which can be used to compare UK ports to those in EU countries.
About these statistics
These official statistics were independently reviewed by the Office for Statistics Regulation in December 2018. They comply with the standards of trustworthiness, quality and value in the Code of Practice for Statistics and should be labelled ‘accredited official statistics’.
Instructions for printing and saving
Depending on which browser you use and the type of device you use (such as a mobile or laptop) these instructions may vary.
You will find your print and save options in your browser’s menu. You may also have other options available on your device. Tablets and mobile device instructions will be specific to the make and model of the device.
How to search
Select Ctrl and F on a Windows laptop or Command and F on a Mac
This will open a search box in the top right-hand corner of the page. Type the word you are looking for in the search bar and press enter.
Your browser will highlight the word, usually in yellow, wherever it appears on the page. Press enter to move to the next place it appears.
Contact us
Maritime and shipping statistics
Email maritime.stats@dft.gov.uk
Media enquiries 0300 7777 878
To hear more about DfT statistical publications as they are released, follow us on X at DfTstats.