Port freight annual statistics 2025: Cargo trends
Published 29 July 2026

© Crown copyright 2026
This publication is licensed under the terms of the Open Government Licence v3.0 except where otherwise stated. To view this licence, visit nationalarchives.gov.uk/doc/open-government-licence/version/3 or write to the Information Policy Team, The National Archives, Kew, London TW9 4DU, or email: psi@nationalarchives.gov.uk.
Where we have identified any third party copyright information you will need to obtain permission from the copyright holders concerned.
This publication is available at https://www.gov.uk/government/statistics/port-freight-annual-statistics-2025/port-freight-annual-statistics-2025-cargo-trends
You can use our maritime interactive dashboard to explore port freight trends.
These are accredited official statistics and were independently reviewed by the Office for Statistics Regulation in December 2018. For more information, see the About these statistics section.
Port freight trends by cargo type
Throughout this chapter, references to UK ports mean UK major ports unless otherwise stated (in 2025, there are 51 major ports, which handle at least 1 million tonnes of cargo annually or are strategically important). This chapter provides trends in UK major ports tonnage broken down by cargo group.
Chart 6 and Table 2 provide an overview. Liquid bulk, the biggest cargo group, had the largest decline in 2025 of 3.1 million tonnes (down 2% since 2024), the third consecutive year of decline. Ro-Ro had the second largest decline in 2025 of 2.3 million tonnes (down 2%). Dry bulk declined 2.2 million tonnes in 2025 (down 3%). Conversely, container tonnage increased in 2025, up 6.2 million tonnes (10%). Other general cargo showed little change in 2025 (down less than 1%).
Chart 6: UK major port tonnage by cargo group from 2015 to 2025 (PORT0201)
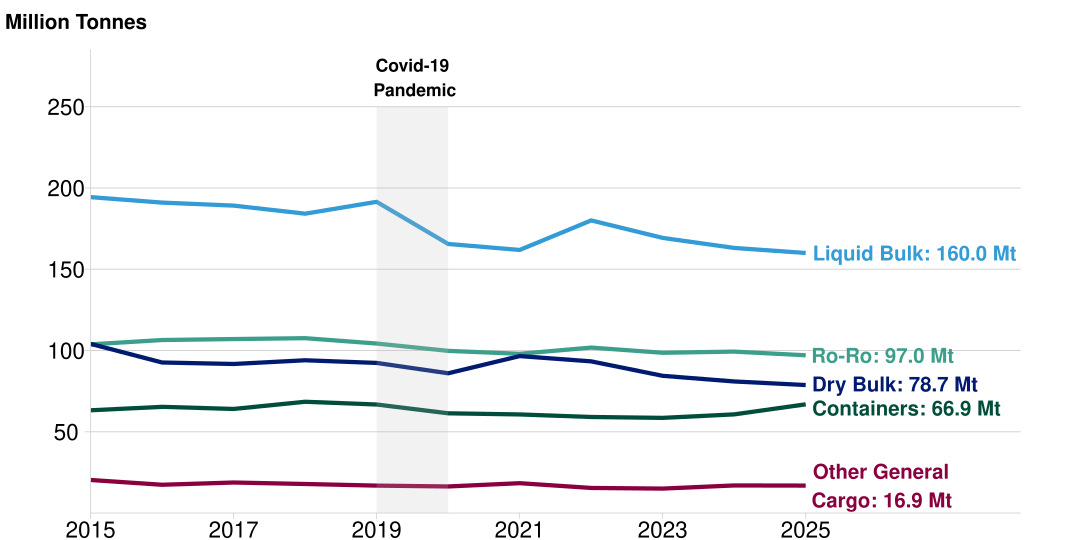
Table 2: UK major port tonnage by cargo group in 2025 and percent changes from 2024 (PORT0201)
| Cargo Group | 2025 tonnage (million tonnes) | % change from 2024 | |
|---|---|---|---|
| Liquid bulk | 160.0 | -2% | |
| Ro-Ro | 97.0 | -2% | |
| Dry bulk | 78.7 | -3% | |
| Containers (Lo-Lo) | 66.9 | 10% | |
| Other general cargo | 16.9 | -0.5% |
Liquid bulk
Definitions
Liquid bulk consists of any liquid or liquid gas carried in the main cargo hold of bulk carrier vessels.
Liquified natural gas (LNG) is natural gas which has been cooled to approximately -160°C, changing its state from gas to liquid. This enables transportation of gas by ship, as the volume is significantly reduced compared to the gaseous state. Following import, LNG is regasified at a terminal and then transported through the gas pipeline network.
Oil products are derivatives of petroleum, including diesel, gasoil, aviation fuel, and gas condensate.
Liquid bulk accounted for 38% (160.0 million tonnes) of tonnage handled at UK ports in 2025, the highest proportion of all cargo groups.
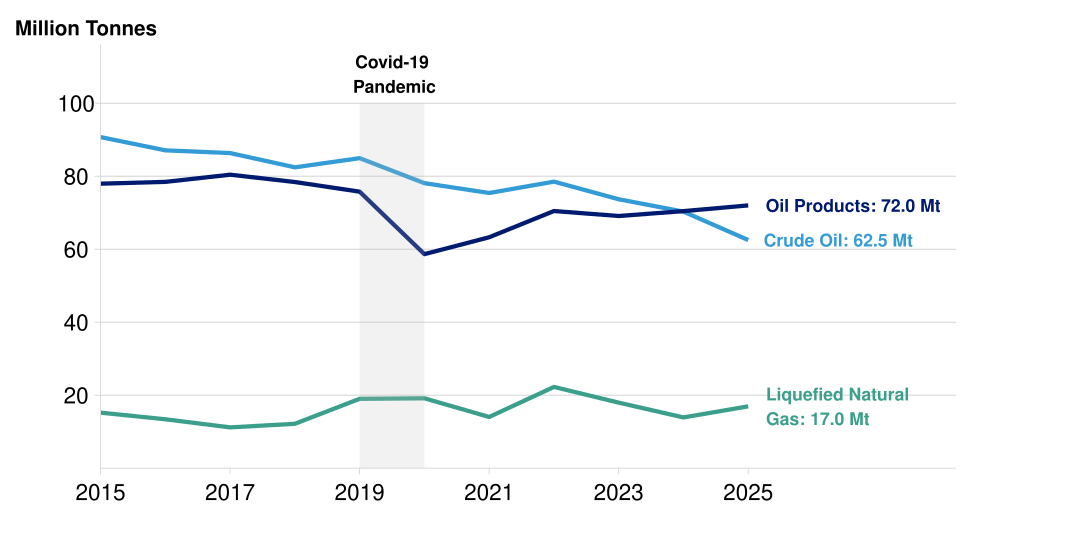
Chart 7 shows trends in liquid bulk tonnage by cargo category. This shows that the overall decline in liquid bulk in 2025 was driven by crude oil, decreasing by 11% from 2024 to 62.5 million tonnes. This decrease was primarily due to the closures of Lindsey oil refinery at Grimsby and Immingham and Finnart oil terminal at Clyde, extending the general downward trend in crude oil over the last decade.
Following a decline in 2024, liquefied natural gas (LNG) recorded the largest increase among liquid bulk cargo categories in 2025, rising by 22% to 17.0 million tonnes, returning to levels recorded in 2023. This increase was driven by a 48% rise in LNG handled at Milford Haven.
Oil products remained the largest liquid bulk category in 2025 (having overtaken crude oil in 2024), increasing by 2% to 72.0 million tonnes, continuing the upward trend observed in recent years.
Chart 7: Liquid bulk tonnage trends from 2015 to 2025 (PORT0201)
Liquefied natural gas (LNG)
LNG accounted for the largest absolute increase in the overall liquid bulk tonnage traffic, rising by 3.0 million tonnes (22%) from 2024 to 17.0 million tonnes in 2025.
In 2025, 96% of all LNG port freight tonnage was moved on international routes. The increase in LNG was driven by a 3.6 million tonne increase in imports (up 32% from 2024). In contrast, LNG exports decreased by 0.5 million tonnes (down 19%).
Europe’s LNG demand spiked in 2022 due to reduced Russian gas imports after the Russia-Ukraine conflict began. The UK has significant regasification capacity and imported large amounts of LNG to convert it to gas, then send to European countries with less regasification infrastructure. Europe has since diversified its gas imports, with other countries expanding or installing infrastructure for LNG imports, influencing fluctuations in LNG in recent years, despite the on-going conflict. For more detail on LNG, go to DESNZ Energy Trends collection.
In 2025, almost three quarters (74%) of the UK’s imports of LNG came from the USA, and USA LNG imports increased to 10.7 million tonnes (up 53% from 2024). According to DESNZ, increased liquefaction capacity in the USA expanded its LNG export capability, contributing to this shift. The UK imports the second largest amount of LNG from Norway, which increased to 1.4 million tonnes (up 17% from 2024). The UK also imports piped gas from Norway which are not included in these port freight statistics. DESNZ reported Norway remained the UK’s largest import source of natural gas in 2025 across shipments and pipelines (DESNZ Energy Trends).
Imports of LNG from Trinidad and Tobago increased to 0.6 million tonnes in 2025 (up 4% from 2024), making it the UK’s third-largest source of LNG imports and overtaking Qatar. Demand for LNG imports was exceptionally high in 2022 – therefore declines in Qatar LNG imports since then reflect the normalisation of European markets, as well as ongoing disruption in the Red Sea impacting global LNG trade flows (for further details, see DESNZ Digest of UK Energy Statistics (DUKES)).
Milford Haven handled 70% of all LNG moved through UK ports in 2025, up from 58% in 2024. This increase was primarily driven by higher LNG imports from the United States to Milford Haven, which increased by 3.5 million tonnes (65%) from 2024 to 2025. Milford Haven is home to two of the UK’s major LNG import terminals, Dragon LNG and South Hook, which provide the necessary and storage and regasification facilities for large volumes of LNG imports.
Crude Oil
Crude oil had the only decline of the liquid bulk categories in 2025, down 7.8 million tonnes (11%) from 2024.
UK exports of crude oil remained at a similar level to 2024. In contrast, UK imports of crude oil decreased by 17% (7.9 million tonnes), driving the overall decline in UK crude oil tonnage in 2025. This decrease reflects reduced capacity for handling imported crude oil following the closures of the Lindsey oil refinery at Grimsby and Immingham and the Finnart oil terminal at Clyde. Clyde recorded the largest overall decrease in crude oil tonnage of any UK port in 2025, declining 83% (3.8 million tonnes).
According to DESNZ Energy Trends, UK oil production reached its lowest level in 2025 since North Sea production began in the 1970s, consistent with the longer-term decline in crude oil volumes handled by UK ports.
Oil Products
Oil products handled by UK ports increased by 1.6 million tonnes (2%) to 72 million tonnes in 2025. This rise was driven by a 9% increase in imports (3.9 million tonnes) despite exports decreasing 8% (2.3 million tonnes).
Increases of imported oil products were largely driven by routes from The Netherlands and the USA in 2025. Oil products imported from The Netherlands had the largest absolute increase in 2025 of 1.7 million tonnes (22%), followed by the USA with an increase of 1.3 million tonnes (27%). The increase in imports from The Netherlands may reflect its role as the UK’s closest major refining and oil trading hub, while reduced UK refining capacity may have increased reliance on imported petroleum products from overseas suppliers.
The increase in imports from the USA and The Netherlands may also reflect a shift in import sources away from Russia following the EU and UK ban on Russian petroleum products in 2023 (see UK government legislation).
Dry Bulk
Definitions
Dry bulk is carried in the main cargo hold of bulk carrier vessels, for example coal, ores, scrap metal and wood pellets.
Other dry bulk consists of anything that does not fit into ores and scrap, coal or agricultural products but is carried in bulk on a bulk carrier vessel, including cement, aggregates and ash.
Wood pellets are a type of biomass fuel made from compressed wood residues, such as sawdust and wood shavings. They are primarily used for energy generation, and are presented as a separate dry bulk cargo type in these statistics for the first time in 2025.
Biomass is a broad term covering all organic material including that from plants, trees (e.g. straw, crops or wood) and animals (e.g. poultry litter). It is considered a renewable form of energy production as biomass growth removes carbon dioxide from the atmosphere and stores it in the soil, plants or trees. Wood pellets are the main form of biomass used in the UK. A new cargo category (in 2025) now tracks wood pellets separately, while other types of biomass remain within the other dry bulk category.
One-port traffic to and from offshore locations such as oil rigs and sea dredging.
Dry bulk tonnage handled by UK ports declined to 78.7 million tonnes in 2025 (down 3% from 2024).
Chart 8 shows trends in dry bulk cargo categories between 2015 and 2025. For the first time, in 2025, wood pellets were reported as a separate dry bulk category to reflect increased interest in this cargo type (previously classified under ‘other dry bulk’). The separation of wood pellets results in a reduction in the level of ‘other dry bulk’ shown in Chart 8, which should be taken into account when comparing 2025 with previous years.
Despite this change in classification, ‘other dry bulk’ remained the largest dry bulk category in 2025. Agricultural products have remained relatively stable over the past decade and were the only dry bulk cargo category to increase in 2025. Ores volumes continue to follow a downward trend in 2025, as do coal volumes, which has remained the smallest dry bulk category since 2019.
In 2025, 9.9 million tonnes of wood pellets were handled at UK ports, the first year this specific cargo category has been reported.
Chart 8: Dry bulk tonnage trends from 2015 to 2025 (PORT0201)
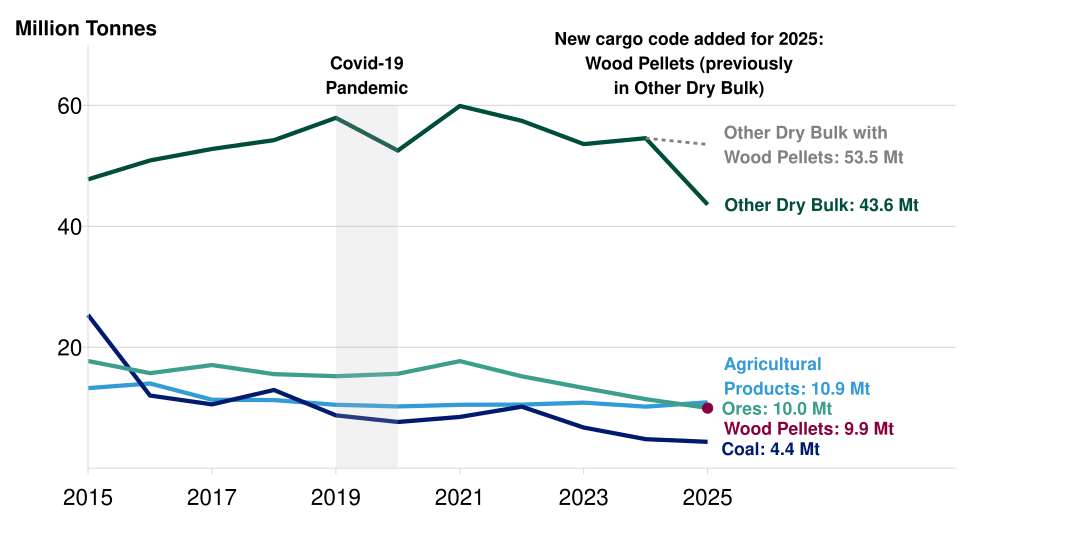
Chart note For all years prior to 2025, wood pellets were included within the other dry bulk category. On this chart, for 2025, wood pellets and other dry bulk are shown both separately and in a combined category.
Other dry bulk
Other dry bulk has been the largest dry bulk category since 2015, driven by changes in energy production, with a shift away from coal towards biomass, predominantly categorised under other dry bulk, except for wood pellets (see DESNZ Energy Trends).
Domestic movements accounted for 19.1 million tonnes (44%) of total other dry bulk handled by UK ports in 2025. Movements of dry bulk are typically aggregates (e.g. sand, gravel and stone) – these materials are used extensively in construction and infrastructure projects.
Wood pellets
Wood pellets, previously classified as ‘other dry bulk’, accounted for 9.9 million tonnes of port traffic in 2025. Wood pellets are the major source of biomass burnt in UK power stations.
The USA was the largest source of UK wood pellet imports in 2025, accounting for 7.6 million tonnes (77%). Increased UK demand for wood pellets is linked to government support for biomass electricity generation through policies aimed at achieving renewable energy targets.
Coal
In 2025, there was a 9% decrease in tonnage of coal handled by UK ports to 4.4 million tonnes. The decline was primarily driven by exports, which fell by 0.4 million tonnes from 2024 to 1.0 million tonnes in 2025.
The last remaining coal-fired power station in the UK, Ratcliffe-on-Soar in Nottinghamshire, closed in 2024, contributing to this decline. Moreover, coal use has been phased out as electricity generation has moved towards gas, nuclear and renewables – DESNZ similarly reported that coal exports fell by 46% in 2025 compared with 2024, reflecting a decrease in coal supply and demand (DESNZ Energy Trends).
Ores
Tonnage of ores handled by UK ports decreased by 1.4 million tonnes (13%) from 2024 to 10.0 million tonnes in 2025. This decrease was largely driven by declines in international imports, which fell 1.4 million tonnes (down 25%), whereas exports maintained similar levels.
The decrease in UK ore imports was mostly attributable to lower volumes at Port Talbot, following the closure of the UK’s final blast furnace used for steelmaking in 2024.
Agricultural products
UK agricultural products tonnage increased by 0.7 million tonnes in 2025 (up 7% from 2024). This increase was driven, in part, by higher volume imports from Brazil and France, which increased by 0.7 million tonnes and 0.6 million tonnes respectively from 2024 to 2025. This is consistent with the continued importance of France and Brazil as suppliers of food, feed and agricultural products to the UK, as reported by the Department for Environment, Food and Rural Affairs (Defra).
Other general cargo
Other general cargo (non-bulk goods carried as individual items or units) showed little change in 2025, down less than 1% from 2024, to 16.9 million tonnes.
In 2025, wind farm products accounted for 0.6 million tonnes of UK port tonnage. Wind farm products were reported as a separate cargo category within the other general cargo group for the first time in 2025 to reflect increased interest in this cargo type. The shipment of wind farm products supports the development, construction and operation of renewable energy infrastructure at offshore wind farms (Associated British Ports).
Tonnage of iron and steel increased by 13% (0.9 million tonnes) to 7.8 million tonnes in 2025. Almost all of this increase was accounted for by imports, which rose by 0.9 million tonnes. The increase in imports may reflect reduced domestic primary steel production following the closure of the UK’s final blast furnace in 2024.
Containers
Definitions
Container traffic (also referred to as Lo-Lo traffic) is measured in both tonnes and units, where 1 unit is 1 container, and tonnage measures the weight of the cargo being carried, excluding the weight of the container itself, so an empty container has a weight of 0. TEU (twenty-foot equivalent units) is a standardised measure that accounts for the different sizes of container boxes.
Transhipment: these statistics collect the port of loading or unloading of the cargo, which may not be the port of ultimate origin or destination. For example, if a ship carrying cargo from Asia unloads/loads the cargo at a European port which is then put on another ship to the UK, our statistics will state the port of load as the European port, rather than the port in Asia.
Short sea: maritime traffic that moves cargo along a coast without having to cross an ocean. This consists of traffic to and from the European Union (EU) and ‘Other Europe and Mediterranean’ countries.
Deep sea: maritime traffic that crosses oceans. This consists of traffic to and from countries in Africa, America, Asia and Australasia. Countries on the Mediterranean coastline, including those in North Africa, are classed under short sea in the port freight series (i.e. Morocco, Algeria, Tunisia, Libya and Egypt).
In 2025, the number of container units handled by UK ports increased by 11% (0.6 million units) and the tonnage of cargo in those containers increased by 10% (6.2 million tonnes).
Charts 9 and 10 show short sea and deep sea container trends in imports and exports over the last decade.
Chart 9: International short and deep sea container tonnage from 2015 to 2025 (PORT0204)
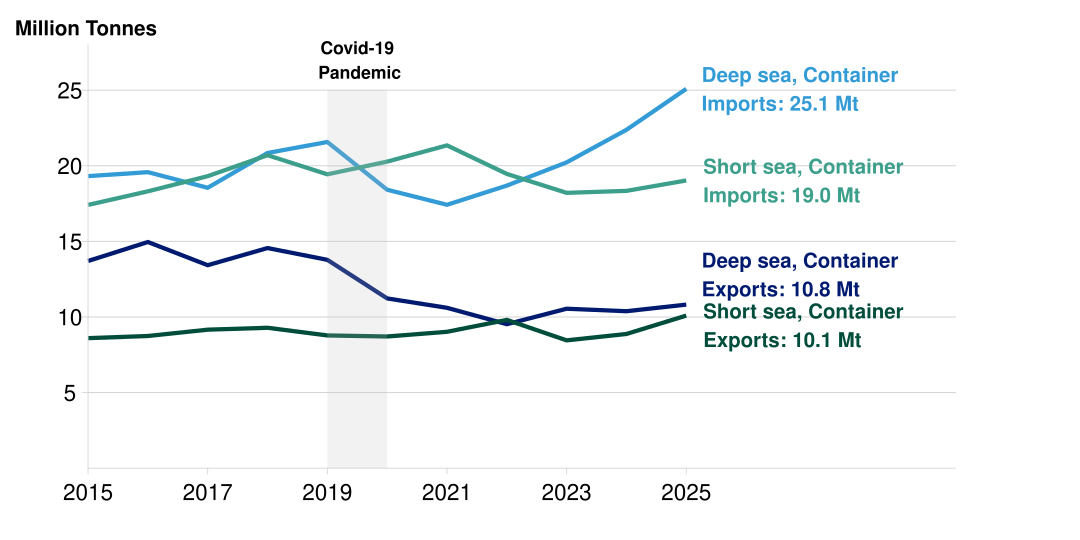
Chart 10: International short and deep sea container unitised traffic from 2015 to 2025 (PORT0204)
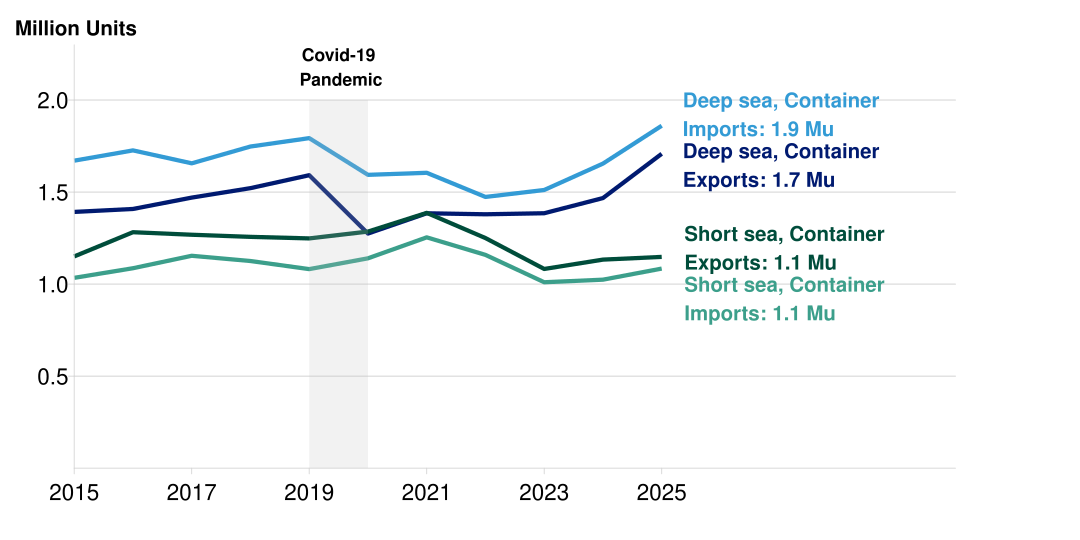
Both deep sea and short sea imports and exports increased in 2025. This growth was largely driven by London, where container traffic has increased by 5.4 million tonnes or 0.5 million units compared to 2024. This rise reflects increased container handling capacity in the region, supported by the opening of London Gateway’s fourth berth, which has enabled the port to accommodate more container vessels and handle higher volumes of container cargo.
Deep sea container tonnage imports had the largest absolute increase of 2.7 million tonnes (12%) from 2024, reaching the highest levels seen in this time series of 25.1 million tonnes in 2025. Container imports from China accounted for the majority of the increase in deep sea tonnage import traffic to the UK. Similarly, deep sea unitised imports had an increase of 0.2 million units (12%) to 1.9 million units in 2025.
In 2025, deep sea tonnage exports increased by 4% (0.4 million tonnes) while deep sea units exports increased by 17% (0.2 million units). The larger percentage increase in units than tonnage suggests a reduction in the average weight per unit exported, which may be due to changes in the mix of goods exported, an increase in lightly loaded or empty containers, or other changes in shipping patterns.
Ro-Ro
Definitions
Roll-on/Roll-off (Ro-Ro) is cargo that can be moved on to, or off, a vessel either by their own propulsion (such as a passenger car) or with assistance (such as an unaccompanied trailer). For more detailed information, see the cargo categorisation flowchart. Ro-Ro is measured in both tonnes and units, where 1 unit is 1 vehicle or trailer, and tonnage measures the weight of the cargo being carried, excluding the weight of the vehicle itself, so an empty unit has a weight of 0.
Accompanied or self-propelled are road goods vehicles carrying freight accompanied by the driver on the sea crossing.
Unaccompanied or non-self-propelled are road goods vehicles without the accompanied cab, rolled on and off the vessel by port operations and collected by a new driver at the destination port.
Chart 11 shows Ro-Ro unitised trends over the last decade. In 2025, UK ports handled 97.0 million tonnes and 15.4 million units of Ro-Ro traffic. Compared to 2024, unitised traffic declined by 3% (0.4 million units), while tonnage traffic declined by 2% (2.3 million tonnes).
Chart 11: Ro-Ro unit trends from 2015 to 2025 (PORT0201)
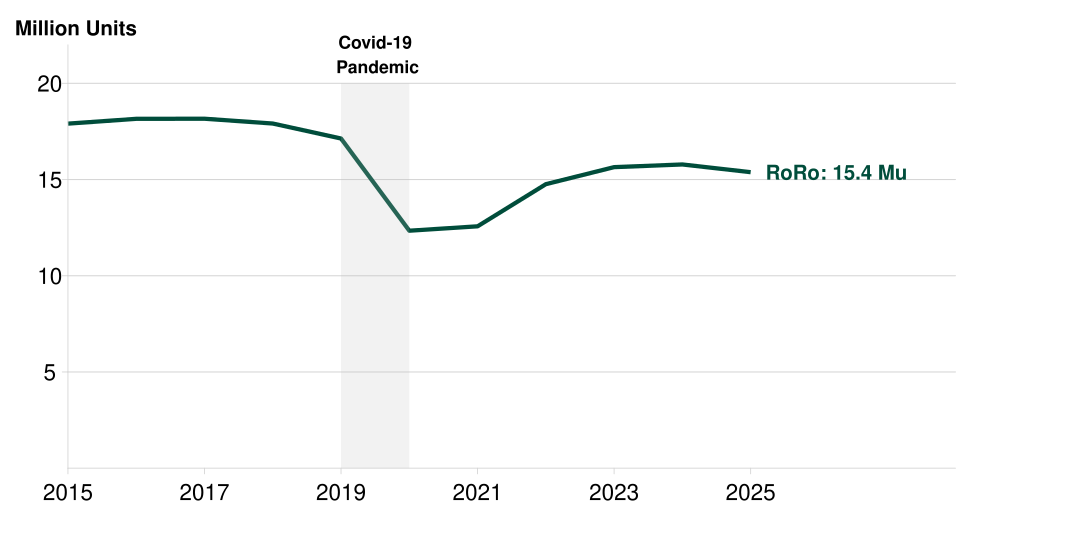
As in previous years, France was the UK’s largest partner country for Ro-Ro traffic, accounting for 21% of total Ro-Ro traffic through UK ports in 2025, followed by The Netherlands (19%). Most Ro-Ro traffic between the UK and these two routes consisted of accompanied road goods vehicles, reflecting the short sea crossings between the UK and mainland Europe.
Dover remained the UK’s largest Ro-Ro port in 2025, handling 18.5 million tonnes (19% of total UK Ro-Ro tonnage), although traffic decreased by 3% compared to 2024. Despite the overall decline in Ro-Ro traffic, some UK ports recorded increases. Liverpool handled an additional 0.4 million tonnes of Ro-Ro from 2024 to 2025. This increase was driven primarily by growth in unaccompanied road goods vehicles, likely reflecting increased capacity on the Dublin-Liverpool freight service. Ro-Ro at Grimsby and Immingham similarly rose 0.4 million tonnes in 2025, likely linked to the new Immingham to Hoek van Holland route.
Background information
The PORT data tables give further detail of the key results presented in this statistical release. They are available from port and domestic waterborne freight statistics.
These notes provide further information such as definitions and a list of UK ports is available in the accompanying port list.
The background quality report provides further information on how the data is collected, quality assured and comparisons with relevant data sources.
Details of Ministers and officials who receive pre-release access to these statistics up to 24 hours before release can be found on the pre-release access list.
Related data sources
His Majesty’s Revenue and Customs (HMRC) publishes data on tonnage and value to a much more granular commodity level for goods traded internationally. Comparisons between port freight and this source, specifically for certain cargo categories, are explored further in our notes and definitions.
The Department for Energy Security and Net Zero (formerly Department for Business, Energy and Industrial Strategy) publish the Digest of UK Energy Statistics (DUKES) which covers the production and consumption of fuels and energy in the UK.
Information on freight moved by different modes, including a breakdown of domestic freight is available in Transport Statistics Great Britain.
Eurostat publish comparative port freight data for European Union countries, which can be used to compare UK ports to those in EU countries.
About these Statistics
These official statistics were independently reviewed by the Office for Statistics Regulation in December 2018. They comply with the standards of trustworthiness, quality and value in the Code of Practice for Statistics and should be labelled ‘accredited official statistics’.
Instructions for printing and saving
Depending on which browser you use and the type of device you use (such as a mobile or laptop) these instructions may vary.
You will find your print and save options in your browser’s menu. You may also have other options available on your device. Tablets and mobile device instructions will be specific to the make and model of the device.
How to search
Select Ctrl and F on a Windows laptop or Command and F on a Mac
This will open a search box in the top right-hand corner of the page. Type the word you are looking for in the search bar and press enter.
Your browser will highlight the word, usually in yellow, wherever it appears on the page. Press enter to move to the next place it appears.
Contact us
Maritime and shipping statistics
Email maritime.stats@dft.gov.uk
Media enquiries 0300 7777 878
To hear more about DfT statistical publications as they are released, follow us on X at DfTstats.