Chapter 13: Overseas trade
Updated 3 September 2026

© Crown copyright 2026
This publication is licensed under the terms of the Open Government Licence v3.0 except where otherwise stated. To view this licence, visit nationalarchives.gov.uk/doc/open-government-licence/version/3 or write to the Information Policy Team, The National Archives, Kew, London TW9 4DU, or email: psi@nationalarchives.gov.uk.
Where we have identified any third party copyright information you will need to obtain permission from the copyright holders concerned.
This publication is available at https://www.gov.uk/government/statistics/agriculture-in-the-united-kingdom-2025/chapter-13-overseas-trade
Summary
Key results for 2025 and comparisons to 2024 in real terms (adjusted for trade price inflation).
- The value of food, feed and drink exports decreased by £0.2 billion (0.9%) to £25.7 billion.
- The value of food, feed and drink imports increased by £3.1 billion (4.8%) to £67.8 billion.
- The trade gap in food, feed and drink increased by £3.3 billion (8.6%) to £42.1 billion.
- Principal destinations for exports were Ireland (£4.6 billion), France (£2.9 billion), the United States (£2.8 billion) and the Netherlands (£1.7 billion).
- The main countries of dispatch for imports into the UK were the Netherlands (£8.1 billion), France (£6.1 billion), Ireland (£5.8 billion) and Belgium (£5.2 billion).
- Whisky continued to have the highest export value, totalling £5.4 billion. This was a decrease of 6.6% compared to the previous year.
- Fresh fruit and vegetables together remained the highest value category for imports, totalling £8.2 billion, an increase of 4.4%.
- Exports of fresh vegetables fell by 15% to £83 million, but exports of fresh fruit rose by 6.0% to £80 million.
Introduction
The Overseas Trade Statistics presented in this chapter are based on data collected by HM Revenue and Customs and are compiled from returns made by importers and exporters. Before the completion of the Single Market in the European Union at the end of 1992, all overseas trade data for the United Kingdom was compiled from Customs declarations made by traders. From the beginning of 1993 until the end of 2020, the collection of trade statistics was divided into two categories: that transacted between the United Kingdom and countries outside the European Union (extra-EU trade) and that between the United Kingdom and its European Union partners (intra-EU trade). In this period, extra-EU trade statistics were compiled, as before, from Customs declarations by importers, exporters and their agents, while intra-EU trade statistics were compiled using a system linked to traders’ VAT returns, known as Intrastat.
In 2021, following the United Kingdom’s withdrawal from the European Union, there was a transitional approach to data collection due to the introduction of staged customs controls for imports from the European Union. All exports from the United Kingdom (except those from Northern Ireland to the EU) were compiled from customs declarations whilst imports to the United Kingdom from the European Union continued to be collected using the Intrastat system. From 2022 onwards, all trade statistics (except imports and exports between Northern Ireland and the European Union, for which Intrastat remains in place) are compiled from Customs declarations. These changes to data collection methods are known to have some impact on the trade statistics and some care should be taken when interpreting changes for recent years.
The trade statistics shown here may not match those shown in the commodities tables in Chapter 8 where, for example, trade in meat includes the carcase weight equivalent of trade in live animals. Additionally, trade in milk is of raw milk before processing, and not of processed and packaged milk and cream as shown here.
Data for 2025 remain provisional until September 2026 and will be updated in next year’s Agriculture in the UK publication.
Value of trade in food, feed and drink
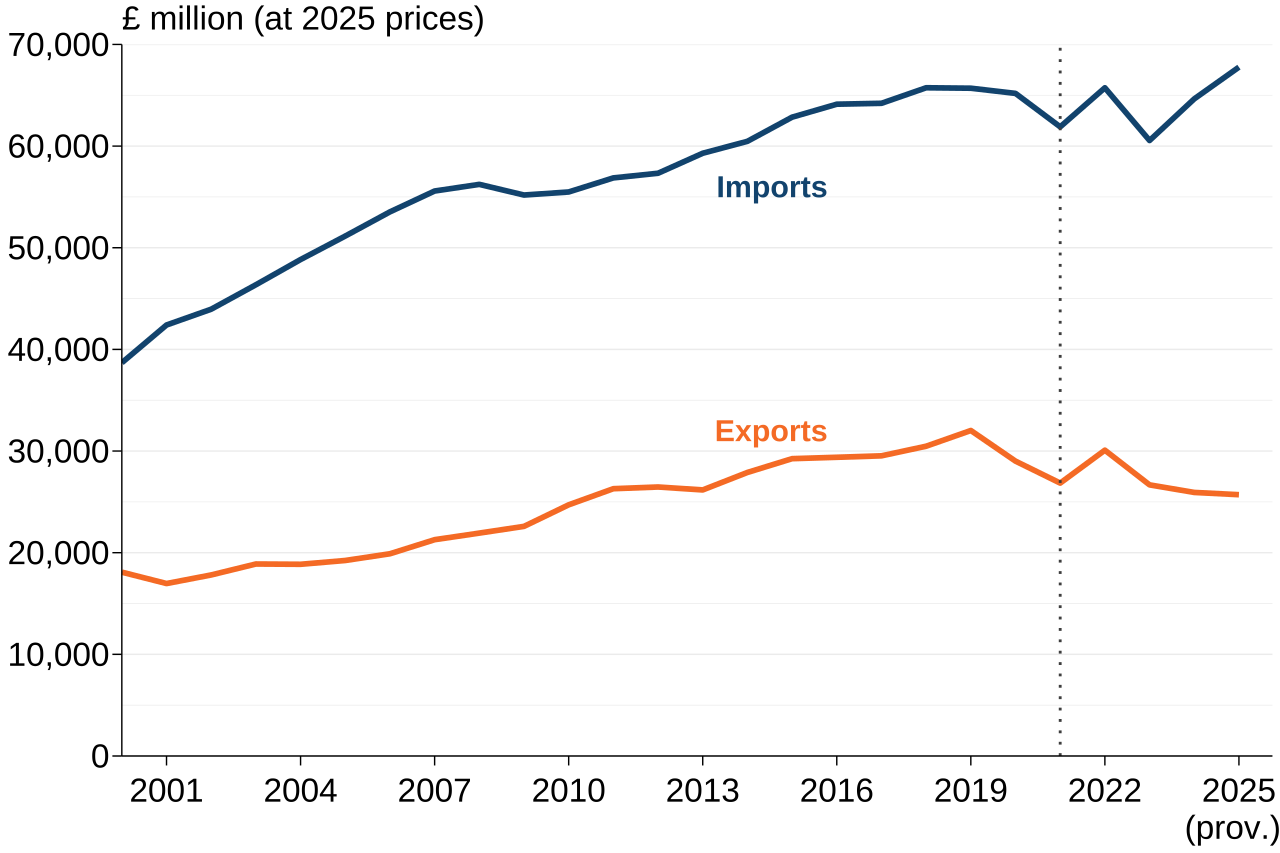
Figure 13.1 Value of trade in food, feed and drink at 2025 prices (£ million); United Kingdom
Enquiries: trade-stats@defra.gov.uk
Source: HMRC
Notes:
- The grey dotted line at 2021 represents the end of the Transition Period. This marks a change in the data source for GB to EU exports, from Intrastat to customs declaration. At the same time, the level of imports from the EU may be lower in 2021 due to the retention of Intrastat for GB to EU imports as a result of staged customs controls. Some imports from the EU to GB were double counted in 2022 following the end of staged customs controls and the change from Intrastat to Customs declarations. This means that trade before and after this point is not directly comparable.
Text description of Figure 13.1: Figure 13.1 is a line chart showing the value of trade in millions of pounds at 2025 prices, split by imports and exports. From 2000 until 2019, the value of both imports and exports steadily increased. Since this point, the trend for exports has been slightly downwards, while the trend for imports has been slightly upwards, albeit with annual fluctuations.
Download the full overseas trade dataset
The value of exports of food, feed and drink was £25.7 billion in 2025. To compare 2025 exports with previous years, it is necessary to adjust for the effects of trade price inflation. After adjusting for trade price inflation, the value of exports decreased by £0.2 billion (0.9%) between 2024 and 2025, and £4.8 billion (16%) compared to 2018 (pre-pandemic and pre-EU Exit).
The value of imports of food, feed and drink was £67.8 billion in 2025. Adjusting for trade price inflation, the value of imports increased by £3.1 billion (4.8%) between 2024 and 2025, and £2.0 billion (3.1%) compared to 2018 (pre-pandemic and pre-EU Exit).
The trade gap for food, feed and drink increased by 8.6% between 2024 and 2025. Over the longer term, after adjusting for trade price inflation, the trade gap has widened by 32% since 2005 from £31.9 billion to £42.1 billion in 2025 (see Figure 13.1).
Value of trade in food, feed and drink by types of commodity
For exports of specific food, feed and drink types, the largest percentage increase, after adjusting for trade price inflation, between 2024 and 2025 was for oils/fats & oilseeds for which there was a rise of 12% to £821 million. The largest percentage reductions, after adjusting for trade price inflation, from 2024 to 2025 were for exports of vegetables & fruit which decreased by 7.5% to £967 million, and for fish & fish preparations which also fell by 7.5% to £2.0 billion (see Table 13.1a).
In real terms, imports of coffee, tea, cocoa, spices, etc. increased by 18% to £7.6 billion between 2024 and 2025. This was followed by imports of fish & fish preparations which increased by 11% to £3.7 billion and meat & meat preparations which rose by 9.2% to £9.3 billion. The largest percentage reduction in imports was for sugars, sugar preparations & honey which fell by 6.9% from 2024 to £1.8 billion in 2025 (see Table 13.1b).
Table 13.1a and 13.1b - Value of trade in food, feed and drink at 2025 prices (£ million); United Kingdom
Enquiries: trade-stats@defra.gov.uk
Table 13.1a Exports
| SITC Division Code | Type | 2023 | 2024 | 2025 |
|---|---|---|---|---|
| Exports | ||||
| 01 | Meat & meat preps | 2,288 | 2,294 | 2,362 |
| 02 | Dairy & eggs | 2,238 | 2,335 | 2,505 |
| 03 | Fish & fish preps | 1,942 | 2,149 | 1,988 |
| 04 | Cereals & cereal preps | 2,701 | 2,397 | 2,516 |
| 05 | Fruit and veg & preps | 1,046 | 1,046 | 967 |
| 06 | Sugar & sugar preps | 479 | 457 | 424 |
| 07 | Coffee, tea, etc. | 1,840 | 1,943 | 2,068 |
| 08 | Animal feed | 1,180 | 1,187 | 1,278 |
| 09 | Misc. edible preps | 2,779 | 2,726 | 2,592 |
| 11 | Beverages | 9,504 | 8,662 | 8,183 |
| 22 + S4 | Oils/fats & oilseeds | 676 | 731 | 821 |
| Total | 26,672 | 25,927 | 25,705 |
Table 13.1b Imports
| SITC Division Code | Type | 2023 | 2024 | 2025 |
|---|---|---|---|---|
| Imports | ||||
| 01 | Meat & meat preps | 7,890 | 8,533 | 9,314 |
| 02 | Dairy & eggs | 3,978 | 4,303 | 4,576 |
| 03 | Fish & fish preps | 3,239 | 3,361 | 3,739 |
| 04 | Cereals & cereal preps | 6,050 | 6,848 | 7,046 |
| 05 | Fruit and veg & preps | 13,050 | 14,593 | 15,049 |
| 06 | Sugar & sugar preps | 2,137 | 1,928 | 1,795 |
| 07 | Coffee, tea, etc. | 5,661 | 6,419 | 7,552 |
| 08 | Animal feed | 3,274 | 3,375 | 3,502 |
| 09 | Misc. edible preps | 4,736 | 4,871 | 4,675 |
| 11 | Beverages | 7,813 | 7,534 | 7,470 |
| 22 + S4 | Oils/fats & oilseeds | 2,724 | 2,879 | 3,049 |
| Total | 60,552 | 64,645 | 67,769 |
Source: HMRC
Table 13.1c and 13.1d - Value of trade in food, feed and drink with EU countries at 2025 prices (£ million); United Kingdom
Enquiries: trade-stats@defra.gov.uk
Table 13.1c Exports
| SITC Division Code | Type | 2023 | 2024 | 2025 |
|---|---|---|---|---|
| Exports | ||||
| 01 | Meat & meat preps | 1,834 | 1,836 | 1,889 |
| 02 | Dairy & eggs | 1,658 | 1,764 | 1,801 |
| 03 | Fish & fish preps | 1,299 | 1,406 | 1,251 |
| 04 | Cereals & cereal preps | 2,010 | 1,699 | 1,772 |
| 05 | Fruit and veg & preps | 740 | 739 | 701 |
| 06 | Sugar & sugar preps | 299 | 341 | 293 |
| 07 | Coffee, tea, etc. | 1,292 | 1,435 | 1,562 |
| 08 | Animal feed | 687 | 689 | 696 |
| 09 | Misc. edible preps | 1,626 | 1,581 | 1,406 |
| 11 | Beverages | 3,463 | 3,250 | 2,890 |
| 22 + S4 | Oils/fats & oilseeds | 564 | 517 | 600 |
| Total | 15,473 | 15,255 | 14,861 |
Table 13.1d Imports
| SITC Division Code | Type | 2023 | 2024 | 2025 |
|---|---|---|---|---|
| Imports | ||||
| 01 | Meat & meat preps | 6,575 | 6,795 | 7,120 |
| 02 | Dairy & eggs | 3,929 | 4,204 | 4,419 |
| 03 | Fish & fish preps | 828 | 762 | 771 |
| 04 | Cereals & cereal preps | 4,940 | 5,658 | 5,650 |
| 05 | Fruit and veg & preps | 8,478 | 9,258 | 9,169 |
| 06 | Sugar & sugar preps | 1,378 | 1,258 | 1,129 |
| 07 | Coffee, tea, etc. | 4,037 | 4,578 | 5,096 |
| 08 | Animal feed | 2,001 | 2,037 | 2,084 |
| 09 | Misc. edible preps | 3,901 | 3,953 | 3,734 |
| 11 | Beverages | 6,430 | 6,109 | 6,001 |
| 22 + S4 | Oils/fats & oilseeds | 1,604 | 1,678 | 1,852 |
| Total | 44,101 | 46,289 | 47,025 |
Source: HMRC
Table 13.1e and 13.1f - Value of trade in food, feed and drink with non-EU countries at 2025 prices (£ million); United Kingdom
Enquiries: trade-stats@defra.gov.uk
Table 13.1e Exports
| SITC Division Code | Type | 2023 | 2024 | 2025 |
|---|---|---|---|---|
| Exports | ||||
| 01 | Meat & meat preps | 454 | 458 | 473 |
| 02 | Dairy & eggs | 580 | 572 | 704 |
| 03 | Fish & fish preps | 643 | 743 | 737 |
| 04 | Cereals & cereal preps | 691 | 698 | 744 |
| 05 | Fruit and veg & preps | 306 | 307 | 266 |
| 06 | Sugar & sugar preps | 181 | 116 | 131 |
| 07 | Coffee, tea, etc. | 548 | 508 | 505 |
| 08 | Animal feed | 493 | 498 | 582 |
| 09 | Misc. edible preps | 1,153 | 1,145 | 1,186 |
| 11 | Beverages | 6,040 | 5,413 | 5,293 |
| 22 + S4 | Oils/fats & oilseeds | 112 | 215 | 221 |
| Total | 11,199 | 10,672 | 10,845 |
Table 13.1f Imports
| SITC Division Code | Type | 2023 | 2024 | 2025 |
|---|---|---|---|---|
| Imports | ||||
| 01 | Meat & meat preps | 1,315 | 1,738 | 2,193 |
| 02 | Dairy & eggs | 49 | 99 | 157 |
| 03 | Fish & fish preps | 2,411 | 2,599 | 2,968 |
| 04 | Cereals & cereal preps | 1,110 | 1,190 | 1,396 |
| 05 | Fruit and veg & preps | 4,572 | 5,335 | 5,880 |
| 06 | Sugar & sugar preps | 759 | 671 | 667 |
| 07 | Coffee, tea, etc. | 1,624 | 1,841 | 2,456 |
| 08 | Animal feed | 1,273 | 1,338 | 1,418 |
| 09 | Misc. edible preps | 835 | 918 | 941 |
| 11 | Beverages | 1,383 | 1,425 | 1,470 |
| 22 + S4 | Oils/fats & oilseeds | 1,120 | 1,201 | 1,198 |
| Total | 16,451 | 18,355 | 20,744 |
Source: HMRC
Notes for Tables 13.1a to 13.1f:
Defra’s aggregate ‘Food, Feed and Drink’ is composed of the following divisions from the Standard International Trade Classification:
- Meat [01]: meat from cattle, sheep, pigs, goats, poultry, horses etc.; preparations including blood, juices, sausages, livers, offal.
- Dairy [02]: includes milk (skimmed or otherwise), butter, buttermilk, cream, yoghurt, ice cream, whey, cheese and curd, all types of eggs both in and out of shell.
- Fish [03]: All types of edible marine life excluding mammals, fresh, frozen, processed, prepared or preserved.
- Cereals [04]: includes rice, wheat, barley, oats, maize, grain sorghum and preparations including sweet biscuits, waffles, gingerbread, and uncooked/unstuffed pasta.
- Fruit and vegetables [05]: includes fresh, frozen or prepared fruit (except crystallised) and vegetables, nuts (except groundnuts), vegetable and fruit juices of all kinds except wine (see division 11), jams, marmalades, fruit or nut puree/paste etc.
- Sugar [06]: includes both natural sugar and sugar confectionery (but not chocolate or cocoa), both natural and artificial honey, and liquorice.
- Coffee, tea, etc. [07]: includes all types of tea, coffee (e.g. green, decaffeinated), extracts and substitutes thereof; cocoa and chocolate (of all kinds): all kinds of spices.
- Animal feed [08]: includes hay, fodder, bran, sharps and other residues derived from cereals or leguminous plants, oil-cake and other solid residues, other residues, brewing dregs, all types of pet or animal food.
- Miscellaneous [09]: includes margarine, shortening, homogenised products or preparations not elsewhere specified, sauces, vinegar, soups, yeasts, cooked/stuffed pasta, food preparations for infant use.
- Beverages [11]: includes alcoholic drinks of all kinds; also natural or artificial mineral and aerated waters sweetened or otherwise.
- Oils [22+S4]: includes groundnuts (peanuts), soya beans, sunflower seeds, rape seeds, palm nuts, linseed, poppy seeds etc., lard, pig fat, olive oil, rape oil, corn oil, linseed oil, beeswax etc.
- Division 00, which covers all live animals, is excluded from the aggregate ‘Food, Feed and Drink’ because it includes non-food animals, particularly race horses. S4 stands for Section 4 in the SITC and covers animal and vegetable oils, fats and waxes.
- Figures for 2025 are provisional and subject to revision.
Download the full overseas trade dataset
Total value of trade in food, feed and drink by trading partner
Figure 13.2 Exports of food, feed and drink by country of destination 2025 (£ million); United Kingdom
Enquiries: trade-stats@defra.gov.uk
| Country | £ million |
|---|---|
| Ireland | 4606 |
| France | 2884 |
| United States | 2770 |
| Netherlands | 1732 |
| Germany | 1153 |
| Belgium | 930 |
| Spain | 803 |
| China | 741 |
| Italy | 532 |
| Poland | 512 |
Source: HMRC
Download the full overseas trade dataset
The UK’s top food, feed and drink export country of destination in 2025 was Ireland, with a value of £4.6 billion accounting for 17.9% of total food, feed and drink exports. Exports to the top ten food, feed and drink countries of destination were worth a combined value of £16.7 billion in 2025, accounting for 64.8% of total UK food, feed and drink exports.
Figure 13.3 Imports of food, feed and drink by country of dispatch 2025 (£ million); United Kingdom
Enquiries: trade-stats@defra.gov.uk
| Country | £ million |
|---|---|
| Netherlands | 8086 |
| France | 6091 |
| Ireland | 5814 |
| Belgium | 5247 |
| Germany | 4864 |
| Spain | 4357 |
| Italy | 4269 |
| Poland | 3432 |
| United States | 1461 |
| Brazil | 1432 |
Source: HMRC
Download the full overseas trade dataset
The UK’s top food, feed and drink import country of dispatch in 2025 was the Netherlands, with a value of £8.1 billion accounting for 11.9% of total food, feed and drink imports. Imports from the top ten food, feed and drink countries of dispatch were worth a combined value of £45.1 billion of in 2025, accounting for 66.5% of total UK food, feed and drink imports.
Value of exports and imports by degree of processing
Trade in food, feed and drink covers a wide range of products from raw agricultural commodities through to lightly processed foods such as meat, cheese and butter, powdered milk, flour and sugar to highly processed products such as confectionery, canned meats, jams, alcoholic drinks and ice cream. By grouping foods into unprocessed, lightly processed and highly processed, additional insights in trading patterns can be found.
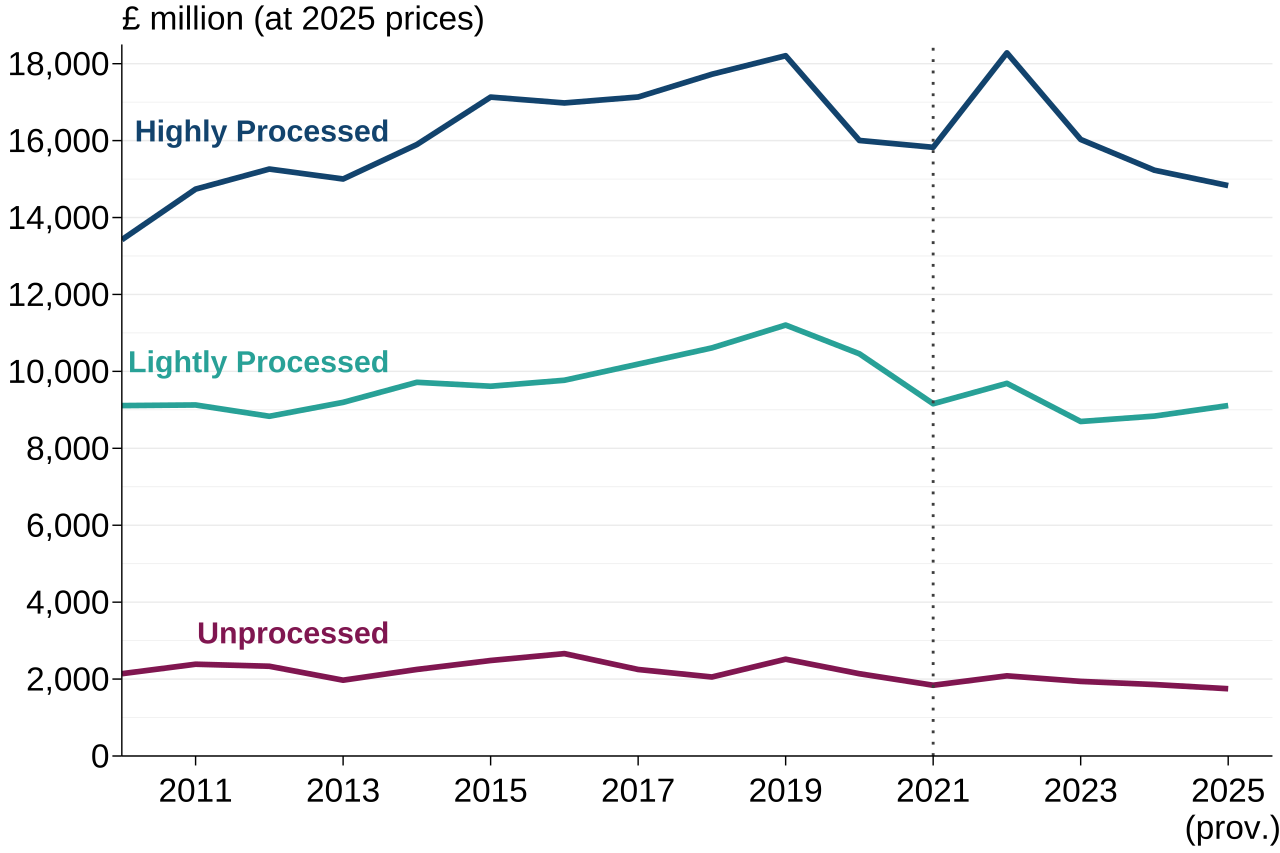
Figure 13.4 Exports in food, feed and drink by degree of processing at 2025 prices (£ million); United Kingdom
Enquiries: trade-stats@defra.gov.uk
Source: HMRC
Notes:
- The grey dotted line at 2021 represents the end of the Transition Period. This marks a change in the data source for GB to EU exports, from Intrastat to customs declaration. This means that trade before and after this point is not directly comparable.
Text description of Figure 13.4: Figure 13.4 is a line chart showing the value of food, feed, and drink exports in millions of pounds at 2025 prices, broken down by degree of processing. Between 2010 and 2019, exports of highly and lightly processed goods increased steadily. Since 2019, exports for both categories have tended to decline, but with greater fluctuation for highly processed goods. Between 2010 and 2019, exports of unprocessed goods remained relatively stable. There has been a very gradual decline in exports of unprocessed goods since 2019.
Download the full overseas trade dataset
Exports of highly processed foods such as confectionery, canned meats, jams, alcoholic drinks and ice cream were 13% lower in 2025 than in 2015 after adjusting for trade price inflation. Exports of lightly processed food and drink, i.e. goods that retain their raw recognisable form, such as meat, cheese, butter, and oils & fats were 5.2% lower in 2025 than in 2015 after adjusting for trade price inflation. Exports of unprocessed commodities, such as fresh fruit & vegetables, nuts, un-milled cereal and eggs, were 30% lower in 2025 than in 2015 after adjusting for trade price inflation (see Figure 13.4).
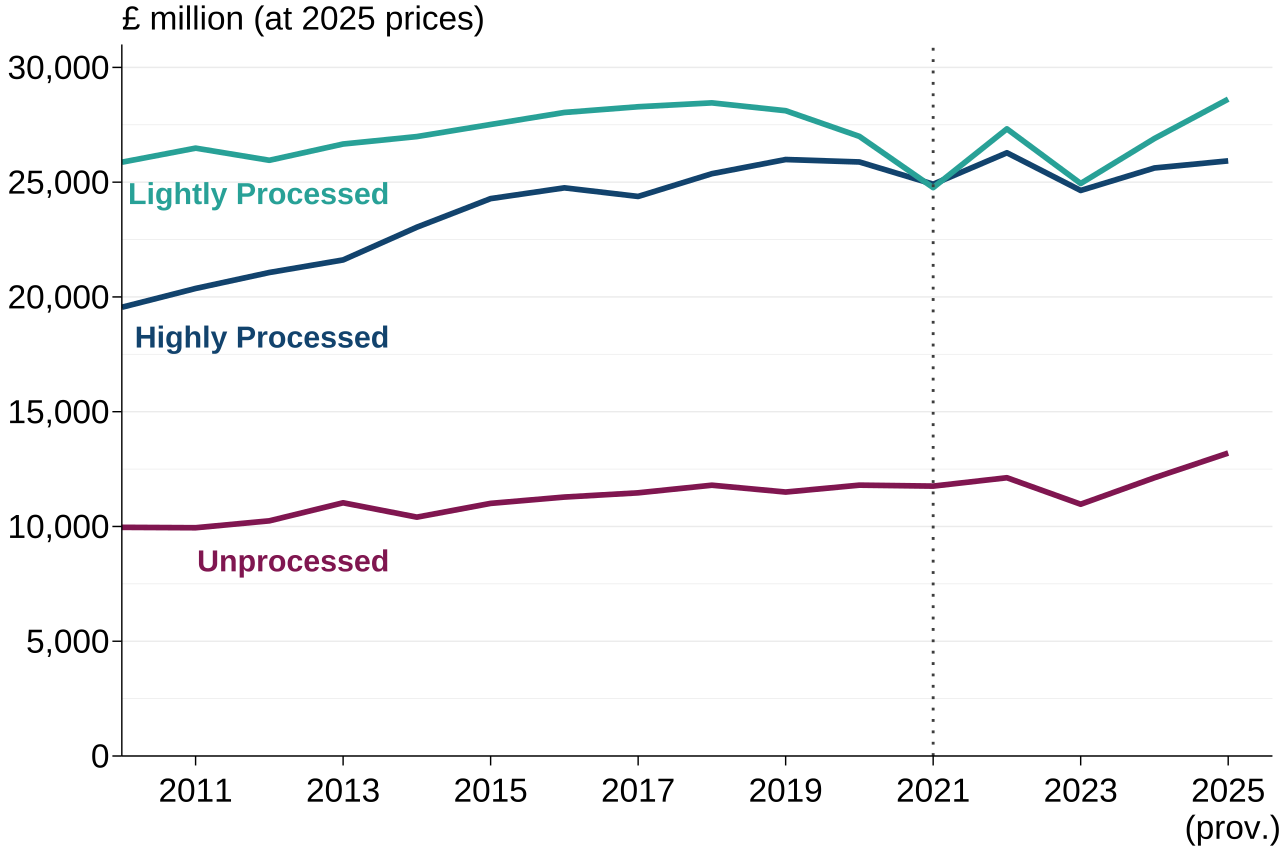
Figure 13.5 Imports in food, feed and drink by degree of processing at 2025 prices (£ million); United Kingdom
Enquiries: trade-stats@defra.gov.uk
Source: HMRC
Notes:
- The grey dotted line at 2021 represents the end of the Transition Period. The level of imports from the EU may be lower in 2021 due to the retention of Intrastat for GB to EU imports as a result of staged customs controls. Some imports from the EU to GB were double counted in 2022 following the end of staged customs controls and the change from Intrastat to Customs declarations. This means that trade before and after this point is not directly comparable.
Text description of Figure 13.5: Figure 13.5 is a line chart showing the value of food, feed, and drink imports in millions of pounds at 2025 prices, broken down by degree of processing. Between 2010 and 2019, imports of lightly and highly processed goods increased steadily. Imports of highly processed goods have broadly stabilised since 2020, albeit with some small annual fluctuations. Imports of lightly processed goods were below pre-pandemic levels between 2020 and 2024, but have increased in 2025. Between 2010 and 2022, imports of unprocessed goods increased steadily, but fell in 2023 before recovering in 2024 and 2025.
Download the full overseas trade dataset
After adjusting for trade price inflation, imports of highly processed food and drink were 6.8% higher in 2025 than in 2015. Imports of lightly processed food and drink were 4.0% higher and imports of unprocessed commodities were 20% higher in 2025 than in 2015 (see Figure 13.5).
Value and volume of trade in key commodities
Historically, the value of exports across a range of commodities broadly tended to increase year on year. However, in 2014 and 2015, commodity prices for many sectors fell due to a slowdown in global economic markets and the effect of exchange rates. Subsequent years saw a return to export growth in most of the main product groups. Since 2018, the COVID-19 pandemic and EU Exit (including changes to data collection methods) have affected trade statistics.
After adjusting for trade price inflation, the value of exports of whisky, the highest valued individual food, feed and drink export item, decreased by 6.6% in real terms from 2024 to £5.4 billion in 2025, but was 14% lower than 2015. Exports of salmon decreased by 13% from 2024 to £914 million in 2025 but were 6.4% higher than in 2015 in real terms, after adjusting for trade price inflation (see Table 13.2a). The value of exports of unmilled wheat rose to £43 million (an increase of 21% in real terms from 2024), but remains well below previous years, driven by a lower UK harvest for the second consecutive year. Note that trade for this commodity can fluctuate considerably between years, influenced by various conditions such as the quality and size of the UK harvest and global commodity prices.
In 2025, exports of cheese were £974 million, a 1.8% increase compared with 2024 after adjusting for trade price inflation. Exports of breakfast cereals and pork fell for the fifth consecutive year. Breakfast cereal exports decreased by 0.7% between 2024 and 2025 to £513 million, while exports of pork reduced by 10% to £238 million (see Table 13.2a).
Imports of fresh fruit rose by 8.4% in real terms from 2024 to £5.0 billion in 2025, after adjusting for trade price inflation. Over the same period, fresh vegetable imports decreased by 1.3% to £3.2 billion. Both figures remain above levels observed prior to the COVID-19 pandemic and the UK’s exit from the EU. Imports of unmilled wheat decreased by 12% between 2024 and 2025, after adjusting for trade price inflation, to £601 million (see Table 13.2b).
The value of wine imports decreased by 5.0% in real terms, after adjusting for trade price inflation, from 2024 to £3.7 billion in 2025 (see Table 13.2b), while the value of wine exported from the UK decreased by 7.5% from 2024 to £373 million in 2025 (see Table 13.2a).
The overall volume of exports of food, feed and drink increased by 4.4% from 2024 to 11.3 million tonnes in 2025. Despite this slight increase, the trend over the last decade has been slightly downwards. Import volumes have fluctuated over the past decade, reaching a peak in 2025 at 44.1 million tonnes. This is an increase of 2.1% compared with 2024 and 14% compared with 2015. Source: HMRC.
The food, feed and drink index provides a comparison of trade which accounts for the value density of different food groups. For example, high value per tonne exports (e.g. whisky) are given more weight in this indicator than low value per tonne exports (e.g. wheat and barley). According to the index, food, feed and drink exports in 2025 increased by 1.2% from 2024, while imports increased by 0.7% (see Tables 13.3a & 13.3b).
Table 13.2a and 13.2b Trade in key commodities in real terms at 2025 prices (£ million); United Kingdom
Enquiries: trade-stats@defra.gov.uk
Table 13.2a Exports
| Commodity | 2023 | 2024 | 2025 |
|---|---|---|---|
| Whisky | 6,438 | 5,810 | 5,427 |
| Wine | 562 | 403 | 373 |
| Cheese | 880 | 957 | 974 |
| Poultry meat | 216 | 226 | 224 |
| Poultry meat products | 132 | 122 | 102 |
| Beef and veal | 557 | 619 | 728 |
| Wheat, unmilled | 280 | 36 | 43 |
| Lamb and mutton | 624 | 639 | 655 |
| Pork | 303 | 265 | 238 |
| Breakfast cereals | 550 | 517 | 513 |
| Milk and cream | 407 | 453 | 484 |
| Bacon and ham | 54 | 35 | 30 |
| Butter | 241 | 249 | 289 |
| Eggs and egg products | 115 | 152 | 152 |
| Fresh vegetables | 86 | 98 | 83 |
| Fresh fruit | 74 | 76 | 80 |
| Salmon (inc. smoked) | 757 | 1,049 | 914 |
Table 13.2b Imports
| Commodity | 2023 | 2024 | 2025 |
|---|---|---|---|
| Whisky | 214 | 188 | 192 |
| Wine | 4,146 | 3,938 | 3,742 |
| Cheese | 1,995 | 2,116 | 2,273 |
| Poultry meat | 1,524 | 1,642 | 1,995 |
| Poultry meat products | 1,568 | 1,733 | 1,802 |
| Beef and veal | 1,203 | 1,390 | 1,785 |
| Wheat, unmilled | 454 | 685 | 601 |
| Lamb and mutton | 230 | 345 | 423 |
| Pork | 936 | 952 | 844 |
| Breakfast cereals | 354 | 379 | 407 |
| Milk and cream | 160 | 233 | 213 |
| Bacon and ham | 650 | 652 | 613 |
| Butter | 253 | 315 | 348 |
| Eggs and egg products | 355 | 308 | 326 |
| Fresh vegetables | 3,072 | 3,238 | 3,194 |
| Fresh fruit | 3,975 | 4,598 | 4,985 |
| Salmon (inc. smoked) | 637 | 652 | 662 |
Source: HMRC
Notes: See notes for Table 13.3
Download the full overseas trade dataset
Table 13.3a and 13.3b Trade in key commodities by volume (thousand tonnes unless otherwise specified); United Kingdom
Enquiries: trade-stats@defra.gov.uk
Table 13.3a Exports
| Commodity | 2023 | 2024 | 2025 |
|---|---|---|---|
| Whisky (million litres pure alcohol) | 387 | 400 | 383 |
| Wine (million litres) | 26 | 20 | 23 |
| Cheese | 180 | 197 | 207 |
| Poultry meat | 205 | 225 | 222 |
| Poultry meat products | 28 | 25 | 27 |
| Beef and veal | 104 | 113 | 112 |
| Wheat, unmilled | 1,155 | 166 | 208 |
| Lamb and mutton | 85 | 80 | 87 |
| Pork | 130 | 122 | 128 |
| Breakfast cereals | 160 | 151 | 145 |
| Milk and cream | 769 | 789 | 838 |
| Bacon and ham | 14 | 10 | 10 |
| Butter | 54 | 43 | 50 |
| Eggs and egg products | 30 | 34 | 25 |
| Fresh vegetables | 75 | 75 | 69 |
| Fresh fruit | 36 | 34 | 39 |
| Salmon (inc. smoked) | 77 | 116 | 122 |
| Food, feed and drink index, 2009=100 | 106 | 108 | 110 |
Table 13.3b Imports
| Commodity | 2023 | 2024 | 2025 |
|---|---|---|---|
| Whisky (million litres pure alcohol) | 20 | 16 | 15 |
| Wine (million litres) | 1,249 | 1,277 | 1,200 |
| Cheese | 434 | 451 | 472 |
| Poultry meat | 515 | 534 | 578 |
| Poultry meat products | 439 | 474 | 491 |
| Beef and veal | 224 | 241 | 242 |
| Wheat, unmilled | 1,708 | 3,084 | 2,675 |
| Lamb and mutton | 48 | 68 | 70 |
| Pork | 332 | 340 | 322 |
| Breakfast cereals | 131 | 134 | 137 |
| Milk and cream | 237 | 266 | 251 |
| Bacon and ham | 181 | 177 | 171 |
| Butter | 58 | 64 | 60 |
| Eggs and egg products | 106 | 106 | 110 |
| Fresh vegetables | 2,063 | 2,179 | 2,113 |
| Fresh fruit | 3,148 | 3,298 | 3,569 |
| Salmon (inc. smoked) | 84 | 87 | 90 |
| Food, feed and drink index, 2009=100 | 115 | 120 | 121 |
Source: HMRC
Notes for Tables 13.2 and 13.3:
- Figures for 2025 are provisional and subject to revision
- Whisky includes bourbon, scotch (malted and blended) and other whiskies.
- Wine includes grape must, vermouth and wine of fresh grapes (sparkling and still).
- Cheese includes grated or powdered, processed, blue-veined and fresh (e.g. curd).
- Poultry meat (inc. poultry offal) includes carcase meat, cuts and offal (inc. liver).
- Poultry meat products includes prepared, preserved, salted or cooked poultry meat and offal (inc. liver).
- Beef and veal includes carcase meat and cuts, both bone-in and boneless.
- Wheat, unmilled includes durum, other wheat (inc. spelt) and meslin.
- Lamb and mutton includes carcase meat and cuts, both bone-in and boneless.
- Pork includes carcase meat and cuts, both bone-in and boneless.
- Breakfast cereals includes cereal grains worked or prepared for breakfast cereals
- Milk and cream includes milk (inc. skimmed milk) and cream, not concentrated or sweetened.
- Fresh vegetables excludes potatoes, dried legumes and processed vegetables.
- Fresh fruit excludes jams, juices, dried and processed fruit.
- Salmon (inc. smoked) includes fresh, chilled, frozen or smoked, but not canned.
- Note: Definitions of ‘fresh vegetables’ and ‘fresh fruit’ used have been revised in 2009 to be consistent with those used for AUK Chapter 5.