MOD regional expenditure with UK industry and commerce and supported employment 2021/22 (revised August 2023)
Updated 3 August 2023

© Crown copyright 2023
This publication is licensed under the terms of the Open Government Licence v3.0 except where otherwise stated. To view this licence, visit nationalarchives.gov.uk/doc/open-government-licence/version/3 or write to the Information Policy Team, The National Archives, Kew, London TW9 4DU, or email: psi@nationalarchives.gov.uk.
Where we have identified any third party copyright information you will need to obtain permission from the copyright holders concerned.
This publication is available at https://www.gov.uk/government/statistics/mod-regional-expenditure-with-uk-industry-and-supported-employment-202122/mod-regional-expenditure-with-uk-industry-and-commerce-and-supported-employment-202122
The Finance & Economics Statistical Bulletin series provides figures on the composition and scope of the Department’s expenditure, information on the impact of defence spending on the wider economy, and compares Ministry of Defence (MOD) spending to that of other departments and countries.
This publication presents MOD expenditure with UK industry and commerce in 2021/22 by UK region and industry group. The number of direct and indirect jobs supported by this expenditure in the UK is also presented. This publication includes direct MOD expenditure with UK industry and commerce only, and excludes all other MOD spend types.
This publication has been revised to now include estimates of jobs supported in 2021/22 through MOD expenditure with UK industry.
For 2022/23 and onwards this publication will be split in to two separate statistics; one on MOD expenditure with Industry and one on MOD supported employment estimates. The two publications will continue to provide all the information contained within this bulletin but will enable a timelier release of the expenditure statistics. To provide feedback on this change please email the department: Analysis-Expenditure-PQ-FOI@mod.gov.uk.
1. Key Points
| £21.1bn | Total MOD expenditure with UK industry and commerce. |
| This represents a 3% increase on the reported expenditure for 2021/22, when accounting for inflation. | |
| £310 | MOD expenditure with UK industry for each person living in the UK. |
| This is consistent with the £310 reported in 2020/21. | |
| 5% | Proportion of direct MOD expenditure with UK Industry with Small and Medium-sized Enterprises. |
| This translates to just under £1 billion spending with SMEs. | |
| 209,000 | Total number of direct and indirect jobs supported through MOD expenditure with UK industry. |
| This is comprised of 130,000 direct jobs and 79,000 indirect job, down from a combined total of 219,000 in 2020/21. | |
| 1 in 120 | Proportion of all direct and indirect jobs in the UK which are supported as a result of MOD expenditure with UK industry. |
| A similar proportion as reported the previous year. | |
| 406,000 | The total number of UK jobs supported when combining jobs supported in industry with MOD civilian and UK Regular Armed Forces personnel based in the UK. |
| The equivalent of more than 1 in every 70 UK jobs. | |
| 70% | The rise in MOD expenditure in Northern Ireland compared to the previous year. |
| The increased expenditure accounting for an additional 200 jobs supported. |
Responsible Statistician: Analysis-Expenditure Head of Branch
Telephone: 030 679 84442
Further information/mailing list: Analysis-Expenditure-PQ-FOI@mod.gov.uk
Background Quality Report: Background Quality Report
Would you like to be added to our contact list, so that we can inform you about updates to these statistics and consult you if we are thinking of making changes? You can subscribe to updates by emailing Analysis-Publications@mod.gov.uk.
2. Introduction
This publication provides statistics on direct MOD expenditure with UK industry and commerce. Industry is defined as an economic activity concerned with the procurement and processing of raw materials into finished products. Commerce is defined as a business activity where goods and services are exchanged for value. Hereafter, direct MOD expenditure with UK industry and commerce will be referred to as MOD expenditure. Tables and figures present statistics for the most recent financial year and comparisons will be made in the narrative to previous financial years where appropriate. Detailed statistics can be found in the supporting data tables.
MOD expenditure will be presented in the following ways:
- by ITL Level 1 regions.
- per person by UK region, to provide some context to the expenditure figures. By presenting expenditure per person the population differences between regions are accounted for.
- by industry group.
- the total amount spent with Small and Medium-sized Enterprises (SMEs), by ITL Level 1 regions.
Direct jobs will be presented:
- by ITL Level 1 regions.
- as the number of FTE jobs supported for every 100,000 people in FTE employment in each region. This measure is similar to the per person expenditure figure as it considers the employment levels of each region and will make these figures more directly comparable.
- by industry group.
Indirect jobs will be presented by industry group only. No reliable regional split can currently be given as there are no regional Input-Output Analytical Tables available from the Office for National Statistics (ONS) from which these estimates are derived. The limitations of this are discussed further in the Methodology and Background Quality Report.
Revision
This publication was revised in August 2023 to include estimates of the jobs supported by MOD expenditure with UK Industry for 2021/22. At the time of the original publication in January 2023, the MOD were only able to publish expenditure figures. This was due to a delay in employment and turnover data from the Office for National Statistics (ONS) which is now available and has been published by the ONS.
Context
Estimates on regional expenditure and jobs supported have been produced in recent years within the Regional Expenditure bulletin series.
Prior to this, regional expenditure with UK industry were published as part of the UK Defence Statistics (UKDS) publication, before ceasing in 2009.
Comparisons over time: overall
These statistics are based on MOD contract information and display natural variability. As a result, we would expect total expenditure to fluctuate year-on-year due to large value contracts starting and ending across different financial years or large one-off payments occurring. MOD Direct Expenditure figures published up until 2009 in UK Defence Statistics showed a similar amount of variation between years to the figures presented in the rest of this bulletin.
Comparisons over time: by region and industry group
Throughout the bulletin we will compare data across different financial years. Any short-term trends could be due to the inherent variability of contract data and not indicative of a long-term trend. Therefore, these comparisons should be used with caution.
Comparisons over time: accounting for inflation
In simple terms, inflation measures how the cost of goods/services change over time. Inflation of 2% would mean that something that you could purchase for £1 last year would cost you £1.02 this year. Because of this, inflation can mask effects when comparing expenditure across different years. To account for inflation, expenditure is calculated in constant prices. This adjusts expenditure in one year so that it is in another year’s prices. Constant 2021/22 prices are used when comparing across different financial years.
Comparisons over time: to other published statistics
Please note that these statistics are broadly similar to the Direct Expenditure with UK industry statistics published until 2009 in UK Defence Statistics, but should not be directly compared due to methodological differences. Since estimates of employment were previously produced, output per FTE has increased across most industries. Output per FTE is calculated as an industry’s total output divided by its number of FTE employees and can be used as an indicator of how much output is generated for each FTE employee in the industry. If MOD expenditure in an industry remains the same and output per FTE employee increases, then we see greater productivity per FTE employee and witness a reduction in the number of jobs estimated. This is of particular relevance in industries where MOD expenditure is high such as Shipbuilding and Aircraft manufacturing and repair. In addition, earlier estimates also included expenditure and jobs supported as a result of exports.
ADS (a trade organisation for Aerospace, Defence and Security) publish annual estimates of the number of direct jobs supported in the Defence Sector in their annual Industry Facts and Figures publication. ADS estimates are based on a specific definition of what constitutes the defence sector and also include estimated employment as a result of defence exports. In contrast, the estimates produced in this publication are based on all MOD expenditure with industry and include elements of spending that wouldn’t necessarily be considered as ‘defence’, such as financial services, so the two estimates are not directly comparable.
The Joint Economic Data Hub (JEDHub), based in the UK Defence Solutions Centre (UKDSC), is a collaborative initiative to improve understanding of the defence sector’s contribution to the UK economy. UKDSC has worked with MOD, other government departments, DGP companies, trade bodies and academics to develop the JEDHub. A key part of this work has been collecting and aggregating data from defence companies through a new survey. The latest JEDHub Annual Economic Report was published in March 2023, which included estimates of turnover and employment in the defence sector. Employment data in the report was based on companies responding to the JEDHub survey. This data is not directly comparable to the MOD estimates, due to it just being based on survey responses from specific companies and the survey using a specific definition of the defence sector rather than including all elements of MOD spending with industry.
Accuracy
Several assumptions have been made during analysis of this data. For further information on these, and for more detailed explanations of the applications and limitations of this data, please refer to the Background Quality Report.
To access all of the data in both current and constant prices please see the supplementary data tables.
3. MOD Expenditure with UK Industry
MOD Expenditure increases by 3% in 2021/22 after adjusting for inflation.
Total MOD expenditure in 2021/22 was £21.1 billion. This is an increase in spending both before and after adjusting for inflation. In real terms, expenditure increased by £554 million from 2020/21, and is the largest inflation-adjusted increase since 2019/20. The inflation rate as reflected by the GDP Deflator was just below 0% in 2021/22 in figures provided by HM Treasury, which is down from the 6% rate observed in 2020/21. This has resulted in both current and constant prices reported in 2020/21 and 2021/22 being almost the same.
Figure 1: Total MOD Expenditure by Financial Year

MOD average expenditure per person for the UK was £310 in 2021/22, which is the same amount that was observed in 2019/20. After adjusting for inflation, this has remained within a consistent range of £310 to £320 since 2016/17 compared to the high of £340 seen in 2014/15. Expenditure per person since 2014/15 has fallen by 9% whereas total expenditure is only 5% lower over the same period after adjusting for inflation. This effect has been amplified by a growing UK population.
Expenditure increases observed in the East Midlands, London, and Northern Ireland in 2021/22
The East Midlands (45%), Northern Ireland (70%), and London (29%) all saw relatively large increases in expenditure, since 2020/21. Expenditure with industry in the East Midlands rose by £350 million, where it benefitted from from an extension to the support arrangement with the US Government for the Airseeker electronic surveillance aircraft. These aircraft are based out of RAF Waddington. The East Midlands also saw an increase in payments towards contracts in support of the Submarine Delivery Agency (SDA), where Rolls-Royce provide frontline support for submarine reactor plant equipment from their Operations Centre in Derby. In Northern Ireland, expenditure with industry rose by £45 million, which was largely driven by increased payments towards Thales UK Limited, in support of the Royal Navy’s Future Air Defence Availabilty Project. There is no single reason for the increase in expenditure attributed to London, but instead is a demonstration of the the inherent variability of contract data. This rise wasn’t only due to contracts beginning and ending but there was also the combined effect of higher in-year payments to the region. Wales expenditure decreased by 14% since 2020/21, falling by £122 million. This reduction was in part due to a reduction in payments made towards the principle AJAX Specialist Vehicles Reconnaissance contract, for which General Dynamics are the responsible supplier.
Figure 2: MOD Expenditure with UK Industry by Region 2021/22

The single largest contract payment in 2021/22 belonged to the Dreadnought Class submarine programme, with payments totalling around £882 million over this period. This programme is operating out of the North West by BAE Systems Marine Ltd, where these next generation vessels form the future Continuous At Sea Deterrent and Carrier Strike Group as laid out in the Defence Equipment Plan.
4. MOD Expenditure with UK Industry by Industry Group
Expenditure in Aircraft and Spacecraft increased by 35% in 2021/22.
Standard Industrial Classification (SIC) codes These codes are collected on the MOD contract system and classify which specific industry a contract relates to. These SIC codes are grouped together into industry groups.
Please note that typically only one SIC code is assigned to each contract, even though many contracts will involve multiple different industries. On some of the higher value contracts we have sought more detailed industry information, however for many contracts only a single code is available.
MOD expenditure in Aircraft and Spacecraft has increased by 35% in 2021/22, following consistent year-on-year decreases since 2013/14. In real terms this is an extra £515 million. In the last year, this sector has seen increased payments made to the NATO Eurofighter and Tornado Management Agency (NETMA), as well as there being increased support for the Airseeker Electronic Surveillance aircraft described above. However, increased spending in Aircraft and Spacecraft has not solely been caused by an increase in investment over the previous year. Instead, improved data allocation for contracts involving Unmanned Air Systems has resulted in expenditure being redirected to this sector. Expenditure in Other Manufacturing increased by 25% since 2020/21, an increase of approximately £183 million. In part, this is due to the beginning of new contracts in support of the Future Maritime Support Programme providing machinery and equipment to HMNB Devonport. The Computer Services sector also saw a relatively large rise in expenditure, by 18% since 2020/21, an increase of approximately £197 million. This is principally a result of an increase in support required for the SKYNET Enduring Capability (SKEC) programme, with increase payments being made to Airbus Defence and Space Limited.
Figure 3: MOD Expenditure with top Industry Groups 2021/22

Note:
‘Technical, Financial Services & Other Business Services’ includes Financial Services, Business Services, Education, Health and other Service Activities.
‘Other Manufacturing’ excludes Weapons and Ammunition, Electronics, Precision Instruments, Shipbuilding and Repairing, and Aircraft and Spacecraft.
5. MOD Expenditure with Small and Medium-sized Enterprises
5% of MOD Expenditure with UK Industry is with Small and Medium-sized Enterprises.
Small and Medium-sized Enterprises (SMEs) SMEs are an enterprise or business with fewer than 250 employees and an annual turnover of less than €50 million.
MOD direct expenditure with Small and Medium-sized Enterprises (SMEs) in the UK was approximately £950 million in 2021/22. Due to the nature of contract data, large fluctuations in expenditure with SMEs in each region year-on-year is expected, as variations will have a greater effect on the much smaller SME expenditure totals. Despite having a relatively low expenditure in total, The North East has the largest proportion spend with SMEs, at just under 32%. London and Yorkshire and the Humber are second and third respectively.
Figure 4: MOD Expenditure with Small and Medium-sized Enterprises by Region 2021/22

6. MOD Expenditure with UK and Overseas Industry 2021/22
In 2021/22, 90% of total MOD expenditure with industry was within the UK, with 10% attributed overseas.
The £21.1 billion total with UK industry only accounts for 90% of total MOD expenditure with industry and commerce. For example, large portions of spend on NETMA contracts will have spend attributed to overseas European NETMA partner nations. In total, approximately £2.4 billion of MOD spend with industry and commerce is attributed to areas outside of the UK. Note that this expenditure does not include spend via on Foreign Millitary Sales (FMS) with the US Government, details of which can be found in the Trade, Industry and Contracts bulletin.
Figure 5: MOD Expenditure with UK and Overseas industry comparison 2021/22

Note:
Overseas spend excludes FMS data.
7. Total Jobs Supported by MOD Expenditure with UK Industry
The total number of jobs supported by MOD expenditure with UK Industry has decreased by 10,000 to 209,000, in 2021/22.
In 2020/21 estimated MOD supported jobs increased by 16,000. The main driver for this increase was reduced business outturn following the COVID-19 pandemic, meaning that MOD expenditure supported a larger share of the employment market than previously. Therefore, the subsequent decrease seen in 2021/22 is to be expected as the total business outturn has increased, becoming more consistent with pre-pandemic levels, and resulting in the MOD share of supported employment decreasing. Comparing with estimates prior to the rise in 2020/21, MOD supported jobs is 6,000 higher than the 203,000 estimated jobs reported in 2019/20.
Full-Time Equivalent (FTE) employment Full-time equivalent (FTE) employment is a figure that allows part-time workers’ hours to be put into the same units as full-time workers. This publication often uses the term jobs to mean full-time equivalent employment
UK turnover per Full-Time Equivalent employment This shows how much money an industry takes for each person in FTE employment. It therefore allows us to estimate the number of jobs supported by MOD expenditure by dividing expenditure with UK industry by turnover per FTE employment for that industry.
The estimated 209,000 FTE jobs supported by MOD expenditure is the equivalent to 1 in every 120 jobs. This figure includes both direct and indirect jobs so accounts for employment through direct supplier payments as well as that arising through the supply chain. The decrease in total jobs in 2021/22 was primarily driven by a reduction of 11,000 in direct jobs, though this was slightly offset by an increase in indirect jobs of 1,000.
Figure 6: Total Jobs Supported by MOD Expenditure by Financial Year

The figure of 209,000 jobs only includes jobs supported through MOD expenditure with UK industry and does not include civilian personnel employed by the MOD nor those serving in the armed forces. Figures published by the MOD show that in April 2021 the MOD employed 60,000 civilian personnel and 149,000 Service personnel, of which 54,000 civilians and 143,000 Service personnel were based in the UK. This shows that through direct expenditure, indirect expenditure, and direct public sector employment the MOD supported 418,000 jobs in 2021/22, 406,000 of which were based in the UK. This is the equivalent of more than 1 in every 70 jobs.
8. Direct Jobs Supported by MOD Expenditure with UK Industry Total (left) and per 100,000 FTE Employment (right) by Region
MOD expenditure in 2021/22 supported 500 direct jobs per 100,000 FTE employment in the UK which is down from 550 jobs per 100,000 in 2020/21.
Jobs per 100,000 FTE Employment To compare the number of jobs supported by MOD expenditure across regions we have calculated jobs supported per 100,000 people in full-time equivalent (FTE) employment in each region. This adjusts the figures for the population and employment levels of the regions.
Figure 7: The Number of Direct Jobs Supported Through MOD Expenditure Total by Region (left) and for Every 100,000 People in FTE Employment by Region (Right) 2021/22
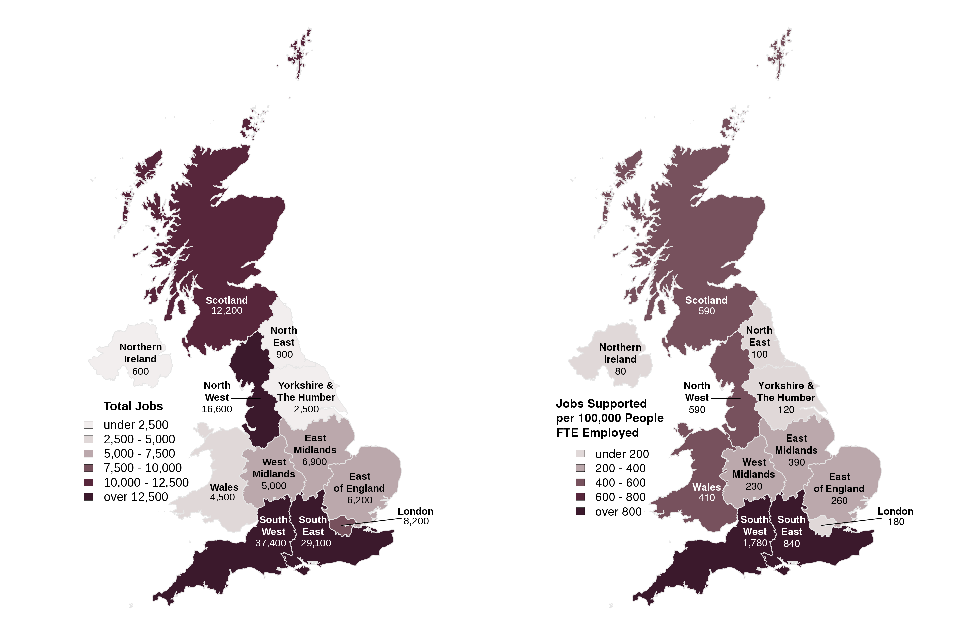
Source: Analysis Directorate (MOD), ONS Mid-year Population Estimates
The South West of England continues to top the direct jobs supported as well as the direct jobs per 100,000 FTE, with more than twice the proportion of MOD supported jobs than any other region. The South West, South East and Yorkshire and The Humber all saw decreases of more than 10% in the number of jobs per FTE compared to the previous year. Increased spending in Northern Ireland resulted in increases in direct jobs supported, up by one third and at 80 jobs per 100,000 FTE in 2021/22.
9. Direct Jobs Supported by MOD Expenditure with UK Industry by Industry Group
Direct jobs supported in the Aircraft and Spacecraft industry saw a rise of 27% in 2021/22, driven by improved expenditure allocation in this sector.
Using SIC codes we can estimate how many direct jobs are supported in each industry group by dividing MOD expenditure in each group by turnover per FTE employment.
Aircraft and Spacecraft saw a rise in expenditure of 35% (Figure 3) which has been attributed to improved allocation of contract data. Hence, this has led to an observed increase in direct jobs supported. Outside of Aircraft and Spacecraft the only other industry groups to show increases in supported direct jobs were the Electronics, Wholesale and retail trade; repair of motor vehicles and Other Manufacturing industries, with increases of around 200 to 300 jobs on the previous year. The Technical, Financial and Other Business Services sector continues to remain in top position with 49,400 direct jobs supported.
Figure 8: The Number of Direct Jobs Supported Through MOD Expenditure by top Industry Groups, 2013-2022

Note:
‘Technical, Financial Services & Other Business Services’ includes Financial Services, Business Services, Education, Health and other Service Activities.
‘Other Manufacturing’ excludes Weapons and Ammunition, Electronics, Precision Instruments, Shipbuilding and Repairing, and Aircraft and Spacecraft.
10. Indirect Jobs Supported by MOD Expenditure with UK Industry by Industry Group
The MOD supported 79,000 indirect jobs supported through industry expenditure in 2021/22, an increase of 1,000 on the previous year.
Using ONS Input-Output Tables, ONS Supply-Use Tables and known direct MOD expenditure against each industry we can estimate the indirect effect of MOD expenditure in the supply chain. From this demand on goods and services arising from MOD expenditure, we can subsequently estimate how many indirect jobs are supported in each industry group by dividing the demand in each group by its respective output per FTE employment.
The Technical, Financial and Other Business Services sector continues to account for the largest proportion of both direct and indirect jobs supported through MOD expenditure. Other Manufacturing accounts for a much large proportion of indirect than direct jobs, being a critical part of the supply chain for a wide variety of industries, including both Shipbuilding and Repairing, and Aircraft and Spacecraft which Other Manufacturing sits above in terms of the number of MOD supported indirect jobs. Shipbuilding and Repairing supports the most industry wide indirect jobs, with investment in this sector supporting 21,100 across all other industry groups further down in the supply chain.
Figure 9: The Number of Indirect Jobs Supported Through MOD Expenditure by Industry Group 2021/22

Note:
‘Technical, Financial Services & Other Business Services’ includes Financial Services, Business Services, Education, Health and other Service Activities.
‘Other Manufacturing’ excludes Weapons and Ammunition, Electronics, Precision Instruments, Shipbuilding and Repairing, and Aircraft and Spacecraft.
11. Methodology
This section sets out the data requirements and processes used to create the tables and charts in this bulletin. More detailed explanations of data sources, assumptions and methodologies used in this publication can be found in the Background Quality Report and Annex A. Any specialist terminology or acronyms used below (and throughout the publication) are defined in the Glossary.
Sources
As well as using MOD expenditure data identified by MOD’s Contracting, Purchasing and Finance (CP&F) system and information from individual MOD project teams, considerable data input for the estimation of jobs relies upon releases from the ONS.
- Supply-Use Tables (SUTs) are produced annually to show estimates of industry inputs and outputs, product supply and demand, and gross value added for the UK. SUTs for 1997 to 2020 are consistent with the UK National Accounts 2022 Blue Book.
- Input-Output Analytical Tables (IOATs) are produced semi-regularly and are derived from the SUTs. They highlight how products are used to produce further products and satisfy final demand across ONS industry codes.
- NOMIS annual data on regional employee and employment count.
- Annual UK population estimates produced by the ONS.
- Data on UK employment and turnover by MOD SIC group is produced by the ONS as a subset of the Business Register and Employment Survey (BRES) and Annual Business Survey (ABS).
- Dun & Bradstreet Solutions are used to source data on Small and Medium-sized Enterprises (SMEs).
Assumptions and Limitations
Various assumptions have had to be made throughout the process when concrete or reliable information was not available. These assumptions are listed in the Background Quality Report.
Regional Expenditure Figures
Location of Work (LOW) codes associated with HQ contracts are used to allocate expenditure to specific regions and calculate expenditure with UK industry. This expenditure is added to the Miscellaneous payments that have a UK postcode as the billing address. Expenditure with Other Government Departments (OGDs) and Trading Funds (TFs) are removed from both the HQ and Miscellaneous payments and added back in with improved location and work type information. This included expenditure with AWE, DIO, DSG/DECA, HRMS, JPA, NETMA, OCCAR and UKHO. Any electronic Procurement Card (ePC) expenditure is distributed based on the location of MOD personnel. Once combined, this provides a breakdown for MOD expenditure by region. This information is further presented as expenditure per person which is calculated using ONS mid-year population data. This is presented on choropleth maps to show expenditure in each region of the UK.
Industry Group Expenditure Figures
HQ contracts have SIC code information associated with them which identifies the type of work involved for each contract. MOD spending is aggregated over similar industries and used to calculate expenditure by industry group for these contracts. Miscellaneous payments have no SIC code assigned to them so the distribution of SIC codes from the HQ contracts is applied in this case. Expenditure against OGD or TF contracts that do not have a SIC code is distributed following discussion with project teams. Combining this expenditure we get a total figure for MOD expenditure by SIC group which is further aggregated into industry groups for presentation.
Small and Medium-sized Enterprises (SMEs) Expenditure Figures Suppliers are classed as an SME or not according to the Organisation for Economic Co-operation and Development (OECD) definition of SMEs as companies with an annual turnover of less than €50 million and fewer than 250 employees. These suppliers are identified from Dun and Bradstreet supplier information.
Estimating Direct Jobs Supported by MOD Expenditure
Turnover per full-time equivalent (FTE) employment for the UK is calculated by dividing turnover figures obtained from the ABS, by employment figures from the BRES. We can then divide MOD expenditure for each region and industry group by its respective industry’s turnover per FTE employment figure. This provides an estimate of how many direct jobs are supported by MOD expenditure in each region as well as in each industry group. This information is also presented as the number of direct jobs supported for every 100,000 people in FTE employment in the area, which is calculated using employment figures from the BRES and NOMIS.
Estimating Indirect Jobs Supported by MOD Expenditure
To estimate the number of indirect jobs supported in the UK by MOD expenditure, we use direct MOD expenditure with UK industry as a measure of MOD’s demand for products and services across the UK economy. By aggregating the ONS Input-Output Table from the IOATs to match the SIC groups used by MOD, we can use this table to show total UK wide demand and output (including intermediate products) arising from this initial MOD demand. Subtracting MOD final demand from this leaves just the intermediate demand (i.e. that which occurs throughout the supply chain). An estimate of UK output per FTE employment is calculated using the ONS Supply of Products Table in the SUTs and BRES employment data. The amount of UK output generated from MOD intermediate demand is then divided by output per FTE employment to determine the number of indirect jobs supported by MOD expenditure. Due to the method employed in their derivation, as well as showing the overall total, these estimates can be presented by industry group.
12. Glossary
Annual Business Survey (ABS) is the main business survey carried out by the ONS. It is used to collect financial information on a large proportion of the UK economy and includes figures such as turnover, employment costs and capital expenditure.
Atomic Weapons Establishment (AWE) works under contract to the MOD and is responsible for national nuclear security and supporting the Continuous At Sea Deterrence (CASD) programme.
Basic Prices indicate values excluding taxes and subsidies on products.
Business Register and Employment Survey (BRES) is a survey carried out by the ONS that provides information on employee and employment estimates by location and industry.
Commerce is defined as a business activity where goods and services are exchanged for value.
Constant Prices indicate a value from which the effects of inflation have been removed. A constant price refers to a year as the basis for the calculation, e.g. “constant 2019/20 prices”. This would mean that historic expenditure figures have been adjusted so that they are in 2019/20 prices and take account of the effects of inflation.
Contracting Purchasing and Finance (CP&F) provides a single online end to end procurement system for all MOD procurement activity. All other processes, especially paper-based systems, will be either replaced or subsumed.
Current Prices are when expenditure is presented without removing the effects of inflation. This can cause difficulties when comparing expenditure across different years as inflation affects the value of a currency.
Defence Electronics and Components Agency (DECA) is a government organisation dedicated to maintenance, repair, overhaul, upgrade and procurement in defence avionics, electronics and components.
Defence Infrastructure Organisation (DIO) is responsible for the day-to-day estates activity at the MOD including maintenance, construction and sustainability of rural and built MOD estates.
Defence Science and Technology Laboratory (Dstl) was a former Trading Fund of MOD, created in July 2001. It supplies impartial scientific and technical research and advice to MOD and other government departments. In April 2017 it ceased to be a Trading Fund and became an On-Vote Defence Agency of MOD.
Defence Support Group (DSG) was a former Trading Fund of the MOD created following the merger of Army Base Repair Organisation (ABRO) and Defence Aviation Repair Agency (DARA) on 1 April 2008. On 1 April 2015 the land repair and maintenance business was sold to Babcock. The remaining part of the business, the Air division and Electronics and Components division, stayed under MOD ownership as DECA.
DEFFORM 57 Completion of this form was mandatory for all contracts where Defence Business Services (DBS) were the payment authority. It was used to set up a contract with DBS for payment purposes and was an important source of capturing data on contract activity within the Ministry of Defence. The form has now been subsumed into CP&F as data is input directly to the system by Commercial Officers.
Direct jobs are defined as those supported within companies receiving payments for goods and services directly from MOD.
electronic Procurement Card (ePC) is the first choice purchasing tool for goods and services, which are not covered by contractual arrangements and allows individual units to process mainly small value purchases. The cards are issued and monitored by the responsible Finance team.
Full-Time Equivalent (FTE) Employment is a figure that allows part-time workers’ hours to be put into the same units as full-time workers.
HQ Contracts are formal contracts set up by MOD Core Department which were previously set up by a DEFFORM 57. Details of HQ contracts are now recorded within CP&F with the data being input directly by Commercial Officers.
Human Resources Management System (HRMS) is a personnel administration system for civilians working at the MOD.
Indirect jobs are generated as a result of supporting and supplying goods and services to those in direct employment. It is therefore a measure of jobs that occur further down the supply chain through sub-contracting or via suppliers to the direct contractor.
Industry is defined as an economic activity concerned with the procurement and processing of raw materials into finished products.
Industry Groups are 22 groups based on the Standard Industrial Classification (SIC) 2007 guidelines maintained by the Office for National Statistics (ONS). Industry groups combine SIC codes that are related to similar types of activity. A breakdown of which SIC codes belong in each industry group can be found in the accompanying data tables to this publication.
Input-Output Analytical Tables (IOATs) are produced semi-regularly by the ONS and are derived from the Supply-Use Tables. They highlight how products are used to produce further products and satisfy final demand across ONS industry codes. These tables were historically produced once every five years due to the time it takes to compile additional data requirements yet due to the increased demand for their use this has been reviewed to become more timely. At point of release, the latest detailed tables are still those from 2015.
Input-Output Table (IOT) is one of the main tables from the Input-Output Analytical Tables. It shows which products go to produce other products as intermediate production.
Intermediate Demand is demand for goods and services that occurs throughout the supply chain.
International Territorial Levels (ITL) Level 1 Regions are 12 UK regions used in the production of statistics.
Joint Personnel Administration (JPA) is a personnel administration system used by the British Armed Forces.
Leontief Inverse Matrix shows how much of each industry’s output is needed to produce a unit of a given industry’s output. It is calculated from the ONS Input-Output Analytical Tables (IOATs).
Location of Work (LOW) Codes are entered on to the DEFFORM 57 or CP&F system, and indicate where work for a contract is being carried out. There are many codes for different areas of the UK and these have been amalgamated to identify the regions being reported on.
Ministry of Defence (MOD) is the United Kingdom government department responsible for implementation of government defence policy.
Miscellaneous Payments are the payment method employed by DBS Finance (MOD’s primary bill paying authority) for running service items such as the provision of utilities. These items are covered by “miscellaneous” transactions, where no MOD HQ Contract exists. These agreements for goods or services will have been set up locally between the MOD Branch and the supplier and are legally binding.
MOD Vector of Final Demand is in-year MOD expenditure for a given financial year broken down by SIC groups.
NATO Eurofighter and Tornado Management Agency (NETMA) is the prime contractor for the Eurofighter Weapon System. The arrangements for the management of the Eurofighter programme were set out in the NATO Charter dated 18 December 1995, in which the international management agencies of the Tornado and Eurofighter programmes were integrated into a single agency, NETMA. This NATO agency is essentially a multi-nation HQ project office for these two collaborative projects, involving the UK, Germany, Italy and Spain. In the UK, Eurofighter is now called ‘Typhoon’.
NOMIS is a service provided by the Office for National Statistics (ONS) to give free public access to detailed and up-to-date UK labour market statistics from official sources. It contains readily accessible data from the Business Register and Employment Survey (BRES).
Office for National Statistics (ONS) is responsible for the production of a wide range of independent economic and social statistics. The statistics are there to improve understanding of the United Kingdom’s economy and society, and for planning the proper allocation of resources, policy-making and decision-making. It is the executive office of the UK Statistics Authority, a non-ministerial department which reports directly to Parliament. ONS is the UK Government’s single largest statistical producer.
Organisation Conjointe de Coopération en Matière d’Armement – the Organisation for Joint Armaments Co-operation (OCCAR) was originally set up in November 1996 by France, Italy, Germany and the UK with the aim of improving the efficiency and lowering the cost of managing co-operative defence equipment programmes involving European nations (e.g. A400M). Belgium and Spain are now also members.
Other Government Departments (OGDs) refers to government departments outside the MOD that the MOD spends money with.
Small and Medium-sized Enterprises (SMEs) refers to an enterprise or business with fewer than 250 employees and an annual turnover of less than €50 million.
Standard Industrial Classification (SIC) Codes classify business establishments and other statistical units by the type of economic activity in which they are engaged. The classification is maintained by the ONS.
Supply-Use Tables (SUTs) are produced annually by the ONS and show estimates of industry inputs and outputs, product supply and demand, and gross value added for the UK.
Trading Funds (TFs) were introduced by the Government under the Trading Funds Act 1973 as a “means of financing trading operations of a government department which, hitherto, have been carried out on Vote”. They are self-accounting units that have greater freedom, than other government departments, in managing their own financial and management activities. They are free to negotiate their own terms and conditions with their staff. For this reason, their grading structures do not always match that of the rest of the Ministry. From 2017/18 there is now only one MOD Trading Fund - UK Hydrographic Office.
UK Hydrographic Office (UKHO) was formed as a Trading Fund of the MOD in 1996 and is responsible for the provision of global hydrographic products and services to UK Defence and commercial mariners. In addition, UKHO discharges the UK’s obligation to provide hydrographic products and services needed for safe navigation in UK waters.
13. Further Information
13.1 Symbols
Figures marked with a superscript p are provided as provisional estimates.
Figures marked with a superscript r are revised from the last edition.
13.2 Rounding
Where rounding has been used, totals and sub-totals have been rounded separately and so may not equal the sums of their rounded parts. Total expenditure figures have been rounded to the nearest £ million, and per person expenditure figures have been rounded to the nearest £10. Total estimates for jobs supported by MOD expenditure have been rounded to the nearest 1,000, the number of jobs supported by MOD expenditure by region or industry group have been rounded to the nearest 100, and the number of jobs supported per 100,000 in FTE employment have been rounded to the nearest 10.
13.3 Revisions
Corrections to the published statistics will be made if errors are found, or if figures change because of improvements to methodology or changes to definitions. When making corrections, we will follow the Ministry of Defence Statistics Revisions and Corrections Policy. All corrected figures will be identified by the symbol r, and an explanation will be given of the reason for and size of the revision. Corrections which would have a significant impact on the utility of the statistics will be corrected as soon as possible, by reissuing the publication.
13.4 Contact Us
The Analysis Directorate welcomes feedback on our statistical products. If you have any comments or questions about this publication or about our statistics in general, you can contact us as follows:
Analysis Directorate (Analysis-Expenditure)
Telephone: 030 679 84442
Email: Analysis-Expenditure-PQ-FOI@mod.gov.uk
If you require information which is not available within this or other available publications, you may wish to submit a Request for Information to the Ministry of Defence under the Freedom of Information Act 2000.
If you wish to correspond by mail, our postal address is:
Analysis Directorate (Analysis-Expenditure)
Ministry of Defence
Oak 0 West, #6028
MOD Abbey Wood North
Bristol
BS34 8QW
For general MOD enquiries, please call: 020 7218 9000