Background quality report: MOD regional expenditure with UK industry and commerce and supported employment 2021/22
Updated 3 August 2023

© Crown copyright 2023
This publication is licensed under the terms of the Open Government Licence v3.0 except where otherwise stated. To view this licence, visit nationalarchives.gov.uk/doc/open-government-licence/version/3 or write to the Information Policy Team, The National Archives, Kew, London TW9 4DU, or email: psi@nationalarchives.gov.uk.
Where we have identified any third party copyright information you will need to obtain permission from the copyright holders concerned.
This publication is available at https://www.gov.uk/government/statistics/mod-regional-expenditure-with-uk-industry-and-supported-employment-202122/background-quality-report-mod-regional-expenditure-with-uk-industry-and-commerce-and-supported-employment-202122
Contact details
Analysis-Expenditure Head of Branch
Tel: 030 679 84442
Email: Analysis-Expenditure-PQ-FOI@mod.gov.uk
Analysis Directorate (Analysis-Expenditure)
Ministry of Defence
Oak 0 West, #6028
MOD Abbey Wood North
Bristol
BS34 8QW
For general MOD enquiries, please call: 020 7218 9000
Introduction
Overview
These statistics present information on MOD regional expenditure with UK industry and the estimated number of jobs that this supported in 2021/22, with some comparisons made to previous financial years. Expenditure is presented across ITL Level 1 regions, referred to as regions in text, and as expenditure per person to take into account the varying populations of the different regions. Expenditure data is also presented broken down by industry group.
Using this expenditure data in conjunction with employment and turnover data from the Business Register and Employment Survey (BRES), and Annual Business Survey (ABS) respectively, we have calculated an estimate of the number of direct jobs supported by MOD expenditure with UK industry.
MOD expenditure data can also be used as an input to indicate MOD final demand for goods and services. Using this with Office for National Statistics (ONS) Input-Output Analytical Tables (IOATs) and Supply-Use Tables (SUTs), we can estimate the number of indirect jobs supported.
For both employment types, this information is shown broken down by industry group. Additionally, for direct jobs this is also presented by region and as the number of direct jobs supported by MOD expenditure per 100,000 full-time equivalent (FTE) people employed in the region. This makes the figures between regions more directly comparable to one another by adjusting for varying regional populations and different employment levels.
In addition, we have accounted for inflation by quoting comparisons over time only in terms of 2021/22 constant prices. This means that we have used the GDP Deflators from HM Treasury to calculate how much expenditure in previous years would be worth in 2021/22. This allows for more valuable comparisons between expenditure in different financial years.
Background and context
Estimates on regional expenditure and direct jobs have been produced in recent years within the Regional Expenditure bulletin series. As well as looking at the split of direct expenditure with UK industry across UK regions, the bulletin estimates the number of direct jobs supported. These are the jobs supported within companies receiving payments for goods and services directly from MOD.
Due to increased demand to once again produce figures on indirect jobs, an Experimental Statistic was released by the Analysis Directorate in October 2020 containing estimates of Indirect Jobs bulletin. Indirect jobs are those that occur further down the supply chain through sub-contracting or via suppliers to the direct contractor. These figures were subsequently subsumed into the Regional Expenditure bulletin in 2021 and the information contained has potential for a wide range of users including the media, politicians, policy professionals and the general public.
Prior to this, estimated jobs figures were published as part of the UK Defence Statistics (UKDS) publication and included both direct and indirect jobs. The MOD resumed publication of these figures in March 2017 to help with the monitoring of various commitments, such as the Prosperity agenda set out in the Strategic Defence and Security Review (SDSR) 2015.
Since UKDS released their figures, many improvements have been made to the old methodology that have led to a more accurate estimate of MOD expenditure with UK industry. This includes expenditure that was previously attributed to the UK now being correctly apportioned overseas. We also have more precise information on the location of expenditure within the UK, and the industries that it is spent in. For more information on the current process, see the section below on ‘Methodology and Production’ and this Statistical Notice.
Methodology and production
This section sets out the data requirements and processes used to create the tables and charts in the core bulletin and supporting data tables. It also discusses the assumptions made as well as a number of limitations.
Sources
As well as using MOD expenditure data identified by MOD’s Contracting, Purchasing and Finance (CP&F) system and information from individual MOD project teams, considerable data input for the estimation of jobs relies upon releases from the ONS.
- Supply-Use Tables (SUTs) are produced annually to show estimates of industry inputs and outputs, product supply and demand, and gross value added for the UK. SUTs for 1997 to 2020 are consistent with the UK National Accounts 2022 Blue Book.
- Input-Output Analytical Tables (IOATs) are produced semi-regularly and are derived from the SUTs. They highlight how products are used to produce further products and satisfy final demand across ONS industry codes.
- NOMIS annual data on regional employee and employment count.
- Annual UK population estimates produced by the ONS.
- Data on UK employment and turnover by MOD SIC group is produced by the ONS as a subset of the Business Register and Employment Survey (BRES) and Annual Business Survey (ABS).
- Dun & Bradstreet are used to source data on Small and Medium-sized Enterprises (SMEs).
Assumptions and Limitations: overview
Various assumptions have had to be made throughout the process when concrete information was lacking. These assumptions are listed below.
Assumptions and Limitations: MOD expenditure
- Any contracts that have locations of British Forces Post Offices, British Crown Dependencies and UK Overseas Territories are all treated as being expenditure outside the UK throughout the analysis.
- The small number of HQ contracts that we are unable to find accurate Location of Work (LOW) information for are distributed across UK regions/overseas based on the regional/national proportions for the known HQ contract locations.
- Likewise, the small number of HQ contracts which we cannot categorise into Standard Industrial Classification (SIC) groups are distributed across SIC groups based on the proportions of other HQ contracts where this information is known.
- SIC code information is entered when the contract is let. It is likely that in different years of the contract’s life that the SIC distribution will fluctuate as different phases of work are started and completed. We have no way to measure these changes however, so whilst high value contracts will be reviewed, the same SIC distributions are used throughout the life of most contracts.
- HQ contracts let on a national or multi-region basis relating to the provision of facilities management or services to MOD sites (e.g. mess catering or utilities) are distributed across the respective areas according to the location of MOD personnel.
- Miscellaneous payments do not have any SIC code information associated with them. Therefore, the Miscellaneous expenditure is assumed to have the same SIC distribution as the HQ contracts.
- Miscellaneous payments also do not have LOW code information associated with them. Therefore, Miscellaneous expenditure is distributed regionally using the bill paying postcode.
- Following advice from NATO Eurofighter and Tornado Management Agency (NETMA) project teams, the location of work for NETMA expenditure was estimated to be 50% in the East of England, 25% in the North West and 25% in the South West. While there is lower level supplier work carried out elsewhere, this would be much harder to estimate.
- Electronic Procurement Card (ePC) payments are distributed according to the location of MOD personnel, including overseas.
- ePC payments, where not explicitly known, are categorised into SIC groups according to the SIC categorisation of Human Resources Management System (HRMS) and Joint Personnel Administration (JPA) payments.
- Accurate location data was not available for DSG in 2013/14 and 2014/15. Therefore, the same locations used for DECA contracts were also used for DSG.
- Not all overseas HRMS expenditure can be identified, but what can be has been removed.
- Any JPA expenditure in GBP (£) is counted as being UK expenditure. Any payments in other currencies are assumed to have been overseas and so are excluded from the analysis.
Assumptions and Limitations: direct jobs
- MOD’s financial year data can be matched to ONS calendar year data.
- The number of direct jobs supported is only an estimated figure. There is no concrete way of counting the number of jobs supported by MOD expenditure with UK industry. Instead we have taken the turnover per FTE employment in each industry group and divided our regional expenditure figures by this. This gives an estimate of how many jobs MOD expenditure supports in the UK.
- For some SIC groups either turnover data or employment data was not available due to suppression. In these cases, data was estimated based on other available financial years (if similar SIC groups had consistent data across financial years). If a lot of variation was seen across financial years in a similar SIC group then the average turnover per FTE employment was applied here instead. Please contact us if you need information on which SIC groups were affected by this.
- BRES data was not available at the level we required it for Northern Ireland and therefore we had to use published figures from the UK Business Register and Employment Survey directly from the ONS website.
Assumptions and Limitations: indirect jobs
- Detailed IOATs do not come out every year due to the time it takes to produce them. For absent years, it must be assumed that changes in product use and demand has not altered significantly since the last iteration of the tables.
- SUTs have a year’s lag on them so MOD’s latest expenditure data will be matched up to the previous year’s SUTs and it must be assumed that total domestic output of products does not significantly change year-on-year.
- Defence output from a particular SIC product group will have similar characteristics as total output for the sector as a whole.
- The MOD vector of final demand is in current prices whereas the ONS analytical tables are in basic prices so it must be assessed whether they are compatible. Basic prices are the amounts received by the goods or services produced minus any taxes and subsidies on products. The expenditure in the MOD vector of final demand does exclude VAT but in order to match to basic prices it is assumed that other taxes paid by MOD are relatively small.
- Not every ONS SIC group falls into a single MOD SIC group, some overlap across multiple groups. For example, ONS SIC 26 for ‘Computer, electronic and optical products’ lies in MOD SIC groups 22 for ‘Office machinery and computers’, 24 for ‘Electronics’ and 25 for ‘Instrument engineering’. Decision rules must be applied to determine how these overlaps should be grouped. Currently these splits are apportioned equally.
- IOTs are prepared as product by product while SIC groups used are, by definition, industry based. There is therefore a mismatch between the data on a product basis then being used by industry to calculate employment.
- No reliable regional split can currently be given for estimates on indirect jobs as there are no regional IOATs. It takes considerable time and effort for the ONS to produce UK tables so producing regional ones as well is not feasible. So, as it stands, indirect jobs are reported for the whole of the UK rather than by region as this would require the large assumption that each region has the exact same make up for product supply, use and demand.
Method: overview
2017/18 saw the general production process enhanced by using an open-source programming language to automate large parts of the data processing. As well as reducing production time, the quality of the publication was improved, and the process can be easily reproduced. Additional quality assurance actions were programmed into the data pipeline, reducing the scope for human error that was more likely to occur when doing the large volume of manual data manipulation that was previously required. This process has once again been used for 2021/22’s publication.
Method: MOD expenditure
Expenditure information is extracted from MOD’s CP&F system. This dataset identifies all in-year expenditure recorded against a HQ contract or as a Miscellaneous payment. Further detail on HQ and Miscellaneous expenditure can be found in the latest Trade, Industry and Contracts’ Background Quality Report.
Expenditure with Other Government Departments (OGDs) and Trading Funds (TFs) is removed from the HQ and Miscellaneous payments and added back in with improved location and work type information. This includes expenditure with AWE, DIO, DSG/DECA, HRMS, JPA, NETMA, OCCAR and UKHO. Inter-governmental transactions remain as exclusions. The single billing address for ePC spend is ignored and instead its expenditure is distributed based on the location of MOD personnel.
Data cleansing is actioned on the higher value contracts to ensure that SIC groups and LOW codes are as accurate as possible. This is done through direct contact with project teams and information from legacy systems used prior to CP&F’s introduction. Using the LOW codes, overseas expenditure is identified and, where possible, removed. LOW codes are then further used to break the expenditure down by UK region, and SIC groups are used to categorise it by industry group.
Mid-Year regional population figures are taken from the ONS website. These are used to produce figures on MOD expenditure with UK industry per person for each region. This is achieved by dividing the regional expenditure by the population of the area to see how much money was spent for each person living in that region. This gives the expenditure figures some context and allows comparisons across different regions to be drawn more easily.
Method: direct jobs
Using employment data from the BRES and turnover data from the ABS we can calculate turnover per FTE employment for each financial year. By dividing our figures for MOD expenditure with UK industry by these figures we can estimate how many direct jobs this expenditure supports in the UK. Again, these figures are presented broken down by both region and industry group.
We use further employment data from BRES and NOMIS to calculate how many jobs MOD expenditure supports for every 100,000 people in FTE employment in the region. This takes into account both the population of the area and the number of people in employment and therefore, like the per person expenditure figures, makes it easier to make comparisons across the different regions.
Method: indirect jobs
To estimate the number of indirect jobs supported in the UK by MOD expenditure, we use direct MOD expenditure with UK industry as a measure of MOD’s demand for products and services across the UK economy. By aggregating the ONS Input-Output Table from the IOATs to match the SIC groups used by MOD, we can use this table to show total UK wide demand and output (including intermediate products) arising from this initial MOD demand. Subtracting MOD final demand from this leaves just the intermediate demand (i.e. that which occurs throughout the supply chain). An estimate of UK output per FTE employment is calculated using the ONS Supply of Products Table in the SUTs and BRES employment data. The amount of UK output generated from MOD intermediate demand is then divided by output per FTE employment to determine the number of indirect jobs supported by MOD expenditure. Due to the method employed in their derivation, as well as showing the overall total, these estimates can be presented by industry group.
Figure 1: Overview of methodological process

This approach has been applied over that of employment multipliers since it is consistent with the method of estimating direct jobs whereby jobs are estimated as a ratio of industry output to employment. As such, the data required for MOD expenditure and UK employment is readily available to the Analysis Directorate. The applied method also allows for the exclusion of employment within the public administration and defence sector. The approach is broadly consistent with the way estimates were previously produced by UKDS.
The output from calculating MOD spending using the aforementioned methodology is a matrix of expenditure split across SIC groups and UK regions. Since there are no regional SUT tables, the regional split is ignored for the estimation of indirect jobs and so the output expenditure is consolidated to become a single vector of MOD final demand split by MOD SIC groups 1 to 52.
The ONS Domestic Use Table frequently appears in later releases of the UK Input-Output Analytical Tables as the IOT table, it being the main Input-Output Table. It shows which products (rows) go to produce other products (columns) as intermediate production.
Table 1: Format of IOT Table (Domestic Use, Basic Prices, Product by Product)
At the base of the table can be found the total output for each product after allowing for taxes, subsidies, etc. Owing to the nature of the tables and their initial construction, they are balanced, and the total output equals total demand.
Consider a reduced example from the 2013 Input-Output Analytical Tables. Table 2 shows that the product of ‘Air and spacecraft, and related machinery’ that goes into the product of ‘Weapons and ammunition’ is £1.6 million. The final product will then have some element of value added through taxes, compensation of employees, etc. as shown at the bottom of Table 1 before its total output is found.
Table 2: Reduced section of 2013 input-output domestic use table at basic prices, product by product
| ONS Product Group | ||
|---|---|---|
| ONS Product SIC Code | ONS Product Description | 25.4: Weapons and ammunition (£ millions) |
| 27 | Electrical equipment | 30.2 |
| 28 | Machinery and equipment n.e.c. | 24.5 |
| 29 | Motor vehicles, trailers and semi-trailers | 11.8 |
| 30.1 | Ships and boats | 0.0 |
| 30.3 | Air and spacecraft, and related machinery | 1.6 |
Currently there is a mismatch between the ONS SIC codes and MOD SIC groups. Starting with the relevant IOT showing domestic use in basic prices, product by product, we can aggregate the groupings by simply summing rows to go from the 100+ ONS SIC codes to MOD’s 52 SIC groups. Where SIC codes fall into multiple SIC groups a decision rule is applied to accommodate the overlaps whereby amounts are apportioned equally. This aggregation keeps all row and column totals intact but allows us to view demand according to MOD’s own SIC groupings.
As it stands, Government expenditure is included within the intermediate demand section of the Domestic Use Table (Table 1). Since we are not interested in subsequent jobs in the public administration and defence sector, any intermediate demand against SIC group 48 is nilled out in both row and column. This is considered consistent with the estimation of direct jobs where expenditure identified as being with other government departments is removed.
Dividing each cell of the aggregated use table by the column total produces a matrix of coefficients (also known as the A matrix). This new matrix shows how much of each product is required across all SIC groups when producing one final unit of a certain product. For example, in producing weapons and ammunition you are going to need elements of metal work and electrical components among others, as well as further work in the weapons and ammunition sector itself.
Table 3: Reduced example of the A Matrix (Matrix of Coefficients)
| SIC Group 1 | SIC Group 2 | SIC Group 3 | |
|---|---|---|---|
| SIC Group 1 | 0.09 | 0.38 | 0.04 |
| SIC Group 2 | 0.10 | 0.21 | 0.22 |
| SIC Group 3 | 0.79 | 0.00 | 0.01 |
Table 3 shows a reduced example of a constructed A matrix and the interactions between three products. It shows that to produce one unit of product from SIC group 1 it would require 0.09 units of SIC group 1, 0.10 of SIC group 2 and 0.79 of SIC group 3. However, since SIC group 2 also has interactions with SIC groups 1, 2 and 3, these requirements would also need to be calculated and factored in. These interactions would go on infinitely.
Instead of doing this manually for each individual interaction we turn to matrix calculations to multiply the A matrix by our demand for each step.
Let f be the initial vector of final demand, where for example,

Then A x f gives the secondary product requirements, A x A x f gives the tertiary product requirements, and so on. These interactions are repeated infinitely which can be written as, f + Af + A2f + A3f + … . (†)
Let I be the identity matrix. The above is then equivalent to
(I + A + A2 + *A3 + …)f*
We want to reduce this infinite series into a finite form which we can calculate explicitly. For brevity, let R = I + A + *A2 + *A3 + … . Then, since
I + A + A2 + *A3 + … = *I + A(I + A + A2 + … ),
we have R = I + AR.
We can now rearrange this as follows:

Therefore, we may reduce the infinite series I + A + A2 + … to the Leontief Inverse Matrix, (I - A)-1, which shows how much of each industry’s output is needed to produce one unit of a given industry’s output. For any vector of final demand, total demand for the product is found by multiplying it by the Leontief Inverse.
We can therefore write (†) as (I - A)-1f and calculate the total demand for the above example:
So, to produce one full unit of product from SIC group 1 we would require 1.34 units of total product of SIC group 1, 0.47 of SIC group 2 and 1.07 of SIC group 3.
To create a MOD version of the Leontief matrix we take the aggregated domestic use table and then perform these matrix transformations. This therefore produces a Leontief matrix of 52 by 52 SIC groups which then directly matches up to MOD’s breakdown of SIC groups used to report on estimated job numbers.
MOD total demand across SIC groups is then calculated by multiplying the Leontief matrix by the vector of final demand, as per the example above. Importantly, to account for the jobs supported by the direct expenditure across SIC groups, we only calculate indirect jobs on the difference between MOD total demand and the final demand vector. This is known as the intermediate demand, that which occurs throughout the supply chain.
Total Demand – Final Demand Vector = Intermediate Demand
In order to determine employment numbers, we start by calculating output at basic prices per FTE employment. The SUTs include a Supply of Products table which features data on total domestic output of products at basic prices. Being in basic prices ensures it is consistent with that of the IOT table.
A MOD version of the SUT’s Supply of Products table based on MOD’s 52 SIC groups can be created by aggregating SIC groupings by the same method applied in compiling the MOD’s IOT. This returns total domestic output of products at basic prices broken down according to MOD SIC groups. Using the employment data gathered in the BRES, dividing output by employment here provides the output at basic prices per FTE employment. The number of indirect jobs can then be estimated by dividing the intermediate demand (MOD total demand minus the MOD vector of final demand) by these output at basic prices per FTE employment figures.
Table 4: Reduced example of indirect jobs estimation
| Total Domestic Output of Products at Basic Prices (£) | Total FTE Employment | Output at Basic Prices per FTE Employment (£ per FTE) | Intermediate Demand | Indirect Jobs Estimate | |
|---|---|---|---|---|---|
| SIC Group 1 | 2,000 | 40 | 50 | 0.34 | 0.0068 |
| SIC Group 2 | 900 | 15 | 60 | 0.47 | 0.0078 |
| SIC Group 3 | 12,000 | 160 | 75 | 1.07 | 0.0143 |
So, with our given final demand vector plus the example output and employment data in Table 4, for each £1 increase in final demand of SIC group 1, intermediate demand would support an estimated 0.0068 indirect FTE jobs in SIC group 1, 0.0078 in SIC group 2 and 0.0143 in SIC group 3.
For further detail on this methodology for indirect jobs, a full worked example can be found in Annex A.
Quality management
The MOD’s quality management process for Official Statistics consists of three elements:
- Regularly monitoring and assessing quality risk via an annual assessment.
- Providing a mechanism for reporting and reviewing revisions/corrections to Official Statistics.
- Ensuring BQRs are publishing alongside reports and are updated regularly.
Relevance
Statistics on MOD expenditure with UK industry and the number of jobs that it supports were published annually up until 2009 in the UKDS publication. This publication was re-introduced in response to a request from the Secretary of State for Defence to begin producing these statistics again, which was supported by the Permanent Under Secretary in March 2016.
Due to increased demand to once again produce figures on indirect jobs, an Experimental Statistic was released by the Analysis Directorate containing these estimates in the Indirect Jobs bulletin. These figures have subsequently been subsumed into the Regional Expenditure bulletin.
The information contained in this bulletin has potential for a wide range of users including the media, politicians, policy professionals and the general public. In particular, these statistics aid the measurement and monitoring of various regional expenditure and employment targets throughout the MOD, including those set out in the SDSR 2015.
The scope of the publication to meet user needs will continue to be reviewed based on feedback from users.
The MOD has previously held consultation meetings with users of Defence Official Statistics, which provided a forum for user feedback on their needs and perceptions. Internal publication reviews have also taken place. Proposed changes were set out at the consultation meetings in order to gain feedback from both internal and external users.
In 2018/19, Tables 8 and 13 were developed and published in response to information requests from internal and external users on the breakdown of MOD expenditure and jobs by region and industry group.
Following multiple requests, a new methodology was also established for estimating indirect jobs and introduced into the Regional Expenditure bulletin for 2019/20. The resulting output can be found throughout the main commentary with supporting data in Tables 9, 14 and 15.
The MOD invites users to provide further feedback to the statistical output teams on any of their publications or reports using the contact information at the end of each publication.
Accuracy
As mentioned in the Methodology and Production section, recent improvements have been made to the methodology to make the process more reproducible and have provided a more reliable estimate of MOD expenditure with UK industry. Automating the data process has led to an increase in accuracy of MOD expenditure estimates by reducing scope for human error. Accuracy has also been increased by excluding overseas expenditure that had been incorrectly included in previous editions. The result of reclassifying expenditure as UK or overseas has a knock-on effect for the way spend is apportioned to regions for contracts that do not have a LOW code.
However, one key issue is that most contracts still only have one SIC group associated with them. This is because when contracts were previously raised using a DEFFORM 57 only one SIC group could be entered. The vast majority of contracts will relate to multiple different industries, but due to the number of contracts raised in each financial year it would be impossible to follow up with all of the project teams to get an accurate SIC breakdown. Therefore, we contact the project teams who own the larger contracts, such as those with AWE, NETMA and OCCAR, and distribute these more accurately across a wider range of SIC groups. From 2019/20, an upgrade to the CP&F system has provided Commercial Officers the option to add in multiple SIC details which allows for an improved allocation of expenditure to work type.
In a previous edition of this bulletin presenting 2015/16’s financial data, ePC payments were attributed as a single large payment in the North East of England. In subsequent bulletins this payment has been distributed across the locations of MOD personnel. We have further categorised ePC payments into SIC groups where known, and where unknown we have categorised these payments into SIC groups according to the distribution of payments in HRMS and JPA (the MOD administration systems for civilian and military personnel respectively).
Issues arising from the introduction of the then new CP&F online end-to-end procurement system in 2016/17 have led to a greater number of missing and incomplete fields in our data. Whilst a large volume of data cleansing has had to be carried out on the dataset, we are confident that the data has been cleansed to a sufficient standard for our analysis. Further issues arose in the CP&F accounting processes which resulted in an additional £300 million in unpaid invoices at the end of 2016/17. That expenditure was instead reported in the 2017/18 dataset. Going forward there are no further issues expected due to unpaid invoices.
Timeliness and punctuality
Timeliness
The publication uses data from 9 financial years; 2013/14 to 2021/22. While the contract information is first available in April, it is not possible to release the publication at that time as the data must be cleansed and quality assured first.
Data from the ONS on UK turnover is also not typically available until December, so the bulletin cannot be published before this time as the employment figures cannot be calculated until we have that data. For the 19/20 release, there was a delay to the ONS turnover and employment data caused by the pandemic. We therefore published provisional estimates in January 21, using the previous years’ ONS data. Updated ONS data was released in June 21, so we published a revised bulletin in August 21 with updated employment estimates. Further analysis and quality assurance processes are also then needed before the bulletin can be put together.
As the job estimates have been omitted from the January 2022 publication, a revision in the summer of 2022 will be made following the release of employment and turnover data from the ONS.
Use of the automated process has aided the timeliness of the bulletin’s production by bringing forward the release by two months.
Punctuality
Release was pre-announced for 26 January 2023 and this publication date was achieved.
The release date for this publication was pre-announced on the MOD’s Calendar of Upcoming Releases section of GOV.UK.
Coherence and comparability
Coherence
Figures were previously published by Defence Economics on MOD expenditure and the jobs that it supports in the UKDS publication, but these were ceased in 2009. Figures presented in this bulletin are most comparable to the ‘Direct Employment from MOD expenditure’ figures quoted in the UKDS bulletin. However, differing methodologies means that the figures are not directly comparable.
‘Total Employment’ figures in this current publication should not be compared to those produced by UKDS since the latter includes additional estimates on employment arising from defence exports which our figures do not.
Comparability
Throughout the bulletin we compare data across 9 different financial years. With a short time series any trends could be due to the inherent variability of contract data and not indicative of a long-term trend. We would naturally expect total expenditure to fluctuate year-on-year due to the occurrence of large payments. As such, any comparisons should be used with caution.
It should be noted also that prior to 2017/18, the total expenditure figure included direct MOD payments to the Defence Science and Technology Laboratory (Dstl). Dstl ceased to be a Trading Fund in April 2017 and are therefore no longer paid through contracts processed by DBS Finance Systems, instead being funded through the central MOD budget through which it continues to run its own financial activities. This has resulted in a substantial payment being excluded in expenditure totals from financial years following 2016/17 (MOD paid £590 million to Dstl in 2015/16 and £560 million in 2016/17).
By breaking expenditure and supported employment down into ITL Level 1 Regions, comparisons can be made about different areas of the UK. While the variation in expenditure is still present at a regional and industrial level, some comments about changes over time can be made here. If overall expenditure is going down in specific regions, or industries are showing a substantial rise, then this is more likely to be a significant observation.
The inclusion of expenditure per person and jobs supported per 100,000 people in FTE employment also makes the statistics more comparable across different regions. Without these measures, differences in the populations and employment levels of the regions could make it difficult to compare expenditure levels and jobs supported.
Where comments are made about variation across years at the regional and industrial level it is important to consider inflation. In simple terms, inflation measures how the cost of goods and services change over time. Inflation of 2% would mean that something that you could purchase for £1 last year would cost you £1.02 this year. Therefore, inflation can mask effects when comparing expenditure across different years. This is because you are comparing expenditure in one year against another where the value of the pound was different.
To account for this, expenditure can be calculated in constant prices. This accounts for inflation by adjusting expenditure in one year so that it is in another year’s prices. When the effect of inflation is removed the real increases and decreases in expenditure can be seen. Throughout the publication, expenditure is presented in constant 2021/22 prices when comparing across different financial years. To access all of the data in both current and constant prices please see the supplementary data tables.
Accessibility and clarity
Accessibility
The statistics can be accessed on the GOV.UK website and are available to download in HTML format. They can be found in the ‘Finance and Economics’ section. They can also be accessed by using an internet search engine.
All the tables and any data behind graphs and charts in the report are available as Open Data Source (ODS) tables.
Each of the documents will meet accessibility criteria.
24 hour pre-release access to the report is available to a limited distribution list within the Ministry of Defence (MOD). The full list can be found in the pre-release access list available on the GOV.UK website.
Sources are provided for all the data presented in the publication to allow users to contact the relevant team if they need further information.
Clarity
Commentary is provided in the publication to clearly discuss key facts and trends in the data and to clarify any complex points. It is also used to discuss the quality of the data, any assumptions made and to provide appropriate caveats.
Users who are interested in just the key findings can read the ‘Key Points’ section at the start of the report which provides a list of the main points in the publication.
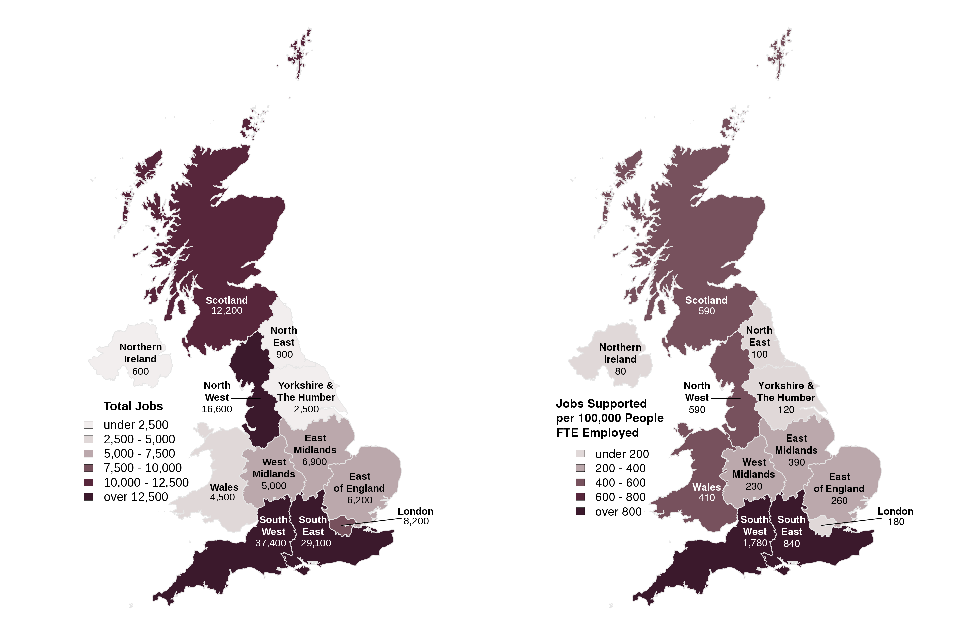
Graphics have been utilised throughout the publication to visually present key data. This is beneficial for those users who are not confident with statistics to aid their understanding and allows users to understand the data more quickly than by text alone. These graphics include bar charts to display the regional expenditure levels, the jobs that this supports and also to demonstrate the effects of inflation. There are also choropleth maps included to show regional expenditure per person and the number of jobs supported for every 100,000 people in FTE employment in the area.
Supplementary ODS tables are published alongside the bulletin for those users who wish to access the data presented in the publication themselves.
A brief description of methodological information is included in the publication, and on the relevant data tables, but a full methodology can be found in the section on Methodology and Production within this Background Quality Report.
A glossary of key terms is included below to aid user understanding of specialist terms. If the terms are particularly vital to understanding the statistics then an explanation is included in a small glossary box in the section that the statistics are presented in.
Trade-offs between Output Quality Components
We could produce the regional expenditure figures at a much more granular level, for example by cities and towns rather than regions. This would however be a much more in-depth process that would take much longer to run. Moreover, the location of work codes used to determine where the work took place don’t consistently provide coverage of the same sized area, making the level of granularity required for lower level analysis difficult. Therefore, the decision was made to present the figures at the regional level to allow for a more timely publication.
Performance, cost and respondent burden
The methodology for this bulletin has gone through streamlining processes to reduce the burden of production. Cleansing the data and calculating the figures is a time-consuming process, however doing it all at once for this bulletin saves time overall as we regularly get ad hoc requests for this sort of data. This publication uses many of the same data sources as the Trade, Industry and Contracts bulletin which saves time as this data is already collected.
ABS and BRES data according to MOD SIC groupings used in the turnover per FTE employment calculations are extracted on our behalf by the ONS. This saves time as they are experts on this data and can produce the figures much faster than we can.
Confidentiality, transparency and security
In producing these statistics, we adhere to the Analysis Directorate Confidentiality Policy. We follow the principles and protocols laid out in the Code of Practice for Official Statistics and comply with the pre-release access arrangements. The MOD statistics pre-release access lists are available on the GOV.UK website.
Where rounding has been used, totals and sub-totals have been rounded separately and so may not equal the sum of their rounded parts. Total expenditure figures have been rounded to the nearest million pounds, and per person expenditure figures have been rounded to the nearest £10. This is because contract information is commercially sensitive and rounding has been employed as a measure of disclosure control. Total estimates for jobs supported by MOD expenditure have been rounded to the nearest 1,000, the number of jobs supported by MOD expenditure by region or industry group have been rounded to the nearest 100, and the number of jobs supported per 100,000 in FTE employment have been rounded to the nearest 10.
References
- Statistics at MOD Homepage
- MOD’s Timetable of Future Releases of National and Official Statistics
- Trade, Industry and Contracts Statistical Notice
- ONS User Requested Data
- Analysis Directorate Confidentiality Policy
- UK Code of Practice for Official Statistics
- MOD Statistics Pre-Release List
- Glossary of Terms and Abbreviations
Note: The MOD is not responsible for the contents or reliability of the listed non-MOD web sites and does not necessary endorse the views expressed therein. Listings should not be taken as endorsement or any kind. We have no control over the availability of these sites. Users access them at their own risk. The information given was correct at the time of publication.