How many people continue their stay in the UK?
Published 29 November 2018

© Crown copyright 2018
This publication is licensed under the terms of the Open Government Licence v3.0 except where otherwise stated. To view this licence, visit nationalarchives.gov.uk/doc/open-government-licence/version/3 or write to the Information Policy Team, The National Archives, Kew, London TW9 4DU, or email: psi@nationalarchives.gov.uk.
Where we have identified any third party copyright information you will need to obtain permission from the copyright holders concerned.
This publication is available at https://www.gov.uk/government/statistics/immigration-statistics-year-ending-september-2018/how-many-people-continue-their-stay-in-the-uk
Back to ‘Immigration Statistics, year ending September 2018’ content page.
This is not the latest release. View latest release.
We welcome your feedback
The content and format of the quarterly release and associated data tables are currently being reviewed. This means the release may be subject to change in the future. If you have any comments, or suggestions for the development of this report, please provide feedback by emailing MigrationStatsEnquiries@homeoffice.gov.uk. Please include the words ‘PUBLICATION FEEDBACK’ in the subject of your email.
See section 6 of the ‘About this release’ section for more details.
Data in this section relate to the year ending September 2018 and all comparisons are with the year ending September 2017, unless indicated otherwise.
This section contains data on:
- decisions on applications for extensions of temporary stay in the UK from non-EEA nationals
- decisions on applications for settlement from non-EEA nationals
- residence documentation issued to EEA nationals and their family members
- applications for British citizenship
In February 2018 the Home Office published ‘Statistics on changes in migrants’ visa and leave status: 2016’, which shows how non-EEA migrants change their immigration status, achieve settlement in the UK, or have their status expire. An update of this report is due to be published in February 2019.
We provide a more detailed commentary on an annual basis. This is included in ‘Immigration statistics, year ending June 2018’.
Information regarding the EU Settlement Scheme can be found on GOV.UK at ‘Settled and pre-settled status for EU citizens and their families’. Key findings of the first test phase of the EU Settlement Scheme can be found on GOV.UK at EU Settlement Scheme private beta 1.
1. Extension of temporary stay in the UK
There were 268,004 decisions on applications for extension of temporary stay (including dependants) in the year ending September 2018, 22% more than in the previous year. This was primarily due to increases in those granted extensions for family reasons, which likely reflect the change to the family Immigration Rules requiring individuals to obtain extensions every 2.5 years (see table notes for details).
Of these, 242,698 were grants of extensions of temporary stay, 21% more than the previous year, representing a grant rate of 91%.
Table 1: Grants of extensions by reason and refusals, year ending September 2018 compared with year ending September 2017
| Year ending | Total decisions | Total grants | Work | Study | Family 1 | Other | Total refusals |
|---|---|---|---|---|---|---|---|
| September 2017 | 218,802 | 201,224 | 80,904 | 42,102 | 63,045 | 15,173 | 17,578 |
| September 2018 | 268,004 | 242,698 | 83,264 | 42,854 | 93,609 | 22,971 | 25,306 |
| Change: latest 12 months | 49,202 | 41,474 | +2,360 | +752 | +30,564 | +7,798 | +7,728 |
| Percentage change | +22% | +21% | +3% | +2% | +48% | +51% | +44% |
Source:
Table note:
- The latest increases are likely to reflect a longer residence eligibility period before it is possible to apply to stay in the UK permanently (settlement), and a requirement to complete further periods of temporary leave, both implemented under family Immigration Rules from 9 July 2012. Further details on the rule changes can be found in the user guide.
Data for the year ending September 2018 show that of those who extended their stay in the UK:
- 39% extended for family reasons, for example as a partner of a settled UK resident
- 34% extended for work reasons, for example in a skilled employment category
- 18% extended for study reasons, to continue studies either in the same course or another one
Data for 2017 (the latest for which data on extensions, broken down by previous reason for stay, are available) show that just over 1 in 5 of those extending their stay switched from one broad category to another (for example, from study to work), while the rest remained within their existing broad category.
2. Settlement
There were 91,209 decisions on applications for settlement in the UK in the year ending September 2018, 41% more than in the previous year. Of these decisions, 95% resulted in a grant and the number granted settlement was 42% more than in the previous year. This included increases in settlement granted to those previously in the UK:
- for work reasons (up 31% to 22,490), which was driven by an increase of 5,024 in grants to those in the Tier 2 (Skilled) work category
- for family reasons (which nearly trebled to 13,266), which reflects family rule changes in July 2012 affecting the qualifying period for settlement and individuals on a 5-year route to settlement now becoming eligible to apply (further information about the rules changes are available at: ‘Family and private life immigration rule changes 9 July 2012’)
- following a grant of leave to stay following an asylum claim (up 52% to 25,458) – the asylum category accounted for 29% of Settlement grants in the year ending September 2018
- settlement granted to those previously in the UK for other reasons (up 16% to 25,635)
Table 2: Outcome of applications for settlement in the UK by reason for grant, year ending September 2018 compared with year ending September 2017 1,2
| Year ending | Total decisions1 | Total grants | Work | Asylum | Family | Other2 | Refusals |
|---|---|---|---|---|---|---|---|
| September 2017 | 64,526 | 61,009 | 17,128 | 16,794 | 4,939 | 22,148 | 3,517 |
| September 2018 | 91,209 | 86,849 | 22,490 | 25,458 | 13,266 | 25,635 | 4,360 |
| Change: latest 12 months | +26,683 | +25,840 | +5,362 | +8,664 | +8,327 | +3,487 | +843 |
| Percentage change | +41% | +42% | +31% | +52% | +169% | +16% | +24% |
Source:
Table notes:
- The number of decisions in a given year can be affected by changes in casework resource allocation. Such fluctuations can be examined in more detail in the quarterly data that are available in the published Settlement tables.
- Includes grants on the basis of Long Residence and grants on a discretionary basis. Also includes a small number of cases where the category of grant has not been recorded.
Figure 1: Grants of settlement by reason, year ending September 2009 to 2018
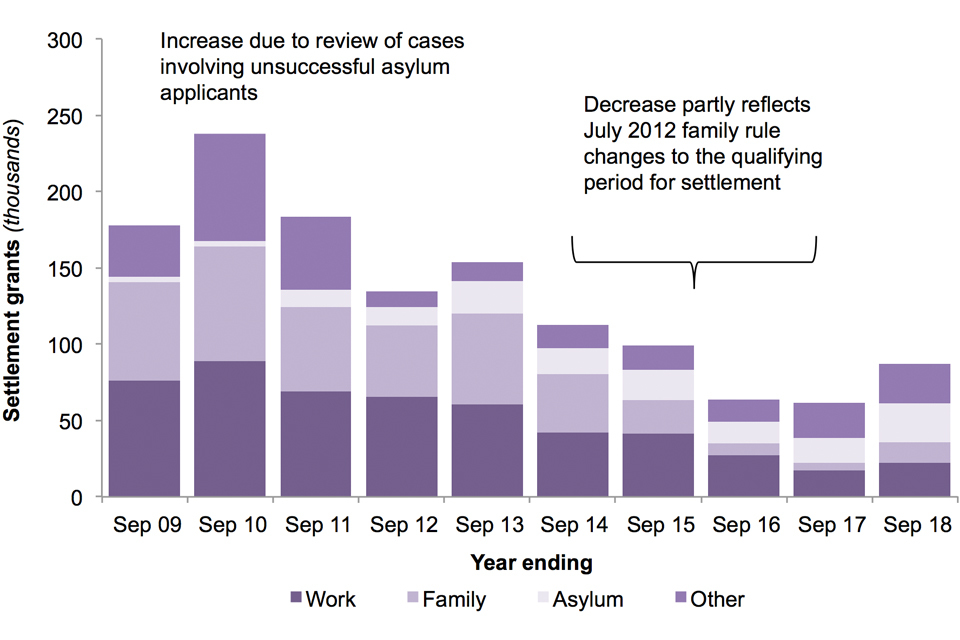
The chart shows the number of people granted settlement by reason, over the last 10 years.
Source: Settlement table se 02
3. EEA nationals and their family members
3.1 Registration certificates and registration cards
In the year ending September 2018, there were 86,384 registration certificates and registration cards issued, 29% less than in the previous year. This fall followed the sharp increases seen in the period immediately following the referendum on membership of the EU in June 2016. There were 46% fewer registration certificates issued to EU nationals (down 38,085 to 44,403) and 6% fewer registration documents issued to non-EU nationals (down 2,389 to 41,981).
Figure 2: Number of EEA1 residence documents issued to EU and non-EU,2 nationals, year ending September 2009 to 2018
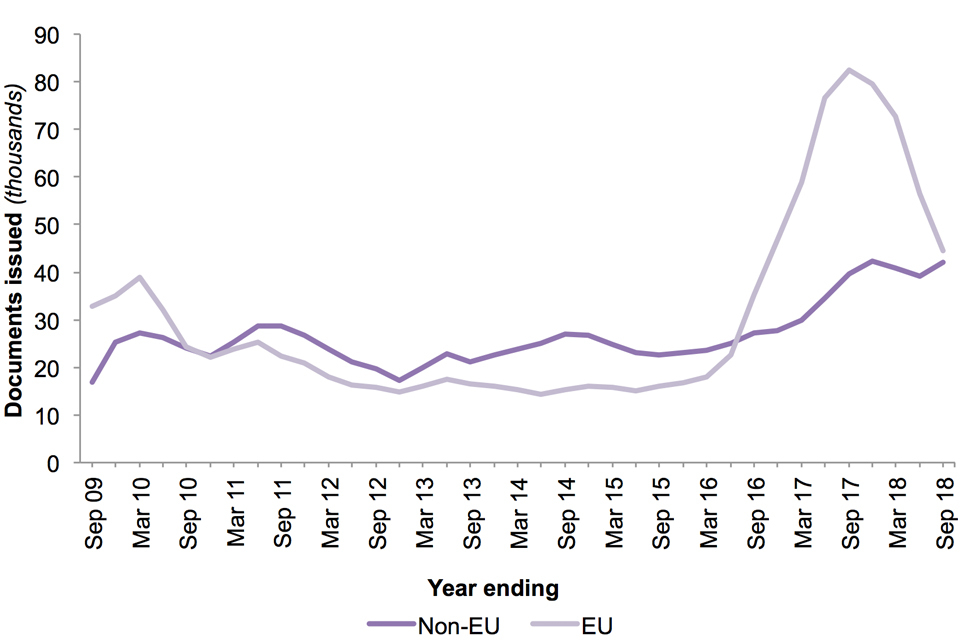
The chart shows registration certificates and registration cards issued to EEA nationals and their family members for the last 10 years.
Source:
Chart notes:
- The EEA consists of the 28 countries of the European Union, plus Iceland, Liechtenstein and Norway. See the user guide for a list of countries within the EU.
- Non-EU includes non-EEA family members of EEA nationals and small numbers of EEA nationals from Iceland, Lichtenstein and Norway, and Swiss nationals.
3.2 Documents certifying permanent residence and permanent residence cards
There were 102,012 documents certifying permanent residence and permanent residence cards issued in the year ending September 2018, 39% less than the previous year.
Following the EU referendum, the number issued to EU nationals increased significantly to a peak of 168,413 in the year ending December 2017. The fall in the most recent period continues a downward trend, but still remains higher than levels seen before the EU referendum.
Figure 3: Number of EEA1 permanent residence documents issued to EU and non-EU2 nationals, year ending September 2009 to 2018
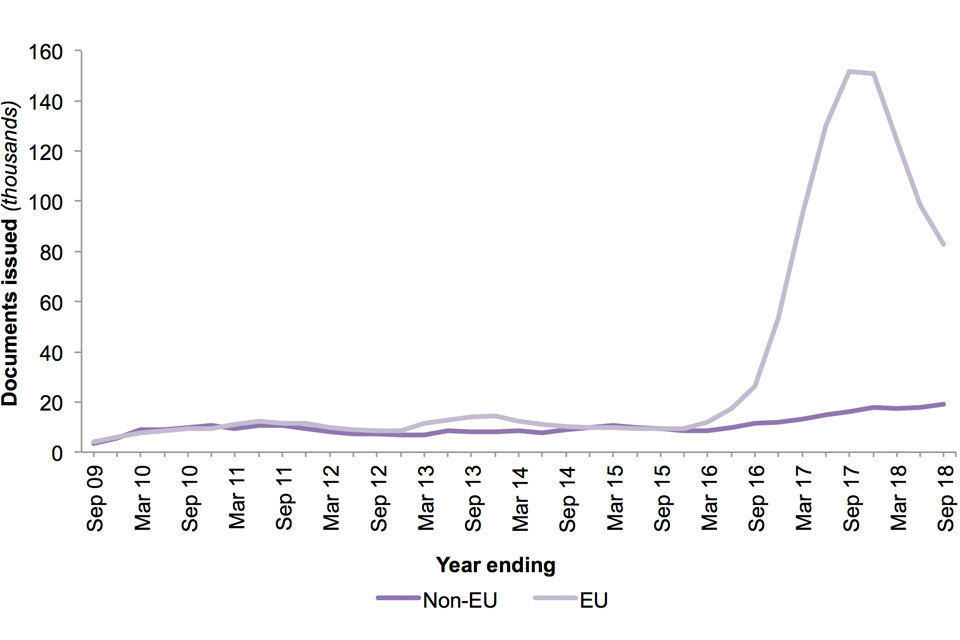
The chart shows the number of documents issued certifying permanent residence and permanent residence cards for EEA nationals and family members for the last 10 years.
Source:
Chart notes:
- The EEA consists of the 28 countries of the European Union, plus Iceland, Liechtenstein and Norway. See the user guide for a list of countries within the EU.
- Non-EU includes non-EEA family members of EEA nationals and small numbers of EEA nationals from Iceland, Lichtenstein and Norway, and Swiss nationals.
4. Citizenship
There were 148,737 applications for British citizenship in the year ending September 2018, 8% more than in the previous year.
In the year ending September 2018, applications for citizenship made by EU nationals increased by 32% to 43,545. EU nationals now account for 29% of all citizenship applications, compared with 11% in the year ending September 2016.
Applications made by non-EU nationals were broadly stable in the most recent year at 105,192, following falls in the previous 2 years.
Figure 4: Applications for British citizenship, EU and non-EU nationals1, year ending September 2009 to 20182,3
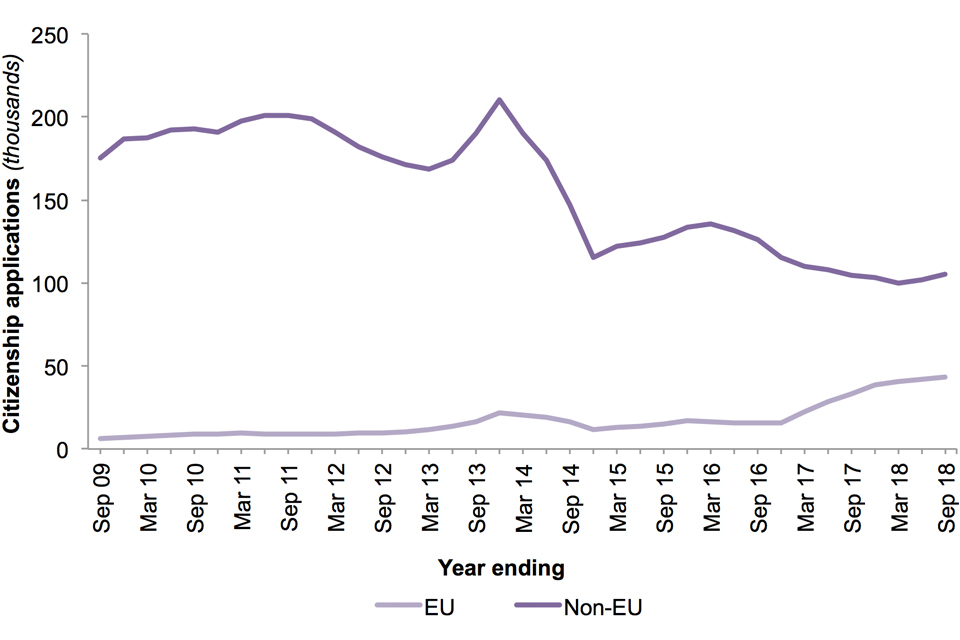
The chart shows numbers of applications for British citizenship made by EU and non-EU nationals for the last 10 years.
Source:
Chart notes:
- Series are based on current EU membership; for example, Croatians are included in the EU total throughout the time series.
- The increase in applications made in 2013 may have reflected people anticipating the rule change to the English language element of the Life in the UK test as of 28 October 2013. See the Policy and Legislative Changes Timeline for details.
- Variations in numbers of applications can be affected by policy and other changes in earlier periods.
Increases in applications from EU nationals in recent years are likely to reflect increases in EU immigration in earlier years. The increase over the last 2 years is likely to have resulted from the perceived uncertainty on their status in the UK following the EU referendum, along with rule changes in 2015, which may have delayed some applications. See the ‘Policy and Legislative Changes Timeline’ for details.
5. About these statistics
The statistics in this section refer to individuals who have leave to remain in the UK who wish to extend, or make permanent, their right to remain in the UK.
Data in this section should be viewed in the context of wider policy and legislative changes, which can impact the number of applications and decisions. It should also consider the availability and allocation of resources within the Home Office, which can affect the number of decisions made in a given period. For example, fewer citizenship decisions were made in 2015 when UKVI resources were used to assist HM Passport Office.
The statistics should not be used to make inferences about the size of the non-British population in the UK. The data do not show whether, or for how long, an individual remains in the UK once their right to remain has been extended or made permanent.
5.1 Extension of temporary stay in the UK
Extensions of temporary stay in the UK relates to individuals inside the UK extending or changing the status of their right to stay in the UK. An individual is required to apply for an extension or change in status before their existing permission to enter or stay in the UK expires.
The statistics in this section show the number of grants and refusals in a given year on applications for extension of temporary stay in the UK. One individual may make multiple applications for an extension, so may account for multiple decisions in a given period. Data in this section include dependants and take account of the outcomes of reconsiderations and appeals.
The statistics do not show the number of people applying to extend their temporary stay in the UK, nor do they show how long an individual actually stayed in the UK following their extension.
Further information on the statistics in this section can be found in the extension section of the user guide.
5.2 Settlement
Settlement can be granted to individuals, subject to immigration control, to allow them to work, study and travel into and out of the UK without restriction. To be granted settlement, individuals generally must have lived in the UK for a certain length of time in a qualifying category. Those granted settlement can access state benefits and register their UK-born children as British citizens. It does not entitle the individual to a British passport (which requires British citizenship) or to vote in general elections (which require British, Commonwealth or Irish Republic citizenship).
The statistics in this section show the number of grants and refusals in a given year on applications for settlement in the UK. They take account of the outcomes of reconsiderations and appeals.
The data on settlement refusals relate to cases where settlement was refused and no other form of leave was granted. Cases where settlement was refused but an extension was granted instead (for example where an individual has not met the qualifying period for settlement) will not be included in the refusal figure.
Individuals who leave the UK for more than 2 years may have their settlement status revoked, except in exceptional circumstances. The statistics do not differentiate between those granted settlement for the first time, and those granted settlement multiple times.
5.3 EEA nationals and their family members
EEA and Swiss nationals have freedom of movement throughout the EEA. Non-EEA nationals who are dependants of EEA national residents in the UK can share their residence if they satisfy certain conditions. See the user guide for details.
The statistics in this section show the number of registration certificates and registration cards issued, and the number of documents certifying permanent residence and permanent residence cards issues.
More information about applying for residence documentation and how the status of EU citizens in the UK will be secured after the UK leaves the EU is available on GOV.UK.
Figures on applications received and cases currently outstanding in the European casework route (along with other information such as percentage processed within service standards) can be found in the ‘In-country migration data’ of the UK Visas and Immigration section on the Migration transparency data web page, In-country migration data.
5.4 Citizenship
British citizens can live and work in the UK free of any immigration controls. They can apply for a British passport, register to vote in all forms of election and referenda and share in all the other rights and responsibilities of their status.
Dual citizenship (also known as dual nationality) is allowed in the UK. This means people can be a British citizen and also a citizen of other countries.
If someone is not already a British citizen based on where and when they were born, or their parents’ circumstances, they can apply to become one.
The statistics in this section show the number of applications for British citizenship. Data on the number of grants of citizenship are available in the associated data tables.
6. Data tables
Data referred to here can be found in the following tables: