EU Settlement Scheme quarterly statistics, June 2021
Updated 21 September 2021

© Crown copyright 2021
This publication is licensed under the terms of the Open Government Licence v3.0 except where otherwise stated. To view this licence, visit nationalarchives.gov.uk/doc/open-government-licence/version/3 or write to the Information Policy Team, The National Archives, Kew, London TW9 4DU, or email: psi@nationalarchives.gov.uk.
Where we have identified any third party copyright information you will need to obtain permission from the copyright holders concerned.
This publication is available at https://www.gov.uk/government/statistics/eu-settlement-scheme-quarterly-statistics-june-2021/eu-settlement-scheme-quarterly-statistics-june-2021
This is not the latest release. View latest release.
1. Introduction
In line with the Citizens’ Rights Agreements, the EU Settlement Scheme (EUSS) enables EU, other EEA and Swiss citizens resident in the UK by the end of the transition period at 11pm on 31 December 2020, and their family members, to obtain a UK immigration status. Further information about the EUSS, including eligibility requirements and details regarding making a late application, can be found on the GOV.UK EU Settlement Scheme webpage.
The scheme is a simple digital system which allows EU, other EEA and Swiss citizens resident in the UK by the end of the transition period, and their family members, to obtain, free of charge, settled status or pre-settled status in the UK. Find out more about what settled and pre-settled status means.
The EU Settlement Scheme launched on 30 March 2019, following the success of two private beta testing phases and public beta testing of the application process. During the testing phases (between 28 August 2018 and 29 March 2019) there were over 230,000 applications. A final report on the public beta test phase was published on 2 May 2019.
1.1 About this release
This publication takes an in-depth look at the total number of applications to the EU Settlement Scheme between 28 August 2018 and 30 June 2021 (the deadline for applications by those resident in the UK by the end of the transition period), and their outcomes. This covers the period between the launch of the first private beta scheme to the end of Q2 2021.
Applications to the scheme and their outcomes are presented by nationality, age, and geography (which includes constituent parts of the UK, region and local authority). Additional information on applications made on the basis of a derivative right to reside is also included.
Repeat applicants and their outcomes are included in this publication reflecting a data matching methodology which enables us to link multiple applications to individual applicants. Additional detail on repeat application data can be found in the ‘About the data’ section and in section 5.3 in the Home Office EU Settlement Scheme statistics: user guide.)
Following the simplification of the high level monthly EUSS figures in July 2020, table EUSS_MON has been included in subsequent quarterly releases, providing monthly breakdowns of applications by nationality, UK country and outcome, using the same format as the previously published monthly statistics reports.
1.2 Related data
High-level monthly statistical updates compliment the detailed quarterly statistics and can be found at: EU Settlement Scheme statistics.
The monthly figures provide more timely updates on the high-level progress of the EU Settlement Scheme, whereas the quarterly release provides users with greater detail on the applications received, their outcomes and additional supporting data.
The previous monthly update, covering the period up to the end of August 2021, was published on 16 September 2021.
1.3 About the data
These statistics are released as Experimental Statistics, meaning they are going through development and evaluation. The Home Office is continuing to work to improve these statistics to ensure they meet the needs of users. Further details can be found in the ONS Guide to Experimental Statistics.
Totals published in the quarterly release may not necessarily match the totals in the monthly updates. Figures are sourced from a live operational database, to which revisions may be made. Data used to produce the quarterly report are extracted after the monthly data covering the corresponding time period, so there may be slight variation between the figures.
Figures in this publication refer specifically to applications made to the EU Settlement Scheme and cannot be directly compared with estimates of the resident population of EU/EEA nationals in the UK. Figures in this report include non-EEA national family members and eligible EEA nationals not resident in the UK. None of these are usually included in estimates of the resident EU/EEA population. Furthermore, the population estimates do not take account of people’s migration intentions and will include people who have come to the UK for a range of purposes, including some who have no intention to settle in the UK.
Paper applications
Applications to the EU Settlement Scheme are generally made through an online system, although there are certain exceptions where applications may be submitted using a paper application form.
Paper application forms may be submitted by applicants who:
- Are applying on the basis of a derivative right to reside;
- Do not hold a valid identity document and are unable to obtain one;
- Are unable to apply using the online application form and cannot be supported to do so.
Additional information can be found on the GOV.UK EU Settlement Scheme webpage and in the Home Office EU Settlement Scheme statistics: user guide.
This publication also provides additional detail on applicants applying on the basis of a derivative right to reside in the UK, which constitute the majority of applications submitted using a paper application form. Derivative rights of residence are relevant to applicants who did not qualify for a right of residence under the Free Movement Directive (Directive 2004/38/EC), but may have had a right to reside in the UK derived from other EU law. Derivative rights applicants can apply to the EU Settlement Scheme under one of the following routes:
- Chen
- Ibrahim & Teixeira
- Lounes & Surinder Singh
- Zambrano
Further information on the above routes and eligibility requirements for each can be found in the Home Office EU Settlement Scheme statistics: user guide.
Repeat Applications
The data in this report account for the number of applications to the system, including individuals making applications on more than one occasion. An individual who has been granted pre-settled status can make a new application at a later stage to apply for settled status. As these are separate applications with separate outcomes, they are counted separately in the statistics. There are several caseworking systems used to administer applications to the scheme, each with a unique application number but not a single person identifier to distinguish repeat applicants. Analysis using probabilistic data matching methods have been developed to better understand the number of repeat applicants to the scheme. This allows us to provide more accurate figures on the number of people who have applied to the EU Settlement Scheme overall, including their outcomes. More information regarding the methodology is provided in section 5 in the [Home Office EU Settlement Scheme statistics: user guide].
1.4 User Guide
The Home Office EU Settlement Scheme statistics: user guide provides further details on this topic including, definitions used, data conventions, methods, data quality, and issues arising from figures based on data sourced from a live operational database.
1.5 Feedback
We welcome feedback on the ‘EU Settlement Scheme statistics’ publications. Additionally, we’re always looking to improve the accessibility of our documents. If you find any problems, or have any feedback relating to accessibility or otherwise, please contact us by emailing MigrationStatsEnquiries@homeoffice.gov.uk. Please include the words ‘EUSS PUBLICATION FEEDBACK’ in the subject of your email.
2. Key points
This report covers the period from 28 August 2018 up to 30 June 2021.
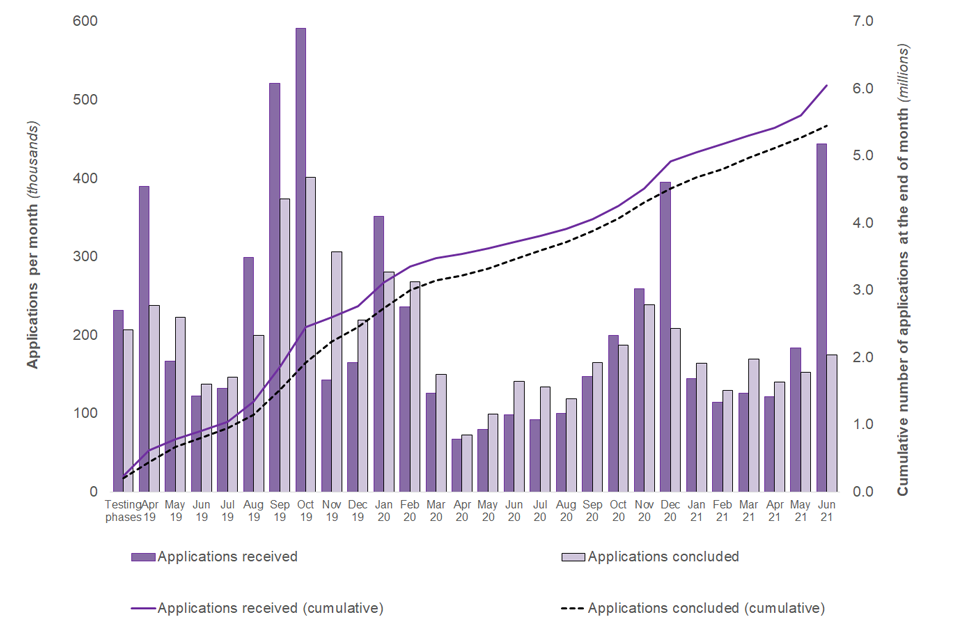
Figure 1 - EU Settlement Scheme: cumulative number of applications received, and applications concluded at the end of each month since the start of the scheme
Source: Table EUSS_MON, EU Settlement Scheme quarterly statistics tables
Applications received
-
As seen in Figure 1, as of 30 June 2021, just over 6 million (6,050,860) applications had been received, with 90% received in England, 5% in Scotland, 2% in Wales and 2% in Northern Ireland. Since the launch of the scheme, October 2019 saw the highest number of applications received (591,580) and the highest number of concluded applications (401,480). The end of the transition period (June 2021) saw the third largest volume of applications to the scheme (443,790).
-
Across all nationalities, the highest numbers of applications received were from Polish, Romanian and Italian nationals. This has been the trend throughout the life of the scheme. Polish and Romanian nationals were consistently among the highest application numbers within England, Scotland and Wales. For Northern Ireland, however, Polish and Lithuanian nationals accounted for the largest number of applications.
-
There were just over 1 million (1,002,280) applications received from people under 18 years of age, 4.9 million (4,896,420) applications from those aged 18 to 64 and 152,120 applications from those aged 65 and above (17%, 81% and 3%, respectively). Northern Ireland had a noticeably higher proportion (20%) of applications from people under 18 compared to the rest of the UK (average of 16% for each nation).
-
There were 420,150 applications received from non-EEA nationals, with the highest applications from Indian (68,810), Pakistani (55,930) and Brazilian nationals (43,490).
Applications concluded
-
5.4 million (5,444,550) applications had been concluded up 30 June 2021).
-
Of the concluded outcomes, 52% (2,846,820) were granted settled status, 43% (2,327,850) were granted pre-settled status and 4% had other outcomes (including 109,430 refused applications, 80,600 withdrawn or void applications, and 79,730 invalid applications).
-
Concluded outcomes granted settled status were higher for Northern Ireland, Wales and Scotland (60%, 57%, 56%, respectively), compared to England (53%).
Repeat applicants
-
Of the 6.1 million applications recieved, 8% were from repeat applicants (472,220)
-
This indicates that an estimated 5,548,440 people had applied to the scheme up to 30 June 2021, with over 4.9 million obtaining a grant of status.
-
89% of repeat applicants have received a grant of status (Settled or Pre-settled Status).
-
44% of repeat applicants have moved from Pre-settled to Settled status.
-
Romanian nationals accounted for the highest number of repeat applicants to the scheme (118,870, 25%).
Local authority statistics
-
As of 30 June 2021, Newham saw the highest number of applications to the scheme (142,120).
-
As of 30 June 2021, of all local authorities, Ealing had the highest number of applications from Polish nationals (26,290), Newham from Romanian nationals (44,150) and Tower Hamlets from Italian nationals (21.910).
Applications on the basis of a derivative right to reside
- There were 4,800 applications received from family members of British citizens (Surinder Singh and Lounes), 7,320 applications received from Zambrano applicants, 1,630 applications received from Chen applicants and 390 applications received from Ibrahim & Teixeira applicants.
3. Applications to the EU Settlement Scheme
The total number of applications received up to 30 June 2021 was 6,050,860.
3.1 Repeat applicants
Individuals can make more than one application to the EU Settlement Scheme. Repeat applicants may for example receive an outcome on an application and then have another application pending, or receive an outcome on one application and choose to withdraw another application.
Of the 6.1 million applications received, approximately 8% were repeat from applicants (472,220).
This indicates that an estimated 5,548,440 people have applied to the scheme with over 4.9 million (4,908,760) obtaining a grant of status [footnote 1].
Table 1 - EU Settlement Scheme: number of applications to the scheme by people, 28 August 2018 to 30 June 2021
| Applications submitted | People applied to EUSS |
|---|---|
| 1 application | 5,076,220 |
| 2 applications | 445,070 |
| 3 or more applications | 27,150 |
| Total | 5,548,440 |
Source: Table EUSS_RA_01, EU Settlement Scheme quarterly statistics tables
As Table 1 shows, of the people that made a repeat application (472,220), the vast majority made just one further application (94%).
Of the repeat applicant cohort, as of 30 June 2021:
89% (418,390) of repeat applicants have received a grant of status:
- Of those, 44% (206,490) moved from Pre-settled to Settled status.
- 12% (56,160) recieved a grant of Settled status following an ‘other’ outcome(s).
- 33% (155,750) received a grant of Pre-settled status following an ‘other’ outcome(s) or a previous grant of Pre-settled status.
In addition:
- 11% (53,830) of repeat applicants have not yet recieved a grant of status (either Pre-settled or Settled).
- Of those, 3% (14,380) have not yet received an outcome.
Figures on repeat applicants can be found in data Table EUSS_RA_01 EU Settlement Scheme quarterly statistics tables
3.2 Repeat applicants by nationality
As of 30 June 2021, there were 427,180 repeat applicants from EU nationals, with Romanian nationals (118,870) submitting the highest number of repeat applications (25%) followed by Italian (56,860, 12%) and Polish (51,320, 11%) nationals.
38,810 (8%) of repeat applicants were non-EEA nationals.
Figures on repeat applicants can be found in data Table EUSS_RA_02 EU Settlement Scheme quarterly statistics tables
3.3 Applicants who have moved from Pre-settled to Settled status
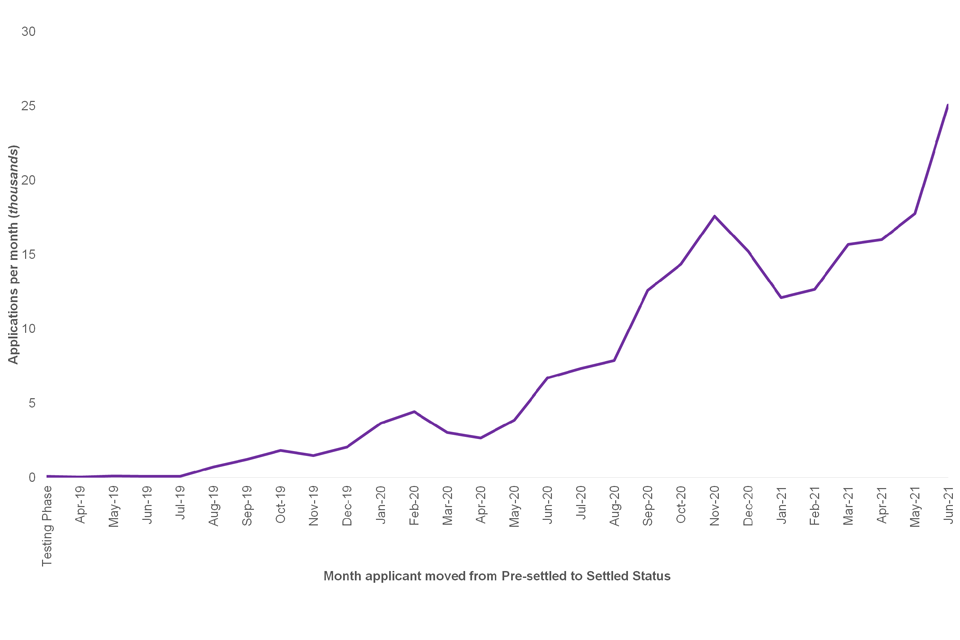
Figure 2 below shows the number of applicants who have moved from Pre-settled to Settled status per month since the launch of the scheme. There has been a steady increase in numbers from December 2018 onwards with June 2021 seeing the largest number of people moving from Pre-settled to Settled status so far (25,060 applicants).
Figure 2: EU Settlement Scheme: Repeat applicants moving from Pre-settled to Settled status by month, 28 August 2018 to 30 June 2021
Source: Table EUSS_MON, EU Settlement Scheme quarterly statistics tables
3.4 Applications from England, Scotland, Wales and Northern Ireland
Most applications were received from England (5,419,020; 90%) with an additional 294,230 from Scotland (5%), 99,910 from Wales (2%) and 99,820 from Northern Ireland (2%).
3.5 Applications by nationality
In total, there were 5,570,160 applications received from EU nationals, 60,320 received from other EEA and Swiss nationals and 420,150 received from non-EEA nationals. The nationalities with the highest number of applications received were:
- Polish (1,107,060)
- Romanian (1,082,260)
- Italian (549,510)
- Portuguese (418,070)
- Spanish (356,090)
The top five nationalities combined represent around 58% of applications received. They have remained the top 5 nationalities throughout the scheme.
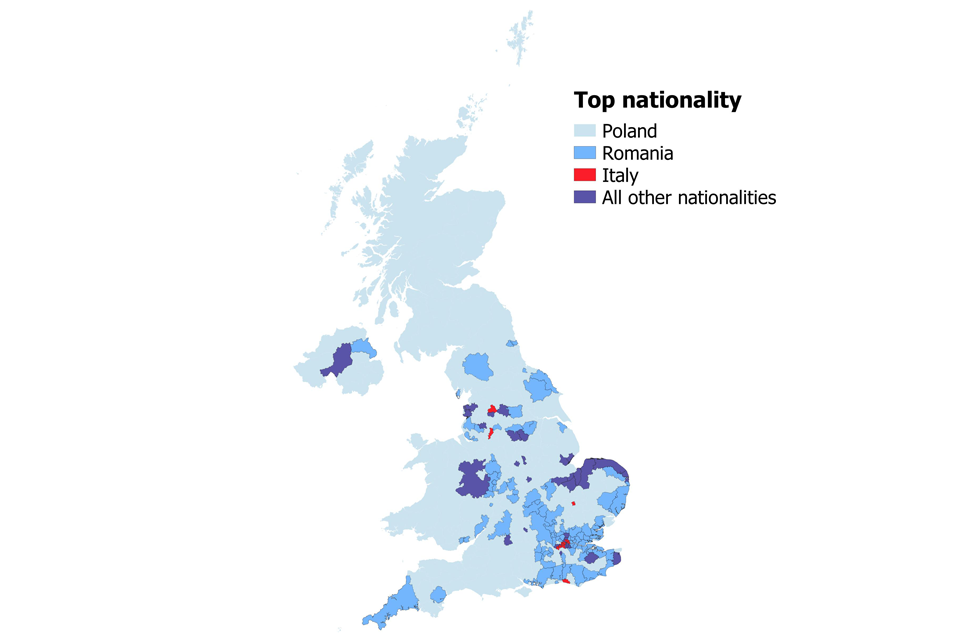
Figure 3 – Highest number of EUSS applications by Polish, Romanian and Italian nationals across local authorities in the UK
Source: Table EUSS_LA_01, EU Settlement Scheme local authority tables
Applications were received from all constituent countries of the UK: England, Scotland, Wales and Northern Ireland, with Poland and Romania featuring in the top 5 nationalities for each country as shown in Table 2.
Table 2 - EU Settlement Scheme: top five nationalities by applications received and UK country, 28 August 2018 to 30 June 2021
| England | Scotland | Wales | Northern Ireland |
|---|---|---|---|
| 1. Romania | Poland | Poland | Poland |
| 2. Poland | Romania | Romania | Lithuania |
| 3. Italy | Italy | Bulgaria | Romania |
| 4. Portugal | Spain | Portugal | Portugal |
| 5. Spain | Bulgaria | Italy | Bulgaria |
Source: Table EUSS_01, EU Settlement Scheme quarterly statistics tables
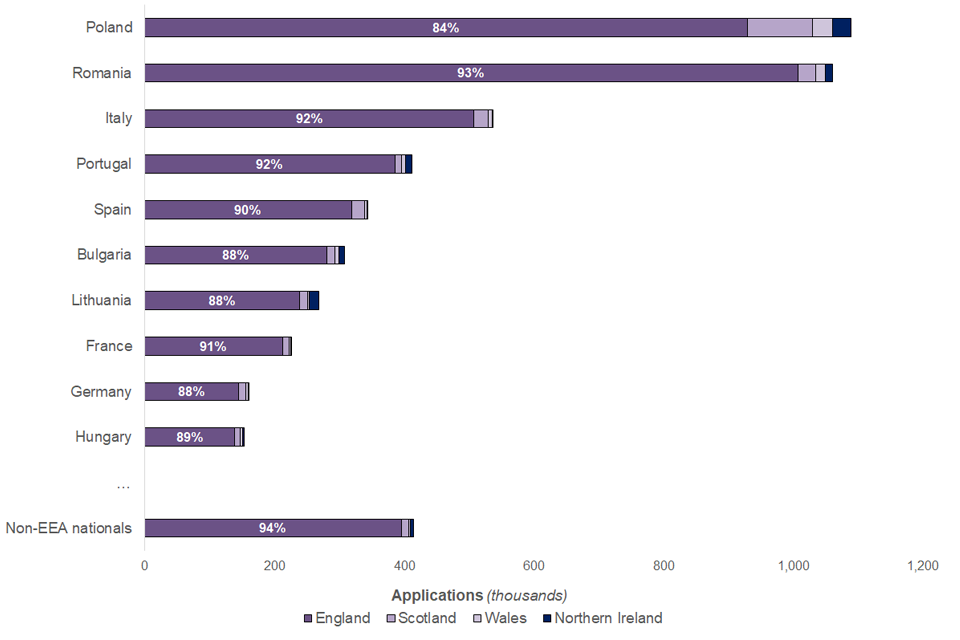
As seen in Figure 4, a lower proportion of applications from Polish nationals were from England (84%) than the average across the top ten nationalities (90%). Scotland had an uptake of 9% for Polish nationals compared to 4% for Italian nationals and 3% for Romanian nationals.
The remaining top five nationalities, Romania, Italy, Portugal and Spain, had a greater number of applicants applying from England than average (93%, 92%, 92% and 90%, respectively). Non-EEA nationals also had a higher than average proportion (94%) of applicants applying from England.
Northern Ireland had more than three times the number of applications for Lithuanian nationals (14%) compared to the average of 4% across all the other nations.
Figure 4 - EU Settlement Scheme: number and proportion of applications by nationality and UK country, 28 August 2018 to 30 June 2021 - top 10 nationalities (and non-EEA nationals) by number of applications
Source: Table EUSS_01, EU Settlement Scheme quarterly statistics tables
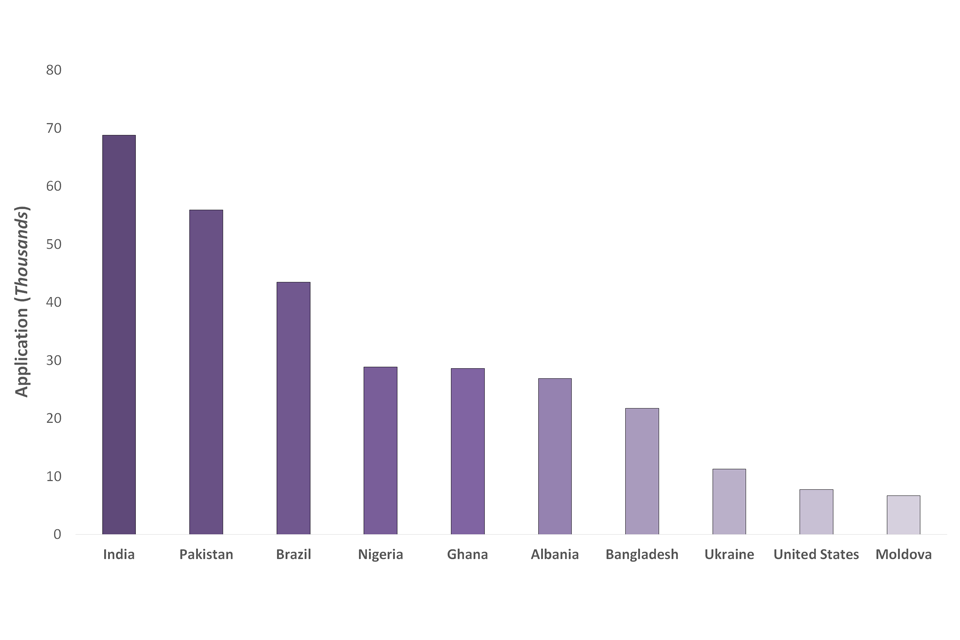
3.6 Applications from non-EEA nationals
There were 420,150 applications from non-EEA nationals. The nationalities with the highest number of applications received up to 30 June 2021 were:
- Indian (68,810)
- Pakistani (55,930)
- Brazilian (43,490)
- Nigerian (28,870)
- Ghanaian (28,640)
The top 10 non-EEA nationalities reflect a similar pattern to applications received through the EUSS family permit route, which were published in the latest Immigration Quarterly statistics. EUSS family permits enable family members of EU, other EEA and Swiss citizens resident in the UK by the end of the transition period (and of qualifying British citizens returning to the UK after living in the EEA or Switzerland) to join them in the UK. Once here the family member can then apply to the EUSS for the immigration status they need to continue living in the UK.
Figure 5 below shows the top 10 non-EEA nationalities to have applied to the scheme up to the end of June 2021
Figure 5 - EU Settlement Scheme: top 10 nationalities by applications received and UK country, 28 August 2018 to 30 June 2021
Source: Table EUSS_Non_EEA_01, EU Settlement Scheme quarterly statistics tables
June 2021 saw the highest number of applications from non-EEA nationals since the launch of the scheme (46,030). The previous highest number was in December 2020 (28,260).
Overall, non-EEA nationals had a greater proportion of pre-settled outcomes (60%) than settled outcomes (30%). Proportions of refusals for non-EEA nationals remain low at 4% but are double that of EU nationals at 2%.
Figures on applications by non-EEA nationals can be found in data Tables EUSS_NON_EEA_01 and EUSS_NON_EEA_02 EU Settlement Scheme quarterly statistics tables
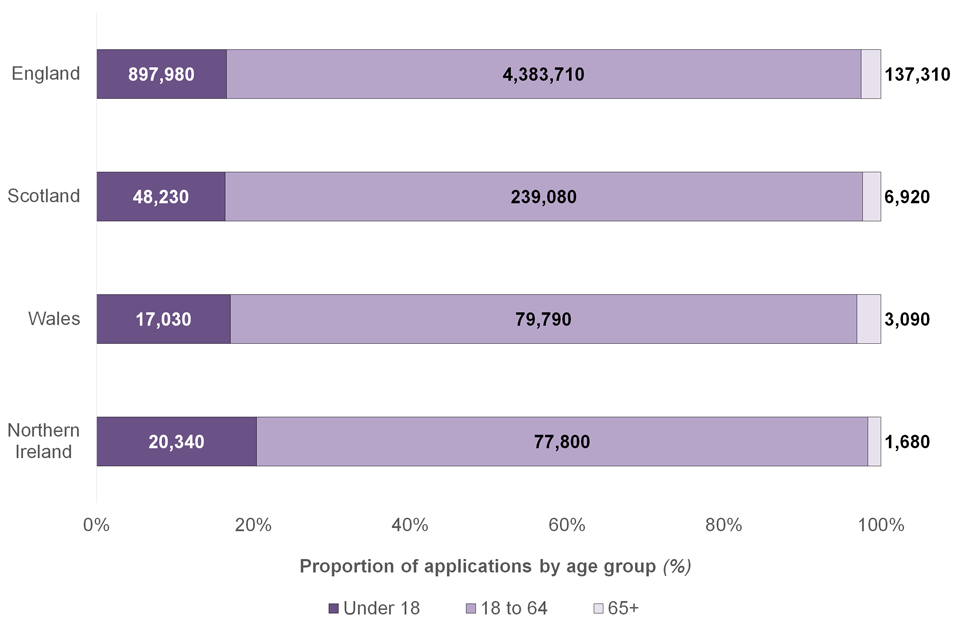
3.7 Applications by age group
Of the 6,050,860 applications received:
- 1,002,280 (17%) were made from applicants under 18 years of age.
- 4,896,420 (81%) were made from applicants aged between 18 and 64.
- 152,120 (3%) were made from applicants aged 65 and over.
Compared to the rest of the UK, Northern Ireland had a noticeably higher proportion (20%) of applications from people under 18. This was and average of 16% across all other nations.
There was some variation in the proportion of applicants from different age groups for different nationalities across the UK. Netherlands and Norwegian nationals (22% respectively) and Belgian, Irish and Slovakian nationals (21% respectively) had the highest proportion of applications from those aged under 18. Maltese nationals had the highest proportion of applications from those aged 65 and over (13%) followed by Swiss nationals (8%).
Figure 6 - EU Settlement Scheme: proportion and number of applications by UK country by age group, 28 August 2018 to 30 June 2021
Source: Table EUSS_02, EU Settlement Scheme quarterly statistics tables
4. Concluded applications to the EU Settlement Scheme
The number of concluded applications up to 30 June 2021 was 5,444,550. Of these, 52% (2,846,820) were granted Settled status and 43% (2,327,850) were granted Pre-settled status. There were 109,430 refusals, 80,600 withdrawn or void outcomes and 79,730 invalid outcomes in the same period, representing 4% of all ‘other’ outcomes. Of the refusals, 99% were refused on eligibility grounds and less than 1% were refused on suitability grounds[footnote 3].
Refusal outcomes occurred across all constituent parts of the United Kingdom, all age groups, and almost all nationalities.
Figures on outcomes by repeat applicants can be found in section 2.1.
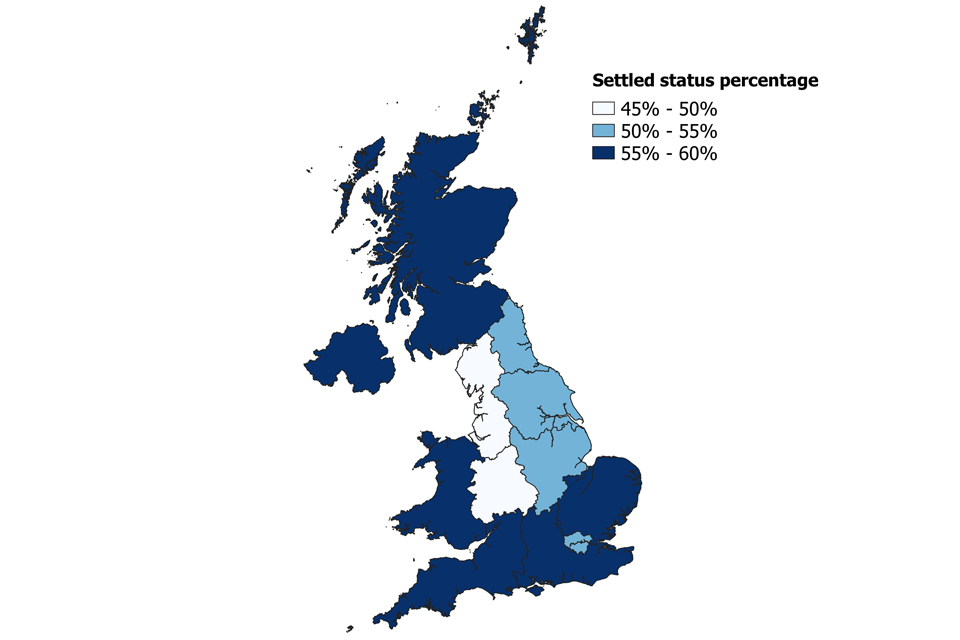
4.1 Concluded applications by UK country
The majority of concluded applications were received from England (4,906,000; 90%), with an additional 270,930 from Scotland (5%), 90,580 from Wales (2%) and 88,700 from Northern Ireland (2%). This has remained the trend throughout the scheme.
England was the source of the greatest number of applications, and the proportion of applications receiving Settled status (52%) across the whole UK is the same as England alone.
Compared to England, applications received in Northern Ireland, Wales and Scotland were more likely to be granted Settled status (60%, 57% and 56%, respectively).
Refused, withdrawn or void, and invalid outcomes occurred across all constituent parts of the UK. Applications from England accounted for the largest proportion of the 109,430 EU Settlement Scheme refusals (88,880, 81%).
Figure 7- Settled Status proportion of grants by region for the whole of the UK
Source: Table EUSS_LA_03, EU Settlement Scheme local authority tables
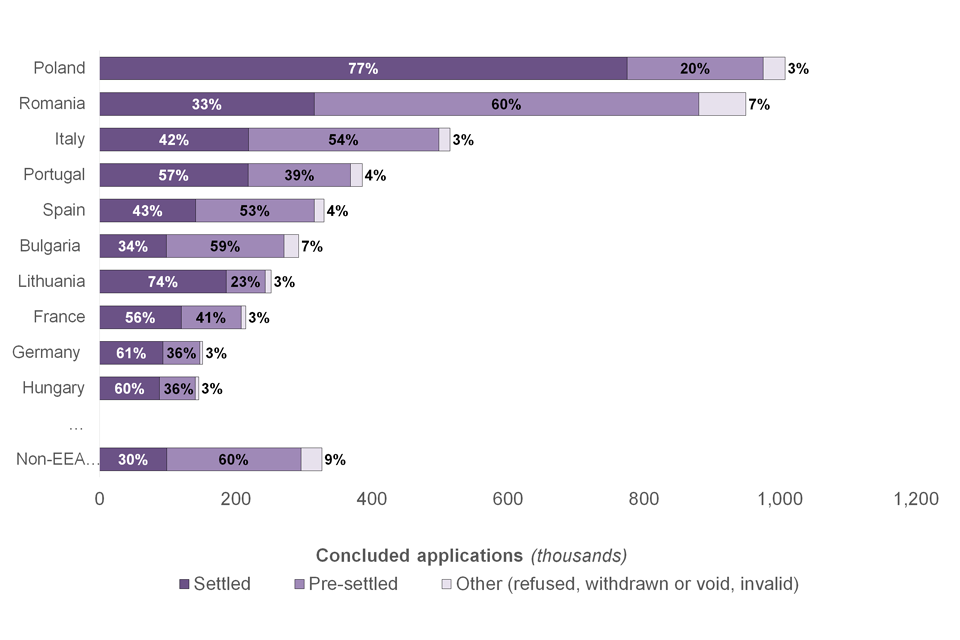
4.2 Concluded applications by nationality
As seen in Figure 5, there were 5,065,570 concluded applications from EU nationals, 52,320 from other EEA and Swiss nationals, and 326,600 from non-EEA nationals. Similar to the number of applications received, the nationalities with the highest number of concluded applications were:
- Polish (1,007,510)
- Romanian (949,810)
- Italian (514,800)
- Portuguese (386,040)
- Spanish (329,930)
The top five nationalities combined represent around 59% of applications concluded. As with applications, these have remained the top 5 concluded nationalities throughout the life of the scheme.
The proportion of settled outcomes differs among the top 10 nationalities, with Polish and Lithuanian nationals having the highest proportion of settled outcomes (77% and 74%, respectively), compared to Croatian and Romanian nationals with the lowest proportions (25% and 33%, respectively).
For non_EEA nationals, the top 5 concluded nationalities were:
- India (57,010)
- Pakistan (43,670)
- Brazil (35,470)
- Ghana (21,710)
- Nigeria (20,190)
Eligible non-EEA nationals had a greater proportion of pre-settled outcomes (60%) than settled outcomes (30%).
Refused, withdrawn or void, and invalid outcomes occurred across most EEA and Swiss nationalities. EU and other EEA and Swiss nationals accounted for 88% of the 109,430 EU Settlement Scheme refusals, with non-EEA nationals accounting for 12% of refusals.
Figure 8 - EU Settlement Scheme: number and proportion of concluded applications by nationality and outcome, 28 August 2018 to 30 June 2021 - top 10 nationalities (and non-EEA nationals) by number of concluded applications
Source: Table EUSS_03_UK, EU Settlement Scheme quarterly statistics tables
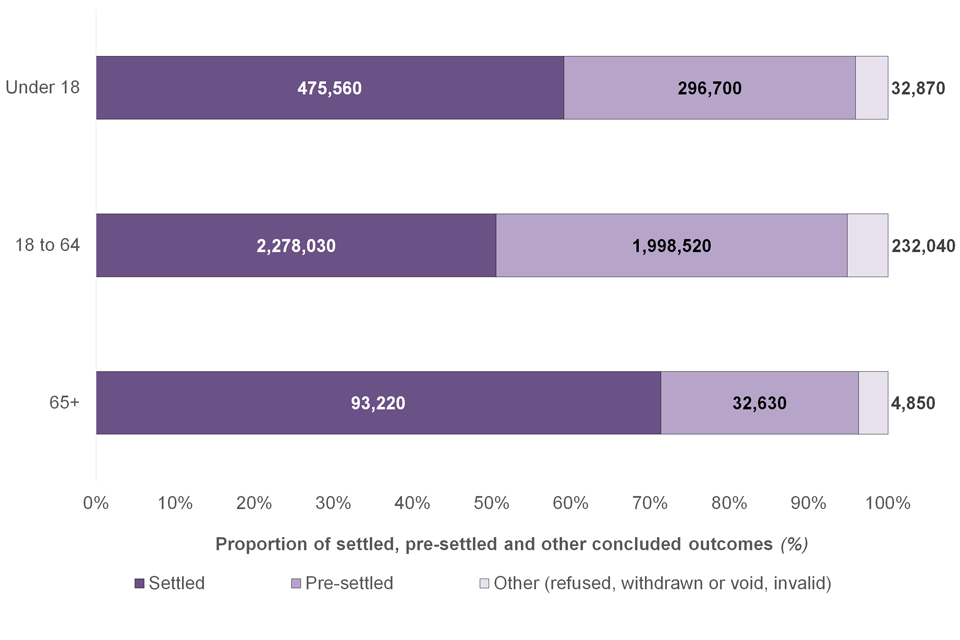
4.3 Concluded applications by age group
There were 4,508,700 concluded applications from persons between 18 to 64 years of age, 805,140 from people under 18, and 130,700 from individuals aged 65 and over. Of the concluded applications made by those aged 65 and over, the majority (71%) resulted in a settled outcome, higher than concluded applications for people under 18 and those aged 18 to 64 (59% and 51%, respectively).
Refused, withdrawn or void, and invalid outcomes occurred across all age groups. Individuals aged between 18 and 64 accounted for the vast majority of the 109,430 EU Settlement Scheme refusals (81%).
Figure 9 - EU Settlement Scheme: proportion and number of concluded applications by age group and outcome, 28 August 2018 to 30 June 2021
Source: Table EUSS_04, EU Settlement Scheme quarterly statistics tables
5. Applications to the EU Settlement Scheme by local authority
Applications to the EU Settlement Scheme were made from all 379 UK local authorities [footnote 4]. Newham saw the highest number of applications to the scheme (142,120).
Table 3 - EU Settlement Scheme: top 10 London local authorities by applications received, 28 August 2018 to 30 June 2021
| Local Authority | UK Region | Applications |
|---|---|---|
| 1. Newham | London | 142,120 |
| 2. Brent | London | 131,260 |
| 3. Ealing | London | 107,390 |
| 4. Haringey | London | 97,420 |
| 5. Barnet | London | 90,550 |
| 6. Enfield | London | 83,230 |
| 7. Hounslow | London | 82,510 |
| 8. Tower Hamlets | London | 81,910 |
| 9. Waltham Forest | London | 81,560 |
| 10. Lambeth | London | 77,230 |
Source: Table EUSS_LA_01, EU Settlement Scheme local authority tables
As shown in Table 3, the UK region of London accounted for seven of the top 10 local authorities by number of applications made.
Figure 10 below shows the top nationality in each local authority.
Figure 10 – EUSS applications by top nationalities in London
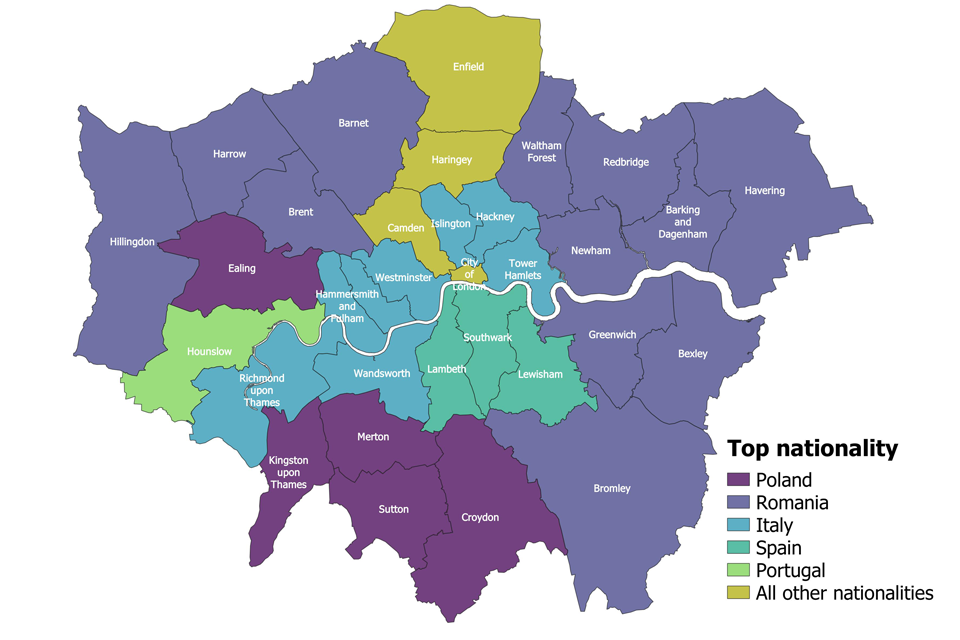
Source: Table EUSS_LA_01, EU Settlement Scheme local authority tables
Birmingham saw the highest number of applications to the scheme (138,490) of all the local authorities outside of London. The top 10 local authorities (excluding London) are spread across multiple regions of the UK with the Midlands and the East of England accounting for six of the top 10. All the top ten local authorities outside of London received applications over 50,000 up to the end of the transition period (30 June 2021).
Table 4 - EU Settlement Scheme: top 10 local authorities outside London by applications received, 28 August 2018 to 30 June 2021
| Local Authority | UK Region | Applications |
|---|---|---|
| 1. Birmingham | West Midlands | 138,490 |
| 2. Manchester | North West | 91,850 |
| 3. Leicester | East Midlands | 91,490 |
| 4. Edinburgh | Scotland | 68,860 |
| 5. Leeds | Yorkshire and The Humber | 64,900 |
| 6. Coventry | West Midlands | 57,690 |
| 7. Northampton | East Midlands | 56,660 |
| 8. Peterborough | East of England | 55,910 |
| 9. Bristol | South West | 55,310 |
| 10. Luton | East of England | 53,560 |
Source: Table EUSS_LA_01, EU Settlement Scheme local authority tables
Scotland had the highest proportion of applications from Polish nationals (34%). The West Midlands saw the highest proportion of Romanian applicants (21%).
At a local authority level, of all local authorities with at least 10,000 applications:
- North Lanarkshire had the highest proportion of applications from Polish nationals (55%).
- Harrow had the highest proportion of applications from Romanian nationals (58%).
- Tower Hamlets had the highest proportion of applications from Italian nationals (27%)
- Swindon had the highest proportion of applications from Portuguese nationals (30%).
- Southwark had the highest proportion of applications from Spanish nationals (22%).
The North West had the highest proportion of applications from people under 18 (22%), London had the highest proportion of applications for those aged 18 to 64 (84%), and the South East, East of England, South West and Wales had the highest proportion of applications from individuals aged 65 and over (3%).
At a local authority level, of all local authorities with at least 10,000 applications:
- Bolton and Oldham had the highest proportion of applications from people under 18 (32%);
- Islington had the joint highest proportion of applications from people aged 18 to 64 (92%);
- Broxbourne had the highest proportion of applications from people over 65 (9%).
6. Applications based on a derivative right to reside
Derivative rights applicants are applicants who did not qualify for a right of residence under the Free Movement Directive but may have had a right to reside in the UK derived from other EU law. Derivative rights applicants can apply to the EU Settlement Scheme under one of the following routes:
- Chen
- Ibrahim & Teixeira
- Lounes & Surinder Singh
- Zambrano
More information on these routes and eligibility requirements can be found in the Home Office EU Settlement Scheme statistics: user guide.
There were 4,800 applications received (4,680 concluded) from family members of British citizens (Lounes and Surinder Singh), 7,320 applications received (3,590 concluded) from Zambrano applicants, 1,630 applications received (810 concluded) from Chen applicants and 390 applications received (110 concluded) from Ibrahim & Teixeira applicants.
When looking at the total refusals in the derivative rights applicants (2,490), Zambrano applications accounted for 89% of the total (2,220).
7. About these statistics
This is the ninth quarterly statistical publication on the progress of the EU Settlement Scheme, which are designed to complement higher-level monthly data published on the EU Settlement Scheme.
If, as a user, you have any comments on this report please email MigrationStatsEnquiries@homeoffice.gov.uk. Please include the words ‘EUSS PUBLICATION FEEDBACK’ in the subject of your email.
The findings presented here are based on data collected from Home Office administrative systems. These systems hold records of individual applications that have been received to the EU Settlement Scheme and their outcomes (settled or pre-settled status, and other outcomes). As these are sourced from live operational systems, numbers may change and may not precisely reflect other published statistics produced at a different point in time. The majority of applicants to the scheme are EEA nationals, but non-EEA nationals are eligible to apply in some cases. Non-EEA nationals who have submitted an application to the scheme are included in these statistics.
The Home Office EU Settlement Scheme statistics: user guide provides further details on this topic, including definitions used, data conventions, methods, data quality, and further considerations arising from figures based on data sourced from a live operational database.
8. Other related data
The Home Office publishes high-level progress information on the EU Settlement Scheme through monthly Experimental Statistics, available from the EU Settlement Scheme Statistics collection on GOV.UK.
Key findings of the earlier test phases of the EU Settlement Scheme can be found on GOV.UK at EU Settlement Scheme private beta 1, EU Settlement Scheme private beta 2 and EU Settlement Scheme public beta testing phase report.
The EU Settlement Scheme (EUSS) Family Permit facilitates entry into the UK of an eligible family member, in order to join or accompany, an EEA or Swiss citizen who has been granted settled or pre-settled status under the EU Settlement Scheme. Data on EUSS Family Permits are published as part of the quarterly Home Office “Immigration Statistics”, and are covered in the chapter ‘Why do people come to the UK? For family reasons’. The latest quarterly Immigration Statistics report was published on 26 August 2021.
The Home Office Looked After Children and Care Leavers Survey, 2021 provides estimates of the numbers of looked after children and care leavers eligible to apply to the EU Settlement Scheme. The follow up survey findings identified 3,660 looked after children and care leavers eligible to apply to the EUSS, and that 67% had applied to the scheme as of 23 April 2021. The updated report was published on 13 May 2021.
9. Data tables
Further data on the EU Settlement Scheme for the period 28 August 2018 to 30 June 2021, are available in:
-
EUSS_01 to EUSS_05, EUSS_DR_01, EUSS_RA_01, EUSS_RA_02 , EUSS_MON, EUSS_Non_EEA_01 and EUSS_Non_EEA_02 EU Settlement Scheme quarterly statistics tables
-
EUSS_LA_01 to EUSS_LA_03, EU Settlement Scheme quarterly local authority tables
10. Upcoming publications
The next quarterly EU Settlement Scheme release is due for publication in November 2021.
-
Figures on repeat application analysis may not exactly match those in the analysis of cases processed ↩
-
Refusals by suitability stand at less than 0.1% of total refusals ↩
-
Local Authority Districts (April 2020) Names and Codes in the United Kingdom ↩