Detailed analysis of non-fire incidents: England, April 2020 to March 2021
Published 13 January 2022
Applies to England

© Crown copyright 2022
This publication is licensed under the terms of the Open Government Licence v3.0 except where otherwise stated. To view this licence, visit nationalarchives.gov.uk/doc/open-government-licence/version/3 or write to the Information Policy Team, The National Archives, Kew, London TW9 4DU, or email: psi@nationalarchives.gov.uk.
Where we have identified any third party copyright information you will need to obtain permission from the copyright holders concerned.
This publication is available at https://www.gov.uk/government/statistics/detailed-analysis-of-non-fire-incidents-england-april-2020-to-march-2021/detailed-analysis-of-non-fire-incidents-england-april-2020-to-march-2021
Frequency of release: Annual
Forthcoming releases: Home Office statistics release calendar
Home Office responsible statistician: Paul Gaught-Allen
Press enquiries: pressoffice@homeoffice.gov.uk
Telephone: 0300 123 3535
Public enquiries: firestatistics@homeoffice.gov.uk
This release contains statistics about non-fire incidents attended by fire and rescue services (FRSs) in England for the financial year 2020 to 2021 (1 April 2020 to 31 March 2021). The statistics are sourced from the Home Office’s online Incident Recording System (IRS) and include statistics on all non-fire incidents and related fatalities and non-fatal casualties, with long term comparisons.
1. Key results
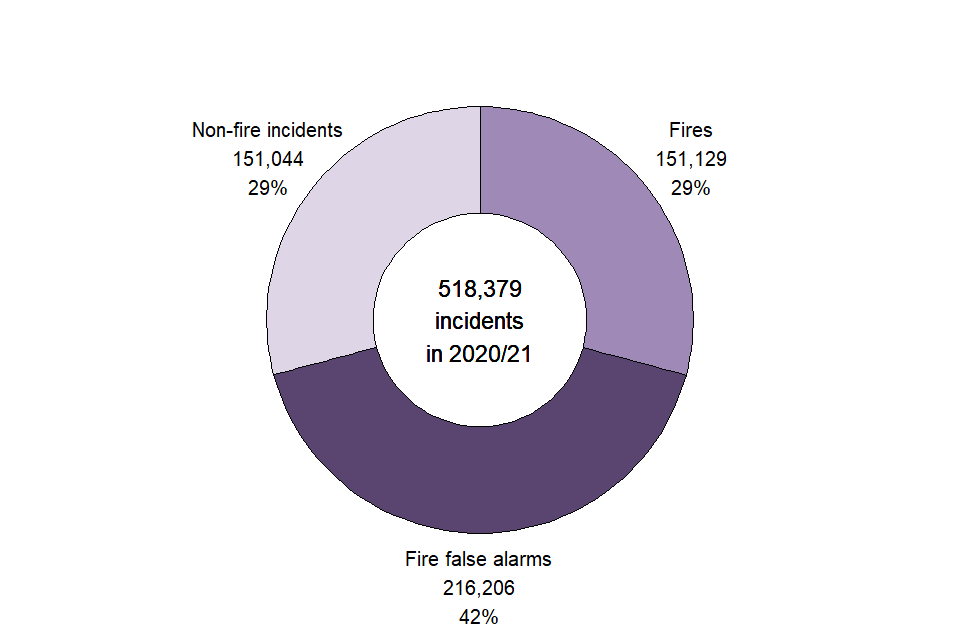
In the financial year 2020 to 2021 there were 151,044 non-fire incidents and 2,746 fatalities in non-fire incidents (a decrease of 12 per cent and an increase of five per cent respectively compared to the previous year).
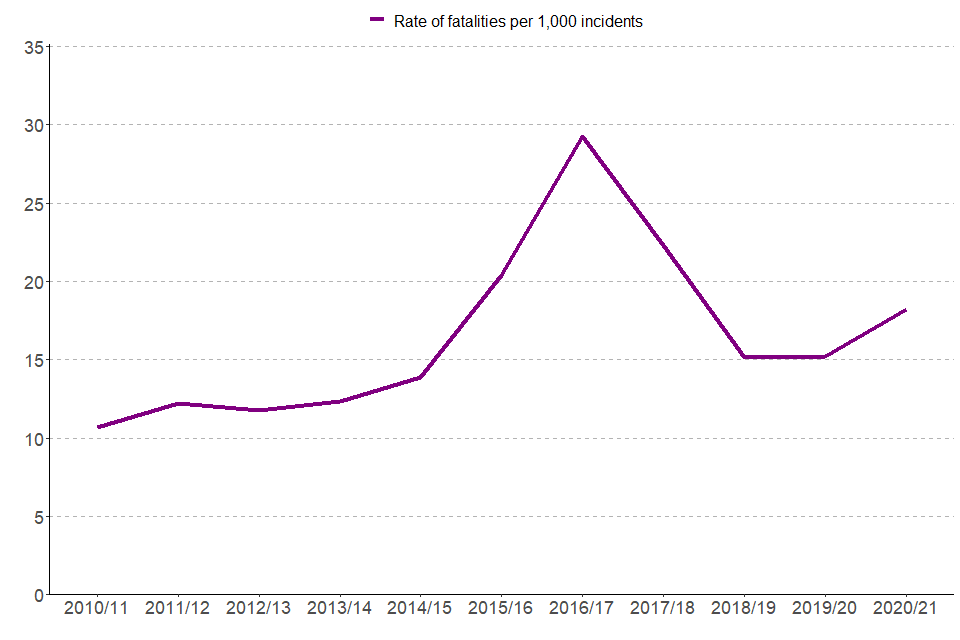
In the financial year 2020 to 2021 there were 18 fatalities per 1,000 non-fire incidents. The fatality rate peaked around the financial year 2016 to 2017, predominantly due to the introduction of the emergency medical responding trials during which FRSs attended more emergency incidents.
In the financial year 2020 to 2021 there were 30,359 non-fatal casualties in non-fire incidents, a decrease of 20 per cent from last year.
2. Non-fire incidents summary
FRSs attend many types of incident that are not fires or fire false alarms, these are known as non-fire incidents or special service incidents. Examples include flooding incidents, responding to road traffic collisions, animal assistance, effecting entry/exit and assisting other agencies.
Each year the content of this release is reviewed to ensure topics of interest are reported on. This year’s release includes chapters covering overall trends in non-fire incidents, fatalities and non-fatal casualties in non-fire incidents, road traffic collisions, medical incidents, collaborating incidents and lift release incidents.
2.1 Key results
In the financial year 2020 to 2021, fire services attended:
- 151,044 non-fire incidents, this is a decrease of 12 per cent from the previous year (172,202) and a decrease of one per cent from five years ago (152,987)
The most common categories of non-fire incidents attended were:
-
effecting entry/exit (24,242 incidents, an eight per cent decrease compared with the previous year)
-
road traffic collisions (22,524 incidents, a 28 per cent decrease compared with the previous year)
-
assisting other agencies (20,023 incidents, a ten per cent increase compared with the previous year)
2.2 Trends in non-fire incidents
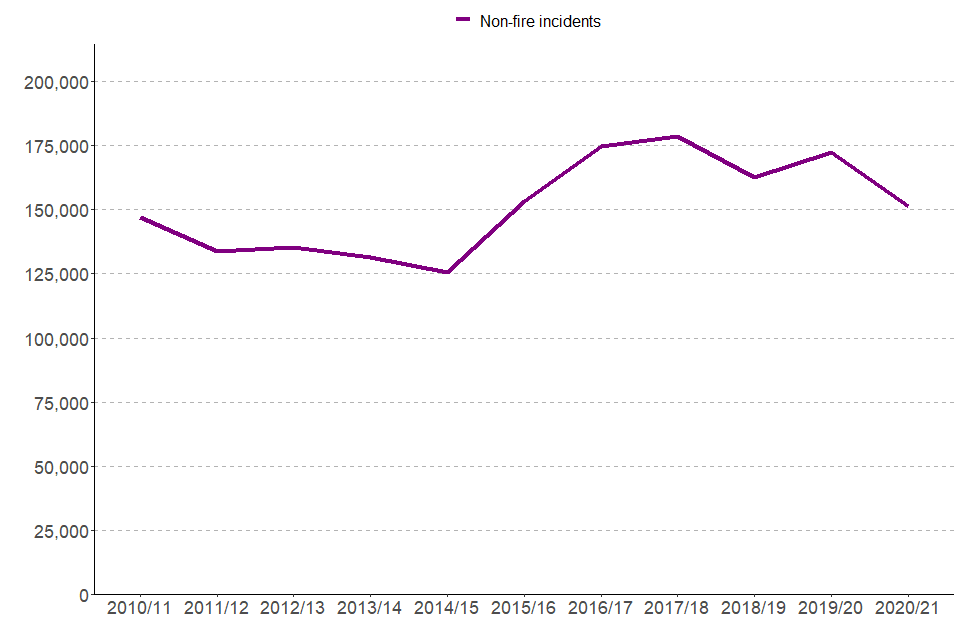
Between the financial year 1999 to 2000 and the financial year 2008 to 2009 the number of non-fire incidents fluctuated between 155,000 and 175,000. There was then a general decline in the number of non-fire incidents[footnote 1] from around 155,000 in the financial year 2008 to 2009 to around 125,000 in the financial year 2014 to 2015.
Following this period of decline there were two substantial year on year increases. In the financial year 2015 to 2016 the number of non-fire incidents was up to around 153,000 and peaked in the financial year 2016 to 2017 at around 175,000. These increases coincided with the introduction, in 2015, of the National Joint Council supported trials of emergency medical responding, where FRSs formed agreements with ambulance trusts to undertake health and care related work, particularly co-responding. The Fire Brigades Union removed support for the trials in September 2017, which is likely to have driven the subsequent reduction in the number of non-fire incidents seen in the following years.
In the financial year 2020 to 2021, the number of non-fire incidents decreased to 151,044 compared with 172,202 in the financial year 2019 to 2020 (a 12% decrease). This was the lowest figure of non-fire incidents since the financial year 2014 to 2015. However, it should be noted that this relatively low figure could have been affected by restrictions on life throughout the financial year 2020 to 2021 in response to the COVID-19 pandemic. This decrease is the net result of distinct changes within specific non-fire incident categories (see Table 1 for detail).
Although the total number of all types of incidents attended by FRSs has decreased over the last 10 years, the number of non-fire incidents attended has increased both in terms of the absolute number and as a proportion of all incidents attended. See Figure 1.1 and Figure 1.2 for further detail[footnote 2].
Figure 1.1: Incidents attended by fire and rescue services in England, by incident type, financial year 2010 to 2011 and financial year 2020 to 2021
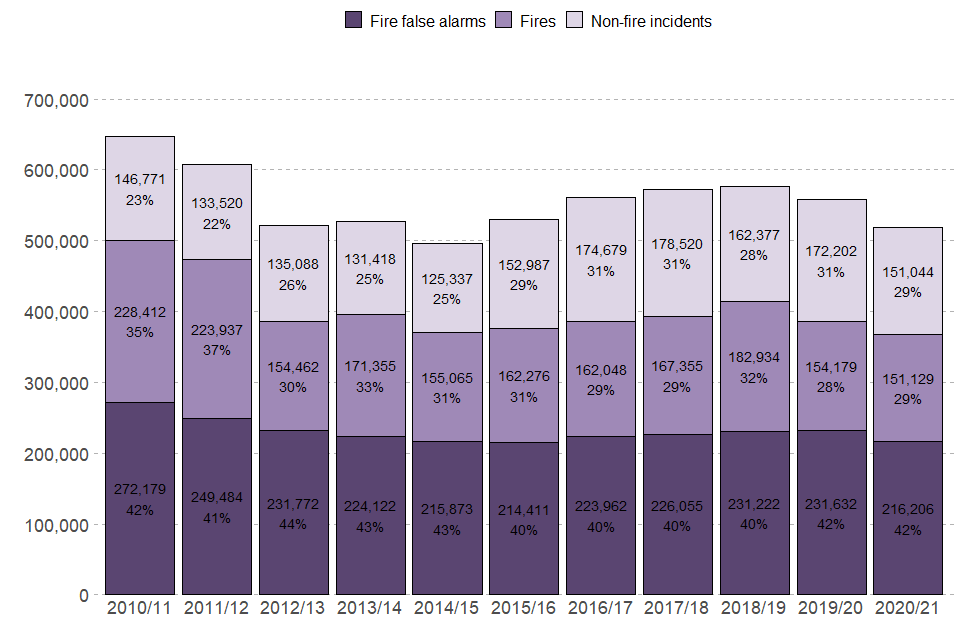
Figure 1.2: Incidents attended by fire and rescue services in England, by incident type, financial year 2020 to 2021
Source: FIRE0102
Notes: Non-fire incidents include non-fire false alarms.
2.3 Categories of non-fire incidents
For ease of presentation and analysis in this release and its related tables some non-fire incident types[footnote 3] are occasionally grouped together. The categories “Medical incident - First responder” and “Medical incident - Co-responder” are grouped together in the “Medical incidents” category. The categories “Assisting other agencies”, “Effecting entry/exit” and “Suicide/attempts” are grouped together in the “Collaborating incidents” category. While many of the smaller non-fire incident types which do not fit neatly within the other main categories are grouped together in the “Other” category.
As seen in Table 1.1, the decrease in the number of non-fire incidents in the financial year 2020 to 2021 compared with the previous year, is predominantly attributable to decreases in the following non-fire incident main categories: ‘Lift Release’, ‘Road Traffic Collision’ and ‘Medical incidents’. These three categories account for 71 per cent of the decrease in non-fire incidents in the financial year 2020 to 2021 compared with the previous year. The non-fire incident category which had the most notable increase was ‘Assist other agencies’ (an increase of 1,748 incidents, up 10%).
See Table 1.1 for all main categories and FIRE0901 for all specific non-fire incident types.
Table 1.1: Number of non-fire incidents and percentage change by non-fire incident main categories[footnote 4], England, financial year 2019 to 2020 and financial year 2020 to 2021
| Non-fire incident type | 2019/20 | 2020/21 | % change |
|---|---|---|---|
| Total | 172,202 | 151,044 | -12% |
| Effecting entry/exit | 26,363 | 24,242 | -8% |
| Road Traffic Collision | 31,104 | 22,524 | -28% |
| Assist other agencies | 18,275 | 20,023 | +10% |
| Flooding and rescue or evacuation from water | 17,542 | 16,392 | -7% |
| Medical incidents | 18,347 | 13,843 | -25% |
| Lift release | 11,710 | 7,931 | -32% |
| False alarms | 7,468 | 6,681 | -11% |
| Suicide (including attempts) | 2,041 | 2,095 | +3% |
| Other | 39,352 | 37,313 | -5% |
Source: FIRE0901 for all specific non-fire incident types.
Detailed data on non-fire incident types were first collected when FRSs began to submit records via the online IRS in the financial year 2009 to 2010. Table FIRE0902 provides more detail on the action taken under each of the 23 specific non-fire incident types.
Over the last ten years trends have varied across the non-fire incident main categories (see Figure 1.3). The ‘lift release’ and ‘false alarms’ categories have shown a steady negative trend. Meanwhile, the ‘Road Traffic Collisions’ category has been broadly stable, with a large decrease in the last year (further discussed in chapter 3) and the ‘collaborating incidents’ category has been on a steady rise (further discussed in chapter 5). The ‘flooding and rescue or evacuation from water’ category has fluctuated - the fluctuation in the number of incidents attended appears to be linked to rainfall[footnote 5]. The ‘medical incidents’ category had a sharp increase around the financial year 2016 to 2017 predominantly due to the introduction of the emergency medical responding trials, however in recent years the number of medical incidents attended has decreased and is now at a similar level to before the commencement of the trials (for more information see chapter 4).
Figure 1.3: Number of non-fire incidents by main categories, England, financial year 2009 to 2010 to financial year 2020 to 2021
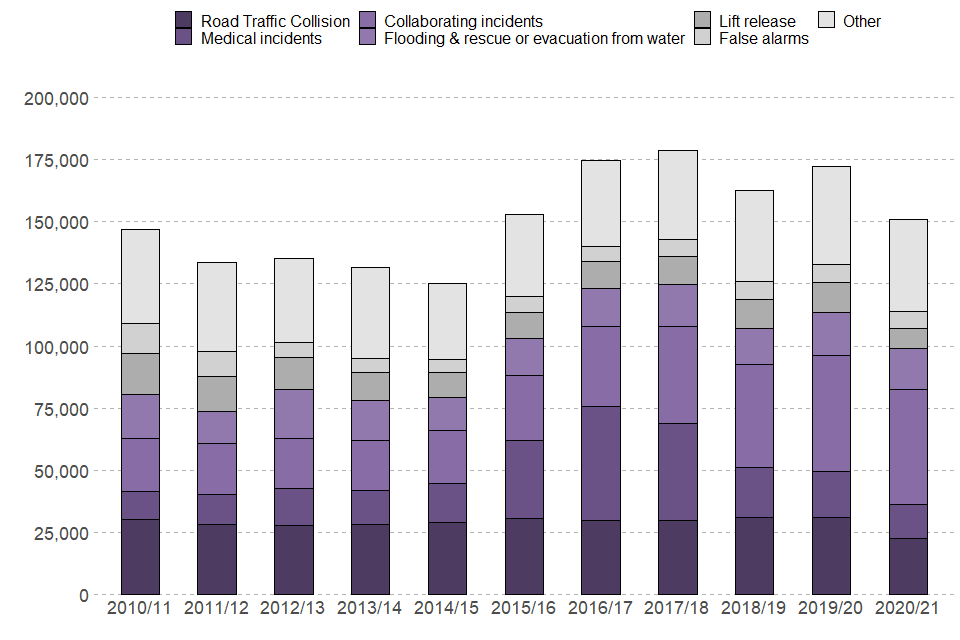
Source: FIRE0901
Note: Collaborating incidents include “Assisting other agencies”, “Effecting entry/exit” and “Suicide/attempts”.
3. Fatalities and non-fatal casualties in non-fire incidents
3.1 Key results
In the financial year 2020 to 2021, there were:
-
2,746 fatalities in non-fire incidents, this is an increase of five per cent compared with last year (2,620)
-
30,359 non-fatal casualties in non-fire incidents, this is a decrease of 20 per cent compared with last year (38,067)
3.2 Fatalities in non-fire incidents
Detailed comparable data on fatalities in non-fire incidents attended by fire and rescue services first became available for the financial year 2010 to 2011, and remained stable at around 1,600 fatalities in each year up to and including the financial year 2013 to 2014. There was then a period of sharp increases followed by a period of similarly sharp decreases to around 2,500 fatalities in the financial year 2018 to 2019. This rise and subsequent fall in the number of fatalities in non-fire incidents coincided with the introduction and subsequent termination of the emergency medical responding trials - a period in which FRSs attended a significantly higher number of medical incidents. In the financial year 2020 to 2021, there were 2,746 fatalities in non-fire incidents, an increase of five per cent compared with last year.
The number of fatalities in non-fire incidents is related to the number of non-fire incidents attended (i.e. in general the more non-fire incidents FRSs attend, the more fatalities in such incidents will be recorded). Another key factor is the type of incidents FRSs attend. Incident types such as ‘Suicide / attempts’ and ‘Assist other agencies’ typically have higher fatality rates than other types of non-fire incidents (see Table 2.1 for more detail).
The predominant driver of the overall increase in total fatalities in the financial year 2020 to 2021 compared with the previous year, was an increase in the number of fatalities in collaborating incidents[footnote 6] (an increase of 237 fatalities compared with the previous year, up 18%). To note, the number of collaborating incidents in the financial year 2019 to 2020 and the financial year 2020 to 2021 was about the same (46,679 and 46,360 respectively).
Table 2.1: Number of fatalities in non-fire incidents, percentage change and fatality rate per 1,000 incidents, England, comparing the financial year 2020 to 2021 with one and ten years previously
| Non-fire incident type | 2010/11 | 2019/20 | 2020/21 | % change vs 2019/20 | Fatality rate per 1,000 incidents |
|---|---|---|---|---|---|
| Total | 1571 | 2620 | 2746 | +5% | 19 |
| Suicide (including attempts) | 162 | 254 | 267 | +5% | 127 |
| Assist other agencies | 184 | 633 | 696 | +10% | 35 |
| Road Traffic Collision | 699 | 627 | 483 | -23% | 21 |
| Effecting entry / exit | 51 | 459 | 620 | +35% | 26 |
| Medical incidents | 189 | 291 | 294 | +1% | 21 |
| Flooding and rescue or evacuation from water | 78 | 111 | 101 | -9% | 6 |
| Other | 206 | 245 | 283 | +16% | N/A |
Source: FIRE0904a and FIRE0904b
Note: Rates for “other” are not meaningful because of the wide variety of incident types included within it.
The non-fire incident type main category with the highest rate of fatalities in the financial year 2020 to 2021 was suicide (including attempts) with a rate of 127 per 1,000 incidents[footnote 7]. The rate of fatalities in suicides (including attempts) has, however, reduced in the last four years from a peak of 194 per 1,000 incidents in the financial year 2015 to 2016. The nature of this incident type means it is likely to entail a high fatality rate.
As in the financial year 2019 to 2020, the non-fire incident type with the lowest rate of fatalities in the financial year 2020 to 2021 was flooding and rescue or evacuation from water, with a rate of six per 1,000 incidents. Meanwhile, in the financial year 2020 to 2021, effecting entry/exit and medical incidents had rates of 26 and 21 per 1,000 incidents respectively. These were increases compared to the respective rates in the financial year 2019 to 2020 (rates of 17 and 16 per 1,000 incidents). The rate of fatalities for RTCs remained broadly similar in the financial year 2020 to 2021 compared with the previous year.
There was a spike in the rate of fatalities in medical incidents around the financial year 2016 to 2017 (see Figure 2.1). This coincided with the beginning and end of the emergency medical responding trials that likely entailed FRSs attending a greater number of emergency medical incidents in which fatalities were more likely than typical medical incidents attended.
See Figure 2.1 and Table FIRE0904 for further detail.
Figure 2.1: Rate of fatalities by non-fire incident type (main categories) per 1,000 incidents, England, financial year 2010 to 2011 to financial year 2020 to 2021
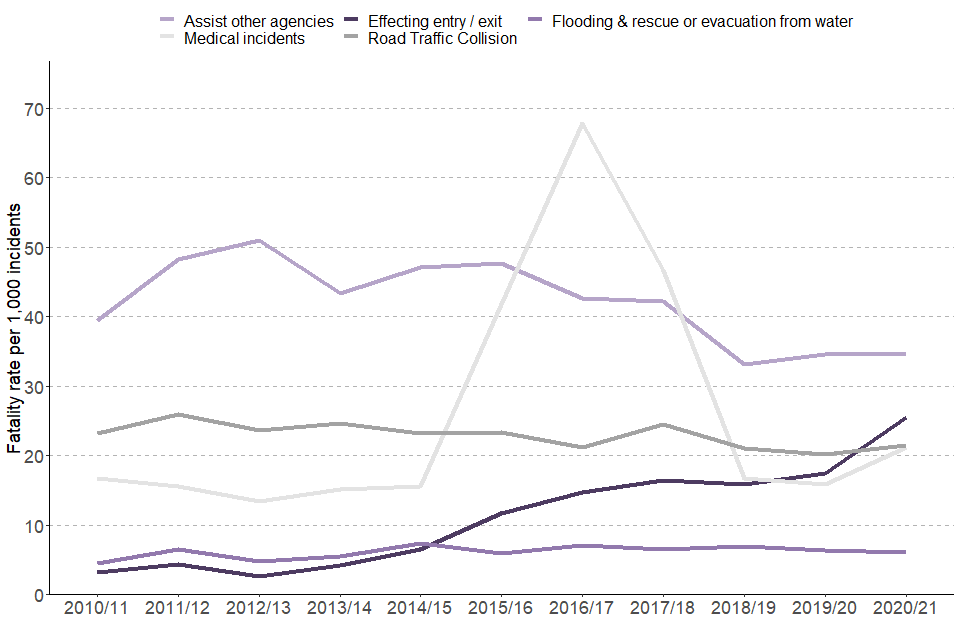
Source: FIRE0904b
Note: the “Suicide (including attempts)” incident type is excluded from Figure 2.1 due to a significantly higher fatality rate compared with the other incident types.
3.3 Non-fatal casualties in non-fire incidents
Non-fatal casualties are split into four subcategories:
Hospital severe - at least an overnight stay in hospital as an in-patient
Hospital slight - attending hospital as an outpatient (not a precautionary check)
First Aid given - first aid given at scene (by anyone), including after a precautionary check
Precautionary check - a precautionary check (to attend hospital or to see a doctor) was recommended (by anyone)
As with fatalities, the number of non-fatal casualties in non-fire incidents is related to the number of non-fire incidents attended (i.e. in general the more non-fire incidents FRSs attend, the more non-fatal casualties in such incidents are recorded) and the type of incidents FRSs attend impacts the number of non-fatal casualties.
The number of non-fatal casualties in non-fire incidents remained relatively stable until the financial year 2014 to 2015 - a similar trajectory to fatalities. There were then two year-on-year increases in the financial year 2015 to 2016 and in the financial year 2016 to 2017 followed by decreases in each of the last four years (coinciding with the beginning and end of the emergency medical responding trials). These changes are attributable to the reduction in the number of medical incidents attended by FRSs and, in particular, medical co-responding.
In the financial year 2020 to 2021 there were 30,359 non-fatal casualties in non-fire incidents, a decrease of 20 per cent from last year. The top three categories were: road traffic collisions (44% of non-fatal casualties), medical incidents (17%) and assist other agencies (16%). It should be noted that restrictions on life throughout the financial year 2020 to 2021 in response to the COVID-19 pandemic was an element in this relatively low figure. See Table FIRE0904d for more information.
Of the 30,359 non-fatal casualties in non-fire incidents, 11,911 (39%) were recorded as ‘hospital slight’ in terms of injury severity and 7,135 (24%) were recorded as ‘hospital severe’. The other injury severity categories were recorded as: ‘first aid’ (3,605, 12%) and ‘precautionary checks’ (4,293, 14%).
The proportion of non-fatal casualties in each injury severity category had the following changes compared to the previous year: hospital severe (up 3%), hospital slight (down 4%), first aid (no change) and precautionary checks (up 2%)[footnote 8]. Additionally, there was a decrease in the number casualties in every injury severity category compared with last year.
Figure 2.2: Number of non-fatal casualties in non-fire incidents, by injury severity, England, financial year 2010 to 2011 to financial year 2020 to 2021
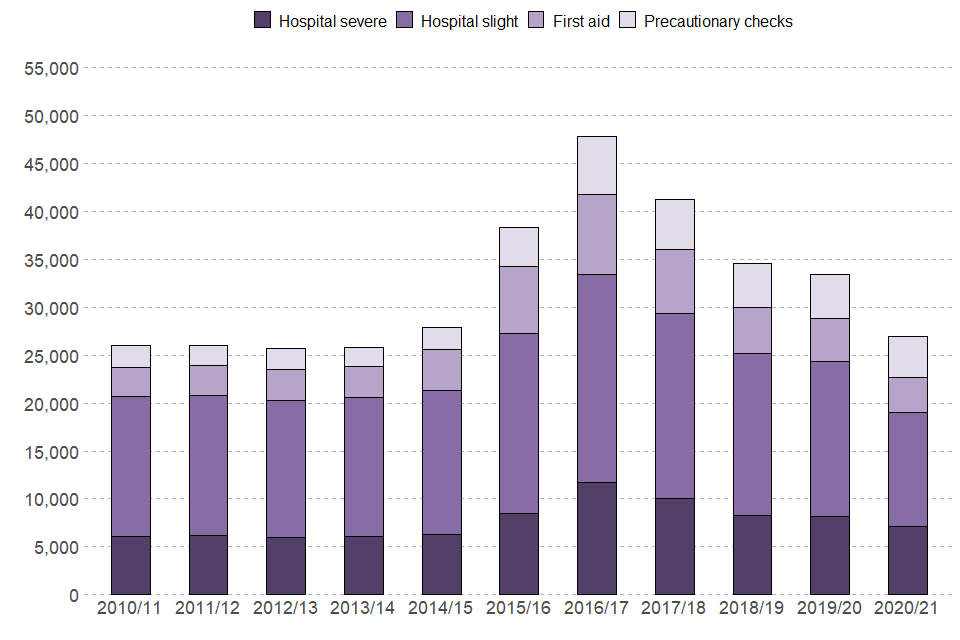
Source: FIRE0904d
Note: Excludes injury severities recorded as unknown.
4. Road traffic collisions
Road Traffic Collisions (RTCs) - incidents not involving a fire which require the attendance of the FRS for collisions involving one or multiple road vehicles (i.e. large and small vehicles, including motorbikes). These include incidents where FRSs attend the incident for safety reasons, where people are extricated or released from their vehicle and other reasons. RTCs that involve a fire are recorded as road vehicle fires and are therefore not included in this release, see table FIRE0302 for latest data.
4.1 Key results
In the financial year 2020 to 2021:
-
FRSs attended 22,524 Road Traffic Collisions in England, this is a decrease of 28 per cent from last year
-
FRS attendance at RTCs was most common during the ‘late afternoon and evening’ hours (14:00-22:00) peaking between 17:00 and 18:00
4.2 RTCs incidents overview
In the financial year 2020 to 2021, there were 22,524 RTCs attended by FRSs in England representing a decrease of 28 per cent from 31,104 the previous year. There was a general downward trend in the number of RTCs attended between the financial year 2009 to 2010 (when data were first collected) and the financial year 2012 to 2013. Since then, the number of RTCs attended has fluctuated with the exception of the current financial year where RTCs figures dropped greatly. However, it should be noted that restrictions on life throughout the financial year 2020 to 2021 in response to the COVID-19 pandemic was an element in this relatively low figure (see the “RTCs attended under COVID-19 national lockdowns” section for additional information). Around two per cent of RTC incidents attended by FRSs involved a fatality, and this has remained stable over the series.
The top three types of action carried out at an RTC in the financial year ending 2020 were making the vehicle safe (33%, 7,367), making the scene safe (31%, 6,922) and extrication of person(s) (13%, 3,031). This is consistent with previous years.
4.3 RTCs and time of day
In the financial year 2020 to 2021, FRS attendance at RTCs was most common during the ‘late afternoon and evening’ hours (14:00-22:00) peaking between 17:00 and 18:00. When looking at the ‘late morning and early afternoon’ hours (06:00-14:00), incidents peaked between 08:00 and 09:00. These peaks coincide with the morning and evening rush hour when there are typically more vehicles on the road.
There is a similar pattern for fatalities in RTCs: these are most common during the ‘late afternoon and evening’ hours but peak earlier between 14:00 and 16:00. However, RTCs which occur at ‘night and early morning’ hours (22:00-06:00) have a greater chance of involving a fatality than at other times of the day (see Table 3.1 below).
Table 3.1: Number and proportion of RTC incidents and fatalities by time of day, England, financial year 2020 to 2021
| Time of day | Number of RTCs | Fatalities in RTCs | % of RTCs with a fatality |
|---|---|---|---|
| Total | 100.0% (22,524) | 100.0% (483) | 2.1% |
| Late morning and early afternoon (06:00-14:00) | 34.2% (7,696) | 35.4% (171) | 2.2% |
| Late afternoon and evening (14:00-22:00) | 47.8% (10,776) | 43.7% (211) | 2.0% |
| Night and early morning (22:00-06:00) | 18.0% (4,052) | 20.9% (101) | 2.5% |
Source: FIRE0901 and FIRE0906
The higher proportion of fatalities in RTCs attended by FRSs during the ‘night and early morning’ hours (22:00-06:00) compared with all RTCs can be seen in more detail in Figure 3.1. In general, this is reversed during the day time hours of late morning until evening (08:00-20:00).
Figure 3.1: Percentage of RTCs and fatalities in RTCs by hour of the day, England; combined data for financial year 2010 to 2011 to financial year 2020 to 2021
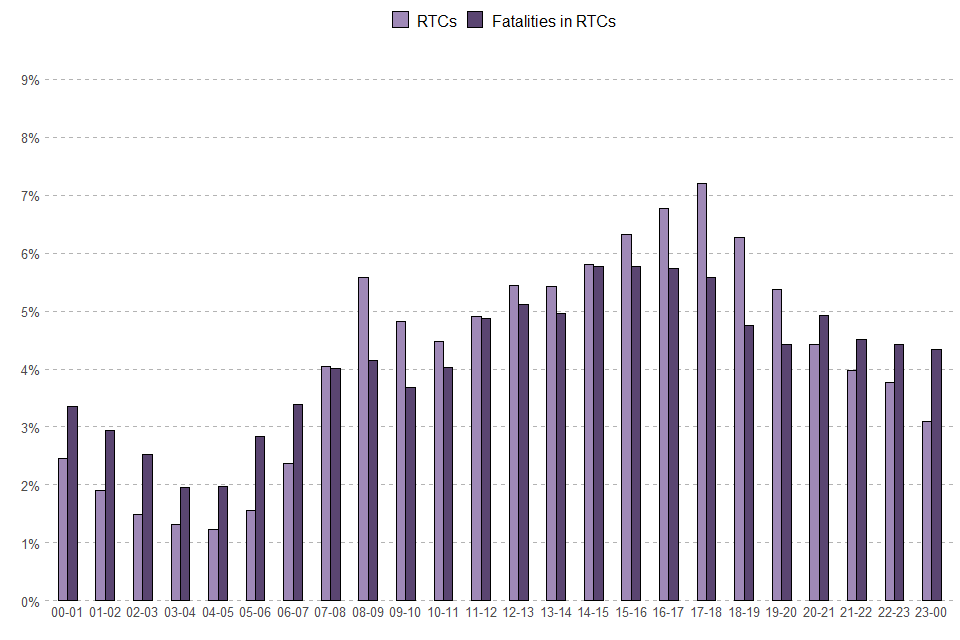
Source: FIRE0906
Notes: Data are only combined from the financial year 2010 to 2011 onwards as detailed data collected before this date are less robust.
Data are combined as fatalities by hour figures are prone to fluctuation.
4.4 Rate of RTCs per 100,000 people
In the financial year 2020 to 2021, there were 40 RTCs attended by FRSs per 100,000 people in England. This compared with 55 in the previous year and 64 in financial year 2009 to 2010 (when the online IRS was introduce and these data were first collected).
At an FRS level, West Midlands attended the most RTCs per 100,000 people with 72, followed by Hereford and Worcester (64) and Lincolnshire (56). The FRS with the fewest RTCs per 100,000 people (excluding the Isles of Scilly as they had none the financial year 2020 to 2021) was West Yorkshire with 19. See table FIRE0903 for more information.
4.5 Extrication of people from RTCs
Extrication is the removal or setting free of something with difficulty, where equipment or expertise are necessary to remove someone from a situation i.e. trapped in a vehicle RTC. It includes extrication of fatal victims from an RTC incident.
Of the 22,524 RTCs attended by FRSs in the financial year 2020 to 2021, 13 per cent (3,031) involved the extrication of at least one person. This compared with 15 per cent (4,554) the previous year and 25 per cent (8,439) in the financial year 2009 to 2010 (when data was first collected). See table FIRE0902 for more information.
The number of extrications from RTCs has been on a downward trend, falling year-on-year since the financial year 2009 to 2010.
The most common method of extrication was ‘Other space creation’ with 1,718 incidents, followed by ‘Roof removal’ with 872 incidents. See table FIRE0907 for more information.
4.6 RTCs attended under COVID-19 national lockdowns
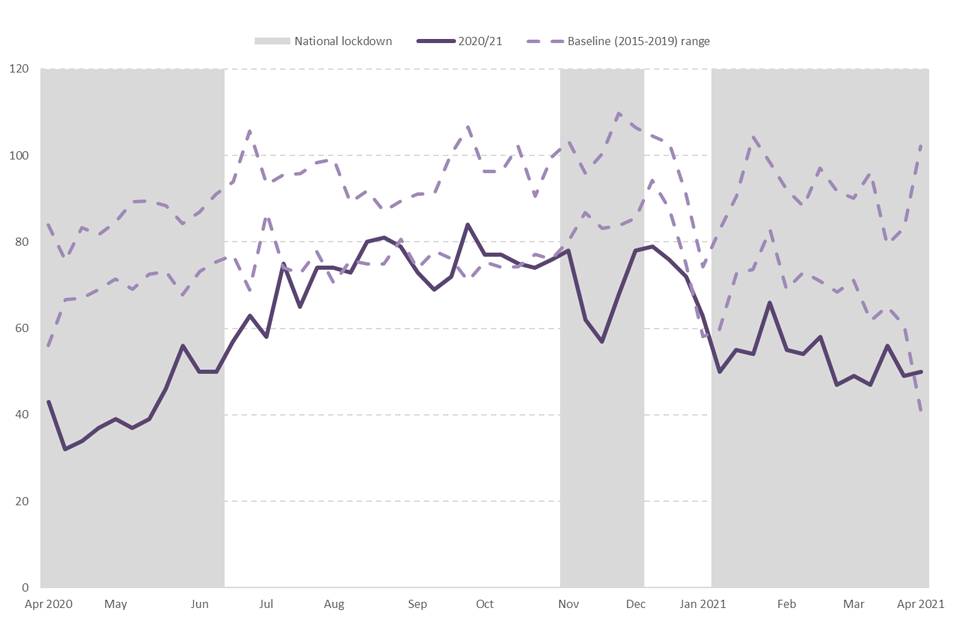
This section shows the average RTCs numbers per day attended by FRSs by week in the financial year 2020 to 2021 compared against a baseline of the previous five years (financial year 2015 to 2016 to financial year 2019 to 2020). This analysis attempts to show if the three national lockdowns, various local lockdowns and restrictions on life throughout the financial year 2020 to 2021 in response to the COVID-19 pandemic affected the number of these incidents attended by FRSs. For more information on the methodology used in this chapter and previously conducted analysis of the impact of the COVID-19 national lockdowns see the “COVID-19 and the impact on the IRS” section.
The number of RTCs attended by FRSs in the financial year 2020 to 2021 was often out of the ordinary, reflecting the fact that there were generally fewer vehicle journeys over this period[footnote 9]. Forty-three out of the 53 weeks captured by this analysis fell below the range of what would be expected (i.e. below the 2 dotted lines in Figure 3.2). Even greater proportions of weeks were below the range during national lockdowns (28 out of 29 weeks shaded grey) and during the first national lockdown (all 11 weeks in the first grey shaded area) when the restrictions were tighter.
Figure 3.2: Average number of road traffic collisions per day, in the financial year 2020 to 2021 by week
5. Medical incidents
Medical co-responding incidents are defined in the IRS as “The mobilisation of trained fire crews to provide emergency medical assistance to members of the public”. Medical co-responding is where an agreement is in place with ambulance trusts. This differs to medical first responder incidents where no such agreement is in place.
Figures for medical incidents have decreased since they peaked in the financial year 2016 to 2017. This makes the type of analysis outlined in the “RTCs attended under COVID-19 national lockdowns” section misleading for this incident type as the expected range produced is comparatively large. For this reason analysis of collaborating incidents attended under COVID-19 national lockdowns has not been conducted.
5.1 Key results
In the financial year 2020 to 2021:
-
FRSs attended 13,843 medical incidents, a decrease of 25 per cent compared with the previous year (18,347) and a decrease of 56 per cent compared with the financial year 2015 to 2016 (31,347)
-
32 FRSs showed a decrease in the number of medical incidents attended, compared with the financial year 2019 to 2020
5.2 Trends in all medical incidents
While the total number of non-fire incidents attended by fire and rescue services (FRSs) has been collected since the financial year 1999 to 2000, it was only when the online IRS was introduced in the financial year 2009 to 2010 that information on the type of incident was collected. Between the financial year 2009 to 2010 and the financial year 2010 to 2011, no distinction was made between first responder and co-responder medical incidents, but from the financial year 2011 to 2012, these were recorded separately. As services were transitioning to recording co-responder incidents separately in the financial year 2011 to 2012, it is recommended that comparisons between financial years are only undertaken from the financial year 2012 to 2013 onwards.
Between 2015 and 2017 the National Joint Council (NJC) supported trials of emergency medical responding (EMR) where many FRSs formed agreements with ambulance trusts to undertake health and care related work, in particular co-responding. Co-responding involves both fire and ambulance services deploying to time critical incidents such as cardiac arrests.
The large increase in non-fire incidents attended by FRSs in the financial year 2015 to 2016 and the financial year 2016 to 2017 can be attributed to a large rise in the number of medical incidents attended and, in particular, medical co-responding. These medical incidents accounted for over half (61%)[footnote 10] of the large increase in non-fire incidents between the financial year 2014 to 2015 to the financial year 2016 to 2017. The proportion of non-fire incidents that were medical incidents steadily rose from seven per cent in the financial year 2009 to 2010 to a peak of 26 per cent in the financial year 2016 to 2017. Since then, this proportion has fallen to 9 per cent in the financial year 2020 to 2021. See table FIRE0901 for more information.
The recent downward trend follows the removal of Fire Brigades Union (FBU) support for emergency medical responding (EMR) trials on 18 September 2017 and since then the number of medical incidents has decreased to a level comparable to before the trials.
Figure 4.1: Number of medical incidents, England, financial year 2010 to 2011 to financial year 2020 to 2021
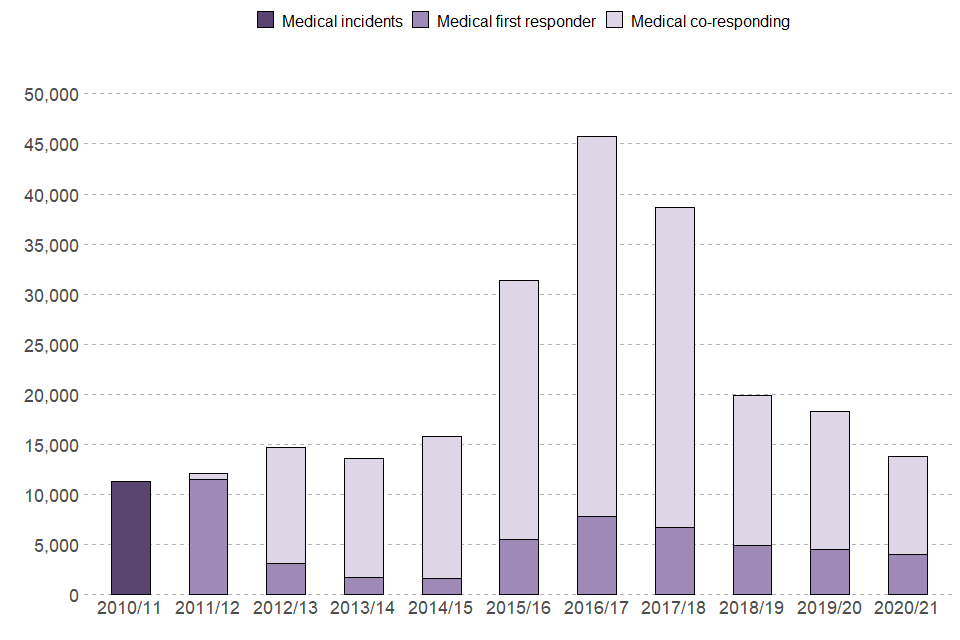
Source: FIRE0901
Notes: In the financial year 2010 to 2011, no distinction was made between first responder and co-responder medical incidents, but from the financial year 2011 to 2012, these were recorded separately. As services were still becoming accustomed to recording co-responder incidents separately in the financial year 2011 to 2012 it is recommended that comparisons are only undertaken from the financial year 2012 to 2013.
5.3 Medical co-responding incidents[footnote 11]
There were around 12,000 medical co-responding incidents in the financial year 2012 to 2013 (when FRSs began separately recording the two categories of medical incidents consistently), and this increased to around 14,000 in the financial year 2014 to 2015. The next two years showed large year-on-year increases, however since the financial year 2017 to 2018, medical co-responding incidents have been steadily decreasing. In the financial year 2020 to 2021 there were 9,848 medical co-responding incidents. (Source: FIRE0901)
FRSs attend different types of co-responding incident, ranging from those where no action is required to people having difficulty breathing, collapsing or experiencing a cardiac arrest.
When looking at the specific sub-categories from the IRS, in the financial year 2020 to 2021, “Chest Pain/Cardiac Arrest/Heart condition” accounted for the highest proportion of co-responding incidents (28%), followed by “Breathing difficulties/Impairment/Respiratory arrest” (22%) and “Other” (15%). (Source: FIRE0902)
5.4 Fatalities in medical co-responding incidents[footnote 12]
There were 141 fatalities in co-responding incidents in the financial year 2012 to 2013. This increased by over 17 times to 2,420 in the financial year 2016 to 2017 but fell by 50 per cent to 1,202 in the financial year 2017 to 2018. The rises and fall are likely to be due to the EMR trials beginning in 2015 and ending 2017, as mentioned above. In the financial year 2020 to 2021 there were 202 fatalities in co-responding incidents. (Source: FIRE0904c)
When looking at the circumstances of the fatalities for co-responding incidents, “Unable to resuscitate, confirmed dead at scene” accounted for the highest proportion of the increase (47%) in fatalities from the financial year 2014 to 2015 to the financial year 2016 to 2017, followed by “Thought to be already dead when firefighter arrived” (40%). However, similarly to the number of co-responding incidents, the numbers have now returned to a similar level as before the trials.
In the financial year 2020 to 2021 “Unable to resuscitate, confirmed dead at scene” accounted for 68 per cent of all fatalities for co-responding incidents (compared to 67 per cent in the financial year 2014 to 2015) and “Thought to be already dead when firefighter arrived” accounted for 24 per cent (compared to 26 per cent in the financial year 2014 to 2015). (Source: FIRE0904c)
5.5 Medical incidents per 100,000 people
Medical incidents attended by FRSs per 100,000 people were on a slow upward trend from when the data were first collected in the financial year 2009 to 2010 until the financial year 2014 to 2015. The next two years showed large increases, however, since the financial year 2017 to 2018, medical incidents per 100,000 people have been steadily decreasing. This pattern can be attributed to the medical co-responding pilot trials beginning and ending. In the financial year 2020 to 2021, FRSs attended 24 medical incidents per 100,000 people in England. This compared with a rate of 33 in the previous year but a rate of only 20 in the financial year 2009 to 2010. (Source: FIRE0903)
At an FRS level[footnote 13], the FRS that attended the most medical incidents per 100,000 people in the financial year 2020 to 2021, with a rate of 359, was Lincolnshire, followed by Isle of Wight with a rate of 356 and Humberside with a rate of 227. The FRS that attended the fewest medical incidents per 100,000 people (excluding Isles of Scilly as they had none in the financial year 2020 to 2021) was Hertfordshire, with a rate of one, followed by Cheshire, Essex and Northumberland all with a rate of two. (Source: FIRE0903)
6. Collaborating incidents
Collaborating incidents are those that could involve collaboration with other emergency services, not including medical incidents. The following non-fire incident types are classed as incidents that could involve collaborating: “Effecting entry/exit”, “Assist other agencies” and “Suicide/attempts”.
Figures for collaborating incidents increased every year between the financial year 2015 to 2016 and the financial year 2019 to 2020. As with medical incidents, this makes the type of analysis outlined in the “RTCs attended under COVID-19 national lockdowns” section misleading for this incident type as the expected range produced is comparatively large. For this reason analysis of collaborating incidents attended under COVID-19 national lockdowns has not been conducted.
6.1 Key results
In the financial year 2020 to 2021:
-
FRSs attended 24,242 “Effecting entry/exit” incidents: this compares with 26,363 in the previous year (a decrease of 8%) and 17,571 in the financial year 2015 to 2016 (an increase of 38%)
-
FRSs attended 20,023 “Assist other agencies” incidents: this compares with 18,275 in the previous year (an increase of 10%) and 7,122 in the financial year 2015 to 2016 (an increase of nearly three times)
-
FRSs attended 2,095 “Suicide/attempts” incidents: this compares with 2,041 in the previous year (an increase of 3%) and 1,301 in the financial year 2015 to 2016 (an increase of 61%)
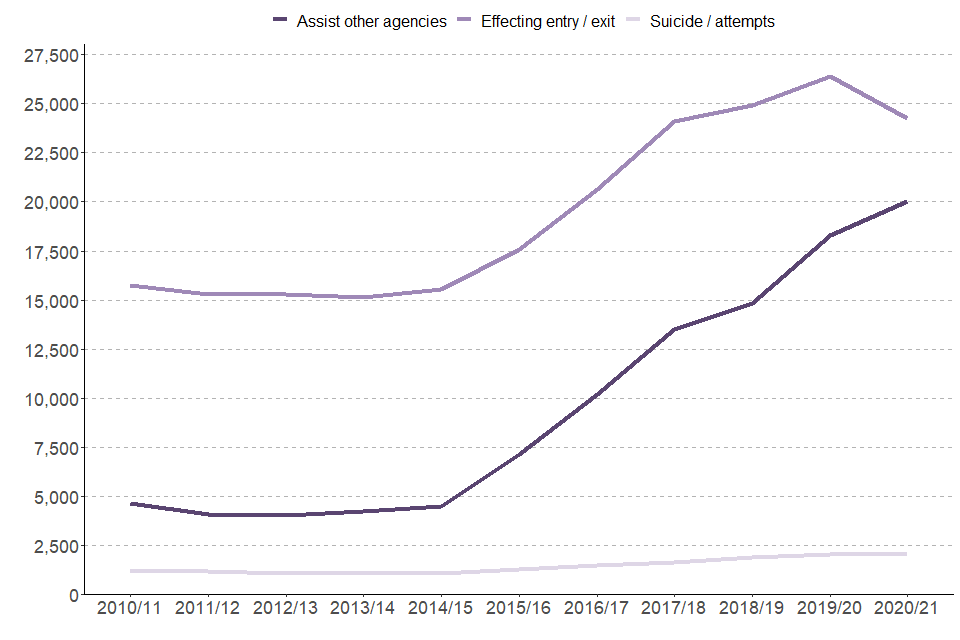
6.2 Trends in collaborating incidents
From the financial year 2009 to 2010 to the financial year 2014 to 2015 the three collaborating incident types showed little change. However, since then there has been a steady increase in each incident type - with the exception of “Effecting entry/exit” which had a decrease in the latest financial year (as seen in Figure 5.1). The increases coincide with the duty to collaborate legislation which announced a statutory duty to collaborate imposed on all three emergency services. This legislation was given Royal Assent in January 2017 with a public consultation prior to this. The increase also coincides with the emergency medical responding trials (EMR), which ran from 2015 to 2017 (see Chapter 4).
Figure 5.1: Number of collaborating incidents, England, financial year 2010 to 2011 to financial year 2020 to 2021
Source: FIRE0901
6.3 Collaborating incidents per 100,000 people
The number of collaborating incidents attended per 100,000 people for each of the three collaborating incident types follow a similar pattern of being relatively stable for the financial year 2009 to 2010 to the financial year 2014 to 2015, with a trend of increases since then. (Source: FIRE0903)
In the financial year 2020 to 2021, FRSs attended 43 “Effecting entry/exit” incidents per 100,000 people in England. This compared with a rate of 47 the previous year and a rate of 32 in the financial year 2015 to 2016. The FRS that attended the most “Effecting entry/exit” incidents per 100,000 people in the financial year 2020 to 2021 was Humberside with a rate of 80, while Cambridgeshire attended the least (excluding Isles of Scilly as they had none) with a rate of 10.
In the financial year 2020 to 2021, FRSs attended 35 “Assist other agencies” incidents per 100,000 people in England. This compared with a rate of 32 the previous year and a rate of 13 in in the financial year 2015 to 2016. The FRS that attended the most “Assist other agencies” incidents per 100,000 people was Isle of Wight with a rate of 131 with Tyne and Wear attending the least with a rate of seven.
In the financial year 2020 to 2021, FRSs attended four “Suicide/attempts” incidents per 100,000 people in England. This compared with a rate of four the previous year and a rate of two in the financial year 2015 to 2016. The FRS that attended the most “Suicide/attempts” incidents per 100,000 people was Tyne and Wear with a rate of 14 with Hertfordshire and Isle of Wight both attending the least (excluding Isles of Scilly as they had none) with a rate of one.
7. Lift release
Release - To give freedom or free movement to someone or something where minimal equipment is used i.e. winding a lift car up or down and opening the door in a lift release.
7.1 Key results
In the financial year 2020 to 2021:
- FRSs attended 7,931 “Lift release” incidents; this compares with 11,710 in the previous year (a decrease of 32%) and 10,415 in the financial year 2015 to 2016 (a decrease of 24%)
7.2 Types of lift release incident
FRSs attend different types of lift release incident, ranging from those where no persons were involved to those where a medical case or a person in distress was involved.
When looking at the specific sub-categories from the IRS, in the financial year 2020 to 2021, “For able bodied person not in distress” accounted for the highest proportion of lift release incident (72%), followed by “For person in distress” (16%) and “No persons involved” (6%). These percentages are similar to the one in the previous financial year. (Source: FIRE0902)
7.3 Lift release incidents per 100,000 people
The rate of lift release incidents attended per 100,000 people was on a downwards trend from the financial year 2009 to 2010 to the financial year 2014 to 2015. The rate has since fluctuated between 19 and 21 lift release incidents attended per 100,000 people - with the exception of the latest financial year which had the lowest financial year rate of lift release incidents attended per 100,000 people recorded. (Source: FIRE0903)
In the financial year 2020 to 2021, FRSs attended 14 “lift release” incidents per 100,000 people in England. This compared with a rate of 21 the previous year and a rate of 19 in the financial year 2015 to 2016. The FRS that attended the most “lift release” incidents per 100,000 people in the financial year 2020 to 2021 was Greater London with a rate of 46, while Cambridgeshire, Derbyshire, Durham, Northumberland, South Yorkshire and Suffolk all attended the least (excluding Isles of Scilly as they had none) with a rate of 2.
7.4 Lift release incidents attended under COVID-19 national lockdowns
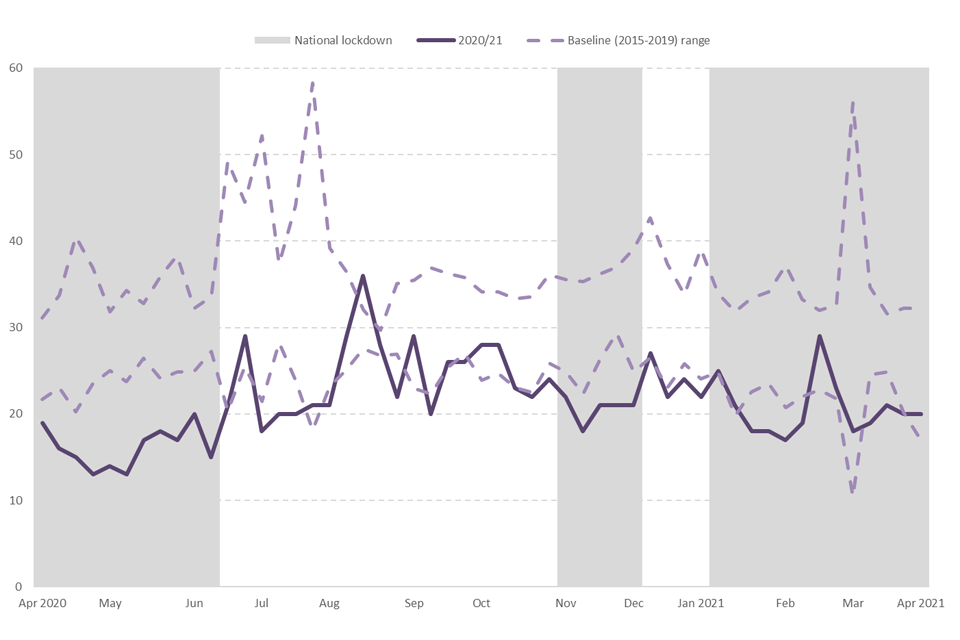
This section shows the average lift release number of incidents per day attended by FRSs by week in the financial year 2020 to 2021 compared against a baseline of the previous five years (financial year 2015 to 2016 to financial year 2019 to 2020). This analysis attempts to show if the three national lockdowns, various local lockdowns and restrictions on life throughout the financial year 2020 to 2021 in response to the COVID-19 pandemic affected the number of these incidents attended by FRSs. For more information on the methodology used in this chapter see the “COVID-19 and the impact on the IRS” section.
The number of lift release incidents attended by FRSs in the financial year 2020 to 2021 was often out of the ordinary. Thirty-six out of the 53 weeks captured by this analysis fell below the range of what would be expected (i.e. below the 2 dotted lines in Figure 6.1), while one week was above the range. Even greater proportions of weeks were below the range during national lockdowns (23 out of 29 weeks shaded grey) and during the first national lockdown (all 11 weeks in the first grey shaded area) when the restrictions were tighter. This supports the suggestion that the restrictions on life throughout the financial year 2020 to 2021 caused fewer lift release incidents. This could be because people were at home more and many workplaces were closed or used less than usual.
Figure 6.1: Average number of lift release incidents per day, in the financial year 2020 to 2021 by week
8. Further information
This release contains statistics about incidents attended by fire and rescue services (FRSs) in England. The statistics are sourced from the Home Office’s online Incident Recording System (IRS). This system allows FRSs to complete an incident form for every incident attended, be it a fire, a false alarm or a non-fire incident (also known as a Special Service incident). The online IRS was introduced in April 2009. Previously, paper forms were submitted by FRSs and an element of sampling was involved in the data compilation process.
Fire and Rescue Incident Statistics and other Home Office statistical releases are available via the Statistics at Home Office pages on the GOV.UK website.
Data tables linked to this release and all other fire statistics releases can be found on the Home Office’s Fire statistics data tables page.
Guidance for using these statistics and other fire statistics outputs, including a Quality Report, is available on the fire statistics guidance page.
The information published in this release is kept under review, taking into account the needs of users and burdens on suppliers and producers, in line with the Code of Practice for Statistics. The Office for Statistics Regulation recently carried out a compliance check of the Home Office’s fire and rescue incident statistics against the Code of Practice and the results can be found in a letter to the Home Office’s Head of Profession published on the OSR website.
If you have any comments, suggestions or enquiries, please contact the team via email using firestatistics@homeoffice.gov.uk.
8.1 Revisions
The IRS is a continually updated database, with FRSs adding incidents daily. The figures in this release refer to records of incidents that occurred up to and including 31 March 2021. This includes incident records that were submitted to the IRS by 27 September 2021, when a snapshot of the database was taken for the purpose of analysis. As a snapshot of the dataset was taken on 27 September 2021, the statistics published may not match those held locally by FRSs and revisions may occur in the future. This is particularly the case for statistics with relatively small numbers, such as fire-related fatalities. For instance, this can occur because coroner’s reports may mean the initial view taken by the FRS will need to be revised; this can take many months, even years, to do so.
8.2 COVID-19 and the impact on the IRS
The figures presented in this release relate to non-fire incidents attended by FRSs during the financial year 2020 to 2021. In response to the coronavirus pandemic, restrictions in England, Scotland and Wales started from 12 March 2020. In England, during the financial year 2020 to 2021, three lockdowns which applied strict limits on daily life were imposed. A first lockdown was applied on 23 March 2020 (i.e. slightly before the start of the financial year 2020 to 2021) and was eased from 10 May 2020. A second lockdown began on 5 November 2020 and ended on 2 December 2020 and the third began on 4 January 2021 and ended on 12 April 2021 (i.e. after the end of financial year 2020 to 2021). The restrictions and lockdowns are therefore captured in IRS data for the financial year 2020 to 2021.
Extra analysis of non-fire incidents throughout the various periods of lockdown can be found in this release - to note, this release does not contain analysis on medical and collaborating non-fire incidents as these types of incidents have been very variable over the previous five years causing large ranges, making it impossible to draw reliable conclusions. This analysis shows the average non-fire incident numbers per day for various fire types by week attended by FRSs under the lockdown compared against a baseline of the previous five years (financial year 2015 to 2016 to financial year 2019 to 2020). The charts are presented as “average number of … per day” for each week in the financial year because 365 and 366 do not divide into 52 perfect weeks and hence the 1st and 53rd “weeks” can be shorter than 7 days. To ensure the analysis is fair, weeks are divided by the appropriate number of days (usually but not always 7). Weekly figures are highly susceptible to fluctuation and so an upper and lower range, using the mean and standard deviation of the financial year 2015 to 2016 to financial year 2019 to 2020 baseline figures, was calculated. Any figures beyond this range would fall outside of what would be expected, although these results could be explained by various factors such as the weather, school or bank holiday dates and not simply the COVID related lockdowns and restrictions. Whilst it is difficult to define exactly what constituted a “national lockdown” and when they started and finished, in this analysis we have used the dates when the majority of “non-essential retail” was closed. This complements the analysis published in Fire and rescue incident statistics, England, year ending March 2021 and Detailed analysis of fires attended by fire and rescue services, England, April 2020 to March 2021. We plan to publish more detailed analysis on the effects of COVID-19 lockdowns in Detailed Analysis of Response Times.
8.3 Other related publications
Home Office publish five other statistical releases covering fire and rescue services.
These include:
-
Fire and rescue incident statistics, England: provides statistics on trends in fires, casualties, false alarms and non-fire incidents attended by fire and rescue services in England, updated quarterly
-
Detailed analysis of fires attended by fire and rescue services in England: focuses on fires attended by fire and rescue services across England, fire-related fatalities and non-fatal casualties in those fires; including analyses of the causes of fires and smoke alarms ownership and operation
-
Fire and rescue workforce and pensions statistics: focuses on total workforce numbers, workforce diversity and information regarding leavers and joiners; covers both pension fund income and expenditure and firefighters’ pension schemes membership; and includes information on incidents involving attacks on firefighters
-
Fire prevention and protection statistics, England: focuses on trends in smoke alarm ownership, fire prevention and protection activities by fire and rescue services
-
Response times to fires attended by fire and rescue services, England: covers statistics on trends in average response times to fires attended by fire and rescue services
The Department for Levelling Up, Housing and Communities also publish statistical releases on fire
These include:
-
the English Housing Survey: fire and fire safety report focuses on the extent to which the existence of fire and fire safety features vary by household and dwelling type
-
the English Housing Survey: feeling safe from fire report focuses on whether people felt safe from fire in their homes by household and dwelling type
Fire statistics are published by the other UK nations.
Scottish fire statistics and Welsh fire statistics are published based on the IRS. Fire statistics for Northern Ireland are published by the Northern Ireland Fire and Rescue Service using data from a system similar to the Incident Recording System, which means that they are not directly comparable to English, Welsh and Scottish data.
8.4 National Statistics
These statistics have been assessed by the UK Statistics Authority to ensure that they continue to meet the standards required to be designated as National Statistics. This statistical bulletin is produced to the highest professional standards and is free from political interference. It has been produced by statisticians working in accordance with the Home Office’s Statement of compliance with the Code of Practice for Official Statistics, which covers Home Office policy on revisions and other matters. The Chief Statistician, as Head of Profession, reports to the National Statistician with respect to all professional statistical matters and oversees all Home Office National Statistics products with respect to the Code, being responsible for their timing, content and methodology. This means that these statistics meet the highest standards of trustworthiness, impartiality, quality and public value, and are fully compliant with the Code of Practice for Statistics.
-
Data on specific non-fire incident types available from the financial year 2009 to 2010 onward. See table FIRE0901 for the full list of non-fire incident types. ↩
-
Percentages may not sum to 100% due to rounding. ↩
-
The figures for non-fire incidents attended broken down by detailed type of action can be found in FIRE0902. ↩
-
Medical incidents - contains the “Medical incident - First responder” and “Medical incident - Co-responder” categories. Flooding and rescue or evacuation from water - contains the “Flooding” and “Rescue or evacuation from water” categories. False alarms - contains the “Malicious False Alarm” and “Good Intent False Alarm” non-fire categories. Other - contains the “Other transport incident”, “Other rescue / release of persons”, “Animal assistance incidents”, “Removal of objects from people”, “Hazardous Materials incident”, “Spills and Leaks (not RTC)”, “Making Safe (not RTC)”, “Evacuation (no fire)”, “Water provision”, “Advice only”, “Stand by” and “No action (not false alarm)” categories. ↩
-
Analysis on the relationship between ‘flooding and rescue or evacuation from water’ incidents and rainfall was conducted in the ‘Detailed analysis of non-fire incidents: England, April 2019 to March 2020’ release. ↩
-
Collaborating incidents include “Assisting other agencies”, “Effecting entry or exit” and “Suicide or suicide attempts”. ↩
-
Excluding ‘false alarms’ as these do not entail any fatalities by definition, ‘lift release’ as the numbers are too small to provide reliable rates and ‘other’ as this category consists of disparate incident types hence the rate is not meaningful. To note, where an incident requires an FRS to undertake multiple actions (i.e. a suicide attempt and a rescue from water, for example) it is recorded as the action that was the most resource intensive. ↩
-
The percentages referenced here do not always sum to 100% due to rounding. ↩
-
More information on the number of vehicle journeys in Great Britain can be found in the Department for Transport Provisional Road Traffic Estimates Great Britain: April 2020 to March 2021 statistical release. ↩
-
For more detail about the types of medical incident attended see FIRE0902. ↩
-
This section looks at medical co-responding incidents in greater detail as this category comprises the majority of medical incidents attended. ↩
-
Details of fatalities and non-fatal casualties in co-responding incidents (where formal co-responder agreements are in place), are completed if the FRS had an active involvement i.e. ‘touched’ the fatality or non-fatal casualty. ↩
-
Before the financial year 2017 to 2018, Hampshire FRS did not record medical co-responding incidents in the IRS. They are currently undertaking a project to upload this data for the financial year 2017 to 2018 to the financial year 2020 to 2021. ↩