Detailed analysis of fires attended by fire and rescue services, England, April 2020 to March 2021
Published 30 September 2021
Applies to England

© Crown copyright 2021
This publication is licensed under the terms of the Open Government Licence v3.0 except where otherwise stated. To view this licence, visit nationalarchives.gov.uk/doc/open-government-licence/version/3 or write to the Information Policy Team, The National Archives, Kew, London TW9 4DU, or email: psi@nationalarchives.gov.uk.
Where we have identified any third party copyright information you will need to obtain permission from the copyright holders concerned.
This publication is available at https://www.gov.uk/government/statistics/detailed-analysis-of-fires-attended-by-fire-and-rescue-services-england-april-2020-to-march-2021/detailed-analysis-of-fires-attended-by-fire-and-rescue-services-england-april-2020-to-march-2021
Frequency of release: Annual
Forthcoming releases: Home Office statistics release calendar
Home Office responsible statistician: Deborah Lader
Press enquiries: pressoffice@homeoffice.gov.uk
Telephone: 0300 123 3535
Public enquiries: firestatistics@homeoffice.gov.uk
This release presents detailed statistics on fire incidents which occurred in the financial year 2020 to 2021 (1 April 2020 to 31 March 2021) for fire and rescue services (FRSs) in England. Also included are additional analyses of the fires attended during COVID-19 restrictions.
Key results
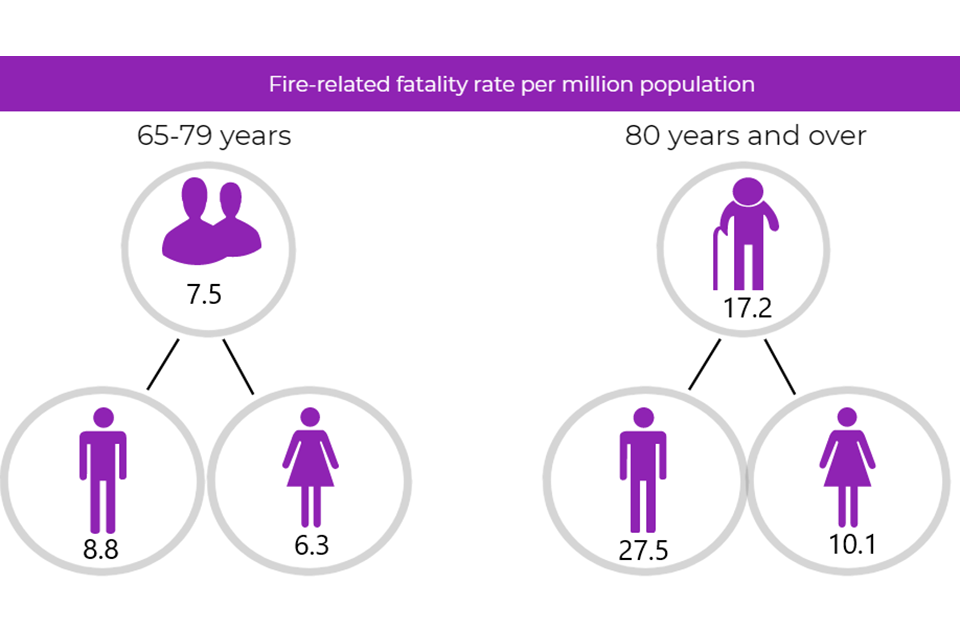
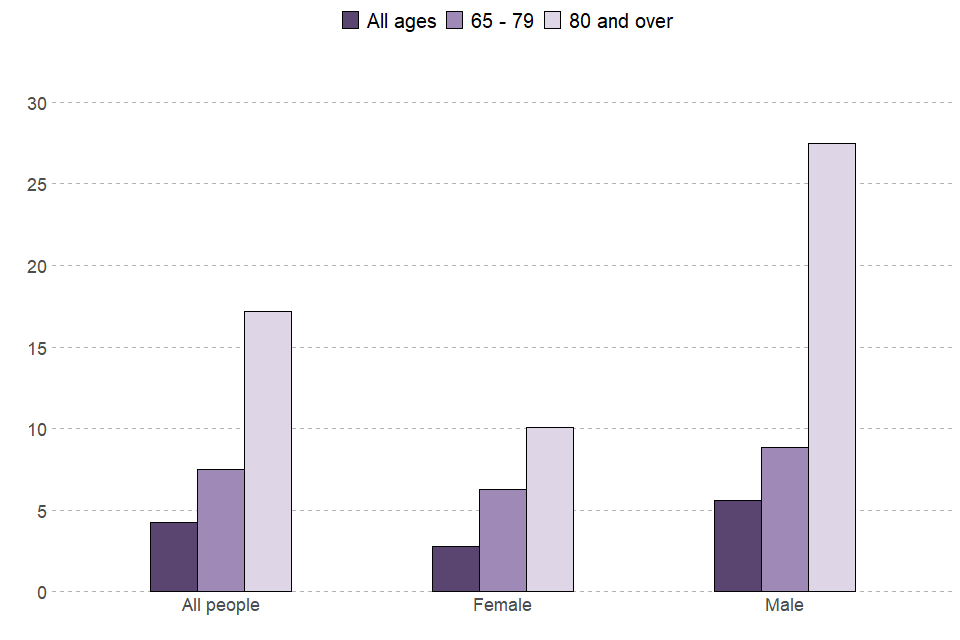
The fire-related fatality rate per million is higher for men and older people. For men aged 65 to 79 the fatality rate was 8.8 per million population while the equivalent rate for women was 6.3 per million. For those aged 80 and over, the rate for men was 27.5 per million and for women was 10.1 per million.
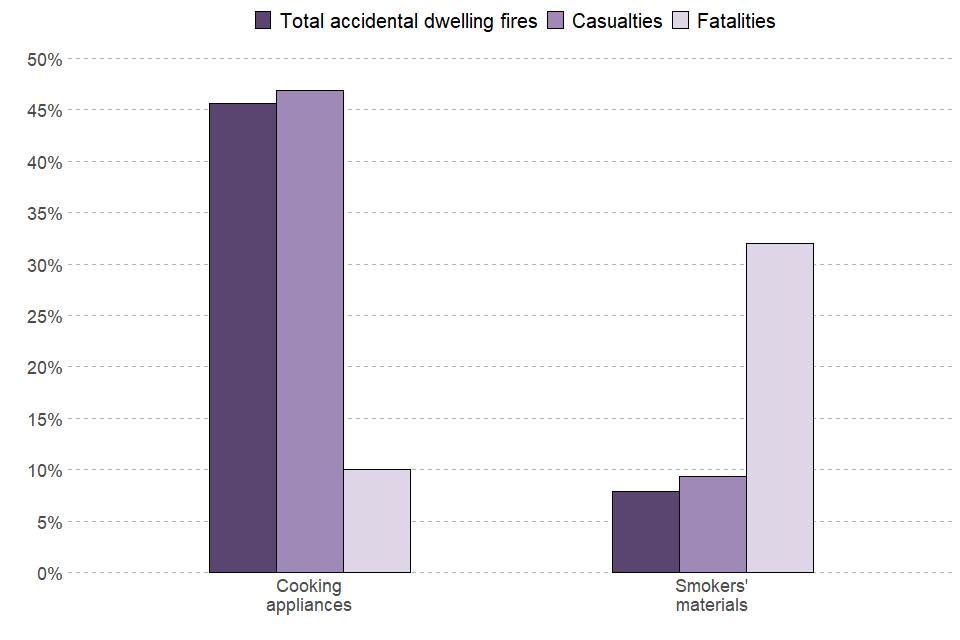
Whilst cooking appliances were by far the biggest ignition category for accidental dwelling fires in the financial year 2020 to 2021 (46% of fires) those fires were responsible for 10 per cent of fatalities. Smoking materials showed the reverse with only eight per cent of fires resulting in 32 per cent of accidental dwelling fire fatalities.
1. Overview of incidents attended
Key results
In the financial year 2020 to 2021:
-
518,263 incidents were attended by FRSs in England: this was a seven per cent decrease compared with the previous year (558,013) (Source: FIRE0102)
-
the decrease in incidents attended was driven by decreases in all three main incident types (fires, non-fire incidents and fire false alarms) with some elements affected by the restrictions on life imposed throughout the financial year 2020 to 2021 in response to the COVID-19 pandemic
-
of all incidents attended by FRSs, fires accounted for 29 per cent, fire false alarms 42 per cent and non-fire incidents 29 per cent (Source: FIRE0102)
Types of fire as recorded in the Incident Recording System (IRS)
Primary Potentially more serious fires that cause harm to people or damage to property. To be categorised as primary these fires must either: occur in a (non-derelict) building, vehicle or outdoor structure, involve fatalities, non-fatal casualties or rescues, or be attended by 5 or more pumping appliances.
Secondary Are generally small outdoor fires, not involving people or property.
Chimney fires Are fires in buildings where the flame was contained within the chimney structure and did not meet any of the criteria for primary fires.
The IRS also captures the motive for a fire, which is recorded as either accidental, deliberate or unknown. Those recorded as unknown are included in the accidental category for the purposes of this report. Accidental fires are therefore those where the motive for the fire was presumed to be accidental or is unknown. Deliberate fires include those where the motive was “thought to be” or “suspected to be” deliberate and includes damage to own or other’s property. These fires are not the same as (although include) arson, which is defined under the Criminal Damage Act of 1971 as “an act of attempting to destroy or damage property, and/or in doing so, to endanger life”.
The Fire and Rescue Incident Statistics publication provides information on a quarterly basis on types of and trends in fires, non-fire incidents and fire false alarms attended by fire and rescue services (FRSs). Key points are included here for background to the following chapters.
Trends in all incidents
The number of incidents attended by FRSs in England peaked in the financial year 2003 to 2004, at over one million incidents. For around a decade, there was a general decline in all three categories of incidents attended and between the financial year 2012 to 2013 and the financial year 2015 to 2016 there were around half a million a year. From the financial year 2015 to 2016 this number rose to around 577,000 incidents in the financial year 2018 to 2019 then fell to around 518,000 in the financial year 2020 to 2021.
This was the lowest number of incidents since the financial year 2014 to 2015, although restrictions on life throughout the financial year 2020 to 2021 in response to the COVID-19 pandemic was an element in this relatively low figure, as discussed throughout the release and fire and rescue incident statistics: England, year ending March 2021. (Source: FIRE0102).
Of the total incidents attended in the financial year 2020 to 2021 around 151,000 (29%) were fires, around 216,000 (42%) were fire false alarms and around 151,000 (29%) were non-fire incidents (also known as special service incidents). (Source: FIRE0102).
Fires attended
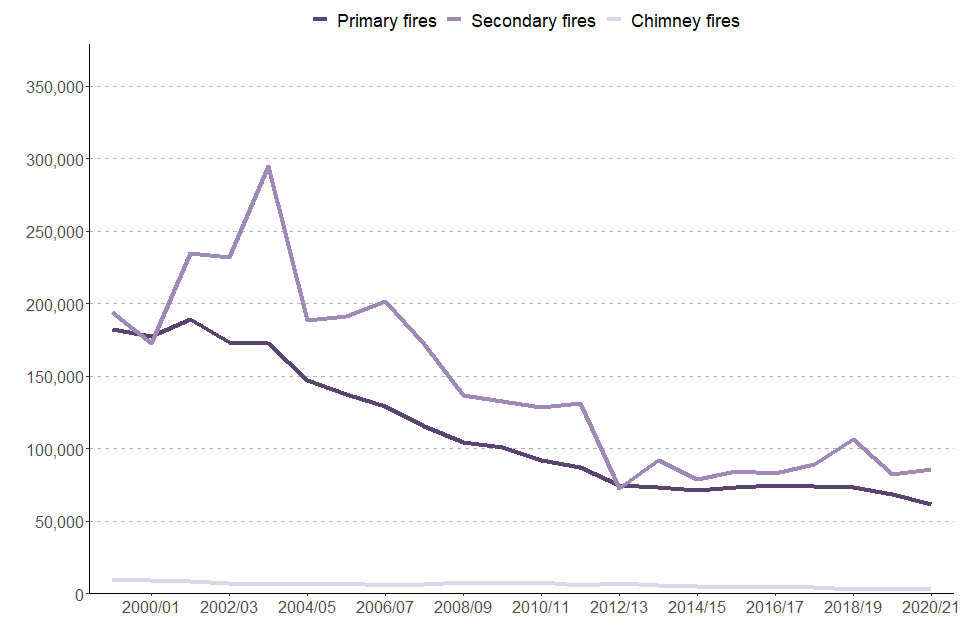
The total number of fires attended by FRSs decreased for around a decade - falling by around two thirds from a peak of around 474,000 in the financial year 2003 to 2004 to around 154,000 in the financial year 2012 to 2013. The total number of fires has fluctuated since the financial year 2012 to 2013 and although the financial year 2020 to 2021 was the lowest figure recorded since comparable statistics became available in the financial year 1995 to 1996, restrictions on life throughout the financial year 2020 to 2021 in response to the COVID-19 pandemic was an element in this relatively low figure. (See Figure 1.1)
Table 1: Number of fires, comparing the financial year 2020 to 2021 with one, five and ten years previously
| Incident type | 2020/21 | 2019/20 | change | 2015/16 | change | 2010/11 | change |
|---|---|---|---|---|---|---|---|
| Fires | 151,086 | 154,180 | -2% | 162,276 | -7% | 228,412 | -34% |
| Primary fires | 61,912 | 68,771 | -10% | 73,479 | -16% | 92,248 | -33% |
| Dwelling fires | 27,021 | 28,499 | -5% | 31,376 | -14% | 36,611 | -26% |
| Accidental dwelling fires | 24,296 | 25,528 | -5% | 28,360 | -14% | 31,718 | -23% |
| Secondary fires | 86,069 | 82,265 | +5% | 84,590 | +2% | 128,478 | -33% |
Source: Home Office, FIRE0102, FIRE0202
Figure 1.1: Fires attended by type of fire, England; financial year 1999 to 2000 to financial year 2020 to 2021
Source: Home Office, FIRE0102
2. Fire-related fatalities, non-fatal casualties, rescues and evacuations
As the Incident Recording System (IRS) is a continually updated database, the statistics published in this release may not match those held locally by FRSs and revisions may occur in the future (see the revisions section for further detail). This may be particularly relevant for fire-related fatalities where a coroner’s report could lead to revisions in the data some time after the incident. It should also be noted that the numbers of fire-related fatalities are prone to year-on-year fluctuations due to relatively low numbers.
Key results
In the financial year 2020 to 2021:
-
there were 240 fire-related fatalities: this was the lowest financial year figure since comparable data became available in the financial year 1981 to 1982 and the number of fatalities has been at historically low levels in recent years
-
78 per cent (186) of fire-related fatalities were in dwelling fires
-
there were 4.2 fire-related fatalities for every million people in England and the fatality rate was highest among older people: 7.5 people per million for those aged 65 to 79 years old and 17.2 for those aged 80 years and over (Figure 2.1)
-
the fatality rates for age bands within 54 years and younger were all below 4 fatalities per million population
-
men had a greater likelihood of dying in a fire than women (5.6 per million population for males compared with 2.8 per million for females)
-
the most common cause of death for fire-related fatalities (where the cause of death was known) was “overcome by gas or smoke”, given in 33 per cent (78) of fire-related fatalities
-
there were 2,758 rescues from primary fires, this was a nine per cent decrease compared with the financial year 2019 to 2020 (3,015) and a decrease of 16 per cent from five years ago in the financial year 2015 to 2016 (3,296)
-
there were 4,057 primary fires that involved an evacuation, this was a decrease of 22 per cent compared with the financial year 2019 to 2020 (5,184) and a decrease of 39 per cent from five years ago in the financial year 2014 to 2015 (6,635); the decrease is likely to have been caused by the COVID-19 pandemic
Fire-related fatalities are those that would not have otherwise occurred had there not been a fire. For the purpose of publications, a “fire-related” fatality includes those that were recorded as “don’t know”.
Non-fatal casualties are those resulting from a fire, whether the injury was caused by the fire or not.
Fire-related fatalities and non-fatal casualties by location of fire
In the financial year 2020 to 2021, there were 240 fire-related fatalities and 6,347 non-fatal casualties in fires, a decrease of five fatalities and 586 non-fatal casualties since the financial year 2019 to 2020.
In the last ten years the proportion of fire-related fatalities that were in dwelling fires has been on a slight upwards trend; from a low of 74 per cent in the financial year 2011 to 2012 to a peak of 82 per cent in the financial year 2019 to 2020. However, in the financial year 2020 to 2021, the proportion of fire-related fatalities that were in dwelling fires decreased to 78 per cent (186 fire-related fatalities).
Fire-related fatalities in other buildings also showed a decrease compared with the previous year. In the financial year 2020 to 2021 there were 14 fire-related fatalities in other buildings, a decrease of four from 18 fire-related fatalities in the previous year.
The majority of fire-related fatalities in the financial year 2020 to 2021 occurred in single occupancy dwellings (171; 71%) with the next largest category being road vehicles (28; 12%). Single household occupancy (as opposed to homes in multiple occupancy) dwelling fires accounted for 74 per cent of non-fatal casualties in the financial year 2020 to 2021 (4,666) but, in contrast to fire-related fatalities, the next largest category was other buildings (743, 12%) (Source: FIRE0502 and FIRE0503).
Seventy-seven per cent (4,877) of non-fatal casualties were in dwelling fires in the financial year 2020 to 2021; this is a similar proportion to previous years (74% per cent in the financial year 2019 to 2020, 75% in the financial year 2015 to 2016 and 80% in the financial year 2010 to 2011).
The number of non-fatal casualties in other buildings decreased by 15 per cent from 878 in the financial year 2019 to 2020 to 743 in the financial year 2020 to 2021. Non-fatal casualties in other buildings have declined over the last three years and before this the number of non-fatal casualties in other buildings fluctuated.
Fire-related fatalities and non-fatal casualties by gender and age
The likelihood of dying in a fire is not uniform across all age groups or genders. Generally, the likelihood increases with age, with those aged 80 and over by far the most likely to die in a fire. Overall, men are twice as likely to die in a fire as women. Although the overall number of fire-related fatalities is relatively low, and so prone to fluctuation, these general patterns have been consistent since data became available in the financial year 2009 to 2010. (Source: FIRE0503)
In the financial year 2020 to 2021, 44 per cent of all fire-related fatalities in England (106 fatalities) were 65 years old and over, compared with 20 per cent (1,285) of all non-fatal casualties; these proportions are similar to the previous year, with 46% for all fire-related fatalities and 21% for all non-fatal casualties.
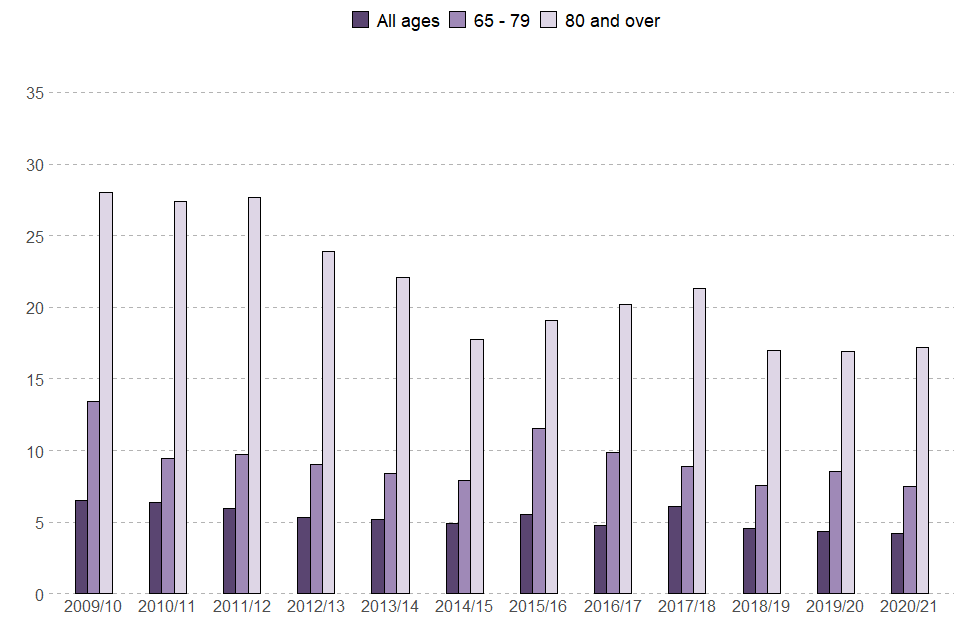
For every million people in England, there were 4.2 fire-related fatalities in the financial year 2020 to 2021. The fatality rate was highest among older people: 7.5 people per million for those aged 65 to 79 years old and 17.2 for those aged 80 and over (Figure 2.1). The fatality rates for age bands for 54 years and younger were all below four fatalities per million population.
There were 156 male fire-related fatalities and 80 female in the financial year 2020 to 2021, with four recorded as “not known”.
Men have a greater likelihood of dying in a fire than women. The overall fatality rate per million population for males in the financial year 2020 to 2021 was 5.6 while the rate for females was 2.8 per million. For men aged 65 to 79 the fatality rate was 8.8 per million while the equivalent rate for women was 6.3 per million. For those aged 80 and over, the rate for men was 27.5 per million and for women was 10.1 per million (Figure 2.2).
Figure 2.1: Fatality rate (fatalities per million people) for all ages and selected age bands, England; financial year 2009 to 2010 to financial year 2020 to 2021
Source: Home Office, FIRE0503a
Figure 2.2: Fatality rate (fatalities per million people) for all ages and selected age bands by gender, England; financial year 2020 to 2021
Source: Home Office, FIRE0503a
Causes of deaths and injuries
The IRS records the cause of death or nature of injury for fire-related fatalities and non-fatal casualties in fires. In the financial year 2020 to 2021, where known, the most common cause of death for fire-related fatalities was “overcome by gas or smoke”. This was the same as for almost every year since the start of the online IRS in the financial year 2009 to 2010.
The most common cause of death for fire-related fatalities in the financial year 2020 to 2021 (where the cause of death was known) was “overcome by gas or smoke”, recorded for 33 per cent (78) of fire-related fatalities. This was followed by “burns” (30%; 73 fire-related fatalities) and “unspecified” (16%; 39 fire-related fatalities).
The proportions for causes of death in fire-related fatalities are fairly stable across most years, except for the financial year 2017 to 2018 where the “unspecified” category was higher (26% compared with a usual range of between 10-20%) due to the Grenfell Tower fire, where a large proportion of the fatalities are recorded as “unspecified” while the public inquiry into the fire is still ongoing. (Source: FIRE0506)
There were 4,285 non-fatal casualties from accidental dwelling fires in the financial year 2020 to 2021, including those who received first aid (1,362) and those who were advised to seek precautionary checks (1,250). When these two groups are removed and only non-fatal casualties requiring hospital treatment (1,673) are looked at, the largest category of injury was “overcome by gas or smoke” (746; 45%) followed by “burns” (401; 24%) and “other breathing difficulties” (247; 15%). All the other categories combined comprised the remaining 17 per cent of injuries. (Source: FIRE0506)
Rescues and evacuations
A rescue is where a person has received physical assistance to get clear of the area involved in the incident.
An evacuation is the direction of people from a dangerous place to somewhere safe.
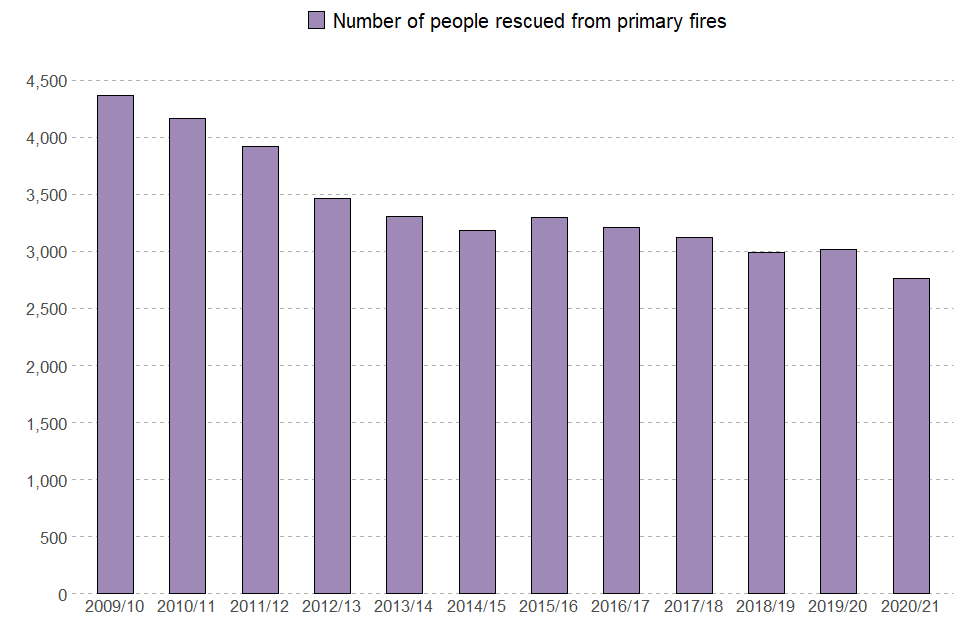
The IRS records the exact number of people rescued from primary fires attended by FRSs. The number of people rescued from primary fires attended by FRSs has been on a downward trend since the online IRS was introduced, decreasing from around 4,300 in the financial year 2009 to 2010 to around 2,800 in the financial year 2020 to 2021 (Figure 2.3). This change has been driven by a decrease in all rescue types.
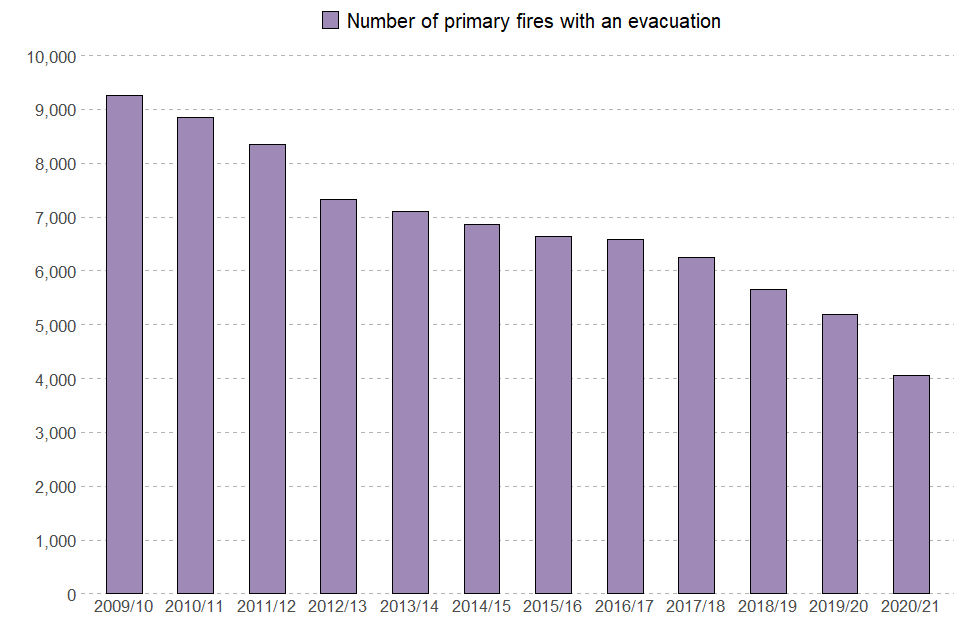
For evacuations from fires attended by FRSs, the IRS records how many people were assisted in eight separate bands (e.g. 6-20 means there were between 6 and 20 people evacuated from a fire). The number of primary fires attended that involved an evacuation has also been on a downward trend (Figure 2.4), decreasing from around 9,300 in the financial year 2009 to 2010 to around 4,100 in the financial year 2020 to 2021. This decrease has been driven by decreases in all types of evacuations.
In the financial year 2020 to 2021, there were 2,758 people rescued from primary fires. This was a nine per cent decrease compared with the previous year (3,015) and a decrease of 16 per cent from five years ago in the financial year 2015 to 2016 (3,296). In the financial year 2020 to 2021, over three quarters (83%) of rescues were from primary dwelling fires with other building, road vehicle and other outdoor fires accounting for 12 per cent, four per cent and one per cent, respectively.
In the financial year 2020 to 2021, there were 4,057 primary fires that involved an evacuation. This was a decrease of 22 per cent compared with the previous year (5,184) and a decrease of 39 per cent from five years ago in the financial year 2015 to 2016 (6,635). The decreases can in part be explained by the restrictions on life throughout the financial year 2020 to 2021 in response to the COVID-19 pandemic (see “Rescues and evacuations attended under COVID-19 national lockdowns” section below). The most common evacuation band was “1 to 5” (i.e. there were 1 to 5 people evacuated from the fire), accounting for 91 per cent of primary fires that involved an evacuation. (Source: FIRE0511)
Figure 2.3: Number of people rescued from primary fires, England; financial year 2009 to 2010 to financial year 2020 to 2021
Source: Home Office, FIRE0511
Figure 2.4: Number of primary fires with an evacuation, England; financial year 2009 to 2010 to financial year 2020 to 2021
Source: Home Office, FIRE0511
Rescues and evacuations attended under COVID-19 national lockdowns
This section shows the average rescues and evacuations numbers per day in primary fires attended by FRSs by week in the financial year 2020 to 2021 compared against a baseline of the previous five years (financial year 2015 to 2016 to financial year 2019 to 2020). This analysis attempts to show if the three national lockdowns, various local lockdowns and restrictions on life throughout the financial year 2020 to 2021 in response to the COVID-19 pandemic affected the number of these incidents attended by FRSs. For more information on the methodology used in this chapter see the “COVID-19 and the impact on the IRS” section.
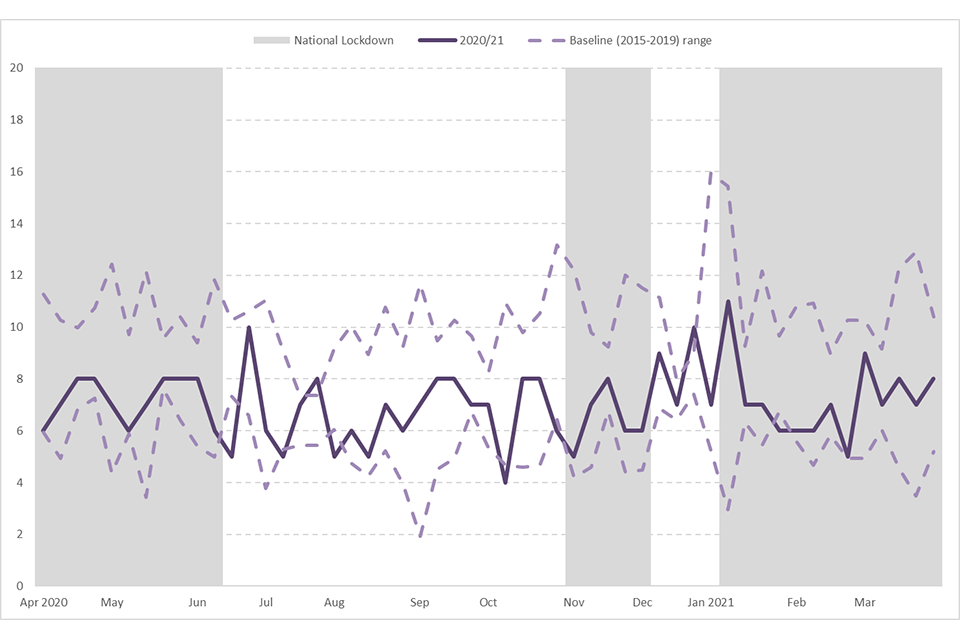
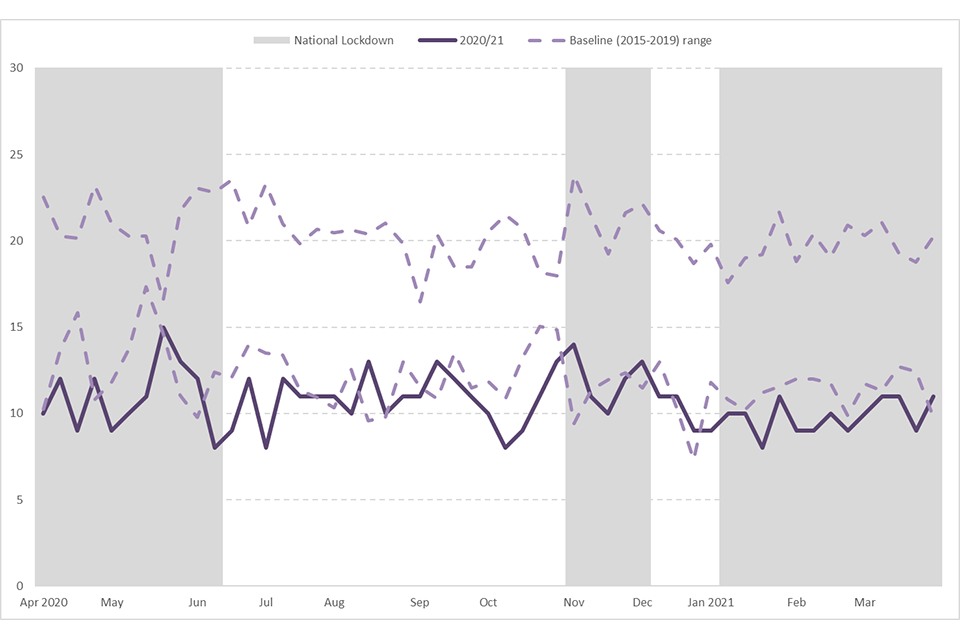
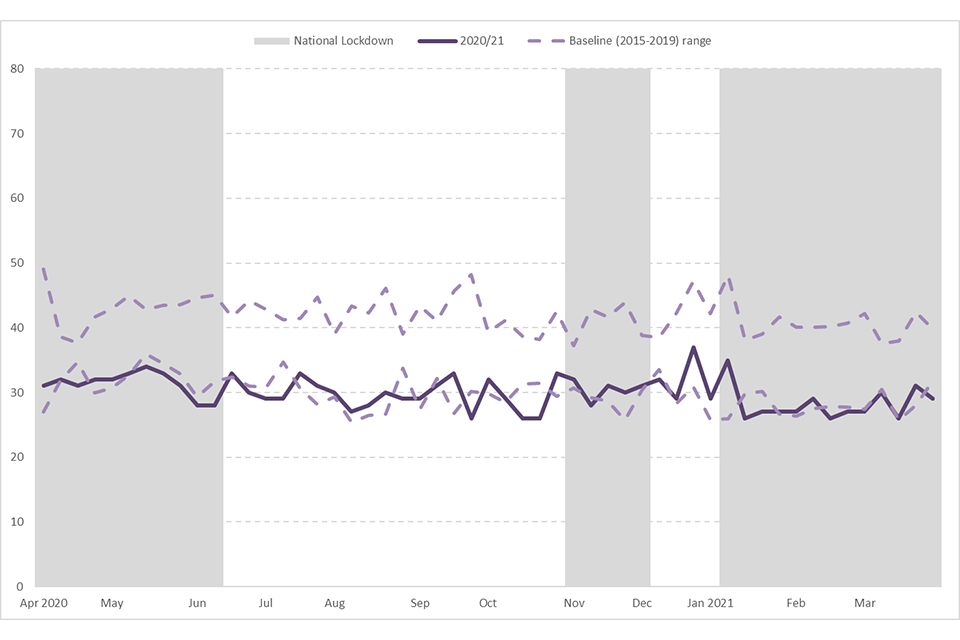
The number of rescues from primary fires attended by FRSs in the financial year 2020 to 2021 was rarely out of the ordinary. Six out of the 53 weeks captured by this analysis fell below the range of what would be expected (i.e. below the 2 dotted lines in Figure 2.5a) while two weeks were above the range. Only one week was below the range during national lockdowns (1 out of 29 weeks shaded grey). This suggests that the restrictions on life throughout financial year 2020 to 2021 did not cause fewer rescues from primary fires.
Figure 2.5a: Average number of rescues from primary fires per day, in the financial year 2020 to 2021 by week
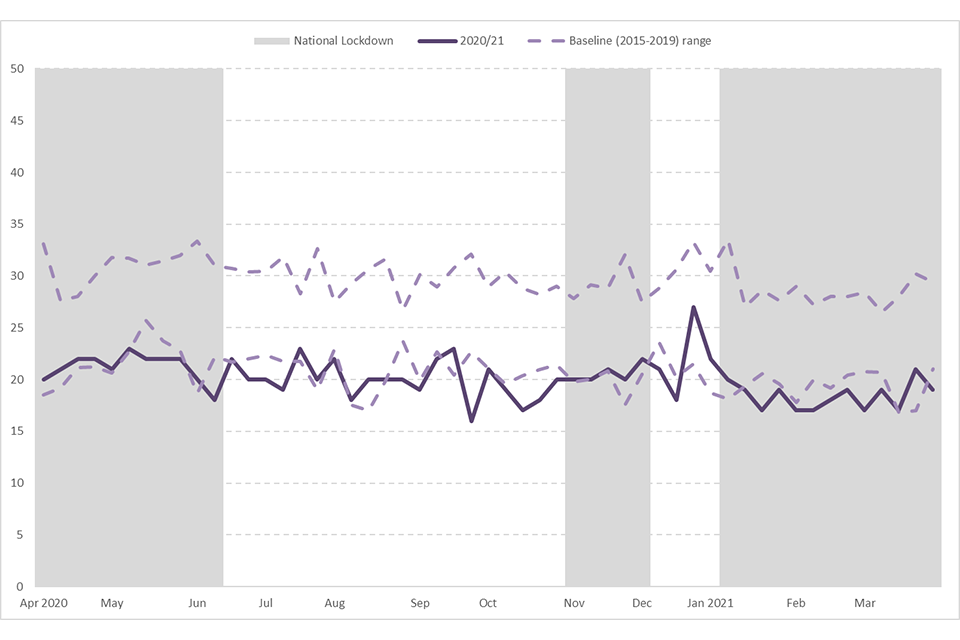
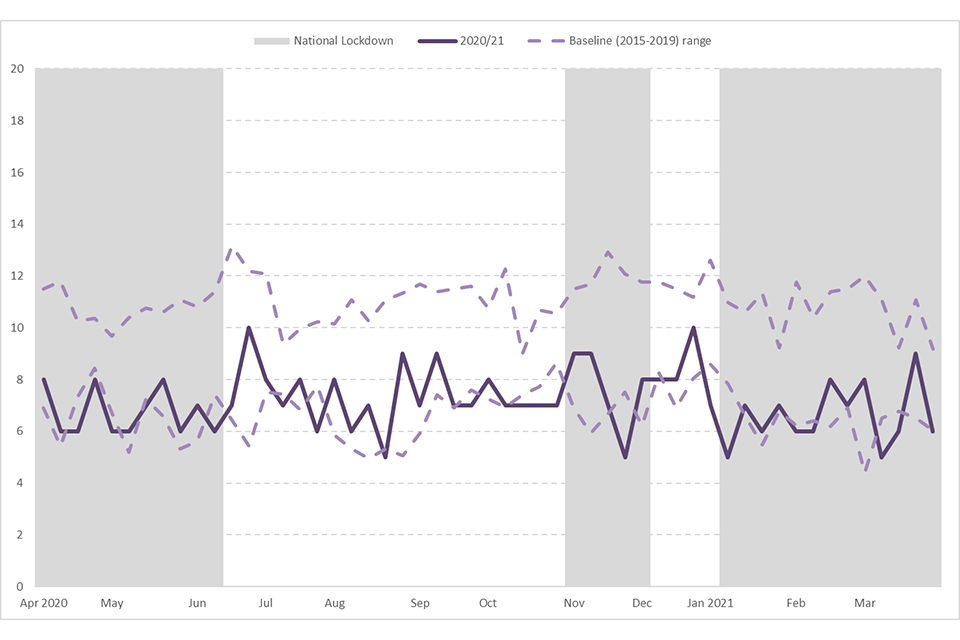
The number of primary fires that involved an evacuation attended by FRSs in the financial year 2020 to 2021 was often out of the ordinary. Thirty-nine out of the 53 weeks captured by this analysis fell below the range of what would be expected (i.e. below the 2 dotted lines in Figure 2.5b) and zero weeks were above the range. Even greater proportions of weeks were below the range during national lockdowns (22 out of 29 weeks shaded grey) and during the third national lockdown (12 out of 13 weeks in the third grey shaded area). This suggests that the restrictions on life throughout the financial year 2020 to 2021 caused fewer primary fires that involved an evacuation, possibly due to a proportion of workplace buildings not being occupied for the majority of the year.
Figure 2.5b: Average number of primary fires that involved an evacuation per day, in the financial year 2020 to 2021 by week
3. Extent of damage and spread of fire
The IRS also records the extent of damage and the spread of fire. The extent of damage (due to smoke, heat, flame and water etc.) to dwellings and other buildings is recorded by the area in square metres broken down into thirteen categories, from “None” up to “Over 10,000” square metres[footnote 1]. The spread of fire in dwellings and other buildings is recorded according to the extent the fire reached different parts of the building based on eight categories from “no fire damage” to “fire spread to the whole building”.
Key results
In the financial year 2020 to 2021:
-
the average area of damage to dwellings (excluding those over 5,000m2) in England was 14.8m2, a decrease of nine per cent compared with the previous year, a decrease of 12 per cent from five years ago (16.9m2 in the financial year 2015 to 2016) and a 32 per cent decrease from ten years ago (21.9m2 in the financial year 2010 to 2011)
-
the average area of damage to other buildings (excluding those over 1,000m2) increased by one per cent to 28.7m2 compared with 28.5m2 in the financial year 2019 to 2020 - this was a decrease of two per cent from five years ago (29.4m2 in the financial year 2015 to 2016) and a decrease of 13 per cent from ten years ago (33.1m2 in the financial year 2010 to 2011)
-
seven per cent of fires in purpose-built high-rise (10+ storeys) flats or maisonettes spread beyond the room of origin, compared with seven per cent of fires in purpose-built medium-rise (4-9 storeys) flats or maisonettes, ten per cent in purpose-built low-rise (1-3 storeys) flats or maisonettes and 12 per cent of fires in houses, bungalows, converted flats and other dwellings combined
Extent of damage
Dwelling fires with more than 5,000m2 of damage and other buildings fires with more than 1,000m2 of damage can skew the averages, so were removed for the averages reported here. However, for completeness, other calculations are available in tables FIRE0204 and FIRE0305, which accompany this release. It should be noted that excluding these area categories removed four dwelling fires (less than 0.01% of all dwelling fires) and 116 other buildings fires (0.97% of all other building fires) for financial year 2020 to 2021.
The average extent of damage to dwellings has generally fallen since the financial year 2003 to 2004 but has levelled off over the last three years. The average extent of damage to other buildings has fluctuated since financial year 2009 to 2010 (from when the average extent of damage to other buildings started being more accurately recorded)[footnote 2].
In the financial year 2020 to 2021, the average area of damage to dwellings (excluding those over 5,000m2) in England was 14.8m2. This was a nine per cent decrease compared with the financial year 2019 to 2020, a 12 per cent decrease since the financial year 2015 to 2016 (16.9m2) and a 32 per cent decrease since the financial year 2010 to 2011 (21.9m2). (Source: FIRE0204)
The average area of damage to other buildings (excluding those over 1,000m2) increased by one per cent from 28.5m2 in the financial year 2019 to 2020 to 28.7m2 in the financial year 2020 to 2021. This has fluctuated over the years: a decrease of two per cent since the financial year 2015 to 2016 (29.4m2) and a decrease of 13 per cent since the financial year 2010 to 2011 (33.1m2). (Source: FIRE0305)
Spread of fire
In the financial year 2020 to 2021, nearly one third (29%) of dwelling fires had no fire damage, in just under a third (32%) the damage was limited to the item first ignited and in a quarter (25%) the damage was limited to the room of origin. The remaining 14 per cent of dwelling fires were larger fires, either “limited to floor of origin”, “limited to 2 floors”, “affecting more than 2 floors”, “limited to roofs and roof spaces” or the “whole building”. (Source: FIRE0203)
Seven per cent of fires in purpose-built high-rise (10 or more storeys) flats or maisonettes spread beyond the room of origin[footnote 3], the same percentage as purpose-built medium-rise (4-9 storeys) flats or maisonettes (7%) and a similar percentage to purpose-built low-rise (1-3 storeys) flats or maisonettes (10%) and lower than the 12 per cent for houses, bungalows, converted flats and other dwellings combined. These figures were all similar to previous years.
Only two per cent of dwelling fires affected the “whole building” in the financial year 2020 to 2021, similar to previous years. Between the financial year 2010 to 2011 and the financial year 2020 to 2021 the proportion of dwelling fires that were “limited to item 1st ignited” has been on a slow increasing trend from 28 per cent to 32 per cent. Over the same time period, the percentage of dwelling fires that had no fire damage has been on a slow decreasing trend from 33 per cent to 29 per cent.
In contrast, in the financial year 2020 to 2021, the proportion of other building fires affecting the “whole building” was 20 per cent (a 5 percentage point rise from the previous year). Between the financial year 2010 to 2011 and the financial year 2020 to 2021 the proportion of other building fires that were “limited to item 1st ignited” has fluctuated between 26 and 29 per cent (26% in the financial year 2020 to 2021) and the percentage of other building fires that had no fire damage has been on a slow decreasing trend from 27 per cent to 20 per cent. (Source: FIRE0304)
4. Causes of dwelling fires and fire-related fatalities
The IRS collects information on the source of ignition (e.g. “smokers’ materials”), the cause of fire (e.g. “fault in equipment or appliance”), which item or material was mainly responsible for the spread of the fire (e.g. “clothing or textiles”), and ignition power (e.g. gas)[footnote 4].
Key results
In financial year 2020 to 2021:
-
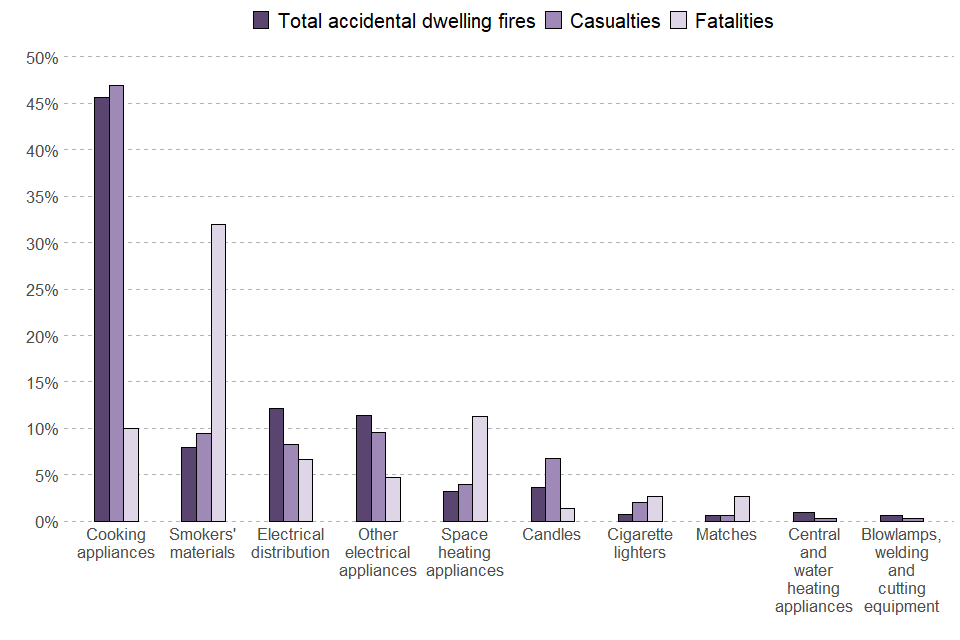
cooking appliances were the largest ignition category for accidental dwelling fires, accounting for 46 per cent of these fires and 35 per cent of non-fatal casualties but only accounted for 10 per cent of the fire-related fatalities
-
smokers’ materials were the source of ignition in eight per cent of accidental dwelling fires and eight per cent of accidental dwelling fire non-fatal casualties but were the largest ignition category for fire-related fatalities in accidental dwelling fires, accounting for 32 per cent
-
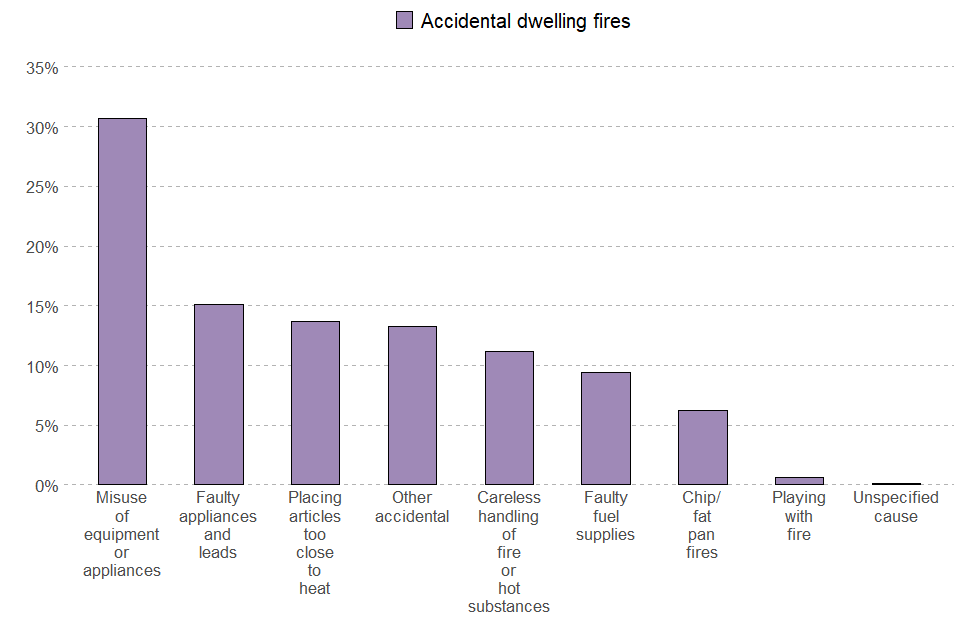
of the 24,362 accidental dwelling fires[footnote 5], 31 per cent were caused by “misuse of equipment or appliance”, compared with 34 per cent in the financial year 2019 to 2020
Sources of ignition in accidental dwelling fires
Since the financial year 2010 to 2011, the number of accidental dwelling fires has decreased by 24 per cent. This was in large part driven by a 30 per cent decrease (between the financial year 2010 to 2011 and the financial year 2020 to 2021) in fires where the ignition source was “cooking appliance”, as these make up nearly half of all accidental dwelling fires. Other ignition types that have contributed to the decrease include “space heating appliance” and “other electrical appliance” (decreases of 44% and 32% over the same time period, respectively). (Source: FIRE0602)
Figure 4.1 shows the proportion of accidental dwelling fires, and their resulting non-fatal casualties and fire-related fatalities, attributable to different sources of ignition[footnote 6]. It shows that while some ignition sources cause many fires, they often result in relatively few fire-related fatalities, and vice versa. (Source: FIRE0601 to FIRE0605)
Figure 4.1: Percentage of fires, non-fatal casualties and fire-related fatalities in accidental dwelling fires by selected sources of ignition, England; financial year 2020 to 2021
Source: Home Office, FIRE0602
Main cause of, and material mainly responsible for, dwelling fires
Exactly how a fire originated, and then the material which was mainly responsible for it spreading, are both important determinants in the outcomes of fires. Notably, and similarly to sources of ignition, the most common causes and materials responsible for the spread of fires are not those that lead to the greatest proportion of fire-related fatalities.
Of the 24,296 dwelling fires with accidental causes in financial year 2020 to 2021, 31 per cent were caused by “misuse of equipment or appliance” (Figure 4.2), falling from 34 per cent in the financial year 2019 to 2020. The second largest cause category was “faulty appliances and leads” which caused 15 per cent of all accidental dwelling fires. (Source: FIRE0601)
The material mainly responsible for the development of the fire in 23 per cent of all dwelling fires and the item first ignited in 26 per cent of all dwelling fires in the financial year 2020 to 2021 was “Textiles, upholstery and furnishings”. This material caused 60 per cent of all fire-related fatalities in dwellings. (Source: FIRE0603, FIRE0604)
“Food” was the material mainly responsible for the development of the fire in 18 per cent of all dwelling fires and the item first ignited in 26 per cent of all dwelling fires in the financial year 2020 to 2021. However, it was the material mainly responsible for the development of the fire in only four per cent of all fire-related fatalities in dwelling fires.
Figure 4.2: Percentage of fires in accidental dwelling fires by cause of fire, England; financial year 2020 to 2021
Source: Home Office, FIRE0601
Causes and sources of accidental dwelling fires attended under COVID-19 national lockdowns
This section shows the average numbers of accidental dwelling fires attended by FRSs per day by week in the financial year 2020 to 2021 compared against a baseline of the previous five years (financial year 2015 to 2016 to financial year 2019 to 2020) for different causes or sources of fire. This analysis attempts to show if the three national lockdowns, various local lockdowns and restrictions on life throughout the financial year 2020 to 2021 in response to the COVID-19 pandemic affected the number of these incidents attended by FRSs. For more information on the methodology used in this chapter see the “COVID-19 and the impact on the IRS” section.
The number of accidental dwelling fires caused by “misuse of equipment or appliance” attended by FRSs in the financial year 2020 to 2021 was often out of the ordinary. Thirty out of the 53 weeks captured by this analysis fell below the range of what would be expected (i.e. below the 2 dotted lines in Figure 4.3a) and zero weeks were above the range. Even greater proportions of weeks were below the range during national lockdowns (15 out of 29 weeks shaded grey). This suggests that the restrictions on life throughout the financial year 2020 to 2021 caused fewer accidental dwelling fires where the cause of the fire was the “misuse of equipment or appliance”.
Figure 4.3a: Average number of accidental dwelling fires caused by “misuse of equipment or appliance” per day, in the financial year 2020 to 2021 by week
The number of accidental dwelling fires attended by FRSs where the source of ignition was “cooking appliance” in the financial year 2020 to 2021 was frequently out of the ordinary. Twenty-three out of the 53 weeks captured by this analysis fell below the range of what would be expected (i.e. below the 2 dotted lines in Figure 4.3b) and zero weeks were above the range. Even greater proportions of weeks were below the range during national lockdowns (14 out of 29 weeks shaded grey) and during the first national lockdown (6 out of 11 weeks in the first grey shaded area). This suggests, relatively weakly, that the restrictions on life throughout the financial year 2020 to 2021 caused fewer accidental dwelling fires where the source of ignition was “cooking appliance”.
Figure 4.3b: Average number of accidental dwelling fires where the source of ignition was “cooking appliance” per day, in the financial year 2020 to 2021 by week
The number of accidental dwelling fires attended by FRSs where the source of ignition was “other electrical appliance” in the financial year 2020 to 2021 was frequently out of the ordinary. Twenty-one out of the 53 weeks captured by this analysis fell below the range of what would be expected (i.e. below the 2 dotted lines in Figure 4.3b) and zero weeks were above the range. A slightly greater proportion of weeks was below the range during national lockdowns (12 out of 29 weeks shaded grey). This suggests, relatively weakly, that the restrictions on life throughout the financial year 2020 to 2021 caused fewer accidental dwelling fires where the source of ignition was “other electrical appliance”.
Figure 4.3c: Average number of accidental dwelling fires where the source of ignition was “other electrical appliance” per day, in the financial year 2020 to 2021 by week
5. Smoke alarm function
Key results
In the financial year 2020 to 2021:
-
fires where a smoke alarm was not present accounted for 25 per cent (6,806) of all dwelling fires and 30 per cent (55) of all dwelling fire-related fatalities
-
mains powered smoke alarms continued to have a lower “failure rate” than battery powered smoke alarms; 23 per cent of mains powered smoke alarms failed to operate in dwelling fires compared with 39 per cent of battery powered smoke alarms
The IRS records information on whether a smoke alarm was present at the fire incident, as well as the type of alarm (mains or battery powered) and whether or not it functioned as intended i.e. if it operated and if it raised the alarm.
Smoke alarms in dwelling fires
Reasons alarms did not function as expected
Did not operate alarm battery missing; alarm battery defective; system not set up correctly; system damaged by fire; fire not close enough to detector; fault in system; system turned off; fire in area not covered by system; detector removed; alerted by other means; other; not known.
Operated but did not raise the alarm no person in earshot; occupants did not respond; no other person responded; other; not known.
Fires where a smoke alarm was present but either did not operate or did not raise the alarm accounted for just under a third (32%) of all dwelling fires in the financial year 2020 to 2021, one percentage point higher than the financial year 2019 to 2020 (31%).
In the financial year 2020 to 2021, “fire products did not reach detector(s)”[footnote 7] and “fire in area not covered by system” accounted for 65 per cent of smoke alarm failures in dwelling fires where the smoke alarm was mains powered (Table 2). Similarly, the main reasons smoke alarms failed to operate in dwelling fires with battery operated smoke alarms present were “fire products did not reach detector(s)” and “fire in area not covered by system” (60% in the financial year 2020 to 2021). These were also the principal causes of smoke alarm failures in previous years.
As for all years since the financial year 2010 to 2011, in the financial year 2020 to 2021 the most common category of smoke alarm failure in dwelling fires involving any casualties was “Other” (including “alerted by other means”, “system damaged by fire”, “other” and “don’t know”), which accounted for 44 per cent of these fires where battery powered smoke detectors were present and 31 per cent where mains powered detectors were present (Table 2). (Source: FIRE0704)
Table 2: Reason smoke alarms did not operate in dwelling fires and dwelling fires resulting in casualties, by type of alarm, England, financial year 2020 to 2021
| Reason for failure | Battery powered - fires | Battery powered - fire resulting in casualties | Mains powered - fires | Mains powered - fire resulting in casualties |
|---|---|---|---|---|
| Missing battery | 8% | 12% | 0% | 3% |
| Defective battery | 10% | 12% | 0% | 0% |
| Other act preventing alarm from operating | 2% | 5% | 7% | 25% |
| Fire products did not reach detector(s) | 45% | 7% | 49% | 13% |
| Fire in area not covered by system | 15% | 7% | 16% | 16% |
| Faulty system or incorrectly installed | 3% | 12% | 4% | 13% |
| Other | 18% | 44% | 23% | 31% |
Notes:
Includes all non-fatal casualties and fire-related fatalities.
Mains powered smoke alarms includes those recorded as “mains and battery” in the IRS, therefore there are a small number of mains powered smoke alarms where the reason for failure is “missing battery” or “defective battery”.
Smoke alarm function and outcomes
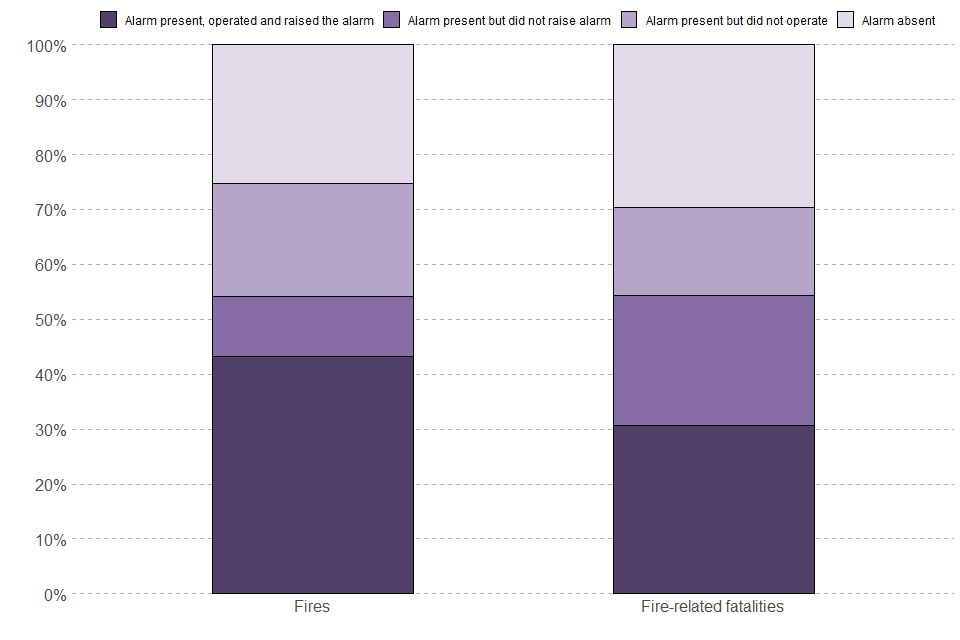
Figure 5.1 shows the proportion of dwelling fires and fire-related fatalities in dwelling fires where the alarm was “present, operated and raised the alarm”, “present but did not raise the alarm”, “present but did not operate” or “absent”. It shows that a smoke alarm was present and raised the alarm (i.e. functioned as intended) in 43 per cent of dwelling fires in the financial year 2020 to 2021 but in only 31 per cent of fire-related fatalities, highlighting the importance of both having working smoke alarms and having enough of them to cover all areas in a dwelling. (Source: FIRE0701, FIRE0702)
Alarms were absent in a higher proportion for fire-related fatalities (30%) than in dwelling fires (25%). This pattern is consistent with previous years.
Figure 5.1: Smoke alarm operation outcomes in dwelling fires and fire-related fatalities, England; financial year 2020 to 2021
Source: Home Office, FIRE0702
By combining IRS and English Housing Survey data, Home Office statisticians have calculated that you are around eight times more likely to die in a fire if you do not have a working smoke alarm in your home[footnote 8].
Smoke alarms in other building fires
Fires where a smoke alarm was not present accounted for 55 per cent of all other building fires in financial year 2020 to 2021. This has been relatively stable between the financial year 2012 to 2013 and the financial year 2019 to 2020; with the percentage fluctuating between 46 per cent and 48 per cent. However, likely due to the COVID-19 pandemic, in the financial year 2020 to 2021 the highest figure since the financial year 2011 to 2012 was recorded. (Source: FIRE0706)
Fires where a smoke alarm was not present accounted for 49 per cent of all other building fire-related fatalities and non-fatal casualties (combined) in the financial year 2020 to 2021, 15 percentage points greater than in the financial year 2019 to 2020. This is the highest figure recorded since the financial year 2010 to 2011, however it should be noted that due to the relatively small numbers involved this figure is prone to fluctuation (there were 368 fire-related fatalities and non-fatal casualties in fires where a smoke alarm was not present in the financial year 2020 to 2021). (Source: FIRE0706)
Fires where a smoke alarm was present but did not raise the alarm accounted for five per cent, and fires where an alarm was present but did not operate accounted for nine per cent, of other building fires in the financial year 2020 to 2021. These proportions have been relatively stable since the financial year 2010 to 2011. (Source: FIRE0706)
6. Temporal and seasonal fire analyses
Key results
In the financial year 2020 to 2021:
-
the hourly number of fires showed a strong daily pattern, with 47 per cent of all fires occurring where the time of call was between 16:00 and 22:00
-
the hourly number of fire-related fatalities did not show a daily pattern, with the number of fire-related fatalities roughly equal between day and night hours
-
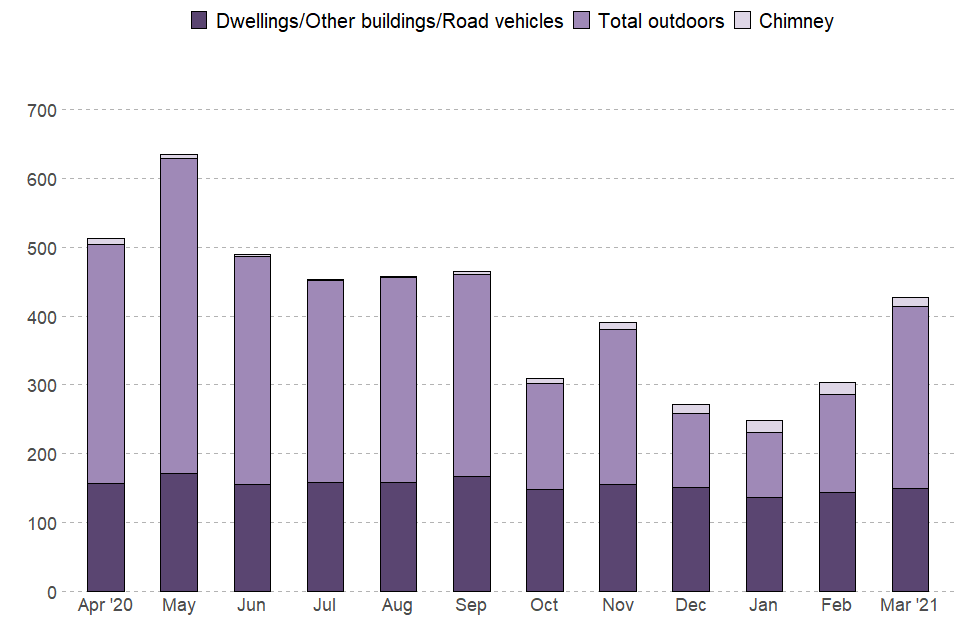
May experienced the most fires per day attended by FRSs (an average of 633), whilst January had the fewest (250 fires per day on average)
-
the average numbers of fires attended per day over the whole year (414) was almost the same as the previous year (421)
Fires and fire-related fatalities are affected by both seasonality and time of day. Similar to previous years, there were generally fewer fires where the time of call was between midnight and 11am, but the number of fire-related fatalities remained relatively high despite lower incidence of fires and with no strong temporal pattern. Additionally, little seasonality was evident in dwelling, other building and road vehicle fires, while outdoor fires and chimney fires showed much stronger seasonal effects.
Temporal fire analyses
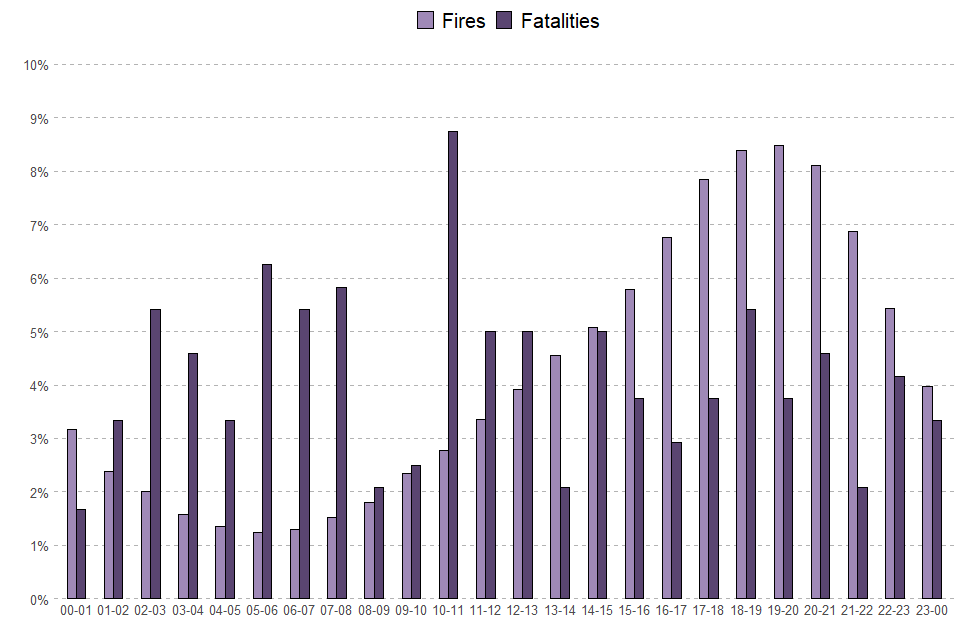
Forty-seven per cent of all fires in the financial year 2020 to 2021 occurred where the time of call was between 16:00 and 22:00 (Figure 6.1). These were the six individual hours with the highest proportion of fires (by time of call), which was also true for all the previous financial years. The peak hours were between 18:00 and 21:00 and accounted for at least 8.1 per cent of fires each in the financial year 2020 to 2021, similar to previous years. (Source: FIRE0801)
Figure 6.1 Percentage of fires and fire-related fatalities by hour of the day, England; financial year 2020 to 2021
Source: Home Office, FIRE0801
In contrast to the number of fires, the hourly number of fire-related fatalities showed less of a pattern across the day in the financial year 2020 to 2021, so, as in previous years, fire-related fatalities were roughly equal between day and night hours. The peak hours were 10:00-11:00 (8.8%), 05:00-06:00 (6.3%) and 07:00-08:00 (5.8%). While the six individual hours with the highest proportion of fires were continuous and accounted for 47 per cent of incidents, the six highest for fatalities were spread throughout the day and accounted for just 37 per cent (Figure 6.1).
Seasonal fire analyses
Very little seasonality was evident in dwelling, other building and road vehicle fires, however outdoor fires and chimney fires showed much stronger seasonal effects. There tends to be more grassland, refuse and other outdoor fires in the summer months and these seem to reflect weather patterns (see FIRE0802). Conversely, chimney fires are more numerous in the winter months. These seasonal effects are broadly similar each year but are affected by changes in weather patterns specific to that year, e.g. in the financial year 2020 to 2021 the values were skewed towards spring or early summer with a peak in May while in the financial year 2019 to 2020 they were highest in April.
The high rate of fires in May 2020 was driven by fires in “grassland, woodland and crops”, which had a daily rate 48 per cent greater than any other month (181 fires per day, compared with 122 in June). Moreover, refuse fires, other outdoor and secondary fires, dwelling fires and other building fires all recorded their highest rate that month.
The daily rate of all fires for the financial year 2020 to 2021 was 414 fires per day. 61 per cent (252) of these were all types of outdoor fires.
Fires in dwellings, other buildings and road vehicles showed relatively little seasonality, with a slight increase in spring months, and the daily rate of these fires attended varied between 137 and 172 per month in the financial year 2020 to 2021.
Figure 6.2 shows the average daily number of different types of fires in the financial year 2020 to 2021 by month. It shows how stable dwelling, other building and road vehicle fires are across months, compared with seasonal outdoor fires and, to a lesser extent, chimney fires.
Figure 6.2: Average daily fire incidents by month and location, England; financial year 2020 to 2021
Source: Home Office, FIRE0802
7. Further information
This release contains statistics about incidents attended by fire and rescue services (FRSs) in England. The statistics are sourced from the Home Office’s online Incident Recording System (IRS). This system allows FRSs to complete an incident form for every incident attended, be it a fire, a false alarm or a non-fire incident (also known as a Special Service incident). The online IRS was introduced in April 2009. Previously, paper forms were submitted by FRSs and an element of sampling was involved in the data compilation process.
Fire and Rescue Incident Statistics and other Home Office statistical releases are available via the Statistics at Home Office pages on the GOV.UK website.
Data tables linked to this release and all other fire statistics releases can be found on the Home Office’s Fire statistics data tables page.
Guidance for using these statistics and other fire statistics outputs, including a Quality Report, is available on the Fire statistics guidance page.
The information published in this release is kept under review, taking into account the needs of users and burdens on suppliers and producers, in line with the Code of Practice for Statistics. The Office for Statistics Regulation recently carried out a compliance check of the Home Office’s fire and rescue incident statistics against the Code of Practice and the results can be found in a letter to the Home Office’s Head of Profession published on the OSR website.
If you have any comments, suggestions or enquiries, please contact the team via email using firestatistics@homeoffice.gov.uk.
Revisions
The IRS is a continually updated database, with FRSs adding incidents daily. The figures in this release refer to records of incidents that occurred up to and including 31 March 2021. This includes incident records that were submitted to the IRS by 17 June 2021, when a snapshot of the database was taken for the purpose of analysis. As a snapshot of the dataset was taken on 17 June 2021, the statistics published may not match those held locally by FRSs and revisions may occur in the future. This is particularly the case for statistics with relatively small numbers, such as fire-related fatalities. For instance, this can occur because coroner’s reports may mean the initial view taken by the FRS will need to be revised; this can take many months, even years, to do so.
COVID-19 and the impact on the IRS
The figures presented in this release relate to fires attended by FRSs during the financial year 2020 to 2021. In response to the coronavirus pandemic, restrictions in England, Scotland and Wales started from 12 March 2020. In England, during the financial year 2020 to 2021, three lockdowns which applied strict limits on daily life were imposed. A first lockdown was applied on 23 March 2020 (i.e. slightly before the start of the financial year 2020 to 2021) and was eased from 10 May 2020, a second lockdown began on 5 November 2020 and ended on 2 December 2020 and the third began on 4 January 2021 and ended on 12 April 2021 (i.e. after the end of financial year 2020 to 2021). The restrictions and lockdowns are therefore captured in IRS data for the financial year 2020 to 2021.
Extra analysis on fires can be found in this release. This analysis shows the average fire numbers per day for various fire types by week attended by FRSs under the lockdown compared against a baseline of the previous five years (financial year 2015 to 2016 to financial year 2019 to 2020). The charts are presented as “average number of … per day” for each week in the financial year because 365 and 366 do not divide into 52 perfect weeks and hence the 1st and 53rd “weeks” can be shorter than 7 days. To ensure the analysis is fair, weeks are divided by the appropriate number of days (usually but not always 7). Weekly figures are highly susceptible to fluctuation and so an upper and lower range, using the mean and standard deviation of the financial year 2015 to 2016 to financial year 2019 to 2020 baseline figures, was calculated. Any figures beyond this range would fall outside of what would be expected, although these results could be explained by various factors such as the weather, school or bank holiday dates and not simply the COVID related lockdowns and restrictions. Whilst it is difficult to define exactly what constituted a “national lockdown” and when they started and finished, in this analysis we have used the dates when the majority of “non-essential retail” was closed. This complements the analysis published in Fire and rescue incident statistics, England, year ending June 2020, Detailed analysis of non-fire incidents: England, April 2019 to March 2020 and Fire and rescue incident statistics: England, year ending March 2021.
We plan to publish additional analysis on the effects of COVID-19 lockdowns in Detailed Analysis of Response Times.
Other related publications
Home Office publish five other statistical releases covering fire and rescue services.
These include:
-
Fire and rescue incident statistics, England: provides statistics on trends in fires, casualties, false alarms and non-fire incidents attended by fire and rescue services in England, updated quarterly
-
Detailed analysis of non-fire incidents attended by fire and rescue services, England: focuses on non-fire incidents attended by fire and rescue services across England, including analysis on overall trends, fatalities and non-fatal casualties in non-fire incidents, and further detailed analysis of different categories of non-fire incidents
-
Fire and rescue workforce and pensions statistics: focuses on total workforce numbers, workforce diversity and information regarding leavers and joiners; covers both pension fund income and expenditure and firefighters’ pension schemes membership; and includes information on incidents involving attacks on firefighters
-
Fire prevention and protection statistics, England: focuses on trends in smoke alarm ownership, fire prevention and protection activities by fire and rescue services
-
Response times to fires attended by fire and rescue services, England: covers statistics on trends in average response times to fires attended by fire and rescue services
The Ministry of Housing, Communities & Local Government also publish statistical releases on fire
These include:
-
the English housing survey: fire and fire safety report focuses on the extent to which the existence of fire and fire safety features vary by household and dwelling type
-
the English housing survey: feeling safe from fire report focuses on whether people felt safe from fire in their homes by household and dwelling type
Fire statistics are published by the other UK nations:
Scottish fire statistics and Welsh fire statistics are published based on the IRS. Fire statistics for Northern Ireland are published by the Northern Ireland Fire and Rescue Service using data from a system similar to the Incident Recording System, which means that they are not directly comparable to English, Welsh and Scottish data.
-
For a list of the damaged area size bands, see the Fire Statistics Definitions document. ↩
-
For detail on the discontinuity between the financial year 2008 to 2009 and the financial year 2009 to 2010 please see page 17 in the financial year 2011 to 2012 incidents response times report ↩
-
Fire spread beyond the room of origin comprises the following IRS categories: where the spread of fire was limited to the floor of origin, where the spread of fire was limited to 2 floors, where the spread of fire was affecting more than 2 floors and where the fire spread to the whole building. ↩
-
For a more detailed definition on the different types of cause of fire, see the definitions document and IRS Guidance. ↩
-
As defined by cause of fire. Source: FIRE0601 ↩
-
This excludes “Other/Unspecified”. ↩
-
Fire products did not reach detectors(s) can be where the smoke alarms present were poorly sited (e.g. not on the floor of origin) so the smoke did not reach the detector. ↩
-
For details of the calculation and assumptions made, see the definitions document. ↩