Adult social care monthly statistics, England: November 2021
Updated 11 November 2021
Applies to England

© Crown copyright 2021
This publication is licensed under the terms of the Open Government Licence v3.0 except where otherwise stated. To view this licence, visit nationalarchives.gov.uk/doc/open-government-licence/version/3 or write to the Information Policy Team, The National Archives, Kew, London TW9 4DU, or email: psi@nationalarchives.gov.uk.
Where we have identified any third party copyright information you will need to obtain permission from the copyright holders concerned.
This publication is available at https://www.gov.uk/government/statistics/adult-social-care-in-england-monthly-statistics-november-2021/adult-social-care-monthly-statistics-england-november-2021
Main points
COVID-19 and flu vaccination in social care settings
As of 26 October 2021, the numbers who had received a booster dose of the COVID-19 vaccine were:
-
139,000 residents and 88,162 staff of older adult care homes
-
8,636 residents of younger adult care homes
-
12,143 staff of younger adult care homes and 24,572 staff of domiciliary care staff
As of 26 October 2021, the proportions who had received their flu vaccination for the 2021 to 2022 season were:
- 48.9% of residents and 11.7% of staff of older adult care homes
- 32.3% of residents of younger adult care homes
- 10.1% of staff of younger adult care homes and 4.5% of domiciliary care staff
Infection control measures in care homes
In the week ending 26 October 2021:
- 92.6% of care homes in England were able to accommodate residents receiving visitors – this has remained broadly consistent since late July 2021
- 82.3% of care homes who had staff required to self-isolate paid those staff their full wages while self-isolating – this proportion has remained consistent since mid-December 2020
- 71.4% of care homes had no staff members working in another health or social care setting – this proportion has continued to gradually decline from 78.2% at the end of April 2021
COVID-19 testing in care homes
ln the week ending 26 October 2021:
- there were 36, 234 polymerase chain reaction (PCR) tests and 426,624 lateral flow device (LFD) tests taken by care home staff. There were 2,542 positive results returned from PCR tests and 930 returned from LFD tests
- there were 100,630 PCR tests and 16,810 LFD tests taken by care home residents. There were 921 positive results returned from PCR tests and 169 returned from LFD tests
- there has continued to be a gradual decline in the number of LFD tests conducted in care home staff since the end of July. While the number of PCR tests conducted in care home staff continues to be lower than July levels, the number has remained relatively stable throughout October
- for both care home staff and residents, there has been an overall increase in the number of positive tests returned from PCR and LFD kits throughout October, in contrast to the decrease seen throughout September
Introduction
This is a monthly publication by the Department of Health and Social Care (DHSC) of statistics on adult social care in England. This statistical bulletin provides an overview on a range of information on social care settings, with a focus on the impact of COVID-19.
This report provides newly published information on:
-
selected infection prevention control (IPC) measures in care homes at national, regional and local authority level
-
staffing levels in care homes at national, regional and local authority level
-
personal protective equipment (PPE) availability in care homes and domiciliary care at national, regional and local authority level
-
testing for COVID-19 in care homes at national, regional and local authority level
-
flu vaccination for the 2021 to 2022 flu season in adult social care settings at national, regional and local authority level
-
booster doses for the COVID-19 vaccination in adult social care settings
This report also includes previously published statistics on first and second dose uptake of COVID-19 vaccinations in adult social care settings.
For more information and links to other published sources of adult social care data please see the ‘About this data’ section below.
Publication updates
Data is now available for COVID-19 booster vaccinations and flu vaccinations for the 2021 to 2022 flu season. Data is available from 28 September 2021 onwards.
Data on PPE availability in domiciliary care has not been updated for the London region for dates after 29 June 2021 due to a data quality issue which is being investigated. National figures for England are also not presented due to the effects of this issue on the national rate. Data for other regions and local authorities not in London are available in the accompanying data tables.
Data for staff working in other settings (including non-registered providers and local authority employed) is not available for dates after 17 August 2021 for national and South East regional figures. This is due to a data quality issue that is being investigated.
The next publication will be published on 9 December 2021. Dates for future publications will be pre-announced on the GOV.UK publication release calendar.
COVID-19 vaccination in adult social care settings
How the data can be used
This data can be used for:
-
comparing vaccination rates across local authorities and regions in England as self-reported by care providers for the:
- first and second doses of the COVID-19 vaccine
- flu vaccinations for the 2021 to 2022 season
- monitoring vaccination rates over time for the:
- first and second doses of the COVID-19 vaccine
- flu vaccinations for the 2021 to 2022 season
- monitoring the number of social care staff and residents who have received a booster dose of the COVID-19 vaccine
This data cannot be used for:
- estimating the number of social care staff or residents who have not been vaccinated
- estimating the number of social care staff or residents who have been vaccinated abroad
- comparing with vaccination rates in other countries of the UK
- directly comparing vaccination take up rates between different types of care home staff (directly employed and agency staff)
- estimating the number of vaccinations delivered each day
- estimating the proportion of eligible social care staff and residents who have received a booster dosage of the COVID-19 vaccine.
Data on booster doses for the COVID-19 vaccine and the flu vaccine for the 2021 to 2022 season are now available as part of this report.
For COVID-19 boosters, statistics are only available for the number of staff and residents who have received their booster dose. Statistics are not yet available on the proportion of staff and residents who have received their booster dose. This is due to ongoing work with NHS England and Improvement (NHSEI) and UK Health Security Agency (UKHSA) to align the methodology for calculating booster rates across various groups in the population. These statistics should not be used to estimate the proportion of eligible staff and residents who have received a booster dose.
The total number of staff and residents for each social care setting as well as the number reported to be vaccinated for COVID-19 and flu are self-reported by the care provider and local authorities. As a result, the rates in this publication refer to the percentage of staff and residents reported to be vaccinated by care providers. This means that the number of individuals who have not received the vaccine cannot be directly derived from data published in these statistics as there is a number of individuals for whom the vaccination status is unknown to the care provider.
The dates in this section refer to the dates vaccinations were reported by care providers as opposed to the date vaccinations were administered.
Some care providers have reported the total number of staff or residents but not the numbers vaccinated. As a result of this, vaccination rates are affected by response rates. This is particularly prominent for vaccination rates for second doses in staff employed in other settings and boosters and flu for all staff and resident groups. This is because these groups have a lower response rate and as a result, second dose vaccination rates may be underestimated. Response rates may also be underestimated, particularly for boosters and flu vaccination. This is because the default value in the underlying data is set to zero, so any zero values submitted will appear to be non-responses.
Among care home staff, there is a substantial difference in reported vaccination rates for COVID-19 and flu vaccinations between staff directly employed by care homes and staff employed by agencies operating within care homes. This could be due to, for example but not exclusively, different uptake rates, vaccination status not being known to the care provider or the nature of employment and information available to the care homes.
For data relating to 31 August 2021 onwards, a small number of social care staff who had their vaccination outside of the UK are excluded from the numbers vaccinated.
For more information, please see the background quality and methodology note.
COVID-19 vaccinations
Adult social care groups covered in this publication by JCVI priority group for COVID-19 vaccination
This is a summary of the priority groups for different social care staff and residents.
JCVI priority group 1:
-
residents in older adult care homes
-
staff directly employed by older adult care homes
-
agency staff working in older adult care homes
JCVI priority group 2:
-
staff directly employed by younger adult care homes
-
agency staff working in younger adult care homes
-
domiciliary care staff registered to independent Care Quality Commission (CQC) providers
-
social care staff working in other settings (including non-registered providers and local authority employed)
Not in a specific JCVI priority group:
- residents of younger adult care homes
The NHS started administering vaccinations for COVID-19 in England on 8 December 2020. Social care staff and residents of care homes were prioritised for the vaccine according to the Joint Committee on Vaccination and Immunisation (JCVI) recommendation. For more information see Priority groups for coronavirus (COVID-19) vaccination: advice from the JCVI.
From 11 November 2021, all people working or volunteering in care homes are required to have received 2 doses of the COVID-19 vaccine as a condition of their deployment in a care home, unless exempt. This report contains data relating up to 26 October 2021. The final date for staff to receive their first dose of the vaccination so they were fully vaccinated in time for the regulation to come into force was 16 September 2021, based on the assumption of an 8-week interval between first and second doses. More details can be found on Vaccination of people working or deployed in care homes: operational guidance.
Adult social care staff and residents are now eligible for a COVID-19 booster vaccination 6 months after their second dose. More details can be found at COVID-19 vaccination: a guide to booster vaccination.
COVID-19 vaccinations in JCVI priority group 1
Around 8 out of 10 older care homes have provided data on the number of staff and residents who received a COVID-19 booster dose, as of 26 October 2021. This means the first and second dose rates and the number of staff and residents receiving a booster dose may be underestimated compared to the true value. For full response rates please see the accompanying ‘COVID-19 vaccination response rates, November 2021: data tables’.
Residents of older care homes
As of 26 October 2021, in older adult care homes:
- 96.2% of residents have been reported to have received their first dose
- 94.8% of residents have been reported to have received their second dose
The reported first dose vaccination rate rapidly increased between January and February 2021 for residents and has since continued to increase but at a much slower pace as more of the population receive the first dose. For second doses the reported rate increased steeply between April and June 2021 and has continued to increase but at a slower rate since then.
There is little regional variation in the reported second dose vaccination rate among residents in JCVI priority group 1. London continues to show the lowest uptake, with 92.9% of residents reported to have received both doses.
Additionally, 139,000 residents have received a booster dose of the COVID-19 vaccine.
Staff of older adult care homes
As of 26 October 2021, in older adult care homes:
- 94.4% of staff have been reported to have received their first dose
- 89.1% of staff have been reported to have received their second dose
The reported first dose vaccination rate rapidly increased between January and February 2021 for staff and has continued to increase each week.
Similarly, for second doses the reported rate increased steeply between April and June 2021 and has continued to steadily increase since July 2021.
There is some variation between regions among staff who have been reported to have received their second dose in JCVI priority group 1, however this variation is progressively decreasing.
Out of all regions, London has shown the quickest increase in second dose vaccination since the end of August 2021, increasing from 78.2% to 88.0% in the week ending 26 October 2021. The North East region has consistently presented the highest second dose take up rates since April 2021 with 92.0% of staff reported to be vaccinated with the second dose in the week ending 26 October 2021.
Additionally, 88,162 staff have received a booster dose of the COVID-19 vaccine.
Figure 1: percentage of staff and residents who have received the first and second dose of the COVID-19 vaccination, cumulative rate, 15 December 2020 to 26 October 2021, England
Reported vaccination rates for JVCI priority group 1 gradually increases for staff.
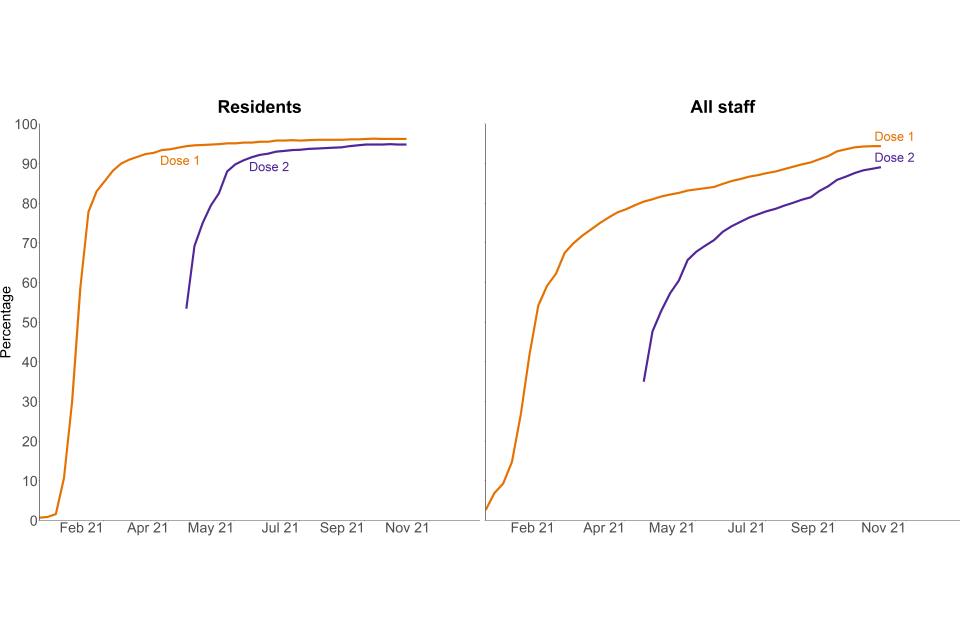
Source: Capacity Tracker
This data can be found in tables 1 and 2 of the accompanying ‘COVID-vaccination’ tables in addition to data by region and local authority.
Notes:
- data for the second COVID-19 vaccine dose became available from 20 April 2021
- data is reported from care providers
- based on date of reporting rather than date of vaccination
COVID-19 vaccinations in JCVI priority group 2
Data for staff working in other settings (including non-registered providers and local authority employed) is not available for dates after 17 August 2021 for national, South East region, and Surrey local authority. This is due to a data quality issue that is being investigated. As a result, data in this report refers to the week ending 17 August 2021 rather than 26 October 2021.
The following proportions of staff in JVCI priority group 2 have been reported to have received their COVID-19 vaccination doses:
In younger adult care homes as of 26 October 2021:
- 92.4% of staff have been reported to have received their first dose
- 85.9% of staff have been reported to have received their second dose
For domiciliary care staff as of 26 October 2021:
- 83.5% of staff have been reported to have received their first dose
- 74.3% of staff have been reported to have received their second dose
Among staff working in other settings as of 17 August 2021:
- 77.0% of staff have been reported to have received their first dose
- 32.9% of staff have been reported to have received their second dose
Additionally, the following numbers of staff have received a booster dose of the COVID-19 vaccine:
- 12,143 staff of younger adult care homes
- 24,572 domiciliary care staff
- 1,669 staff working in other settings
This is not available as a proportion of residents due to ongoing work with NHSEI and UKHSA to align booster rates across various groups in the population.
As data is self-reported by care providers, COVID-19 vaccination rates are affected by response rates. An overview of response rates is in the table below.
Table 1: percentage of providers that have provided data on the number of staff vaccinated at least once as of 26 October 2021
| Dose | Younger adult care home providers on behalf of their staff | Domiciliary care providers on behalf of their staff | Local authorities on behalf of staff working in other settings |
|---|---|---|---|
| Provided data on first dose | 98.2 | 94.8 | 98.0 |
| Provided data on second dose | 97.9 | 91.1 | 63.8 |
| Provided data on the booster dose | 57.5 | 34.9 | 14.5 |
Due to these response rates, the number of staff and residents, particularly for boosters, will be underestimated compared to the true value. For full response rates please see the accompanying ‘COVID-19 vaccination response rates, November 2021: data tables’.
There is regional variation for all staff groups in JCVI priority group 2, please see table 1 for further details.
Figure 2: percentage of staff who have received the first and second dose of the COVID-19 vaccination, cumulative rate, 15 December 2020 to 26 October 2021, England
Reported vaccination rates for all doses for JVCI priority group 2 social care staff continues to gradually increase.
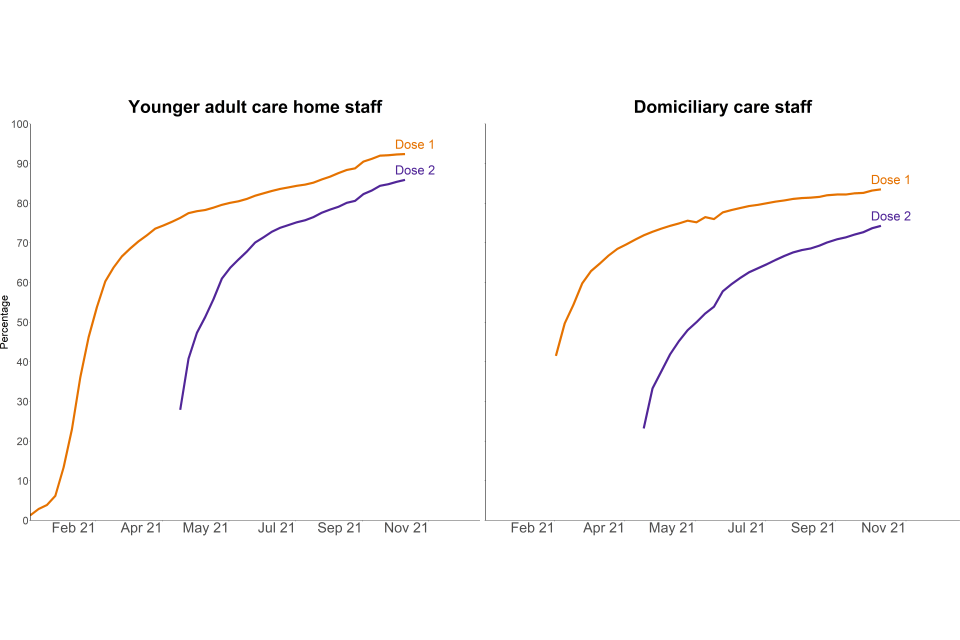
Source: Capacity Tracker
This data can be found in tables 6, 9 and 10 of the accompanying ‘COVID-vaccination’ tables in addition to data by region and local authority.
Notes:
- data collection for the second dose began on 20 April 2021
- data is self-reported from care providers
- based on date of reporting rather than date of vaccination
Table 2: percentage of staff in JCVI priority group 2 reported to have received the first and second doses of the COVID-19 vaccine, up to 26 October 2021 by region, England
| Region | Younger adult care home staff: dose 2 | Domiciliary care staff: dose 2 |
|---|---|---|
| East Midlands | 83.5 | 76.5 |
| East of England | 86.0 | 76.6 |
| London | 85.4 | 60.7 |
| North East | 93.0 | 82.1 |
| North West | 85.5 | 75.3 |
| South East | 84.3 | 77.2 |
| South West | 88.3 | 79.4 |
| West Midlands | 85.3 | 70.6 |
| Yorkshire and the Humber | 86.6 | 77.7 |
Note: data is not presented for other settings staff due to a data quality issue affecting data after 17 August.
COVID-19 vaccinations for residents of younger adult care homes
Residents of younger adult care homes are not part of a single priority group for the COVID-19 vaccine. However, the conditions for which they reside in care homes are likely to make them more vulnerable to COVID-19 and they are therefore likely to be part of priority groups 3 to 9.
As of 26 October 2021, in younger adult care homes:
- 93.4% of residents have reported to have received their first dose
- 90.8% of residents have reported to have received their second dose
Additionally, 8,636 residents have received a booster dose of the COVID-19 vaccine.
Flu vaccination in adult social care settings
The national influenza (flu) immunisation programme aims to provide direct protection to those who are at higher risk of influenza associated morbidity and mortality. Groups eligible for NHS influenza vaccination are based on the advice of the JCVI. More details can be found in the National flu immunisation programme 2021 to 2022 letter.
This report covers cumulative flu vaccination rates for the 2021 to 2022 season in the below adult social care groups:
- residents in older adult care homes
- staff directly employed by older adult care homes
- agency staff working in older adult care homes
- staff directly employed by younger adult care homes
- agency staff working in younger adult care homes
- domiciliary care staff registered to independent CQC providers
- social care staff working in other settings (including non-registered providers and local authority employed)
- residents of younger adult care homes
Guidance on flu vaccination for social care workers was updated on 9 September 2021. For more information, please see the background quality and methodology note.
Data is self-reported by care providers and local authorities, who may submit their resident and staff numbers but not the number receiving the flu vaccination, resulting in a lower reported percentage vaccinated. An overview of response rates for the numbers vaccinated is in the table below.
Table 3: percentage of providers that have provided data on the number of staff or residents who received a flu vaccination for the 2021 to 2022 season, as of 26 October 2021
| Older adult care home providers on behalf of their staff | Younger adult care home providers on behalf of their staff | Domiciliary care providers on behalf of their staff | Local authorities on behalf of staff working in other settings | |
|---|---|---|---|---|
| Percentage who provided flu data at least once | 76.6 | 57.8 | 31.9 | 10.5 |
For full response rates please see the accompanying ‘COVID-19 vaccination response rates, November 2021: data tables’.
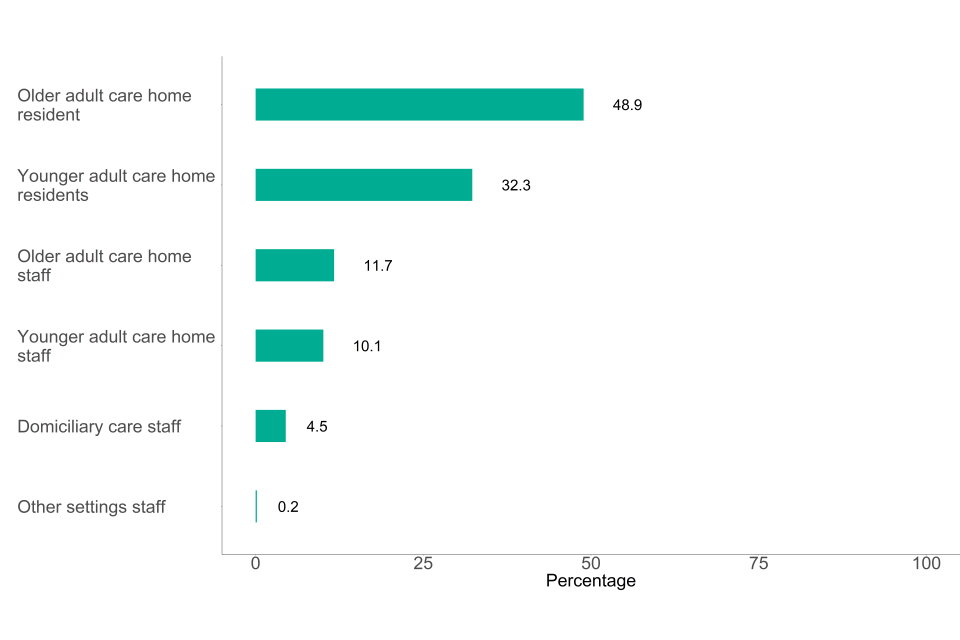
Older adult care homes
As of 26 October 2021, the proportions of those who have received a flu vaccination in older adult care homes were:
- 48.9% of residents
- 11.7% of all staff
Younger adult care homes
As of 26 October 2021, the proportions of those who have received a flu vaccination in younger adult care homes were:
- 32.3% of residents
- 10.1% of all staff
Domiciliary care staff and staff working in other settings
As of 26 October 2021, the proportions of staff who work in domiciliary care and other settings who have received a flu vaccination were:
- 4.5% of domiciliary care staff
- 0.2% of staff working in other settings
Figure 3: percentage of social care staff and residents who have received the flu vaccination, cumulative rate, 26 October 2021, England
The reported flu vaccination rates are highest among older adult care home residents.
There is regional variation in reported flu vaccination uptake among each of the adult social care groups. The variation is most pronounced among residents of older and younger adult care homes. Regional variation among all groups is summarised in table 4.
Table 4: percentage of each social care group reported to have received a flu vaccination up to 26 October 2021 by region, England
| Region | Older adult care home staff | Younger adult care homes staff: dose 1 | Younger adult care home staff | Younger adult care home residents | Domiciliary care staff | Other settings staff |
|---|---|---|---|---|---|---|
| East Midlands | 11.3 | 40.1 | 7.6 | 22.1 | 4.5 | 0.6 |
| East of England | 9.1 | 44.0 | 9.7 | 34.7 | 4.5 | [s] |
| London | 7.9 | 53.1 | 10.4 | 36.5 | 0.9 | [s] |
| North East | 14.6 | 65.2 | 18.6 | 37.2 | 6.8 | 1.7 |
| North West | 13.6 | 51.2 | 10.6 | 37.3 | 4.5 | [s] |
| South East | 10.9 | 45.4 | 7.5 | 28.4 | 5.7 | 0.2 |
| South West | 13.3 | 50.4 | 9.9 | 30.3 | 5.1 | [s] |
| West Midlands | 12.1 | 46.5 | 11.3 | 35.9 | 4.8 | 0.1 |
| Yorkshire and the Humber | 13.0 | 53.5 | 11.9 | 33.8 | 5.3 | 0.2 |
Note: Due to low counts for other settings’ staff, some figures have been suppressed and these are denoted with [s].
Infection prevention control measures
How the data can be used
This data can be used for:
- estimating the number and proportion of care homes that indicate they:
- are accommodating COVID-safe visits within the care homes in line with government guidance
- are paying full wages to the majority of their self-isolating staff
- restrict staff movement across settings
- monitoring trends over time
- comparisons across local authorities and regions in England
This data cannot be used for:
- estimating the number of visitors in care homes and their infection or vaccination status
- identifying the reasons for care home staff shortages and absences
- linking staff shortages and the number of positive cases among care home staff
- comparing with other countries of the UK
- linking staff movement across settings to positivity rates
The Adult Social Care Infection Control and Testing Fund provides funding from local authorities to ensure that infection prevention control (IPC) measures are in place to curb the spread of COVID-19. This publication provides data on how providers are implementing the following measures:
- limitation of staff movement across different social care settings
- accommodating COVID-19 safe visitation in care homes in line with government guidance
- payment of full wages when care home staff are isolating due to COVID-19
More details on the data collection, coverage and quality of this data can be found in the ‘About this data’ section below.
Accommodating COVID-safe visitation in care homes
The guidance on allowing care home residents to have visitors has changed since December 2020 which is summarised in the table below.
Table 5: visiting guidance since December 2020
| Date | Guidance |
|---|---|
| 19 July 2021 to present | No limits on the number of named visitors, with testing and guidance to support safe visiting in place |
| 17 May 2021 to 18 July 2021 | Residents are permitted to have 5 named visitors for regular visits with testing in place |
| 12 April 2021 to 16 May 2021 | Residents are permitted to have 2 named visitors for regular visits with testing in place |
| 8 March 2021 to 11 April 2021 | Residents are permitted to have 1 named visitor for indoor visits with testing in place |
| 6 January 2021 to 7 March 2021 | No indoor visits permitted due to the national lockdown |
| 1 December 2020 to 5 January 2021 | Indoor visits permitted with testing in place (from 19 December 2020 – no indoor visits permitted in tier 4 areas) |
More information can be found in the guidance on care home visiting. This report covers care homes that are accommodating visitation in line with this guidance. This could cover visitation in the care homes premises, either indoors or outdoors, or also visits off premises, either for the day or overnight.
In the week ending 26 October 2021:
- 92.6% of care homes in England were able to accommodate residents receiving visitors within care homes in all circumstances. This proportion has remained broadly consistent since late July 2021
- a further 3.5% were able to accommodate visits in exceptional circumstances. Exceptional circumstances are individually defined by each care home but are generally thought to be considered when residents are palliative
- there is regional variation with 94.7% of care homes accommodating visitors in the East of England in comparison to 88.8% in the South West
Figure 4: percentage of care homes accommodating or limiting visits for residents, 15 December 2020 to 26 October 2021, England
The proportion of care homes accommodating visiting for residents has remained stable since the end of July.
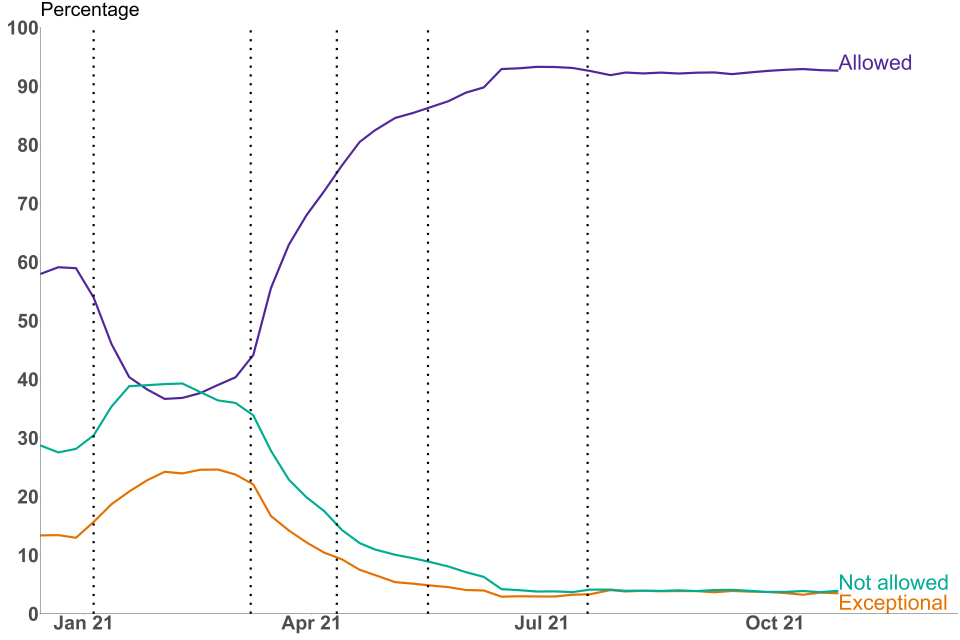
Source: Capacity Tracker
This data can be found in table 1 of the accompanying ‘Infection control, PPE and staffing level statistics’ tables in addition to data by region and local authority.
Payment of care home directly employed staff while self-isolating due to COVID-19
The infection control funds can be used to ensure staff who are self-isolating along with government guidance are paid their full wages. This includes:
-
staff isolating while waiting for a test
-
isolating after having tested positive or after a positive test in their household
-
staff required to quarantine prior to receiving certain NHS procedures
For more information see stay at home: guidance for households with possible or confirmed coronavirus (COVID-19) infection.
Employers who do not pay their staff their full wages while self-isolating must pay their staff at least Statutory Sick Pay (SSP) when the employee meets the following criteria:
- is classed as an employee and has done some work for their employer
- earns an average of at least £120 per week
- has been ill or is self-isolating for at least 4 days in a row (including non-working days)
Care home staff who do not meet the criteria may not be eligible and as a result not paid to self-isolate. For more information, please see guidance on Statutory Sick Pay.
The figures in this report refer to care homes which had staff required to self-isolate in the relevant week. This means care homes who had no staff needing to self-isolate will be excluded from the rates for the relevant week. There may be several care providers who may use a combination of payment options for staff wages. In these situations, providers should report the option they use for the majority of their staff.
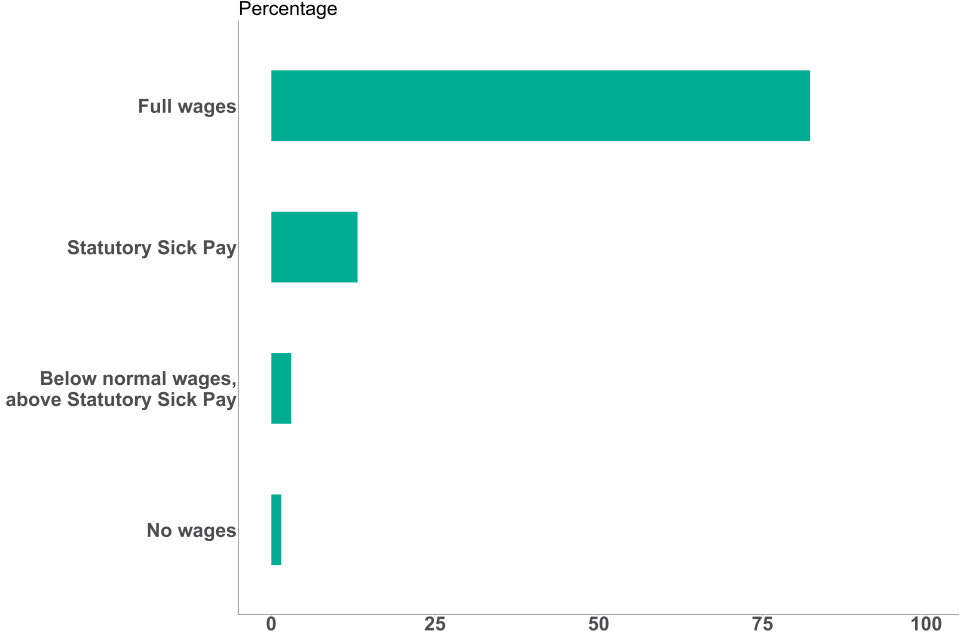
In the week ending 26 October 2021:
- 82.3% of care homes who had directly employed staff needing to self-isolate paid staff their full wages. This proportion has remained consistent since mid-December
- there is substantial regional variation with 88.8% of providers in the North West paying their staff full wages compared to 78.0% in the East Midlands and Yorkshire and The Humber
Figure 5: percentage of care homes with staff self-isolating by wages paid, week ending 26 October 2021, England
More than 8 in 10 care homes were reporting to pay their staff full wages when self-isolating.
Source: Capacity Tracker
This data can be found in table 2 of the accompanying ‘Infection control, PPE and staffing level statistics’ tables in addition to data by region and local authority.
Limiting staff movement between care settings
Infection control funding can be used to reduce the need for staff movement between social care settings to limit the spread of infection, for example they can be used to recruit additional staff to enable staff to only work across one care home.
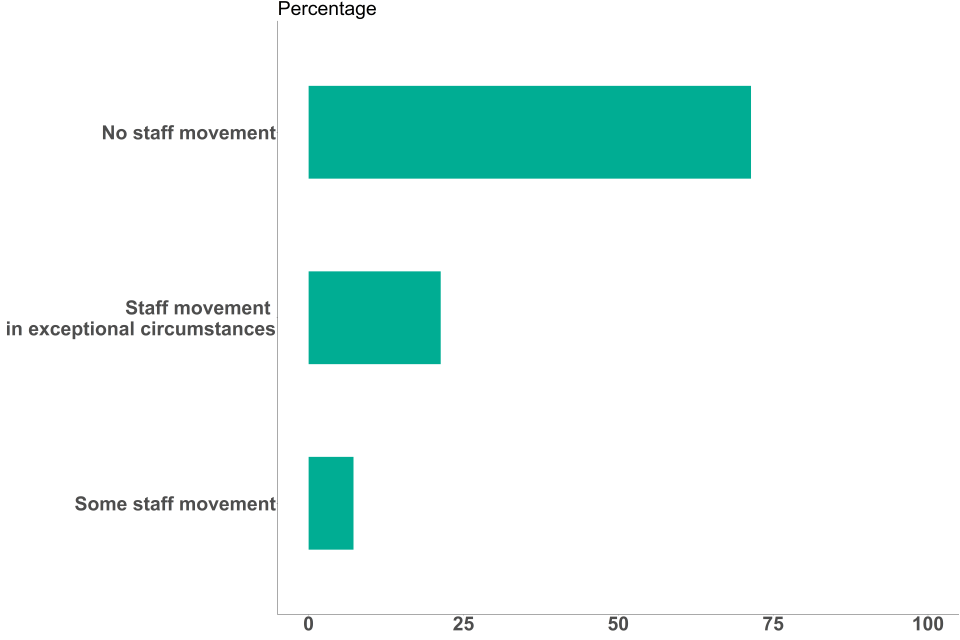
In the week ending 26 October 2021:
- 71.4% of care homes had no staff members working in another social care setting, this proportion has been steadily declining since late April 2021 when this proportion was 78.2%
- 7.2% of care homes had some staff additionally working in another health or social care setting
- a further 21.3% of care homes had some staff additionally working in another health or social care setting due to exceptional circumstances. This number has been increasing steadily since mid-May. Exceptional circumstances are defined as the care home having exhausted all other reasonable steps to ensure there are sufficient staffing levels
- there is substantial regional variation with 79.5% of providers in the North East having no staff working in another health or social care setting in the week ending 26 October 2021, in comparison to 66.2% in London
Figure 6: percentage of care homes by staff working across additional health or social care settings, week ending 26 October 2021, England
Seven in 10 care homes reported having no staff working across another health or social care setting.
Source: Capacity Tracker
This data can be found in table 3 of the accompanying ‘Infection control, PPE and staffing level statistics’ tables in addition to data by region and local authority.
Care home staffing levels
In order to measure the workforce pressures on providers during the pandemic, each provider is asked to assess their workforce pressures based on their agreed staffing ratios.
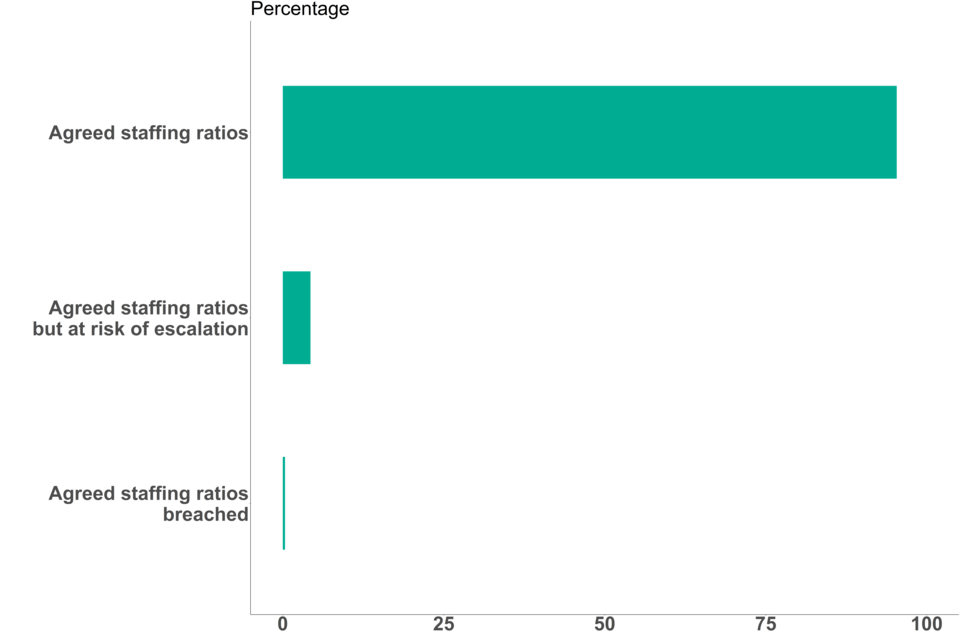
In the week ending 26 October 2021:
- 0.4% of providers flagged that their agreed staffing ratios had been breached
- 4.3% flagged that they were operating within the agreed staffing ratios but there is a significant risk of escalation in the coming days
- 95.3% were operating within their agreed staffing ratios. This has remained broadly consistent since mid-December 2020
If a care home’s staffing ratio has been breached, then business continuity measures may be put in place.
Figure 7: percentage of care homes operating within agreed staffing ratios, week ending 26 October 2021, England
More than 9 in 10 care homes report operating within their agreed staffing ratios.
Source: Capacity Tracker
This data can be found in table 4 of the accompanying ‘Infection control, PPE and staffing level statistics’ tables in addition to data by region and local authority.
PPE availability in care settings
How the data can be used
This data can be used for:
-
estimating the number and proportion of care homes and domiciliary care providers who are experiencing PPE shortages in the next 48 hours, and comparing across local authorities and regions in England
-
monitoring trends over time
This data cannot be used for:
- predicting PPE shortages in the coming weeks
- comparing with other countries of the UK
- linking PPE shortage to positivity rates
All care homes and domiciliary care providers are responsible for ensuring safe systems of work and have duties concerning the provision and use of PPE in the workplace.
This publication covers the availability of the following 5 items of PPE:
-
aprons
-
eye protection
-
gloves
-
hand sanitiser
-
face masks
In care homes
Guidance on what PPE should be used in various circumstances is available from personal protective equipment (PPE): resource for care workers working in care homes during sustained COVID-19 transmission in England. Despite most legal restrictions being lifted on 19 July 2021, PPE and other infection prevention and control measures are expected to continue to be practised in care homes.
In the week ending 26 October 2021:
- 0.2% of care homes in England had either no supply or were expecting to experience a shortage in the next 48 hours of at least one item of PPE.
- this has been gradually decreasing since late September 2020 when 1.1% of care homes were experiencing a shortage
COVID-19 testing in adult care homes
How the data can be used
This data can be used for:
- estimating the number of PCR and LFD tests taken and positive results returned in care homes, and comparing across local authorities and regions in England
- estimating trends in prevalence and positivity rates for COVID-19 in care homes based on trends in positive tests
This data cannot be used for:
- calculating positivity rates for COVID-19 in care homes due to routine and repeat testing of individuals
- linking positivity rates in care homes to lower vaccination rates in care homes
- estimating the number of people tested and positive cases in care homes as people can take more than one test
For more information on:
- the rollout of the testing programme in care homes, please see ‘About this data’ section below.
- testing kits used, please see the ‘Terminology’ section below
Number of tests conducted and positive tests returned in adult care homes
The number of positive tests in care home staff and residents has increased throughout October compared to the decrease seen throughout September.
Throughout October, the number of PCR and LFD tests conducted has slightly decreased for care home staff compared to levels seen in September but have remained broadly consistent in care home residents.
Given that anyone who tests positive with a PCR test is exempt from regular testing for 90 days, the number of tests conducted with both PCR and LFD kits can fluctuate slightly in relation to COVID-19 prevalence.
Care home staff
PCR tests
In the week ending 26 October 2021 there were:
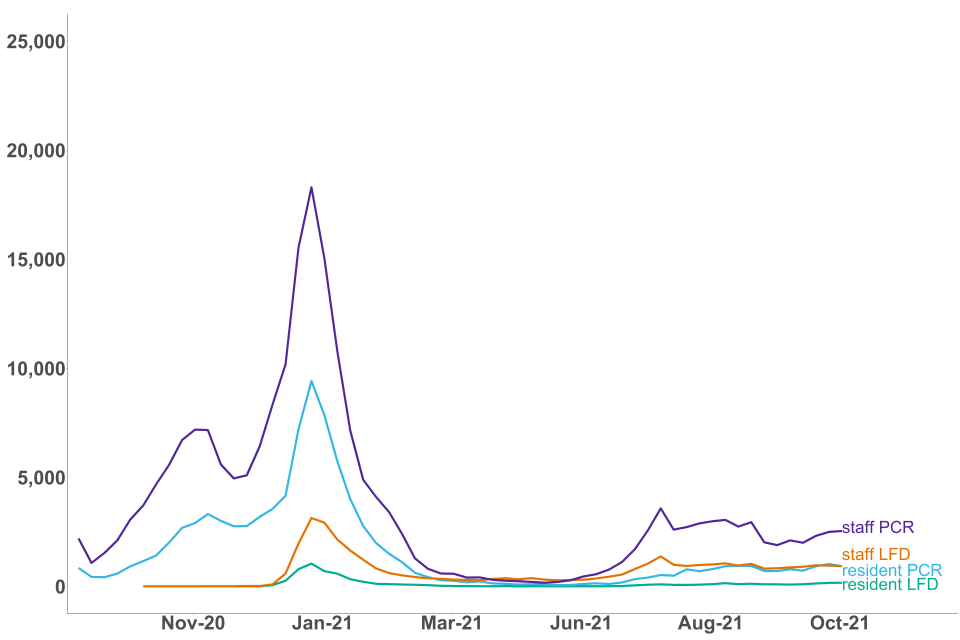
- 2,542 positive tests returned from PCR kits in care home staff
- 20% more positive tests compared to the week ending 28 September 2021 and 29% fewer compared to the week ending 20 July 2021
The number of positive tests followed a downward trend from the end of July to the end of September. Since then, the number of positive PCR tests has increased throughout October. The number of positive tests seen throughout May to October 2021 remains substantially lower than the numbers seen in mid-January when there were 18,296 positive tests returned from PCR tests in the week ending 12 January 2021.
The number of PCR tests conducted in care home staff has broadly decreased between the end of July and the end of October. There were 367,234 PCR tests conducted in the week ending 26 October 2021 compared to 407,671 in the week ending 20 July 2021.
LFD tests
In the week ending 26 October 2021 there were:
- 930 positive tests returned from LFD kits in care home staff
- 7% more positive tests compared to the week ending 28 September 2021
The number of positive LFD tests returned has decreased overall since the end of July when there were 1,378 positive tests.
The number of positive tests seen throughout summer 2021 up to the end of October are still substantially lower than the numbers seen in mid-January when there were 3,137 positive tests returned from LFD tests in the week ending 12 January 2021.
There has also been a gradual decline in the number of LFD tests conducted in care home staff since late July. There were 426,624 LFD tests conducted among care home staff in the week ending 26 October 2021 compared to 509,467 in the week ending 20 July 2021.
Care home residents
PCR tests
In the week ending 26 October 2021 there were:
- 921 positive tests returned from PCR kits in care home residents
- 17% more positive tests compared to the week ending 28 September 2021
Previously, the number of positive tests had increased from May until the end of August but had decreased throughout September. There was an increase in positive tests throughout October compared to September.
The number of positive tests seen throughout summer 2021 up to October 2021 are still substantially lower than the numbers seen in mid-January when there were 9,414 positive tests returned from PCR tests in the week ending 12 January 2021.
There were 100,630 PCR tests conducted among care home residents in the week ending 26 October 2021 and this number has been broadly consistent since early August 2021. Previously the number of tests had gradually increased between mid-May and the beginning of August.
LFD tests
In the week ending 26 October 2021 there were:
- 169 positive tests returned from LFD kits in care home residents
- the number of positive LFD tests has increased throughout October with almost double the number of positive tests in the week ending 26 October compared to the week ending 28 September 2021. Previously the number of positive tests had increased between the end of June and end of August, before decreasing throughout September
This is substantially lower than the numbers seen in mid-January when there were 1,047 positive tests returned from LFD tests in the week ending 12 January 2021.
There were more LFD tests conducted in the week ending 26 October compared to the end of September, with 16,810 tests in the week ending 26 October compared to 15,651 tests in the week ending 28 September.
The testing regime for staff is more frequent than for residents. As a result, the total number of staff tests is higher than the total number of resident tests. For more information please see ‘About this data’.
Visitors
The number of LFD tests conducted among visitors to care homes has been broadly consistent since the end of June with 91,693 tests conducted in the week ending 26 October 2021.
Following the change in guidance for residents receiving visitors in early March, LFD tests conducted among visitors to residents of care homes increased substantially throughout the month, then continued to gradually increase until the end of June 2021.
Additionally, there were 8,075 LFD tests conducted among visiting professionals to care homes in the week ending 26 October 2021. This declined steadily since mid-June up until the end of August but has since remained fairly stable with an average of around 8,200 tests from beginning of September to the end of October 2021.
In the week ending 26 October 2021 there were:
- 41 positive PCR tests returned in care home visitors and 85 LFD positive results
- 12 positive LFD tests returned among visiting professionals to care homes
Figure 8: number of tests conducted in care home staff and residents, 15 December 2020 to 26 October 2021, England
The number of tests conducted in care home staff has declined compared to late July.
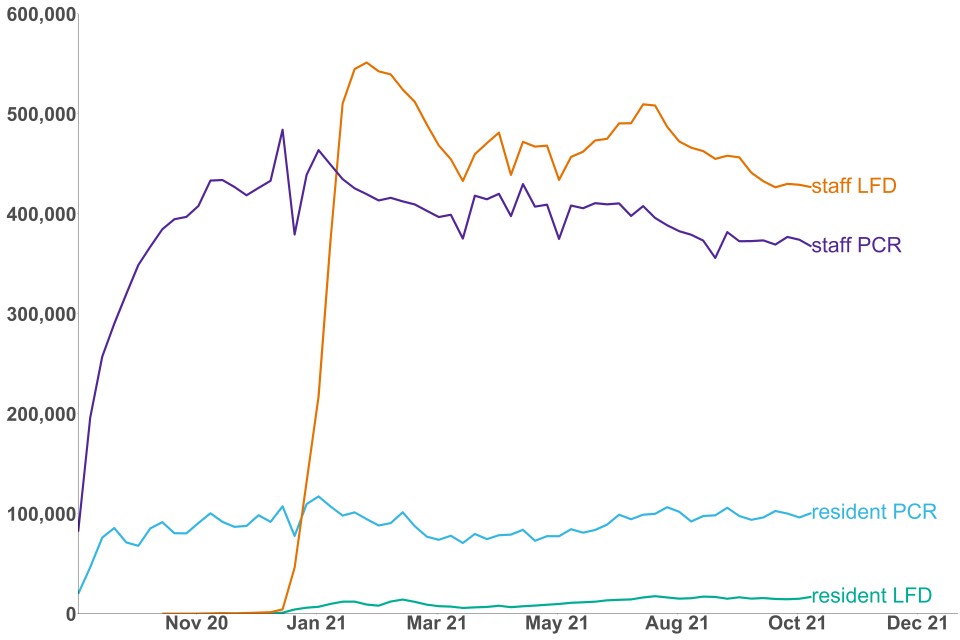
Source: NHS Test and Trace
This data can be found in tables 1 and 2 of the accompanying ‘COVID-19 testing’ tables in addition to data by region and local authority.
Figure 9: number of positive test results in care home staff and residents, 2 September 2020 to 26 October 2021, England
The number of positive test results returned in care home staff have slightly increased, and for residents have remained stable during October.
Source: NHS Test and Trace
This data can be found in tables 1 and 2 of the accompanying ‘COVID-19 testing’ tables in addition to data by region and local authority.
Staff and residents have different testing regimes as outlined in the ‘About this data’ section below. As a result, the number of positive test results returned are expected to be of a different scale between staff and residents.
Terminology
Care home: facilities providing residential care. The data in this bulletin refers to Care Quality Commission (CQC) registered care homes.
Older adult care homes: care homes serving any older people (aged 65 and over) as identified from the latest CQC data on care homes in the ‘older people service’ user band. A small number of residents within care homes serving older people may be aged under 65.
Younger adult care homes: care homes not serving any older people (aged 65 and over) as identified from the latest CQC data on care homes in the ‘older people service’ user band.
Domiciliary care: services providing personal care for people living in their own homes. The data in this bulletin refers to domiciliary staff employed by independent CQC registered providers.
Staff: unless specified, staff can refer to staff directly employed by a provider and/or through an agency.
Staff employed by other settings: this includes non-registered providers and local authority employed: all other eligible frontline social care staff working in close and personal contact with people clinically vulnerable to COVID-19 (as defined by the Joint Committee on Vaccination and Immunisation (JCVI) priority groups) who need care and support irrespective of where they work or who they are employed by, for example, local government, NHS, private sector or third sector.
Agreed staffing ratios: the agreed number of residents for any given member of staff. This is determined by individual providers to ensure there is safe levels of staffing for care to be delivered. This can be subject to inspection by the CQC. See Regulation of staffing for more information.
PCR (polymerase chain reaction) tests: PCR tests check for the genetic material of the coronavirus in the sample, which is taken using a swab and is processed in a lab via a polymerase chain reaction (PCR). These are predominantly used in care homes for people who experience symptoms, and for routine asymptomatic testing for staff and residents.
LFD (lateral flow device): often referred to as ‘rapid tests’, these test for the presence of proteins called ‘antigens’ which are produced by the virus. They are swab tests that give results in 30 minutes or less, without the need for processing in a laboratory. These tests are primarily used in care homes for routine asymptomatic testing for staff, residents and visitors.
PPE (personal protective equipment): equipment worn by staff, visitors or essential care-givers in care homes to reduce transmission of COVID-19. This publication refers to supplies of aprons, eye protection, gloves, hand sanitiser and face masks in care homes.
About this data
These statistics are being published as a part of a wider landscape of statistics on adult social care. The Government Statistical Service (GSS) compiles a UK adult social care database of official statistics on adult social care across the 4 nations of the UK. This is updated on a monthly basis.
The UK Statistics Authority (UKSA) conducted a review of adult social care statistics in England which called for:
-
better leadership and collaboration across different organisations publishing official statistics. This publication has been produced in collaboration with other statistics providers of COVID-19 adult social care data and DHSC will endeavour to work with various stakeholders as more data is published through this publication
-
addressing of gaps in available data, particularly in privately funded care. This bulletin aims to plug some of that gap by including data on residents privately funding their care in addition to those funded by local authorities
-
improving existing official statistics. These statistics are being badged as experimental statistics and more data will be added iteratively based on user needs
Other sources of adult social care COVID-19 data
COVID-19 vaccinations
NHS England and Improvement (NHSEI) also publish data on vaccinations in adult social care settings as part of their broader statistical release on COVID-19 vaccination, using the same methodology and the same data source as this publication but there are differences in the:
-
reporting period; data in this publication reports data collected up to 11:59pm on a Tuesday whereas NHSEI use data collected up to 11:59pm on a Sunday
-
a small amount of data may be collected after the respective reporting periods
-
regional breakdowns; data in this publication uses the administrative regions of England and NHSEI use NHS regions
COVID-19 testing
DHSC also publishes care home testing data in the weekly NHS Test and Trace statistics (England) at national level. This publication uses the same data source but has a different methodology for presenting testing in care homes and differences in the figures will occur due to the following reasons:
-
differences in which tests from different routes are included. Both methodologies include the number of tests registered from kits sent directly to care homes, but this publication additionally includes care home staff or residents tested via other routes such as regional or local test sites. As a result, figures in this report will be substantially higher for PCR tests conducted in care home staff due to the current guidance recommending staff with symptoms to be tested outside of the care home (see coronavirus (COVID-19) testing in adult care homes for more information)
-
different reporting periods. This publication uses the start time of the test in comparison to the Test and Trace statistics which use the date on which the test result was received by the individual taking the test
-
different times of extracting the data
For more details on the NHS Test and Trace programme and the statistics please see the NHS Test and Trace methodology document.
Data sources
COVID-19 vaccination, infection prevention control (IPC), PPE availability and staffing levels
Data in this publication is taken from self-reported data submitted by care providers in England through a data collection and insight tool called Capacity Tracker.
Care providers are expected to submit data on IPC compliance on a weekly basis whilst data on vaccinations, PPE availability and staffing levels is expected to be updated on a daily basis.
Infection control data for each reporting week refers to data up to 2pm on the date stated as the ‘week ending’ and the 7 days prior. For PPE and staffing-levels data relates up to 11:59pm on the date stated as the ‘week ending’. The reporting week usually ends on a Tuesday but occasionally no data is available for this date, in these situations the ‘week ending’ date will be the nearest available date.
This bulletin presents the proportion of staff and residents vaccinated out of the total number of staff and residents as self-reported by care providers. Only individuals who have not tested positive for COVID-19 in the last 28 days are eligible to receive the vaccine. Data on the number of staff and residents of older adult care homes eligible for the vaccination over time can be found in the accompanying COVID-19 vaccination tables.
For more information, please see the ‘Data Sources’ section of the accompanying background quality and methodology note.
COVID-19 testing data
Testing data is collected from management information generated during the operation of the NHS Test and Trace service.
For more information, please see the ‘Data Sources’ section of the accompanying background quality and methodology note.
Data coverage and quality
All data in this publication refers to adult social care settings in England only.
Data submitted by providers reflects the current priorities to monitor the COVID-19 pandemic in social care settings. Data collection could be subject to change based on changes to the priorities and therefore the reporting in this publication will be adapted accordingly.
IPC, PPE availability and staffing levels
Providers are expected to submit data on IPC measures on a weekly basis while staffing levels and PPE availability data are expected to be submitted on a daily basis. Any providers who have not submitted data within the last 7 days are excluded from the relevant analysis for the associated time period where no response was received. The full response rates for all data points are available in the accompanying tables.
COVID-19 vaccinations
Data on total number of staff and residents as well as those vaccinated is self-reported by care providers and local authorities. Providers are expected to update their vaccination data on a daily basis. There may be a time lag between individuals receiving the vaccine and the week they are reported in the statistics depending on when providers have updated their vaccination data.
COVID-19 testing
This report includes the number of tests conducted on care homes residents, staff and visitors who were tested by:
-
PCR and LFD kits sent directly to the care home for regular testing, which were registered through the National Testing Programme digital infrastructure
-
PCR and LFD kits conducted at another testing site such as a regional or local test site or a mobile testing unit or tests that were registered
The figures in this report are only deduplicated to report on the number of individual tests taken, not the number of people tested. Because people can have more than one test, the data should not be compared with prevalence rates or case positivity rates.
This report does not contain data on those tested through pillar 1.
Data for each reporting period relates to the day an individual took their test.
The rollout of the testing program in care homes is summarised in the table 3 below.
Table 6: testing guidance in care homes
| Dates | Frequency | Test kit | |
|---|---|---|---|
| Care home residents | 7 June 2020 to present | Monthly In the event of an outbreak: day 1 and between days 4 to 7 |
PCR |
| Care home residents | 22 February 2021 to present | In the event of an outbreak: day 1 and between days 4 to 7 at health protection team discretion | LFD |
| Care home staff | 7 June 2020 to present | Weekly In the event of an outbreak: day 1 and between days 4 to 7 |
PCR |
| Care home staff | 23 December 2020 to present | Twice a week In the event of a positive case: daily until 5 days without a positive | LFD |
| Care home indoor visitors | 8 March 2021 to present | Weekly – essential care givers | PCR |
| Care home indoor visitors | 8 March 2021 to present | Twice weekly – essential care givers | LFD |
| Care home indoor visitors | 2 December 2020 to present* | On visit | LFD |
| Care home visiting professionals – CQC inspectors | 14 December 2020 to present | Weekly | PCR |
| Care home visiting professionals – CQC inspectors | 22 December 2020 to present | Before visit | LFD |
| Care home visiting professionals – all other professionals | 14 December 2020 to present | On arrival, unless part of a regular testing regime and can provide proof of a negative result within 72 hours | LFD |
*Close contact visits with LFD testing began on 2 December 2020 but ceased on 6 January 2021 because of the national lockdown. Throughout the period of national restrictions, visits were limited to outdoors, in visiting pods, or with a substantial screen; as well as those in exceptional circumstances such as end of life.
The figures in this report are only deduplicated to report on the number of individual tests taken, not the number of people tested. Because people can have more than one test, the data should not be compared with prevalence rates or case positivity rates.
Revisions
Any revisions to past publications will be in line with DHSC’s revision policy and highlighted in future publications accordingly.
Future developments
We plan to add new statistics to this publication to support user needs. Over the coming months, we will explore the feasibility of publishing the following statistics:
- staffing levels and testing in domiciliary care settings
- other non-COVID-19 related adult social care data
Feedback
For feedback and any further questions, please contact asc.statistics@dhsc.gov.uk.