Annex B – DWP evidence pack
Updated 15 July 2026

© Crown copyright 2026
This publication is licensed under the terms of the Open Government Licence v3.0 except where otherwise stated. To view this licence, visit nationalarchives.gov.uk/doc/open-government-licence/version/3 or write to the Information Policy Team, The National Archives, Kew, London TW9 4DU, or email: psi@nationalarchives.gov.uk.
Where we have identified any third party copyright information you will need to obtain permission from the copyright holders concerned.
This publication is available at https://www.gov.uk/government/publications/timms-review-of-personal-independence-payment-interim-report/annex-b-dwp-evidence-pack
Context
The Department for Work and Pensions (DWP) is committed to ensuring that our policies are informed by robust, inclusive, and transparent evidence. This document brings together a wide range of internal and external analysis and research into a single place. It aims to provide a broad evidence base to support exploration into the issues faced by disabled people and the Personal Independence Payment (PIP) system and a basis for policymaking that ensure that PIP is fit and fair for the future.
The first part of this pack covers historical trends in the prevalence of disability nationally, trends in the benefit caseload, trends in cost of providing disability benefits, and an exploration of the factors driving these trends. The latter part focuses on PIP more specifically, covering customer satisfaction within the current service, the public perception of PIP and other disability benefits, and insights into the impact that receiving support from PIP has on disabled people’s lives.
The PIP landscape is constantly changing, and there are elements that are relatively unexplored. Some research is in progress as we write, and in several chapters we identify areas for further work. Some of these may have been investigated in the past, but not to an extent to provide a sufficiently rounded picture, others are work in progress, some are for the future. Data capability – including cross-government linked data – is also constantly evolving, creating new opportunities. Given all this, this document does not provide a comprehensive view of PIP evidence.
In interpreting all this information, it is important to recognise the limitations of the research and analysis too. While PIP data from DWP administrative systems involves comprehensive coverage of claimants, the information included is limited to a subset of that necessary for benefit administration. Conversely, while research and survey data sources provide richer information in many areas, we always need to be mindful of the effect of limited sample sizes, and also that those who do not respond to surveys or research are likely to be different to those who do – in ways that we cannot control for.
The analysis was assembled over 9 months. Specific research projects reflect the time they were undertaken, though we note where significant deviations from their findings are likely to have occurred in the period since. Analysis may not use the most recent data, but this simplification is not viewed as materially altering the picture painted, even if the exact numbers would now be slightly different.
We recognise that DWP does not have a monopoly of wisdom on research and analysis related to disabled people and PIP, and while we endeavour to keep abreast of wider research and analysis on these topics, we cannot be aware of everything of relevance. This pack is intended as a starting point for the steering group to interrogate, to which they can add new sources of research and analysis, and identify areas for further evidence gathering. Wider readers can also point us towards additional relevant evidence. Constructive feedback is welcome.
Shaun Butcher
Lead Analyst, Disability Benefits and the Health Transformation Programme
Executive summary
Introduction
PIP and Disability Living Allowance (DLA) are intended to provide a contribution towards the extra costs faced by disabled people. These extra costs are simply the costs that disabled people or people with health conditions need to spend which non-disabled people do not, as a result of their condition or conditions. Such costs can be one-off, such as installing a stair lift, or recurring costs, such as increased spending on heating. They can be thought of in 3 broad categories:
- disability-specialised goods and services, that non-disabled people would not need to buy
- greater use of common goods and services, such as heating to a higher temperature or for longer, or greater use of taxis to get around
- higher costs for common goods and services, such as insurance or housing as it needs to be accessible
In financial year ending (FYE) 2026, estimated DWP expenditure on working age people receiving these benefits was £25 billion – mostly PIP, covering 3.2 million people, with around 144,000 still on DLA.
In addition to benefits that directly support disabled people, Carer’s Allowance (CA) or the Universal Credit Carer Element (UC CE) is available to individuals that provide at least 35 hours of care a week for someone in receipt of certain rates of DLA, PIP or Attendance Allowance (AA – only available to disabled people above state pension age). For working age PIP/DLA recipients, around a quarter have someone who receives CA or the UC CE for caring for them.
Health and disability benefits also provide access to passported benefits, such as free prescriptions and support from local authorities with travel and parking. They may also give access to discounts or priority services from private businesses.
Trends in disability
Disability in the population is measured through various surveys, meaning that disability is self-reported rather than clinically assessed. The different surveys have had various approaches to measuring disability over time, as society’s understanding of the impacts of health conditions has evolved and legal definitions have changed. Most sources are not primarily focused on disability measurement and therefore are only able to devote a few questions to the subject.
Most sources show an upward trend in self-reported disability among the working age population, and that this upward trend steepened around the time of the COVID-19 pandemic. Within this, the share being accounted for by mental health conditions has increased, from around one-third of working age people reporting a mental health condition as a primary or secondary condition in FYE 2014 to almost 45% 10 years later. Neurodevelopmental conditions have also become more prominent.
Reasons for this increase in self-reported disability are likely to include:
- demographic change, as the working age population gets, on average, older
- increasing prevalence of ill-health in the population for a given age and sex
- increasing recognition of conditions that have always been present, but have not been acknowledged so much in the past – particularly mental health and neurodevelopmental conditions
- external influences on the likelihood of survey respondents identifying as disabled, including the structure and incentives within the benefit system
While the effect of demographic change can reasonably be estimated, the other 3 factors are impossible to disentangle, so it is not possible to determine whether they all account for substantial proportions of the change, or whether one or two are dominant, with the others relatively minor.
Trends in working age disability benefits
The number of recipients of, and expenditure on, working age disability benefits has been increasing continuously since their inception in the 1970s. While there was a steady increase in receipt of DLA and PIP among working age people during the 2010s, in part due to increases in state pension age, there has been a noticeable increase in growth during the 2020s so far and this is expected to continue for at least the next few years, and most likely beyond. Though there is some degree of uncertainty in the forecasts, because so few people leave disability benefits, even with quite large reductions in new awards to PIP, there would still be considerable growth in caseload and spending over the next few years. Experience of the last few years also shows that reality could turn out to be higher than currently forecast: PIP has been difficult to forecast since its introduction, in large part as a new benefit takes a fairly long time to reach a steady-state.
PIP and DLA expenditure has not just increased in nominal and real terms (after taking out the effect of inflation), but also faster than the economy and total government expenditure. Receipt among working age people has risen faster than the population overall, and the disabled population.
Within this, there has been faster growth in receipt among women and among young people, and among people reporting mental health or neurodevelopmental conditions as their primary condition. That said, people nearing state pension age are still much more likely to receive a disability benefit than younger adults.
The increasing growth of the caseload in recent years can be attributed both to a steep rise in new claims and awards, starting after the pandemic, but also due to a reducing likelihood of people leaving benefit, in part influenced by a shortage of assessment capacity for reviewing claims. The number of new claims has levelled off since mid-2024 and have reduced a little since spring 2025, but however long this trend lasts, the low rate of leaving PIP means this stabilisation of claim volumes has a relatively small impact on forecast caseloads and spending.
Factors influencing increased claims and expenditure
There are many plausible influences on the increase in claims since the pandemic, some with more evidence in support of them than others, but attributing relative importance to each of the factors has not yet been done, if it is even possible to do so.
The factors influencing the prevalence of disability noted above will also be important drivers of the increases in disability benefit receipt. Demographic change has a slow and steady impact on claims over the long-term and cannot explain the increased growth since the pandemic. The other factors are likely to influence both long-term trends and the rapid rise in claims since the pandemic.
The main factors are considered, by several different organisations, to include:
- higher disability prevalence in the working age population, likely to have been accelerated by:
- direct health impacts of the COVID-19 virus – although few people report long-COVID as their primary condition in PIP, it could be a secondary condition and/or exacerbate other conditions
- indirect impacts of the COVID-19 pandemic and associated lockdowns on physical health (through reduced activity) and mental health (through reduced social interaction and increased anxiety)
- greater medical recognition of certain conditions, including neurodevelopmental and mental health conditions
- greater recognition and awareness of disability in the wider population
- the impact of health changes may have been exacerbated by NHS capacity struggling to keep up with demand since the pandemic (leading to longer waiting lists for treatment) – however, the Office for Budget Responsibility (OBR) and IFS both suggest that this impact on working age disability benefit receipt is likely to be small
- cost of living pressures may have increased the (real and perceived) financial need to claim benefits – people may be signposted to disability benefits as a result of seeking advice on general money worries
- more general improved awareness of disability benefits, including through improved signposting from other DWP activities
- incentives in the benefit system that can encourage people to claim health-related benefits, reflected in changes in labour market behaviour, with large increases in the number of economically inactive people reporting long-term sickness or disability as their main reason (the majority of whom were already out of work). Although PIP is available in and out of work, it is likely to enable some people to maintain a certain standard of living without needing to work
When translated into spending, the rise in caseload is amplified by a higher proportion of people being entitled to the higher rates of the benefit.
Characteristics of current claimants
Age and gender
The likelihood of receipt of PIP or DLA among working age people mostly rises steadily with age, from around 5% of the population in their twenties to over 12% for those aged 60 to 64. The exception to this profile is for 16 to 19 year olds who are more likely to receive PIP or DLA than those in their twenties.
Overall, women are more likely to receive a disability benefit than men, though this gap only emerges from those in their thirties onwards; among the under 30s, men are more likely to receive PIP or DLA than women.
Health conditions
Although it is common for people to have more than one health condition, PIP analytical data currently limits analysis to the primary condition. This means that caution should be applied when considering the primary medical condition, as claimants may have other conditions which impact their daily living and/or mobility.
The primary reported condition among PIP and DLA claimants also changes significantly with age. At younger ages, neurodevelopmental conditions dominate – over half of 16 to 19 year olds report autism or ADHD as their primary condition – whilst at older ages, musculoskeletal conditions are much more common, with over 40% of 60 to 64 year olds having these as their primary condition – arthritis and back pain being the main ones within this grouping. The prevalence of anxiety and depression, as the most common grouping of mental health conditions, increases with age up until the early fifties, falling back slightly thereafter. The share of claimants with anxiety or depression as their primary conditions peaks for those in their thirties, after which the growing importance of other conditions reduces their share.
Geographical differences
Almost 8% of working age people in England and Wales receive PIP or DLA. Receipt is highest in Wales and the North East of England, with the North West, Yorkshire and the Midlands above average. Working age people living in London, the South East, South West and Eastern England have a lower-than-average likelihood of receiving PIP or DLA. At a more localised level, the highest rates of receipt of PIP or DLA tend to be seen in the South Wales valleys, some seaside towns, and northern urban areas, particularly around Liverpool, the Tyne, Wear and Tees. The lowest rates tend to be seen in affluent areas of the South East and East, especially those close to London.
Employment
About 20% of PIP claimants are in employment, although, at the point of award, over 40% are employed, and this proportion has increased steadily from around 30% in 2016. The longer someone is receiving PIP, the less likely they are to be in employment.
Other characteristics
There is limited information on ethnicity of PIP and DLA claimants, as ethnicity is not relevant to eligibility to either benefit. However, the Family Resources Survey shows that all ethnic minority groups have a lower likelihood of receiving PIP than average, with the exception of benefit units with a Pakistani head, who have an average likelihood of claiming. This could be in part down to a different age structure, or variations in the geographical location of different ethnic minority groups.
‘Benefit units’ are defined on the DWP Stat-Xplore site. Where ethnicity at family/benefit unit level is assigned using the head of the family/benefit unit, Stat-Xplore metadata defines this as the Household Reference Person where they belong to the benefit unit, or otherwise the first person from that benefit unit named in the interview.
Almost all PIP recipients receive the daily living component, with the majority receiving a mobility award, although this is more variable by age. Younger people have the highest proportion of enhanced awards for both daily living and mobility components.
Around two-thirds of working age disability benefit claimants receive an incapacity benefit (Universal Credit health or Employment Support Allowance), while almost three quarters receive either this or non-health-related Universal Credit. Those who receive enhanced awards are more likely to receive another health-related benefit, as would be expected as they are likely to have to higher level of need.
Customer satisfaction and experiences of claiming PIP
The Customer Experience Survey is designed to monitor customer satisfaction with the services offered by DWP. Results show that PIP has lower rates of overall customer satisfaction than other DWP services. In FYE 2025, satisfaction with PIP was 82% compared to 87% overall. Other benefits that entail a health assessment, such as Employment Support Allowance, also have lower satisfaction levels generally; 78% in FYE 2025.
Our body of research evidence indicates why customer satisfaction with PIP is lower than for other benefit lines, through examining PIP applicants’ experiences in detail.
In summary, we know that there are discrete elements of the PIP journey that can be challenging.
Application
The process of contacting DWP to apply for PIP, filling in the lengthy “how your disability affects you” or PIP 2 form, gathering and supplying evidence, then waiting for an outcome, are described as stressful and anxiety inducing.
The questions in the form are less relevant for people with mental health and neurodevelopmental conditions than people with physical disabilities. Applicants express concerns about providing sufficient evidence, particularly for mental health conditions.
People with fluctuating conditions and mental health issues often struggle to map their experience to the questions. Additionally, reflecting on traumatic experiences can be re-traumatising. Applicants want to comply and provide the “right” evidence, but report being unclear how to complete the form accurately.
Assessment
Many applicants report that taking part in an assessment is intrinsically challenging both as they are being judged, but also as it has a high impact on the award outcome.
Sometimes people feel they need to “prove” their entitlement to PIP, and perceive the assessment as a test, whereas others welcome the opportunity to explain how their conditions affect them on a daily basis. Either way, it is a significant “event” in their PIP journey and poses challenges for people with mental health, neurodevelopmental or trauma-related conditions, who may find it stressful to speak about their situation, and for people with fluctuating conditions when applicants feel they need to be seen on one of their “bad days” in order to qualify.
Preferences for face-to-face or telephone assessments are mixed and don’t appear to relate to identifiable characteristics, like primary health condition. Applicants are clear that when the assessment report accurately reflects their experience and includes materials and information they have provided to the assessor, this helps to build trust that the process is fair and the decision will be evidence based.
Receiving a decision
The outcome of the decision to award PIP or not is the key driver of customer satisfaction. Receiving a full award of PIP is a relief, whereas partial or nil awards often leave applicants feeling disappointed and frustrated, particularly if they felt misunderstood or misrepresented.
Where DWP makes an effort to demonstrate an understanding of customer circumstances in all stages of the process, this, again, reassures customers the process is reasonable.
Signposting to other forms of support tends to be considered as helpful, particularly where applicants are facing multiple issues, such as insecure accommodation, but this needs to be handled sensitively. If an applicant has not received a PIP award, signposting can be confusing as it acknowledges they have needs whilst withholding DWP support.
Mandatory reconsiderations
Applicants who are unhappy with the outcome of their application can request a mandatory reconsideration (MR), before going on to appeal (via HM Courts and Tribunals Service) if necessary.
Where applicants elect to pursue a MR, this is most commonly when they do not receive any award or when they disagree with the value of award. Our evidence suggests that there is limited awareness and understanding of the MR process and that some MRs could be avoided if applicants understood the need to provide medical evidence with their application; there is a common misunderstanding that DWP contacts healthcare providers during the decision stage.
The Health Transformation Programme (HTP) was implemented to address some of these known issues. It set out to transform the PIP service, introduce a simpler application process, including an option to apply online, improve the evidence gather and deliver a more tailored journey for customers by 2029. A new single Health Assessment Service for all benefits that use a functional health assessment is also being developed.
Awareness of and attitudes towards disability benefits
The period from 2010 to 2022 saw an increase in support for welfare spending in general and a decline in anti-welfare attitudes.
Since 2002, support for increased welfare spending on “disabled people who cannot work” has consistently been much higher (between 45% to 73% support), than “for unemployed people” (between 15% to 29% support).
Since 2017, there has been a decline in support for increased spending on disabled people. In 2024, for the first time, fewer than half (45%) supported more spending, although this is still far higher than the proportion calling for lower spending (10%).
In 2024, views were evenly balanced on whether claiming disability benefits was “too easy” (29%) or too hard (29%).
In 2023, the public generally didn’t have strong preferences between spending on different types of health impairment. When presented with choices between spending more or less on different groups, over 75% picked ‘receive the same amount’ for all options.
Impact of receiving PIP on disabled people’s lives
Spending
Disability benefits such as PIP are spent on a wide range of health-related needs and additional costs of disability. DWP research shows that most people do not ringfence budgets and therefore cannot directly account for how PIP income is spent. As such, PIP is spent on disability-related extra costs alongside general living costs according to individual priorities.
Citizens Advice research shows that for their debt clients, gaining or losing PIP income had the biggest short-term impact on spending on health and care, followed by food.
Wellbeing
Analysis by Pro Bono Economics estimates that disability benefits have a substantial impact on narrowing the wellbeing gap between disabled and non-disabled people. Disabled people have lower average self-reported life satisfaction, by 1.22 points scored on a 0 to 10 scale. But Pro-Bono Economics estimates receiving disability benefits helps close that gap, improving life satisfaction scores by 0.79 points.
Employment
A wider academic literature shows that disability benefits tend to disincentivise work, both by giving people alternative sources of income, and through rules that reduce benefit entitlement as people earn. Other countries can see large employment impacts of receiving disability benefits (15 to 30 percentage points). However, PIP is different because entitlement to the benefit is not impacted by working.
For PIP claimants, there is a clear association between receiving the benefit and likelihood of employment. Employment rates are low for PIP claimants, and Institute for Fiscal Studies (IFS) analysis has shown that as people have reductions in their disability benefits, they are more likely to move into work. This association is consistent with some people moving off disability benefits as their health improves, and the reduction in disability benefits encouraging some into work. As such it doesn’t show necessarily whether PIP income causes people to reduce their employment.
DWP analysis shows that employment rates decline more slowly, following their application and decision, for claimants who narrowly missed out on receiving PIP from those who scored the minimum points to receive an award.
There is not, however, a full consensus on employment effects. One pre-peer reviewed academic study attempts to estimates the direct impact on employment and finds mixed evidence for impacts on employment. This study uses the changing eligibility in the shift from DLA to PIP as a natural experiment. It finds that any impact of increased, or decreased, eligibility was not observable.
Conversely, the same study found a positive impact on employment when there was a stricter application of the PIP criteria. Areas where health assessment providers gave awards at a lower rate saw a corresponding small rise in employment for unmarried individuals (2.9 to 3.3 percentage points), though it didn’t find any significant impact on other groups.
Independence
The Motability Scheme’s evaluation notes that a large majority of recipients (94%) would not otherwise have been able to get a vehicle that met their disability needs; and 84% reported an improved ability to access places and people.
Research by Activity Alliance found a majority (65%) of disability benefit claimants said they relied on benefits to stay active. Conversely though, large numbers (47%) were fearful of losing their benefits if they were seen to be active.
A wide range of qualitative research listed ways in which receipt of PIP can reduce disabled people’s reliance on friends and family including: paying for care or assistance; getting taxis rather than needing lifts and, accessing technology that allows greater independence.
1. Introduction
1.1. The welfare system contains several benefits that aim to support disabled people, people with health conditions, their families and their carers.[footnote 1] These can loosely be defined as comprising income-replacement benefits, intended to replace income when a person is unable to or not expected to work, and extra costs benefits to contribute towards the extra costs faced by disabled people and people with a long-term health condition. Carers can receive CA if they are caring for somebody in receipt of certain benefits.
1.2. For working age people in this group, the main income-replacement benefits - Universal Credit (UC) paid to people with health conditions, and Employment and Support Allowance (ESA) - are known as ‘incapacity benefits’, and can be based on a person’s National Insurance contributions or be means-tested (related to their other income). The main disability benefit for working age people is now PIP, though there are still some people in receipt of its predecessor, DLA. Neither are based on National Insurance contribution records, nor means-tested.
1.3. This is summarised in Figure 1.1.
Figure 1.1: Benefits to support disabled people, people with health conditions, their families and carers
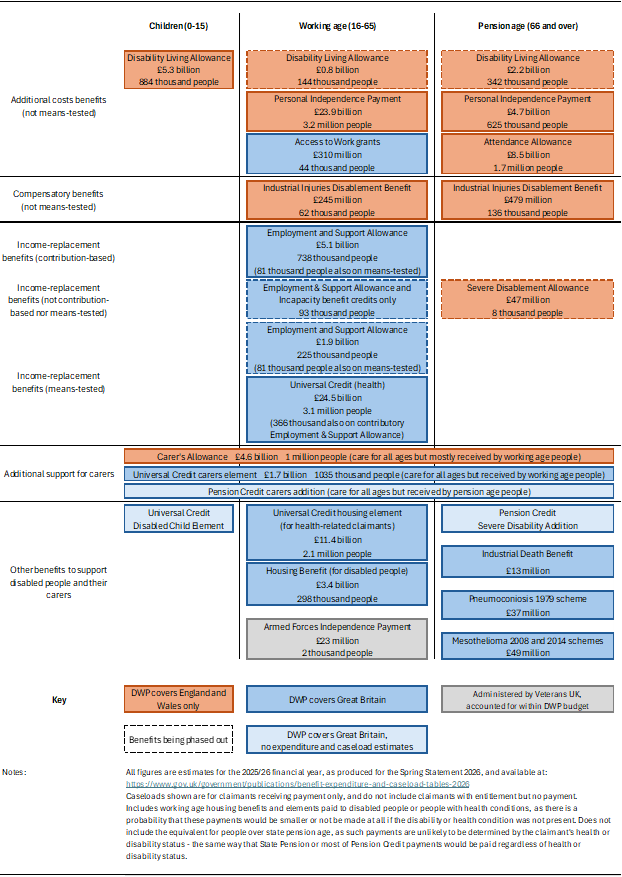
1.4. In 2025 to 2026, estimated DWP expenditure on these benefits was £99 billion.[footnote 2][footnote 3] Of this, £32 billion was estimated to be spent on incapacity benefits for people of working age, while £25 billion was estimated to be spent on extra costs benefits – mostly PIP covering 3.2 million people, with around 144,000 still on DLA.
1.5. A large number of disabled people and people with health conditions receive more than one of these benefits. In May 2024, 66% of working age PIP or DLA claimants also received an incapacity benefit. In addition to benefits that directly support disabled people, CA or the UC CE is available to individuals that provide at least 35 hours of care a week for someone in receipt of certain rates of DLA, PIP or AA. Trends in spending on these benefits is therefore closely linked to trends in spending on the qualifying benefits. For working age PIP/DLA recipients, almost a quarter have someone who receives CA or the UC CE for caring for them.[footnote 4]
1.6. Entitlement to or receipt of PIP is a commonly accepted passport to other support administered by DWP, other government departments, devolved administrations, local authorities or other organisations. There are numerous other organisations who proactively use entitlements to PIP to grant disability passes or concessions such as reduced-price cinema tickets.
The nature of extra costs
1.7. Extra costs disability benefits are intended to provide a contribution towards the extra costs faced by disabled people. These extra costs are simply the costs that disabled people or people with health conditions need to spend which non-disabled people do not, as a result of their condition or conditions. Different disabilities or health conditions will incur different costs, and the same disability or health condition can affect people in very different ways, therefore giving rise to different costs. Costs can also vary according to other circumstances of the disabled person, for example their family circumstances and where they live.
1.8. Disability-related costs can include both one-off costs, such as installing a stair lift, and recurring costs, such as increased spending on heating. However, many seemingly one-off costs will also have associated recurrent costs, such as maintenance of a stair lift.
1.9. These costs can be discrete and immediately visible, as well as more hidden. To help identify both kinds of costs, it is useful to think of disability-related spending in terms of three broad categories (Extra Costs Commission, 2015; Scope, 2023; Scope, 2024):
- disability-specialised goods and services – this refers to the need for disabled people to buy different things to non-disabled people, due to their disability. This can include goods and services such as paid carers, mobility vehicles, electric beds, interpreters, ramp installations and additional therapies
- greater use of common goods and services – this includes the need for disabled people to buy more of some things than non-disabled people do. This can include a greater reliance on taxis and private hire vehicles to get around, needing to use heating for longer or to a higher temperature, and higher utility bills due to washing clothes more frequently
- higher costs for common goods and services – this refers to the fact that disabled people have to pay more for some things than non-disabled people do. Examples include disabled people being charged more for insurance than non-disabled people, or accessible housing costing more than non-accessible housing
1.10. Figure 1.2 shows specific examples of disability-related costs.
Figure 1.2: Examples of extra costs
| Area of spending | Examples |
|---|---|
| Equipment and aids | Mobility vehicles, including insurance, maintenance (Sanders, 2022) Aids and adaptations to help with cooking (DWP, 2023) Energy to run equipment (Evans and others, 2023; Scope, 2024) |
| Personal assistance and paid care | Interpreters (Hill and others, 2015) Assistance with eating, preparing food, bathing, dressing, using the toilet, going to bed, taking medication (DWP, 2023) Help around the home (DWP, 2023; Scope, 2024) |
| Health and personal care | Prescribed medications (DWP, 2023; Scope, 2023) Pain management and other therapies (Joseph Rowntree Foundation, 2004) Greater use of hygiene products (Sanders, 2022) |
| Transportation | Vehicle adaptations (DWP, 2023) More trips to and from appointments (Evans and others, 2023) Being charged more for accessible taxis and private hire vehicles (Evans and others, 2023; Scope, 2024; Extra Costs Commission, 2015) |
| Energy and utilities | Increased heating for those with conditions which cause them to be cold easily or which mean they must stay warm (DWP, 2023; Scope, 2024) Increased water usage for participants who must wash clothing and bedding frequently due to incontinence (DWP, 2023; Scope, 2024) |
| Clothing and bedding | Soiling, staining from topical medication, and wear and tear leads to frequent washes and replacement of items (Extra Costs Commission, 2015; DWP, 2023; Scope, 2024) Specially adapted clothing (Sanders, 2022) Rapid weight gain as side effect of mental-health-condition-related medication means new clothing required (DWP, 2023) |
| Food | Dietary supplements (Sanders, 2022) Pre-prepared food and grocery delivery (Scope, 2024) Ready meals and/or takeaways for those that are not able to cook (DWP, 2023; Scope, 2023; Scope, 2024) Increased costs due to special dietary needs, such as soft food or gluten-free (DWP, 2023; Scope, 2023; Scope, 2024) Disabled households will often have less opportunity to shop around for cheaper deals (Scope, 2023) |
| Insurance | Insurance for personal assistants, equipment and aids, and so on. (Joseph Rowntree Foundation, 2004; Sanders, 2022) Disabled people being charged more for insurance than non-disabled people, or refused insurance outright (Extra Costs Commission, 2015) |
| Housing and home adaptations | Home adaptations (DWP, 2023) Hiring out regular maintenance and repairs (Joseph Rowntree Foundation, 2004) Fewer accessible housing options (Sanders, 2022; Scope, 2024) |
1.11. The UK is relatively unusual in primarily supporting disabled people with the extra costs of daily living and mobility via a cash transfer rather than by providing goods and services directly as a benefit in kind. In addition, there are still numerous other sources to help with disability-related needs. The main sources of provision for disability-related needs are:
- their personal or household income – this includes health and disability benefits, earnings, savings, pensions, other benefits and other forms of income, including borrowing money
- informal support networks, including family, friends, neighbours, and faith groups -healthcare services, primarily the NHS as well as other providers
- social care services provided through the local authority
- the community and voluntary sector (CVS), including charities and community interest companies
1.12. DWP’s Uses of Health and Disability Benefits (2023) maps out sources of funding that survey respondents reported, summarised in Figure 1.3. This offers an idea of how different sources of funding may be available for disability costs. How the costs of disability are met is dependent on:
- the availability of support from family, friends, local authorities, charities, and so on
- the person’s awareness of available support
- the person qualifying for available support
- the ability to receive support (for example, those living in rented accommodation may not be permitted to make accessibility-related home adaptations)
- the person’s ability to self-fund where applicable
Figure 1.3: How the costs of disability are met
| Area of need | Income (including health and disability benefits) | Healthcare services (like the NHS) | Local authority social care services | Informal support networks | Community and voluntary sector |
|---|---|---|---|---|---|
| Person (Specific dietary requirements) | Paid | - | - | - | - |
| Person (Clothing and footwear) | Paid | Free | - | - | - |
| Person (Care and assistance) | Paid, Paid for through funds from multiple sources note 1 |
- | Free | Free, Paid for through funds from multiple sources note 1 |
Free, Paid for through funds from multiple sources note 1 |
| Home (Structural adaptations) | Paid, Paid for through funds from multiple sources note 1 |
Free, Paid for through funds from multiple sources note 1 |
Free, Paid for through funds from multiple sources note 1 |
- | Free |
| Home (Larger home) | Paid | - | - | Free | - |
| Home (Help around home) | Paid | - | - | Free, Paid for through funds from multiple sources note 1 |
- |
| Travel (Car) | Paid | - | - | Free | - |
| Travel (Public transport) | Paid | - | Free | - | - |
| Travel (Taxis) | Paid | - | Paid for through funds from multiple sources note 1 | - | |
| Utilities (Water) | Paid | - | - | - | - |
| Utilities (Heating) | Paid, Paid for through funds from multiple sources note 1 |
- | - | - |
Paid for through funds from multiple sources note 1 |
| Utilities (Power) | Paid | - | - | - | - |
| Medical goods (Medication) | Paid | Free | - | - | - |
| Medical goods (Products/items) | Paid | Free | - | - | - |
| Medical goods (Equipment and aids) | Paid, Paid for through funds from multiple sources note 1 |
Free, Paid for through funds from multiple sources note 1 |
Free, Paid for through funds from multiple sources note 1 |
- | - |
| Medical goods (Therapies) | Paid | Free | - | - | Free |
| Outside the home (Appointments) | - | - | Free | Free | - |
| Outside the home (Errands) | - | - | Free, Paid for through funds from multiple sources note 1 |
Free | - |
| Outside the home (Social activities) | Paid | - | - | Free, Paid for through funds from multiple sources note 1 |
Free |
| Money and admin (managing money) | Paid | - | Free | Free | - |
| Money and admin (Admin) | - | - | Free | Free | Free |
| Social participation and leisure (Internet) | Paid | - | - | - | - |
| Social participation and leisure (In-home entertainment) | Paid | - | - | - | - |
| Social participation and leisure (Aids/devices) | Paid | Free | - | - | - |
| Work (Flexibility) | Paid | - | - | - | - |
Note 1: paid for through funds from multiple sources; examples include grants from community interest companies and charities, or council funded care combined with privately funded care.
1.13. The Uses of Health and Disability Benefits (DWP, 2023) also reported that extra costs benefits were often pooled with other income, obscuring their precise use. When looking at household income as a whole, the most significant expenditure was on essential day-to-day living costs, including utility bills, groceries, mortgage or rent payments and car expenses.
A short history of extra costs disability benefits
1.14. State support for disabled people dates back at least to 1911, with the introduction of the National Insurance Act. Support was expanded under the National Assistance Act of 1948 to include compensation for industrial injuries and basic income replacement for those who had to leave employment due to sickness or disability and were deemed sufficiently in need.
1.15. Cash benefits to help meet the extra costs associated with disability only began in earnest in the 1970s with the introduction of AA and Mobility Allowance (MobA). The scope and generosity of these benefits expanded with the introduction of DLA for children and working age adults in the early 1990s, replacing both AA and MobA for these groups; AA continued to be available for new claimants aged above men’s state pension age.[footnote 5]
1.16. DLA has 2 components – a ‘care component’ paid at 3 rates, and a ‘mobility component’ paid at 2 rates. Compared to the benefits it replaced, it added a new lower rate for each of the components, to provide greater support for people who were less severely disabled, who had been identified as being often ineligible for help with the costs they faced.
1.17. DLA also introduced self-assessment. Entitlements to AA and MobA were established through functional assessments conducted by medical practitioners, but initial entitlement for DLA was assessed by claimants themselves, with Department of Social Security (DSS)[footnote 6] decision-makers determining the appropriate award based on the information provided, drawing on DSS medical guidance regarding the characteristics of different conditions and the consequent needs.
1.18. Although new claims to DLA were restricted to under-65s, existing claimants could continue to claim DLA beyond age 64 where they continued to meet the entitlement conditions. Where a claimant’s care needs increased they could increase the level of the care component, or receive it for the first time if they were only receiving a mobility component, after age 65; the mobility component, however, could not be awarded for the first time or increase, regardless of circumstances, once aged 65 or over, other than with the annual uprating of benefits.[footnote 7] This means that there are significant numbers of DLA claimants aged above state pension age. The consequences of this are explained later in this document in relation to PIP, which replicates the same approach.
1.19. The numbers of people claiming, and being awarded, DLA far exceeded those that were predicted prior to its introduction. This was not only as a result of the introduction of the new lower rates – numbers receiving the rates of benefit carried over from AA and MobA also accelerated following its introduction. However, by the early 2010s, the proportion of the working age population in receipt of DLA had almost stabilised at just under 5%
1.20. More information on this phase of disability benefits is provided in the January 2019 Welfare Trends Report (OBR, 2019).
Personal Independence Payment
1.21. Reform of DLA was announced in the June 2010 Budget. It stated that “the government will reform the Disability Living Allowance (DLA) to ensure support is targeted on those with the highest medical need. The government will introduce the use of objective medical assessments for all DLA claimants from 2013 to 2014 to ensure payments are only made for as long as a claimant needs them.” (Her Majesty’s Treasury, 2010).
1.22. Following extensive consultation between October 2010 and June 2012, PIP was introduced for working age claimants from April 2013. PIP was intended to address features of DLA which were seen as flawed:
- loosely defined and outdated definitions, based on those created in the mid-1970s, which led to inconsistent decision making and a lack of confidence that the benefit was focused on those in the greatest need. In particular, it was based on a more general assessment of care and mobility needs, often relying on self-reported difficulties and less structured criteria
- a reliance on self-assessment by claimants with little scrutiny, for example only half of claims were accompanied by additional evidence and only around 5% had a face-to-face assessment with a health professional
- no systematic reviews of the existing caseload, with around 70% of recipients in receipt of an indefinite award
- a lack of claimant understanding of what the benefit was intended to help with
- a lack of financial sustainability with both the caseload and expenditure increasing more rapidly than the disability of disability
1.23. PIP was introduced as planned in April 2013, initially in a small number of postcode areas, and then nationally from June 2013. It was assumed that all existing DLA claimants of working age would be reassessed for PIP by March 2016. In practice, reassessment of DLA cases was commenced on a geographical basis starting from October 2013 but only reaching national coverage in August 2015. Managed reassessments continued until the COVID-19 pandemic, fluctuating according to available assessment capacity, before being paused when the pandemic took hold. Managed reassessments have not been resumed, with the only moves from DLA to PIP among working age people being where the claimant has requested it. At present it is intended to resume department-led DLA to PIP reassessments in April 2028, for completion by March 2030.
PIP criteria and structure
1.24. Since individuals can be affected by their health conditions in different ways, the PIP assessment, unlike for DLA in many instances, considers the effects of long-term health conditions or disability on a person’s day-to-day life, rather than focusing solely on the health condition or impairment itself.
1.25. Except for claims made under special rules for those nearing the end of life, the assessment for PIP is based on the needs arising from a long-term health condition or disability, not the health condition or disability itself. Therefore, the PIP assessment is not a medical assessment requiring the assessor to diagnose a condition or its severity, nor to recommend treatment.
1.26. Health conditions may be physical, sensory, mental, intellectual or cognitive, or any combination of these, and the assessment was designed to take a comprehensive approach to disability, reflecting the needs arising from the full range of conditions.
1.27. The PIP assessment looks at how a long-term health condition or disability impacts 12 activities which are fundamental to living an independent life. The activities are grouped into 2 components, daily living and mobility, and within each activity a descriptor must be chosen to score an individual depending on how well they are able to perform the activity. The scores are then added together to give a combined score for each component. For each component, there are 3 potential award outcomes – nil, standard or enhanced. This means that if PIP is awarded, it can be paid at one of 8 set rates. For each component, 8 points qualifies the claimant for the standard rate, and 12 gives the enhanced rate. No award of the component is given where that component is scored below 8 points. While most claimants receive both components, some claimants receive only one.
1.28. It is a fundamental principle that the PIP assessment should not just consider whether an individual can complete an activity, but the way they can do it. PIP legislation sets out a requirement that consideration must be given to whether individuals can complete each assessment activity “safely, to an acceptable standard, repeatedly and in a reasonable time period”. These 4 elements are known as the PIP reliability criteria. When conducting assessments healthcare professionals (HCPs) must confirm the reliability criteria have been considered when formulating their advice to the decision maker. Application of the reliability criteria is audited as part of DWP’s monitoring of the quality of assessments.
1.29. It is essential for the assessment to accurately reflect the impact of variations in an individual’s level of impairment. This is important for all health conditions, including those which more typically fluctuate. The criteria consider an individual’s ability over a 12-month period, ensuring that fluctuations are considered. For each activity, if a descriptor applies on more than 50% of the days in the 12-month period, that descriptor should be chosen.
1.30. Where there is sufficient available evidence, PIP assessments are carried out via a paper-based review, without the need for a formal consultation. HCPs can also seek additional information from claimants, GPs or other supporting HCPs where this might help them complete a paper-based review.
1.31. Initially where consultations were required, these were completed face-to-face. When the pandemic took hold and lockdown restrictions were introduced, these could no longer be undertaken so assessments were paused until telephone and video assessments could be introduced. Therefore, currently if a consultation is required this can be completed either face-to-face, via telephone or via a video call and assessment providers will aim to identify claimants who need a specific assessment type. If the claimant is allocated to an assessment type which they believe is unsuitable, or they would prefer to be assessed in a different way, they can contact the assessment provider to discuss an alternative method. At present, the vast majority of consultations are undertaken by telephone.
Independent reviews of PIP
1.32. Since PIP was introduced in 2013, the assessment has been subject to 2 statutory, independent reviews, both conducted by Paul Gray CB (Gray 2014; 2017). The policy underpinning PIP, including the eligibility criteria, has not been reviewed since its introduction.
1.33. The first review, reporting in 2014, made 14 recommendations in relation to: improving the claimant experience; further evidence; and the effectiveness of the assessment. The government accepted in full or in part 13 of them.
1.34. The second review, reporting in 2016, made a further 14 recommendations in relation to: further evidence; claimant trust and transparency; and quality and consistency. The government accepted all recommendations in full or in part.
Policy changes
1.35. In addition to the independent reviews, PIP has been subject to ongoing policy and legislative changes in recognition of external challenges. Important changes include the devolution of PIP in Scotland to the Scottish Government from April 2020 – covered in more detail later – and the introduction of telephone and video assessments in response to the pandemic.
Legal challenges
1.36. Decisions relating to PIP have been subject to legal challenges in the Upper Tribunal. Some of the most significant case law developments that have shaped the interpretation of PIP legislation include:
- KM v Secretary of State for Work and Pensions (PIP) [2018] UKUT 296 (AAC): an appeal concerning how the First tier Tribunal (FtT) erred materially in law in its interpretation and application of the law in relation to PIP daily living descriptor 3, managing therapy or monitoring a health condition[footnote 8]
- MH v Secretary of State for Work and Pensions) [2016] UKUT 0531 (AAC): from 28 November 2016, there was a change to the way DWP considers how overwhelming psychological distress affects a claimant’s ability to plan and follow a journey
- RJ, GMcL and CS v Secretary of State for Work and Pensions (PIP) [2017] UKUT 105 (AAC)): from 9 March 2017, there was a change to the way DWP considers if a claimant can complete a PIP activity safely and if supervision is required, by considering both the likelihood of harm occurring, and the severity and nature of the harm that might occur
- KT and SH v Secretary of State for Work and Pensions (PIP) [2020] UKUT 252 (AAC): from 21 August 2020, there was a change to the way DWP considers how hearing impaired/deaf claimants can complete washing and bathing (activity 4) safely if they cannot hear a standard fire alarm
- LB v SSWP (PIP) [2017] UKUT 436 (AAC): the definition of therapy, specifically in relation to 1) monitoring medication or managing a health condition, and 2) special diets. For the main part of the judgment, DWP carried out a review exercise to implement the judgment from the date of that judgment (28 November 2016) until the date of amending regulations (16 March 2017), which reversed this part of the judgment.
- Secretary of State for Work and Pensions (Appellant) v MM (Respondent) (Scotland): engaging face to face concerns the difference in PIP entitlement for people who need ‘prompting’ versus people who need ‘social support’ to engage with others face to face, and whether social support can be provided in advance and the definition of social support.
Devolution
1.37. Following the Scottish independence referendum in 2014, the cross-party Smith Commission was established to agree further powers that should be devolved to Scotland. The Scotland Act 2016 devolved powers to provide disability and carer’s benefits to the Scottish Parliament. These were previously reserved to Westminster. The Scottish Parliament were also given the power to create new benefits in areas of devolved responsibility and to top up reserved benefits. Executive (administrative) competence for disability and carer benefits was transferred to the Scottish Parliament in April 2020.
1.38. DWP has continued to deliver disability benefits on behalf of the Scottish Government under agency agreements, whilst it introduced its own replacement benefits and the existing caseload of disability and carer benefit recipients in Scotland was transferred to Social Security Scotland, the Scottish Government’s executive agency for social security. The Scottish Government has replaced PIP with Adult Disability Payment (ADP). It was introduced from March 2022 across selected local authority areas, reaching national coverage in Scotland from 29 August 2022. No new claims to PIP have been made in Scotland since this date. Case transfer for existing PIP customers in Scotland began in June 2022 and completed in July 2025. Case transfer for remaining DLA cases started in March 2025 and was due to complete by the end of 2025. Local authority data on the ADP rollout is available (House of Commons Library, 2026). Statistics on ADP are published by Social Security Scotland (Social Security Scotland, 2025).
1.39. The UK government’s funding to the Scottish Government includes a ‘welfare block grant’ which broadly equates to a percentage of England and Wales spending, based on Scotland’s spending relative to that in England and Wales in the year before devolution, adjusted for differences in population growth. This means that changes to disability benefits spending in England and Wales by default will also have an impact in Scotland, even though disability benefits are now devolved. Further details are set out in the updated agreement on the Scottish Government’s Fiscal Framework (HM Treasury and Office of the Secretary of State for Scotland, 2023), paragraphs 9 to 15.
1.40. In the last year of the UK Parliament’s legislative competence for disability benefits in Scotland, there were 267,000 working age claimants of PIP or DLA resident in Scotland, accounting for £1.4 billion of benefit expenditure.
1.41. Social security, including all support for disabled people and people with health conditions, is a transferred matter in Northern Ireland. By longstanding convention, however – most recently reflected in section 87 of the Northern Ireland Act 1998 – Northern Ireland maintains ‘parity’ with the UK government’s systems of social security, child maintenance, and pensions. The Department for Communities has policy responsibility for social security benefits in Northern Ireland, and DWP has never had responsibility for disability benefits there (Mackley, 2020). Further information on the operation of parity is provided in Social security powers in the UK (Mackley, 2020), section 5. Statistics on PIP in Northern Ireland are published by the Department for Communities (Department for Communities, 2025).
1.42. For this reason, as far as possible, analysis in this document relates to DWP’s current area of responsibility – England and Wales, together with a small number of payments overseas. This applies even for the period up to and including FYE 2020, when DWP were wholly responsible for PIP and DLA in Scotland – so as to ensure comparisons over time are meaningful and not distorted by devolution.
Uprating of disability benefits
1.43. Usually, disability benefits are increased in line with inflation each April. This is based on the increase in the general price level faced by consumers in the year to the preceding September, meaning that there is a lag in benefit levels responding to change in prices, though over the medium term they will maintain their value relative to the average price level.[footnote 9] Since the legislation makes no provision for reductions in disability benefits, when inflation is negative – the general price level fell over the period – the default is for benefit rates to remain unchanged, so they increase relative to the price level.
1.44.There have been changes in the measures used to uprate disability benefits over time, as follows:
- Up to and including April 2009 disability benefits were uprated by the Retail Prices Index (RPI). This is no longer a National Statistic due to methodological deficiencies, though is still used for many purposes.
- In April 2010, negative RPI would normally have meant no change in benefit rates. The then government decided to increase disability (and other) benefits by 1.5%, given that the alternative Consumer Prices Index (CPI) measure of inflation was at around this level. At the time, the intention was to offset the 1.5% increase against the April 2011 uprating (HM Treasury, 2009, paragraph 5.19).
- In April 2011, uprating switched to the CPI measure, which used a different methodology to the RPI. CPI inflation is estimated to be, on average, 0.9 percentage points a year lower than RPI measure (Office for Budget Responsibility, 2024, Box 2.3). However, the planned offset of the previous year’s uprating did not occur.
- CPI inflation was (very slightly) negative in the year to September 2015, so there was no change in disability benefit rates in April 2016. Apart from this one exception, disability benefits have increased in line with CPI inflation, with a lag, in April of every year since 2011.
1.45. The use of general inflation indices to uprate benefits will mean that individuals or groups of individuals with different spending patterns may experience an inflation rate that is lower or higher than the general inflation rate. Creation of bespoke indices for different sub-groups of the population would be methodologically challenging and potentially open to dispute. Individuals would still experience quite different ‘personal’ rates of inflation based on their particular circumstances and spending patterns.
Welfare Trends Report findings
1.46. Little more than one year before the pandemic, the OBR reviewed the first 5 years of PIP in its January 2019 Welfare Trends Report. It observed a long-run increase in the number of disabled people in the population, including a rising proportion reporting mental health conditions.
1.47. It also observed “the cost of the ‘extra costs’ disability benefits system has risen significantly over time, and both major reforms to the system – the introduction of DLA in 1992 and of PIP in 2013 – have ended up costing much more than expected. With DLA, that involved a deliberate expansion in coverage yielding a greater increase in the caseload and cost than had been predicted. With PIP, a reform intended to reduce spending has actually increased it”.
1.48. Many of the lessons identified by the OBR from the early days of PIP were focused on its ability to forecast spending accurately. Among these it noted that “when a new disability benefit is introduced, it takes many years for the average duration of claims to reach steady state. This means that there is uncertainty over trends in the prevalence of benefit receipt for an extended period.” It also commented that “changes in caseload composition have typically pushed average awards higher than can be explained simply by uprating policy. This could reflect claimants (and their advisors) learning how to navigate the system better – a factor accentuated by the rise of the internet and social media”. It went on to say “echoing conclusions reached in each of our previous welfare trends reports, the effects of major reforms on spending are hard to predict and subject to the risk of optimism bias. This was true of the early years of DLA and has been true again of the transition from DLA to PIP for working-age claims …”
1.49. Much of the analysis included within the Welfare Trends Report is brought up to date in this report.
The focus of this report
1.50. This report is focused on working age extra costs disability benefits, PIP, and where relevant to understand wider trends, DLA. This report briefly mentions trends in children’s and pensioners’ disability benefits, as they influence and are influenced by what happens with working age disability benefits. The report is structured as follows:
1.51. Chapters 2 to 5 look at:
- the trends in overall disability in the working age population
- how this translates into the trends in PIP and DLA
- the potential reasons for the rise in numbers of people receiving these benefits with a greater focus on the steeper rise since the pandemic
- some characteristics of the current caseload
1.52. Chapters 6 to 8 then cover:
- customer satisfaction and experience claiming PIP
- perceptions of disability benefits
- the impact of PIP on disabled people’s daily lives
References in Chapter 1
Department for Work and Pensions (2023) Uses of health and disability benefits. London: DWP. Available at: Uses of Health and Disability Benefits
Department for Communities (2025) Personal Independence Payment statistics, Department for Communities. Available at: Personal Independence Payment statistics
Evans, J., Collard, S., Fruijtier, E., Dawson, H., Campos Ferreira, L. and Harris, E. (2023) The financial wellbeing of disabled people: The extra costs of disability. Bristol: University of Bristol. Available at: The financial wellbeing of disabled people: The extra costs of disability
Extra Costs Commission (2015) Driving down the extra costs disabled people face. Available at Driving down the extra costs disabled people face
Gray, P. (2014) An independent review of the Personal Independence Payment assessment. London: DWP. Available at: An Independent Review of the Personal Independence Payment Assessment
Gray, P. (2017) The second independent review of the Personal Independence Payment assessment. London: DWP. Available at: The Second Independent Review of the Personal Independence Payment Assessment
House of Commons Library (2026) Local authority data: Adult Disability Payments in Scotland, House of Commons Library. Available at: Local authority data: Adult Disability Payments in Scotland - House of Commons Library
Hill K., Davis A., Hirsch D., Padley M and Smith N. (2015) Disability and minimum living standards. Loughborough: Loughborough University. Available at: Disability and minimum living standards
HM Treasury (2009) Pre-Budget report 2009. London: HM Treasury. Available at: Pre-budget report December 2009
HM Treasury (2010) Budget 2010. London: HM Treasury. Available at: Budget 2010
HM Treasury and Office of the Secretary of State for Scotland (2023) The updated agreement on the Scottish Government’s fiscal framework. London: HM Treasury. Available at: The updated agreement on the Scottish Government’s Fiscal Framework
Joseph Rowntree Foundation (2004) Monitoring poverty and social exclusion. York: JRF. Available at: Monitoring poverty and social exclusion
Mackley, A. (2020) Social security powers in the UK. London: House of Commons Library. Available at: Social security powers in the UK
Office for Budget Responsibility (2019) Welfare trends report. London: OBR. Available at: Welfare Trends Report
Office for Budget Responsibility (2024) Economic and fiscal outlook. London: OBR. Available at: Economic and fiscal outlook – CP 1169
Sanders, M. (2022) Disability and extra living costs. Iriss. Available at Disability and extra living costs - Iriss
Scope (2023) The disability price tag 2023. London: Scope. Available at: Disability Price Tag 2023 Summary FINAL.docx
Scope (2024) Disability price tag 2024. London: Scope. Available at: Disability Price Tag 2024
Social Security Scotland (2025) Adult Disability Payment statistics to 31 July 2025. Dundee: Social Security Scotland. Available at: Social Security Scotland - Adult Disability Payment statistics to 31 July 2025
2. Trends in disability
2.1. This chapter presents trends in disability in the working age population, as these will be a determinant of the number of people claiming disability benefits. Disability in the population is measured through various surveys, meaning that disability is self-reported rather than clinically assessed. The different surveys have had various approaches to measuring disability over time, as most sources are not primarily focused on disability measurement and therefore are only able to devote a few questions to the subject. Box 2.1 provides more information on the different sources.[footnote 10]
2.2. Additionally, there are different concepts of disability and impairment. How disability should be conceived is a subject of debate, though there has been a general movement towards the ‘social model’. This view sees disability as being generated at the point of interaction between an individual and their physical, social or economic environments whereas impairments are the limitations that the individual faces related to any conditions that they may have. Under the social model, the extent to which an individual’s impairment is disabling depends on the environmental factors at work, such as accessibility of information or transport.
2.3. As a result, it is difficult to objectively establish a definitive level of disability in the population, but provided individual sources maintain broad internal consistency over time, the measures of trends in disability should be a reasonable reflection of the trends in the underlying, unobserved extent of disability in the working age population.
Box 2.1: Measures of disability in the population
All measures used in this chapter refer to the population living in private households, so exclude people living in institutions such as residential care homes or prisons, although the Labour Force Survey and Annual Population Survey do include students living in halls of residence, through the private households of their parents, and separately sample staff living in NHS accommodation.
Labour Force Survey (LFS): the LFS sample consists of approximately 40,000 responding UK households. The Annual Population Survey (APS) uses LFS data alongside a sample boost. The APS figures cover UK working age adults aged 16 to 64. The definition of disability used is the Government Statistical Service Harmonised Standard definition, in line with the Equality Act 2010 core definition. LFS respondents are interviewed for 5 successive waves at three-monthly intervals with around 20% of the sample being replaced every quarter, although not all respondents who respond to the first wave remain for all the subsequent waves. There are breaks and fluctuations in the LFS time series on disability employment and figures are not seasonally adjusted.
Family Resources Survey (FRS): the FRS is a yearly survey which sampled just under 17,000 UK households in the 2023 to 2024 survey year. The term “disability” follows the core definition of disability in the Equality Act 2010. The FRS is a 3 part questionnaire covering the household schedule, the benefit unit schedule, and the respondent’s savings, investments, and debt.
UK Household Longitudinal Study (UKHLS): the UKHLS is an annual survey of approximately 40,000 UK households, with each wave spanning a 24 month period. All participants complete a yearly questionnaire covering different aspects of their life, including disability. Participants are asked ‘do you have any long-standing physical or mental impairment, illness or disability? By ‘long-standing’ we mean anything that has troubled you over a period of at least 12 months or that is likely to trouble you over a period of at least 12 months.’ Participants may cease to take part in the longitudinal study over time, and their answers may be influenced by repeated participation.
Health Survey for England (HSE): the HSE is conducted annually with 8,000 adults and 2,000 children taking part. The HSE 2020 survey was stopped and not published due to the COVID-19 pandemic. The HSE defines longstanding illness as ‘any physical or mental health condition or illness lasting or expected to last 12 months or more’, which is in line with harmonised disability questions for social surveys. Participants are interviewed and, if they consent, receive a follow-up visit from a nurse. The core topics are health, lifestyle behaviours, social care and physical measurements. The HSE examines associations between health states, personal characteristics, and behaviour. However, such associations do not necessarily imply causality.
Adult Psychiatric Morbidity Survey (APMS): In 2023 to 2024, the APMS consisted of 6,912 productive interviews. The APMS covers England only and is conducted about every 7 years. The 2023 to 2024 survey was delayed due to the COVID-19 pandemic. Symptoms of common mental health conditions were assessed using CIS-R (Clinical Interview Schedule – Revised). The ADHD Self-Report Scale was used to estimate possible prevalence of ADHD. The survey has 2 phases. The first is a long questionnaire covering aspects of life which are linked to mental health. Participants identified in phase one as more likely to have autism, psychosis or eating disorders were eligible for phase 2 examination. Some people selected for the survey were unable to complete the long interview, could not be contacted, or refused to take part. Younger age groups were underrepresented in the achieved sample.
Working age disability prevalence
2.4. Trends in working age disability prevalence[footnote 11] – the share of the population reporting a disability – over recent decades in the UK are shown in Chart 2.1, which draws from various large-scale government surveys, administrative sources and the widely-used academic source, the UKHLS (also known as Understanding Society).[footnote 12]
2.5. The different measures are included to show firstly that there is a wide range of potential measures, and secondly that some exhibit quite different trends to others. There are 4 main measures included:
- the highest lines on the chart show the proportion of working age people with a long-term health condition – currently around 30% to 40%
- the next lines show the proportion with a disability, currently around 20% to 25% of working age people, using the Equality Act 2010 definition, and the closest comparable measures prior to that
- the third group of lines shows the proportion of working age people whose long-term health conditions limit their day-to-day activities ‘a lot’, currently equating to around 5% to 10% of the population
- the proportion of working age people claiming PIP or DLA
2.6. Measures taken from the LFS or the FRS show an increase in working age prevalence over time, with the increase quickening since the 2020 to 2021 pandemic. A small part of this increase is likely to reflect the changing age composition of the working age population, as the prevalence of disability and ill-health increases with age, and the large cohort of 1960s baby boomers are now in their late fifties and early sixties.[footnote 13]
Chart 2.1: Reported working age prevalence of long-term health conditions, disability and disability benefit receipt
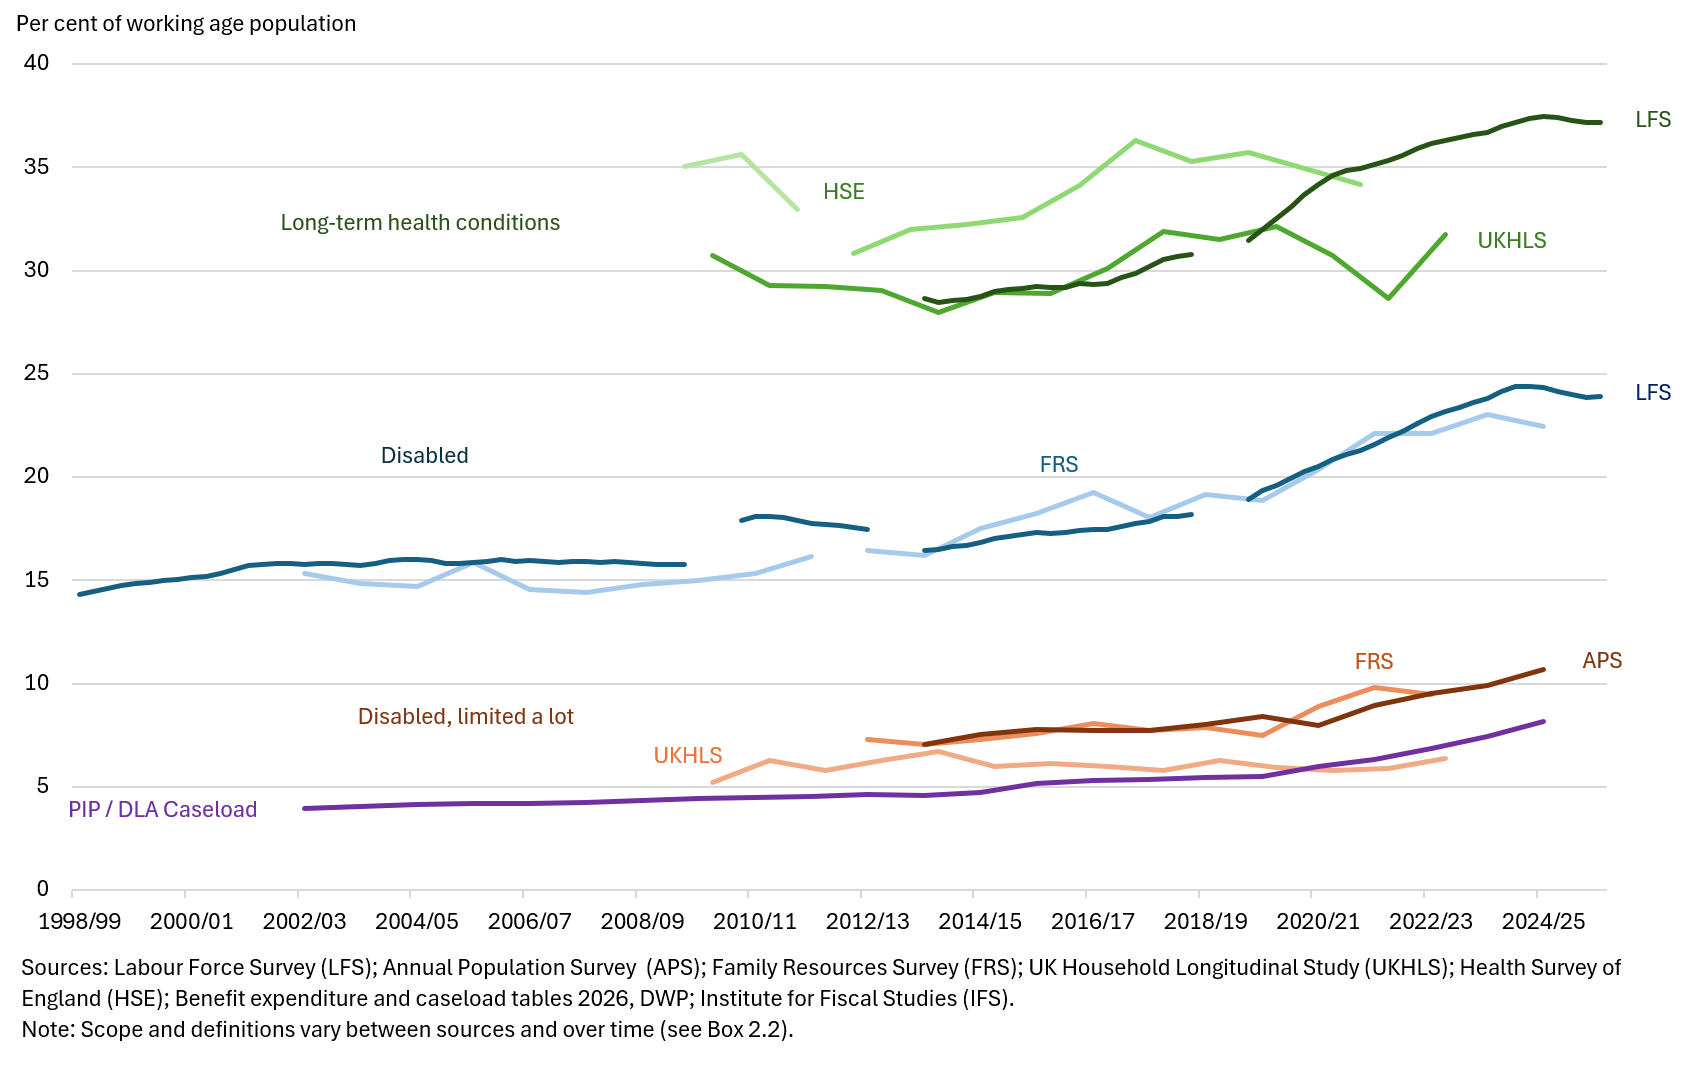
2.7. In contrast, the Health Survey for England (HSE) and the UKHLS show a much flatter trend in long-term health conditions in the working age population, although both are more volatile series. They also do not display an increase in ill-health since the pandemic, although the amount of data post-pandemic is more limited than the other sources.
Box 2.2: differences between measures shown in Chart 2.1
Chart 2.1 brings together a range of different sources to give a broad overview of longer-term trends in disability and ill health among the working age population. The measures shown are taken from a range of published sources, using different data sources, geographical coverage and definitions – in some cases changing over time. However, each measure is given as a proportion of the working age population, so they are broadly comparable.
The number of people on the caseload for working age disability benefits, PIP and DLA, covers people living in England and Wales aged between 16 years and the contemporary state pension age. This is expressed as a percentage of the 16 to 64 population in those countries, so some of the increases seen will be the result of the increases in state pension age between 2010 and 2020.
While benefit caseload figures are based on DWP administrative data, all other measures in Chart 2.1 are based on self-reporting by respondents to surveys of private households (see Box 2.1). Further differences in Chart 2.1 measures are set out below.
Three measures of ill health and disability are used here: long-term health conditions, disabled people, and disabled people whose activities are limited a lot.
All the surveys in Chart 2.1 are currently aligned with the Government Statistical Service Harmonised Standard, which is derived from the legal definition in the Equality Act 2010. A long-term health condition includes “any physical or mental health conditions or illnesses lasting or expected to last 12 months or more”. Such people are defined as disabled if their condition(s) or illness(es) reduce their ability to carry-out day-to-day activities, with a further subgroup identified if their activities are reduced “a lot”. The wording of the questions is slightly different on the UKHLS (see Box 2.1), although it follows the same concepts. Estimates for earlier periods are based on different definitions, creating discontinuities in the time series, shown by gaps in Chart 2.1, where estimates are not directly comparable.
A further discontinuity in the LFS time series has resulted from the Office for National Statistics re-weighting survey estimates back to January 2019.
All estimates cover the UK except FRS estimates of disabled people limited a lot, UKHLS estimates (both England and Wales) and HSE estimates (England).
Working age has been defined as 16 to 64 year old, for consistency over time, except LFS estimates prior to 2010, which are based on men aged 16 to 64 and women aged 16 to 59.
All surveys experienced disruption to data collection following the COVID-19 pandemic from 2020 to 2021, so estimates during this period should be treated with caution. More details on the definitions used are available from the Chart 2.1 data table.
2.8. The IFS validated the different surveys according to their reporting of receipt of disability benefits, and whether they show the faster growth seen post-pandemic. They recognise the challenges that the post-pandemic falls in response rates in the LFS and FRS present for interpreting those sources. But they conclude that since the HSE and UKHLS do not capture the increase in disability benefit claims they are not suitable for explaining the rise in receipt (Latimer, Ray‑Chaudhuri and Waters, 2025).
2.9. According to the LFS, as of FYA 2025, over 10 million working age people self-report as disabled, which is equivalent to 24 % of the working age population. This is an increase from around 17% in FYE 2014. Around 4.5 million working age people self-report as being disabled ‘limited a lot’ [footnote 14]
2.10. Regardless of the measure used and the trend, the various estimates of disability prevalence are significantly higher than the receipt of PIP and DLA among working age people, suggesting that there are significant numbers of additional people who would qualify for PIP should they decide to claim. Because no survey measures the functional impairments underpinning PIP eligibility, it is not, however, possible to estimate the extent of non-take-up of PIP with existing data.
Trends in types of conditions reported
2.11. Chart 2.2 disaggregates the trends from the APS, derived from the LFS, into musculoskeletal, mental health and other conditions, while Charts 2.3 and 2.4 show the latest year in fuller detail.[footnote 15] Chart 2.5 displays information from the FRS with further disaggregation of trends. Both sources cover the UK, although will be broadly applicable to England and Wales. While not the only source, the APS is the focus here given the breadth of information published in the Employment of Disabled People (DWP, 2025) publication.
2.12. Whether looking at primary conditions only, or primary and secondary conditions, the prevalence of musculoskeletal conditions has changed little over the past decade. Around 6% of the working age population have a musculoskeletal primary condition throughout the period, rising to 9% to 10% when taking account of secondary conditions.
2.13. In contrast, the prevalence of mental health conditions has steadily increased, with the pace of increase quickening since the pandemic, though levelling off somewhat in the latest year. In FYE 2014, around 3% of working age people had a mental health condition as their primary condition, around doubling to 6% by FYE 2025. Taking account of secondary conditions, the proportion of working age people reporting such a condition increased from under 6% in FYE 2014 to 11% in FYE 2025.
2.14. The growth in reported mental health conditions, particularly as a primary condition, does not show a substantially different trend since the pandemic compared to before it. As a primary condition it shows a slowing of growth, though there is some quickening of pace when secondary conditions are included. There may, however, be some changes in the way people respond to the survey over time, in particular as autism was only introduced as an option in January 2020, and while it is not a mental health condition, some autistic people (or their proxy respondents) may have responded in that way before it became available.
Chart 2.2: trend in reported health conditions
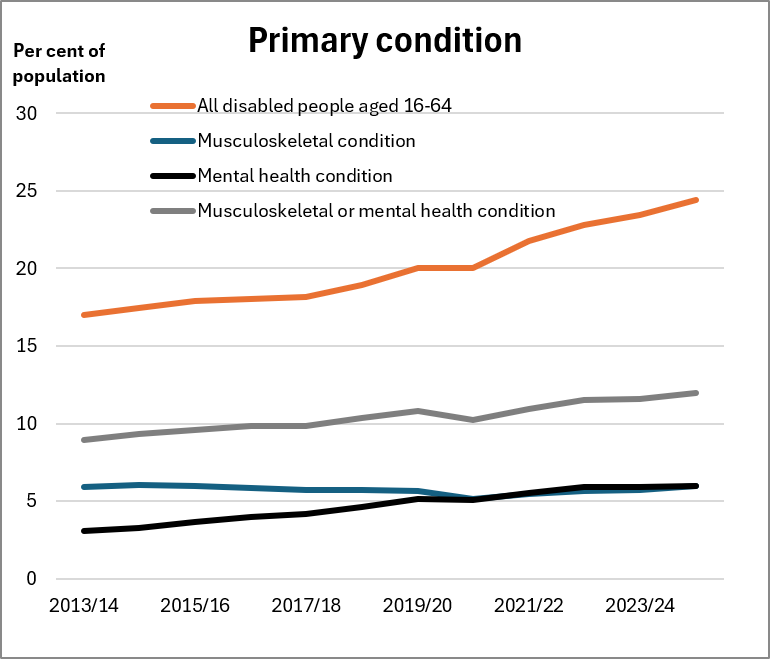
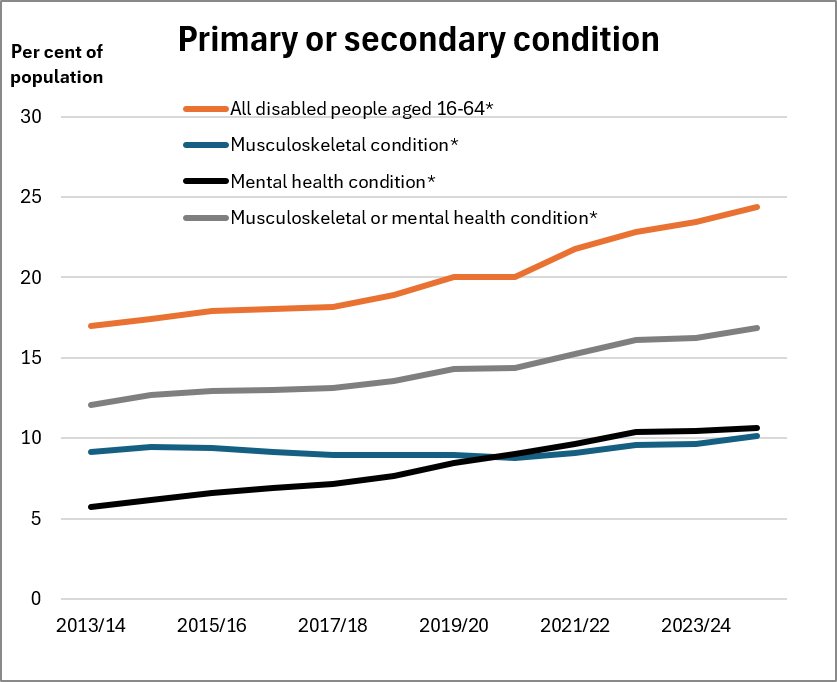
Source: Annual Population Survey via Employment of Disabled People, 2025. Figures show people with a long-term health condition or disability, aged 16 to 64, as a proportion of the population of the same age.
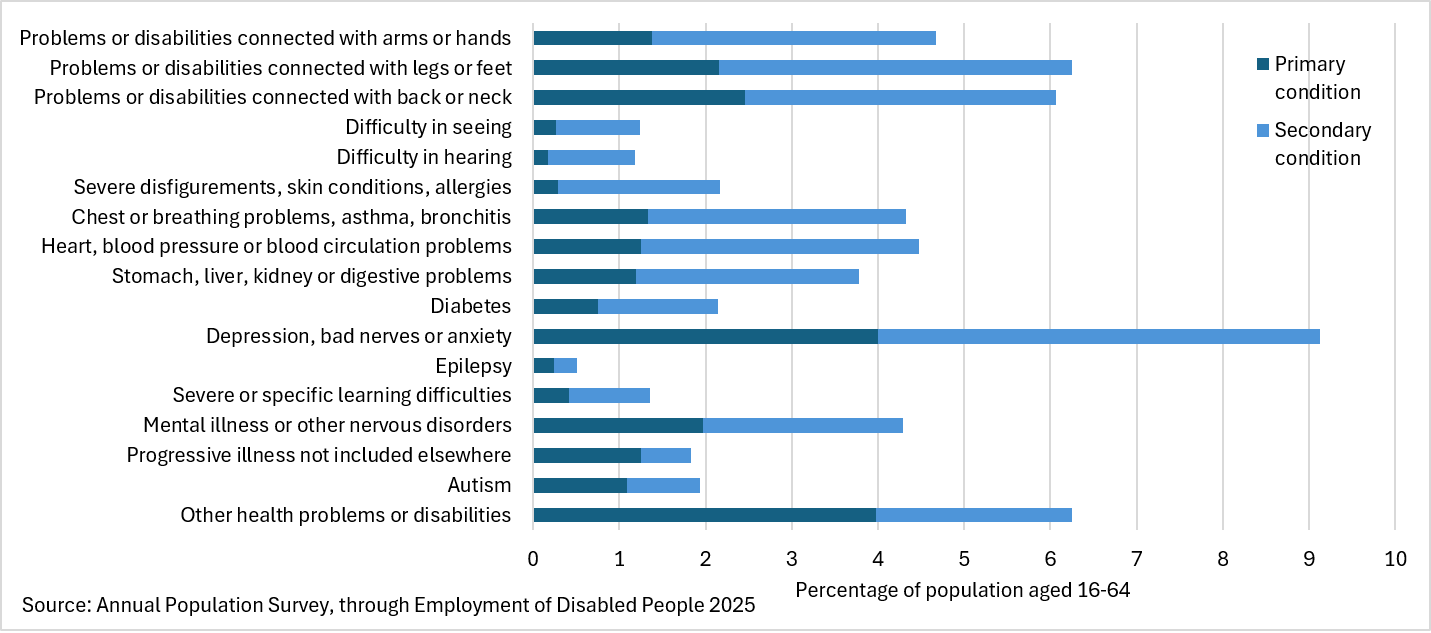
2.15. Chart 2.3 shows the fuller range of health conditions collected in the LFS, as asked of the respondents, by whether reported as a primary or secondary condition. Though musculoskeletal conditions (3 categories) and mental health conditions (2 categories) are the largest groups of conditions, substantial numbers of people report various other conditions as their primary or secondary condition.
Chart 2.3: reported health conditions 2024 to 2025
2.16. The LFS also asks respondents about whether their day-to-day living activities are limited ‘a lot’ by their health condition, giving an indication of severity of health conditions. This is shown in Chart 2.4:
- health conditions that are more likely to limit someone’s day-to-day activities ‘a lot’ include severe or specific learning difficulties, progressive illnesses (not covered elsewhere), mental illness or other nervous disorders, autism and epilepsy
- those that are less likely to limit day-to-day activities ‘a lot’ include hearing difficulties, severe disfigurements, skin conditions and allergies, and diabetes
Chart 2.4: Severity of primary health conditions
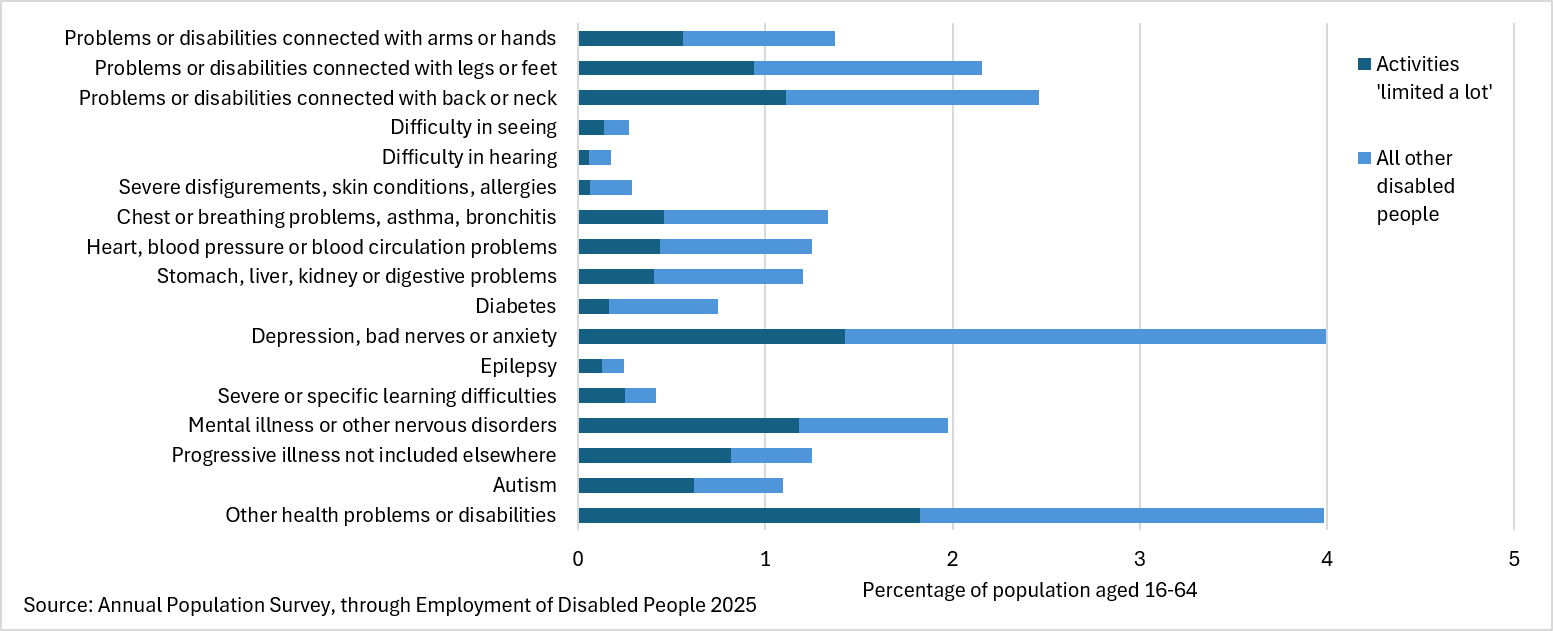
2.17. Broadly speaking, the FRS, shown in Chart 2.5, paints a similar picture to the APS data, with a particular increase in the proportion of working age disabled people reporting a mental health impairment over the period FYE 2013 to FYE 2025. There are also consistent increases in social/behavioural impairments and learning impairments. In contrast, mobility and dexterity impairments have shown a decrease in significance among disabled people.
Chart 2.5: Reported impairments – Family Resources Survey
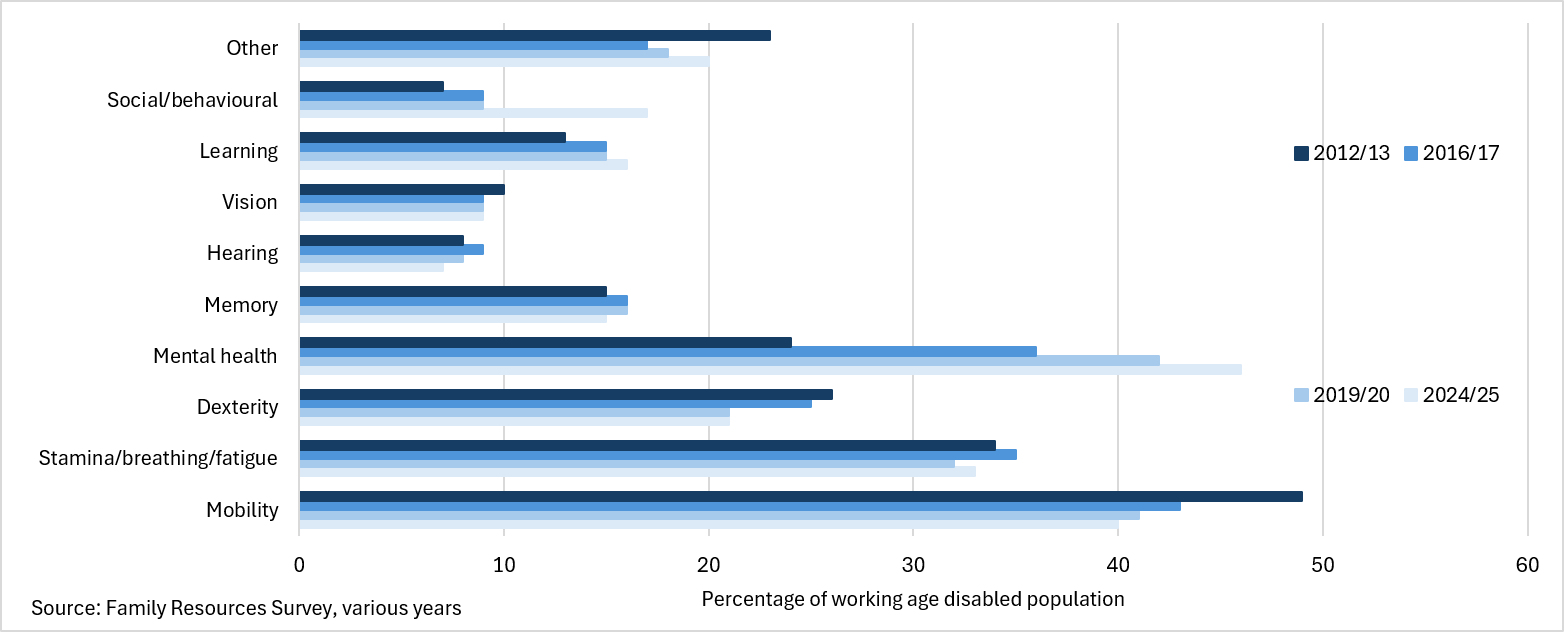
2.18. Chart 2.6 shows trends in disability by age and sex for the 3 main condition groupings shown in the APS. The prevalence of disability increases with age, women are more likely to report a limiting health condition than men, and all age groups have seen an increase in prevalence over the last decade.
2.19. The prevalence of musculoskeletal disorders increases with age, and is slightly higher for women than men, but has remained broadly flat over time. In contrast, mental health conditions and all other conditions have increased in prevalence at all ages, although the increases in mental health conditions since the pandemic have been fairly muted other than for women and for 25 to 34 year olds.
Chart 2.6: Reported health conditions by age and sex
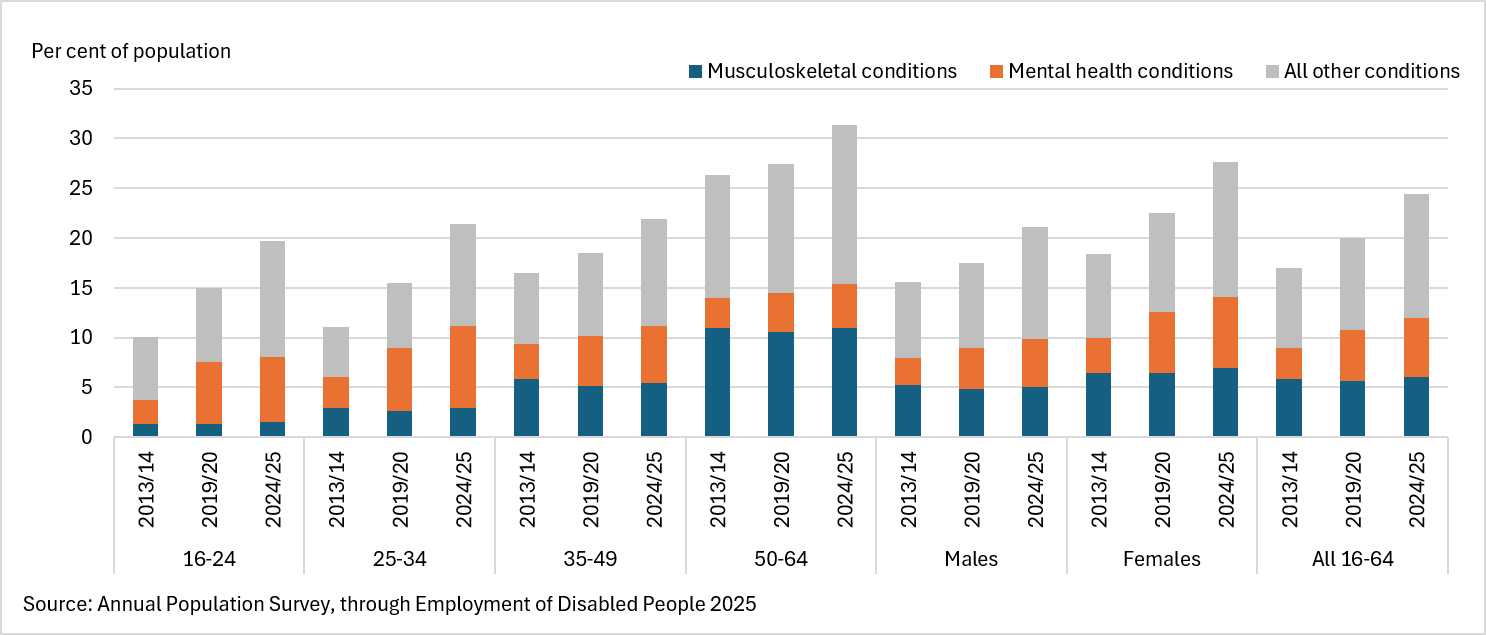
2.20. Chart 2.7 shows the number of health conditions reported by working age disabled people. The distribution is quite stable, with a slight trend observed towards people reporting only one condition prior to the pandemic, and a decline in the proportion reporting 5 or more. This may be an indicator of the increase in self-reported disability seen over this period reaching more people with fewer and/or less severe conditions.
2.21. There was a slight shift towards reporting more conditions during the pandemic, as would be expected, followed by a gradual resumption of the trend towards fewer conditions, with the distribution almost back to that seen in FYE 2020.
Chart 2.7: Number of health conditions
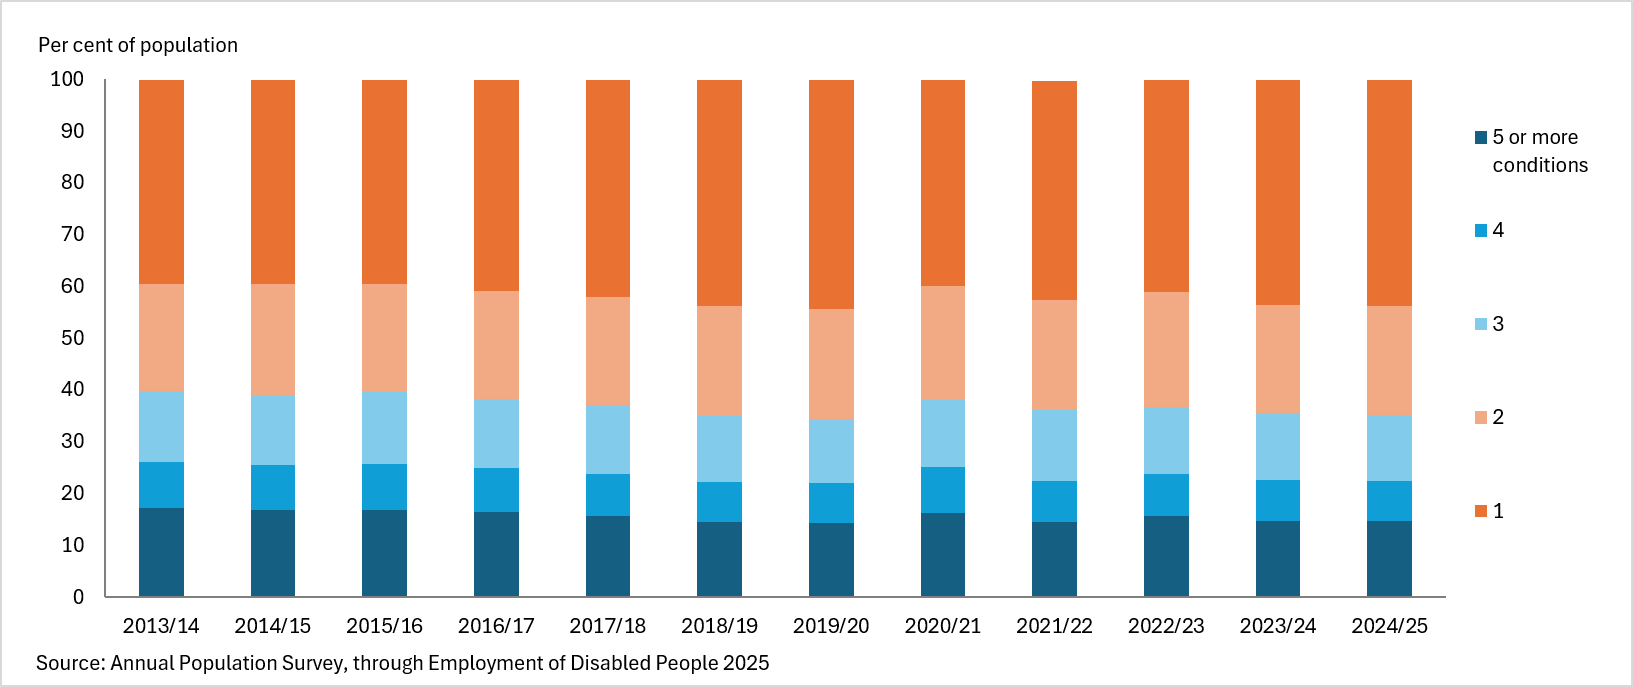
Trends in mental health and neurodevelopmental conditions
2.22. The APMS (NHS England, 2025) takes a more in-depth look at mental health conditions, including using a clinical assessment in a second stage to better identify common mental conditions in a way that is not possible with self-reporting in other, general purpose, surveys (Box 2.1 gives more detail).
2.23. Chart 2.8 shows the trends in mental health conditions for 16 to 64 year olds comparing the APS data above with the APMS. The APMS shows a much higher level of common mental health conditions than the APS – with APMS showing prevalence over double that of APS in 2024 and over triple the APS figure in 2014. The main explanation for this will be that it relates to symptoms over a much shorter period of time – the past week – but it is also likely to be picking up conditions among people who probably would not self-report them in a survey like the LFS (the survey underlying the APS). This suggests that economic and labour market circumstances could influence how people perceive themselves.
2.24. The APMS shows a steady increase in the prevalence of common mental health conditions over time, with a quickening of pace between the 2014 and 2024 surveys, although the rate of increase in this latter period is slower than for the APS mental health category (there is no APS data prior to FYE 2014). The relatively infrequent nature of the APMS means that it is not possible to determine whether the faster increase in prevalence of common mental health conditions is more concentrated post-pandemic, as suggested by the APS.
Chart 2.8: Mental health trends among 16- to 64-year-olds
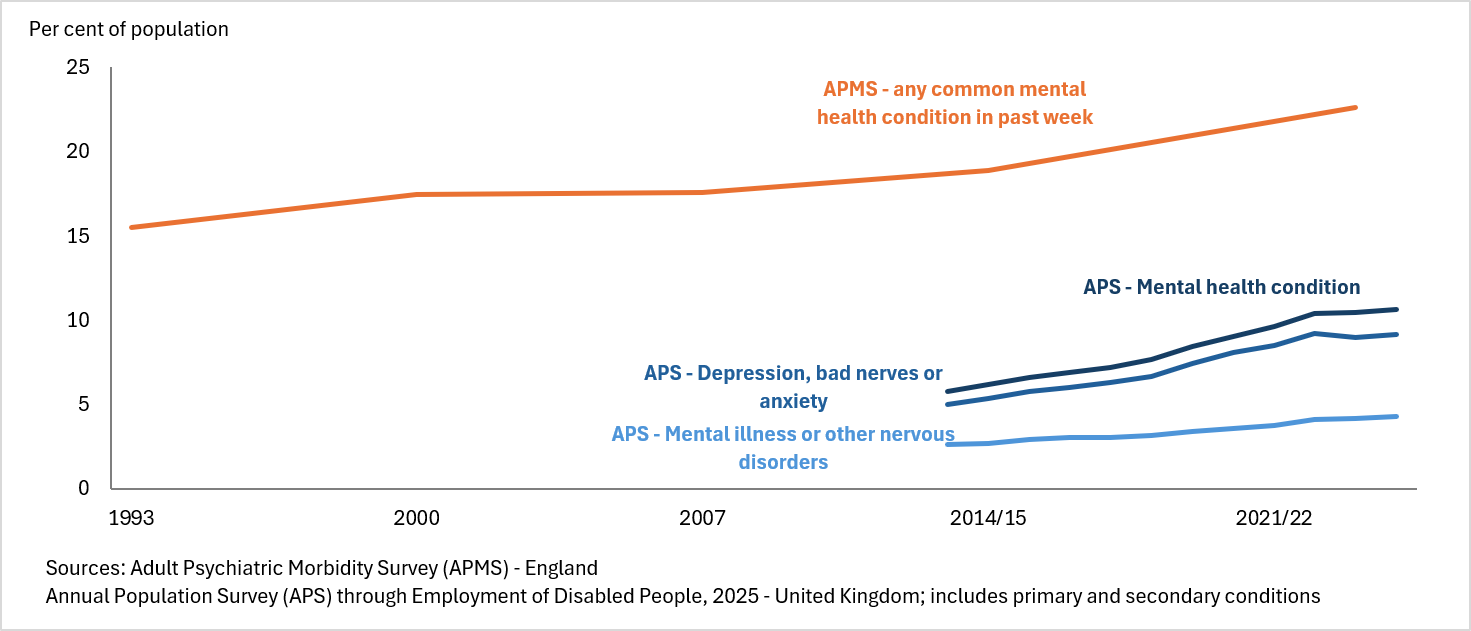
2.25. The APMS provides information on different types of mental health condition. It also screens respondents for attention deficit hyperactivity disorder (ADHD), autism and Post-Traumatic Stress Disorder (PTSD).[footnote 16][footnote 17] The prevalence of these conditions/positive screenings is shown in Chart 2.9. The increase in prevalence of common mental health conditions is broad-based, other than for those ‘not otherwise specified’, and there is a particularly steep increase in the proportion of people displaying the characteristics associated with ADHD between the 2014 and the 2024 surveys.
2.26. In contrast, the survey shows relatively little change in the estimated proportion of people with autism, at around one adult in a hundred.[footnote 18] Estimated prevalence was higher for men than for women, although the survey report also notes that the differences between them may be overstated because of the methodology. It notes “autism assessments, including ADOS, focus on observable features. This may insufficiently consider less clearly manifested autistic traits, which may be more likely among women than men. Additionally, assessments for autism may draw more on how the condition manifests in men, leading to further under identification of autism in women”. If this is the case, then the overall level of autism in the adult population would be understated, though the trend may not be affected. Furthermore, 3.4% of adults thought that they were autistic but 1.2% reported that this had been diagnosed by a professional.
2.27. The survey also estimated that the level of autism among 16 to 34 year olds fell between 2007 (when it was 1.7% of that population) and 2023 to 2024 (1.2%). As shall be seen, this is in contrast to benefit claims, where the prevalence of autism as a primary reported condition has increased, particularly for younger adults.
Chart 2.9: Trends in types of mental health and neurodevelopmental conditions
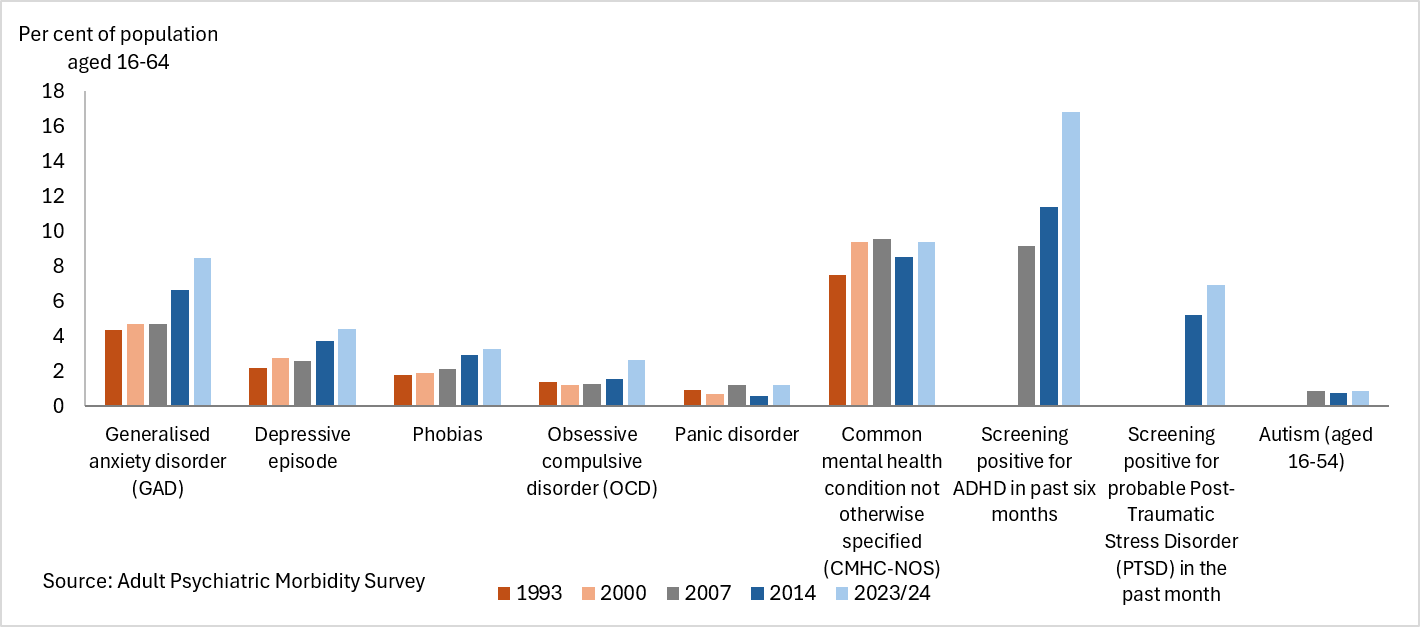
Conclusion
2.28. The general picture has therefore been of an increase in prevalence of self-reported disability among the working age population over time, with a faster increase since the pandemic. This increase has been more concentrated among mental health and neurodevelopmental conditions, with relatively little change in the prevalence of musculoskeletal conditions. For mental health conditions this picture is corroborated by the more in-depth APMS, which uses a more detailed questionnaire and clinical assessment.
2.29. There are many factors that are likely to lie behind this increase in reported prevalence of disability. Demographic change is one – the working age population has been getting on average older, as the larger cohort of the 1960s baby boomers are now in their late fifties and early sixties. However, demographic change happens slowly and is not sufficient to explain the faster increases post-pandemic. Furthermore, the various sources presented above also show increases in prevalence within smaller cohorts, especially among younger working age people.
2.30.The OBR in its Welfare Trends Report (2019) noted that “Even if survey measures were consistent within and across surveys, the decision to self-report “a longstanding illness/disability/impairment that causes difficulty with day-to-day-activities” (necessarily) is the product of: (i) actual incidence of longstanding conditions; (ii) awareness of ‘disability’; and (iii) the perceived effect of impairments in interfering with everyday life. Changes in awareness and/or the demands of everyday life could therefore lead to changes in self-reported prevalence with no accompanying change in the underlying rate of conditions”. While this report was written before the pandemic, the argument still holds, with the pandemic and subsequent developments potentially increasing the scale of all three of the factors noted by the OBR.
2.31. Resolution Foundation analysis suggests that around a quarter of the rise in the working-age disability caseload between 2013 and 2023 is linked to the increasing state pension age and the UK’s growing, ageing population. The Foundation also highlights a broader trend: more working-age adults are reporting a disability, as illustrated in Chart 2.1. Additionally, they note that the cost-of-living crisis has made health-related benefits more vital to household incomes than in the past, contributing further to the rise in caseload (Judge and Murphy, 2024).
References in Chapter 2
Department for Work and Pensions (2025) The employment of disabled people 2025. London: DWP. Available at: The employment of disabled people 2025
Judge, L. and Murphy, L. (2024) Under strain: investigating trends in working-age disability and incapacity benefits. London: Resolution Foundation. Available at: Under strain Resolution Foundation
Latimer, E., Ray‑Chaudhuri, S. and Waters, T. (2025) The role of changing health in rising health‑related benefit claims. London: Institute for Fiscal Studies. Available at: The role of changing health in rising health-related benefit claims, Institute for Fiscal Studies
NHS England (2025) Adult Psychiatric Morbidity Survey: Survey of mental health and wellbeing, England, 2023/24. Available at: Adult Psychiatric Morbidity Survey: Survey of Mental Health and Wellbeing, England, 2023/4 - NHS England Digital
Office for Budget Responsibility (2019) Welfare trends report. London: OBR. Available at: Welfare Trends Report
3. Trends in working age disability benefits
3.1. This chapter focuses on the trends in working age disability benefits – expenditure and number of recipients, and the flows onto and off the benefits, along with changes in average awards. As DLA has been replaced by PIP for some claimants, but not all, it is important to look at the 2 together.
3.2. We first take a brief look at disability benefits for children and for people aged over state pension age: the former is a feeder for working age benefits, the latter is both a consequence of claims made by people of working age, and important too to isolate as the design of PIP, and DLA before it, mean that people above pension age account for a significant growth in both benefits.
3.3. We then look at expenditure and caseload trends, by key dimensions, and the forecast outlook for these. We round off by sub-dividing caseload trends into trends in inflows (registrations, new awards and reassessments) and those who leave the benefit (outflows).
3.4. Throughout this analysis the scope is limited by the availability of data for analytical purposes. PIP data has a broader functionality than DLA data, but it is the latter which limits the extent to which meaningful comparisons can be made over time. All analysis in this chapter is for England and Wales only for all years, in line with DWP’s current responsibilities for disability benefits, unless otherwise stated.[footnote 19]
Box 3.1: Disability benefits above state pension age
Up until November 2018, when state pension age for men and women was equalised at age 65, a new claim for DLA or PIP could only be made by someone aged under 65, or men’s state pension age. Since then, this maximum qualifying age has been linked to state pension age, reaching 66 in October 2020, and due to rise to 67 in a phased approach from April 2026 to March 2028.
Once a claimant reaches this maximum qualifying age, they retain their award of DLA or PIP until their circumstances change. They can request a review and potentially increase their care or daily living award if their condition deteriorates, but if they have a mobility component this remains unchanged (bar the annual uprating) until they leave the benefit, and they cannot claim for a mobility component if they do not already have one. There are exceptions to this rule for claimants who have been or are due to be reassessed under the ‘full PIP rollout’ programme.
People making a new claim for a disability benefit over the DLA/PIP maximum qualifying age can claim AA, which structurally is the same as the PIP daily living component, though the entitlement criteria are different.
This design feature amplifies observed growth rates on these benefits, particularly in their early years. When PIP was introduced in 2013, the age range for the PIP caseload was confined to 16 to 64. By 2023, the oldest PIP claimants were aged 74 – so the age range of PIP recipients (as opposed to new claimants) had widened by 10 years – a significant increase in eligibility. However, far fewer claimants in this age bracket would now be receiving DLA as a result. Since a PIP or DLA claimant cannot also claim AA, it also follows that growth in the number of PIP claimants above the maximum qualifying age will, all else equal, act as a downward pressure on the number of AA claims.
The maximum age for a PIP recipient will continue to rise by one year every year. So growth in the number of claimants and expenditure, particularly in the early years of PIP (and DLA before it), is pushed up. Including people over the maximum qualifying age in an analysis of trends would tend to overstate the underlying trend growth.
Expenditure
3.5. Chart 3.1 shows expenditure on disability benefits by various measures, sub-divided into children, people of working age, and people above state pension age. Chart 3.2 narrows down to expenditure on people of working age. Expenditure is forecast for the FYE 2026 up to FYE 2031. Forecasts are based on Spring Statement 2026 data, published in ‘Benefit expenditure and caseload tables 2026’ (DWP, 2026), and summarised in ‘Economic and fiscal outlook’ (OBR, 2026).
3.6. The first panel of Chart 3.1 shows spending in nominal terms for the 3 broad age groups, and also in real terms for all ages, which takes out the effect of inflation and is better for considering trends over longer periods of time. As inflation[footnote 20] has been positive in almost all years covered, expenditure in real terms shows slower growth than nominal expenditure.
3.7. The second panel of Chart 3.1 first shows year-on-year growth in disability benefits spending, in real terms. The panel also shows spending as a share of gross domestic product (GDP – broadly the size of the economy) and Total Managed Expenditure (TME – the total of government spending). These provide a better indication of the affordability and sustainability of different elements of public expenditure. Both measures are affected by both the size of the numerator (expenditure on disability benefits) and the denominator (GDP or TME). GDP is directly affected by changes in the economic cycle, so at times of recession disability benefit expenditure rises as a share of GDP, all else equal – with the spike in the share in FYE 2021 as the pandemic took hold particularly obvious. TME does have some elements related to the economic cycle, but also has a significant proportion where movements are the result of government choices. In this case disability benefits spending as a share of TME fell during the pandemic as a result of the significant discretionary support to the economy at that time.
3.8. Setting aside short-term perturbations, both panels show faster growth in disability benefits since the pandemic than before it, with most of that additional growth occurring among working age claimants:
- in the 10 years from FYE 2010 to FYE 2020, disability benefits spending on working age people grew by an average of 5.2% a year, in real terms. Over the next 5 years to FYE 2025, this doubled to 10.6%, and is forecast to be 6.4% a year for the next 6 years
- disability benefits spending on children grew by an average of 5.0% a year in the 10 years to FYE 2020, and 11.8% in the 5 years since, in real terms. It is forecast to grow by 8.2% a year to FYE 2031.
- in contrast, disability benefits spending on people over state pension age grew by 0.1% a year in the 10 years to FYE 2020 in real terms, rising to 3.1% a year for the 5 years to FYE 2025. It is forecast to grow by 3.6% a year for the next 6 years.
3.9. Similar patterns are seen as a share of GDP or TME. Total disability benefit spending was around 1.0% of GDP throughout the 2010s. It then rose to 1.4% of GDP in FYE 2025 and is forecast to reach 1.8% by FYE 2031. Disability benefit spending accounted for 2.1% of TME in FYE 2010, rising to 2.6% by FYE 2020, 3.2% in FYE 2025, and is forecast to reach 4.1% of TME in FYE 2031.
Chart 3.1: Expenditure on disability benefits
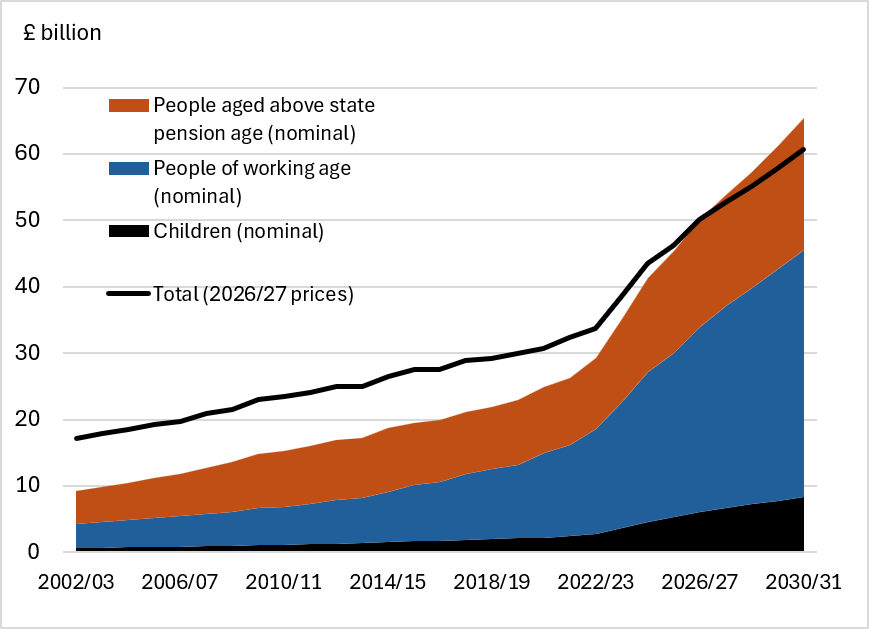
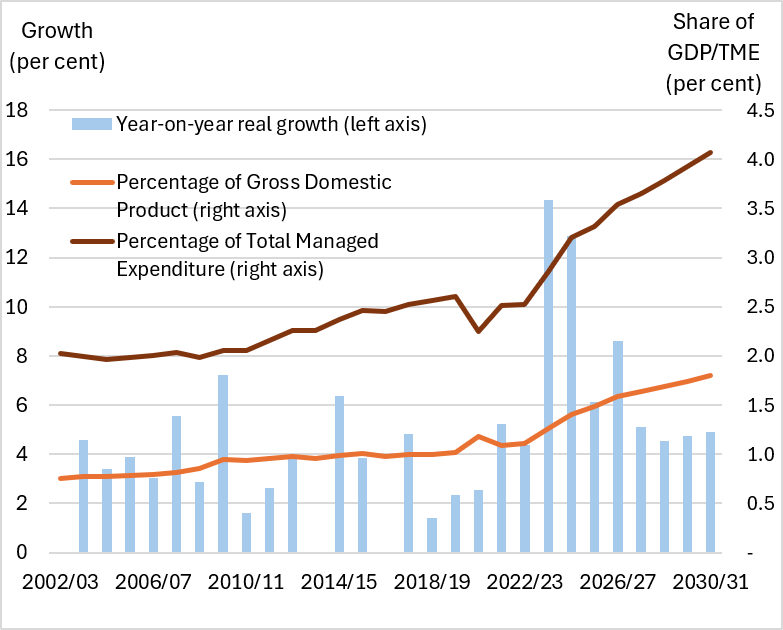
3.10. The first panel of Chart 3.2 shows disability benefits spending on working age people, in nominal and real terms, the nominal series illustrating the transition from DLA to PIP. DLA reduced significantly from 2014 to 2019 as claimants had their entitlement reassessed as part of the ‘full PIP roll-out’ programme. This was paused at the onset of the pandemic and has not yet been resumed. Small numbers of claims have been reassessed where the claimant has requested it, and currently, DWP plan to complete the reassessment by 2030.
3.11. While real PIP expenditure increased faster than the previous DLA trend up to the pandemic, the growth in expenditure quickened substantially following the pandemic.
3.12. The second panel of Chart 3.2 again shows the year-on-year changes in disability benefit spending on working age people. These growth figures are quite erratic from year to year but sustain a higher average level since the pandemic than before it.
3.13. Disability benefit spending on working age people rose from 0.4% of GDP in FYE 2010 to 0.5% in FYE 2020. It then accelerated to 0.8% of GDP in FYE 2025 and is forecast to reach 1.0% of GDP in FYE 2031.
3.14. Similarly, having been 0.8% of TME in FYE 2010, disability benefit spending on people of working age is forecast to reach 2.3% of TME by 2031.
3.15. Up to FYE 2017, more was spent on disability benefits for people over state pension age than for people of working age, but since then, working age spending has been higher. By 2FYE 2031, it is forecast that spending on disability benefits for working age people will be almost double that for people above state pension age.
Chart 3.2 Expenditure on working age disability benefits
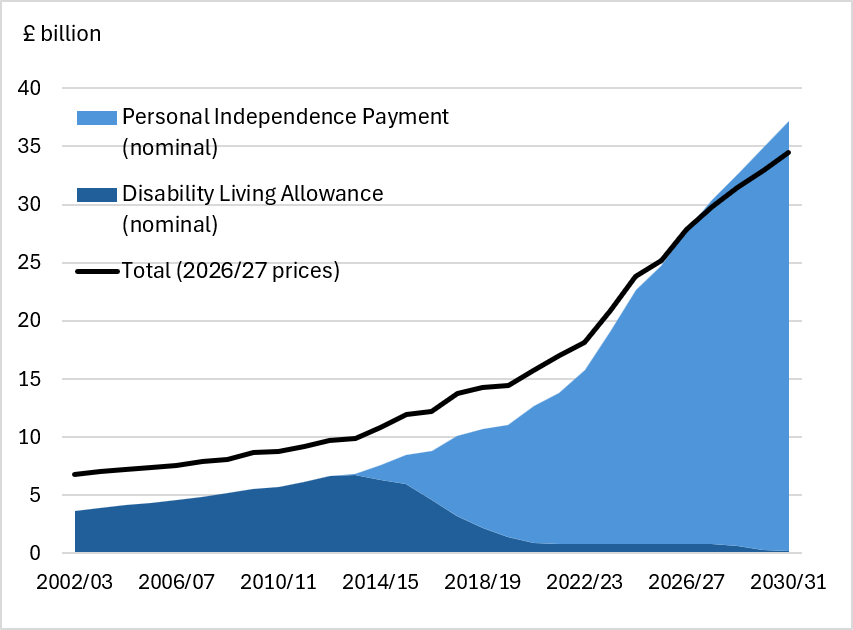
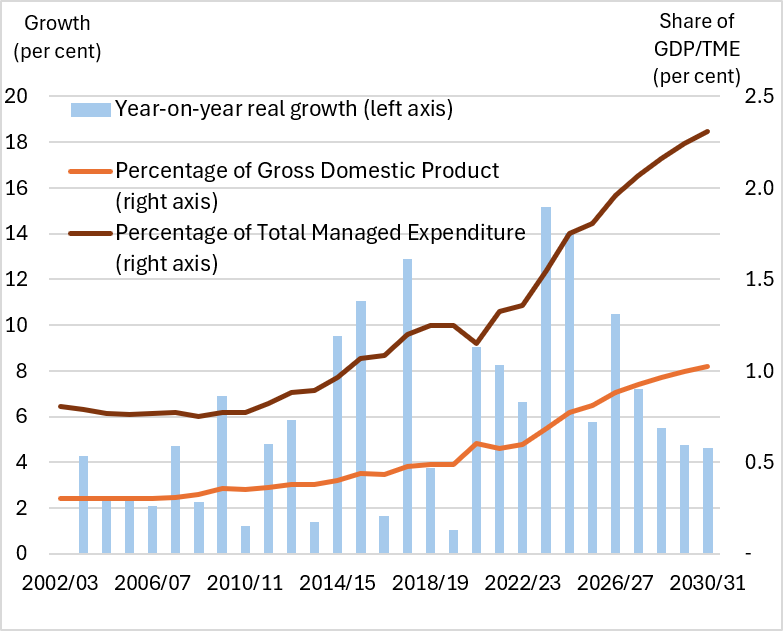
3.16. The trends in spending for both people of working age and for those above pension age have been affected by changes to state pension age, and during the forecast period will be affected by the further rise in state pension age to age 67. These changes will tend to dampen growth in spending above pension age, and boost spending for people of working age. This is discussed further in Box 3.2.
3.17. Nevertheless, even taking account of changes to state pension age, growth in working age disability benefits spending is significantly above the growth in the economy. While the sustainability of any individual category of government spending cannot be considered in isolation from the other demands on the public finances, the OBR in their annual Fiscal Risks and Sustainability Report identify several major areas of public spending that are set to grow considerably in the future, in the absence of a change in policy, suggesting that it would be hard to continue to absorb such increases in disability benefits spending as well (OBR, 2024).
Box 3.2: how changes to state pension age affect measures of disability benefits’ caseload and spending
Changes to state pension age affect the trends in spending, and caseload, of both working age and over state pension age claimants of disability benefits. This is despite, up to 2018, the maximum qualifying age for DLA and PIP being fixed at 65. There are 3 main factors at play here:
- a classification effect: the individual ages that are counted as working age, and above state pension age, change over time – even if the benefit rules are not linked to state pension age, as was the case for DLA and PIP up to November 2018. So up to March 2010, disability benefits paid to women aged 60 to 64 would have been counted as ‘above pension age’. In November 2018, disability benefits paid to this age group would all be counted as for ‘people of working age’.
- a benefit design effect: once the maximum qualifying age was linked to state pension age, and it rose further to age 66, new awards of PIP could be made to people aged 65, resulting in a genuine increase in expenditure, over and above the recipients aged 65 who received PIP as a result of claiming before 65. This would be partly offset by no awards to AA among 65-year-olds.
- a behavioural effect: there is some evidence that reaching state pension age reduces the likelihood of claiming a disability benefit, perhaps because the State Pension and Pension Credit are paid at higher rates than Universal Credit and its predecessors. While, in 2009 women were around 1.5 percentage points more likely to receive a disability benefit in their late fifties than men of the same age, and this gap had widened from 1.1 percentage points at age 50, the gap then narrowed significantly across the sixties age range, to 0.6 percentage points by age 65. By 2016, when women’s pension age was 63, the gap between men and women’s rate of receipt started narrowing significantly after age 62.
The classification effect is by far the largest of the 3 factors above – expenditure which would have happened anyway, but is just counted differently because of the change in state pension age.
We estimate around £1.3 billion went to working age claimants in FYE 2020 who were aged above the March 2010 state pension age, covering almost 240,000 claimants. In FYE 2025, we estimate this figure to have risen to almost £3 billion.
Without the change in state pension age, the average real annual growth in spending on people of working age would have been 4.0% between FYE 2010 and FYE 2020 (compared with 5.2% in reality), and 10.3% between FYE 2020 and FYE 2025 (compared with 10.6%). The relatively small difference in the annual growth for the 5 years to FYE 2025 reflects the fact that state pension age was already increasing during FYE 2020, so is not the impact of a full year.
As an indication of the possible effect of the further rise in state pension age to 67, around £700 million of PIP and DLA spending currently goes to people aged 66. This is around 3.1% of expenditure on people of working age, compared to an overall forecast real growth in expenditure in the next 5 years of 45%.
Caseload
3.18. Unsurprisingly, caseloads show a similar picture to expenditure. Chart 3.3 shows the caseload trends across all 3 disability benefits combined, for the 3 different age groups, while chart 3.4 focuses on people of working age.
3.19. Again, we see faster growth in disability benefits caseloads since the pandemic compared to before it, and with that increase in growth concentrated among working age claimants:
- in the 10 years from FYE 2010 to 2020, working age recipients of disability benefits increased from 1.6 million to 2.0 million, a period which included the equalisation of state pension ages at 65, and some of the further increase in state pension age to 66 – between them accounting for almost 240,000, over half of the increase. Over the next 5 years to FYE 2025, the number of recipients increased to 3.1 million, and is forecast to reach 4.4 million by FYE 2030. In these latter 2 periods, state pension age has much less of an effect: the remainder of the increase to 66 added around 30,000 to the caseload; the further rise to 67 is likely to add a further 100,000 or so
- the number of children receiving disability benefits increased from almost 300,000 in FYE 2010 to 465,000 in FYE 2020. The rate of increase then quickened, with recipients reaching 760,000 by FYE 2025, and they are forecast to reach almost 1.2 million in FYE 2031
- recipients among people over state pension age have shown quite a different trend, falling from 2.4 million in FYE 2010 to 2.1 million in FYE 2020 – broadly in line with the effects of state pension age changes.[footnote 21] The number of recipients then rose back to 2.5 million by FYE 2025, and is forecast to reach 3.0 million in FYE 2031
3.20. Since the size and structure of the population changes over time, it is also informative to consider what proportion of the relevant population are receiving a disability benefit, as shown on the righthand panel of Chart 3.3. Unsurprisingly, people aged above state pension age are much more likely to receive a disability benefit than those aged under state pension age, but the proportion of pensioners receiving one of these benefits was similar in FYE 2025 (22.5%) to what it was in FYE 2010 (22.3%), having been lower in between. This is despite changes in pension age taking the youngest out of the group, who have a lower rate of receipt of disability benefits than older pensioners.
3.21. While the proportion of people of working age and of children who receive disability benefits remains much lower than among pensioners, the prevalence of disability benefit receipt for both groups has increased steadily, and at a faster rate since the pandemic:
- the proportion of people of working age who were in receipt of a disability benefit increased from 4.6% in FTE 2010 to 5.4% in FTE 2020. Equalisation and increases in state pension age will have contributed to this, as it extends the upper end of the age range, where prevalence of disability is higher than at younger ages. The proportion in receipt has since increased much more rapidly – to 7.9% of the working age population, and is forecast to reach 10.9% by FYE 2031
- the proportion of children in receipt of disability benefits increased from 2.8% in FYE 2010 to 4.2% in FYE 2020, and has again increased more rapidly since, to 6.8% in FYE 2025, and is forecast to reach 11.4% of the population by 2031 – more than closing the gap in receipt with people of working age
3.22. The first panel of Chart 3.4 more clearly illustrates the picture for working age disability benefits, including the transition from DLA to PIP. This transition occurs through:
- new claims being to PIP, while DLA claims leave or reach state pension age ceasing to be counted as working age
- ‘natural migrations’ as a result of the claimant applying to PIP
- ‘managed migrations’, where claimants were invited to apply for PIP. This was known as ‘full PIP rollout’, the process was paused at the start of the pandemic. Full PIP rollout is currently planned to resume in 2028
- by the end of March 2025, 1.4 million working age claimants in England & Wales had had DLA reassessment claims to PIP cleared[footnote 22]
3.23. Chart 3.4 also illustrates the findings of the OBR’s Welfare Trends Report where following the introduction of PIP, the working age caseload increased rather than decreased, with a step up in the 2 years immediately following the introduction of PIP, possibly reflecting increasing eligibility for certain groups, and/or the publicity created by its introduction. Then the previous trend resumed up until the pandemic, although during this period the reassessment of existing DLA claimants will have exerted downward pressure on the rate of growth. Also evident is the faster year-on-year growth since the pandemic, which is forecast to reduce over the next 5 years, though only to a rate that is around double what was seen in working age DLA up to FYE 2013.
Chart 3.3: Disability benefits caseload
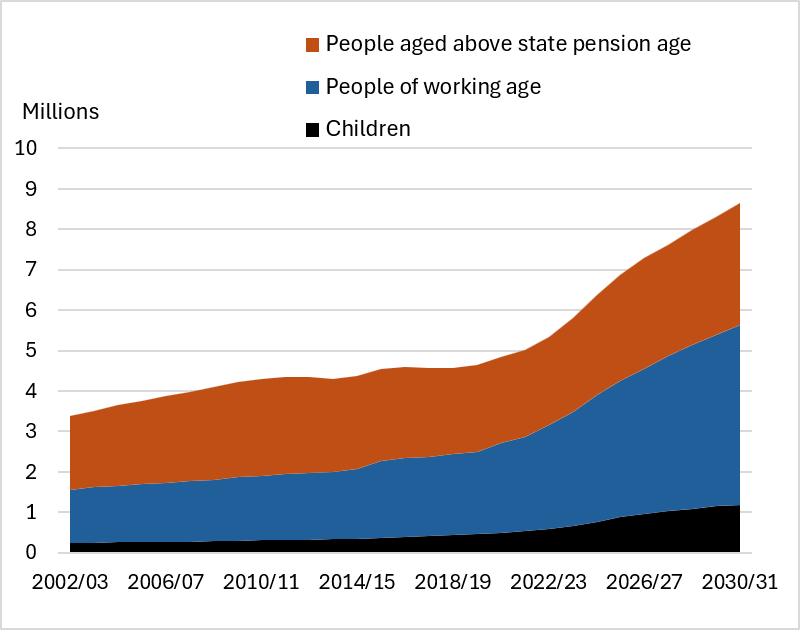
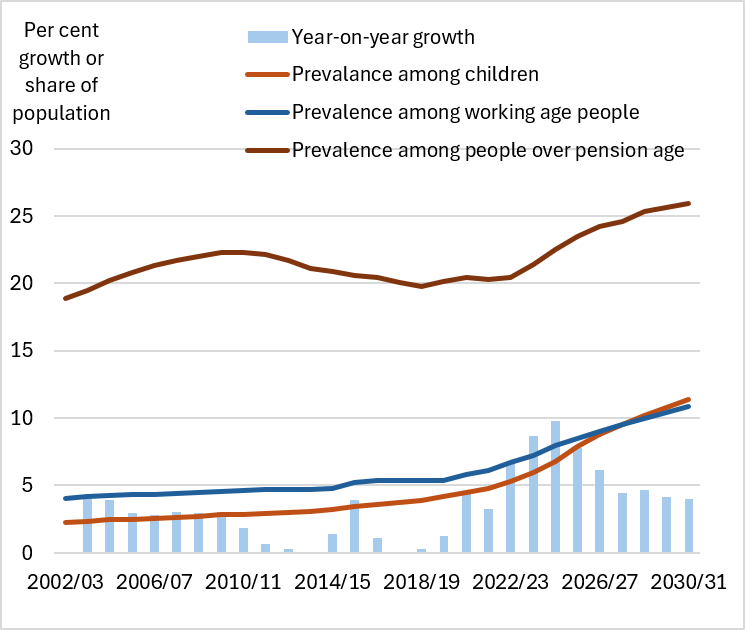
Chart 3.4: Working age disability benefits caseload
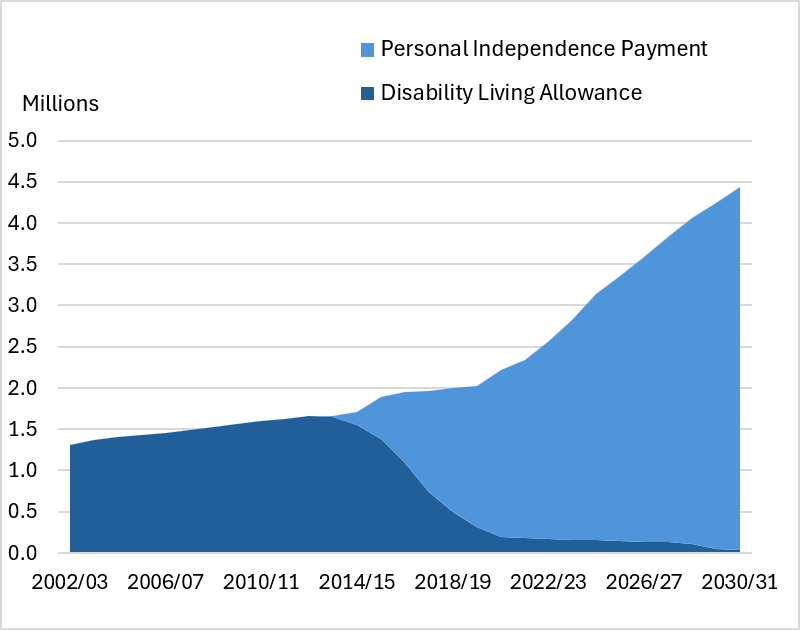
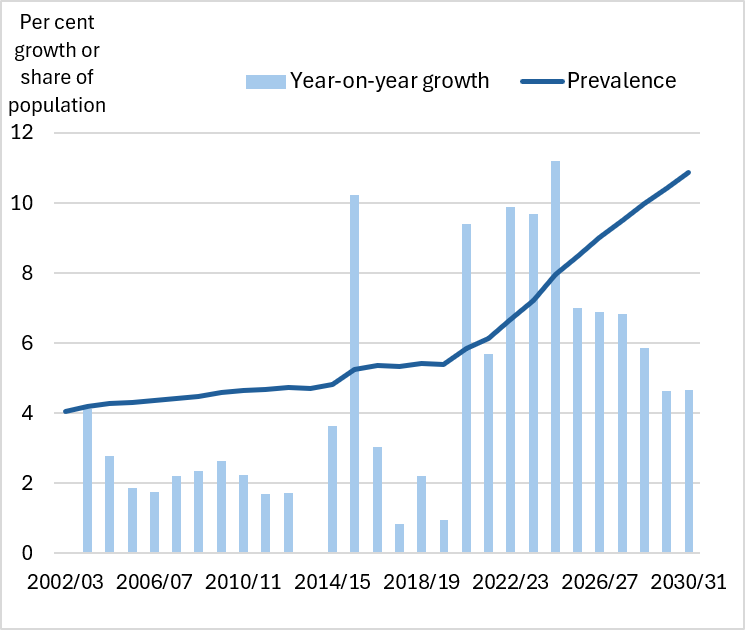
Age and gender
3.24. Charts 3.5 and 3.6 show how receipt of disability benefits have changed over the past 15 years, by age and gender.
3.25. Chart 3.5 shows prevalence – the percentage of the population receiving a disability benefit. This shows that prevalence has increased for most age groups and among both genders over the whole period, but also that prevalence increased much more in the 6 years between 2019 and 2025 than it did in the preceding 10 years. Between 2019 and 2025, the increase in prevalence was almost 5 times that of the preceding 10 years, but in little over half the time. It also shows that the increases in prevalence have been most marked amongst the youngest age group – those aged 16 to 19, but the increase for those aged in their thirties has also been higher than for the groups either side. Between 2009 and 2019, there was barely any change in prevalence for men in their forties and fifties, and for men aged 60-64, it actually fell.
3.26. Additionally, prevalence has increased more among women than men. While women are less likely to receive disability benefits in their teens and twenties, the difference between men and women at those ages has narrowed, while from the thirties upwards, the prevalence of receipt among women has increased faster than for men.
3.27. Chart 3.6 shows the average annual increase in disability benefit receipt, by age and gender. Some age groups will be particularly affected by demographic changes, so the ageing of the 1960s baby boomers will tend to flatten growth in the 50 to 59 age group in the 2019 to 2025 period as many of these reached 60 during that 5 year period, and push up growth among the 60 to 64 age group. In the 10 years to 2019, the number of claimants in their forties fell as a result of the large reduction in births in the 1970s, but the increase in births following the low point in 1977, would then contribute to the rise in claimants in this age group from 2019 to 2025.
3.28. Women, and to a lesser extent men, aged 16 to 19 showed the fastest increase, although starting from a lower than average base. The contrast between the 2 periods shown was also greatest for this age group. But there was also a significant acceleration in growth for women in their twenties and thirties, which was less apparent for men.
Chart 3.5: Disability benefits prevalence, by age and gender
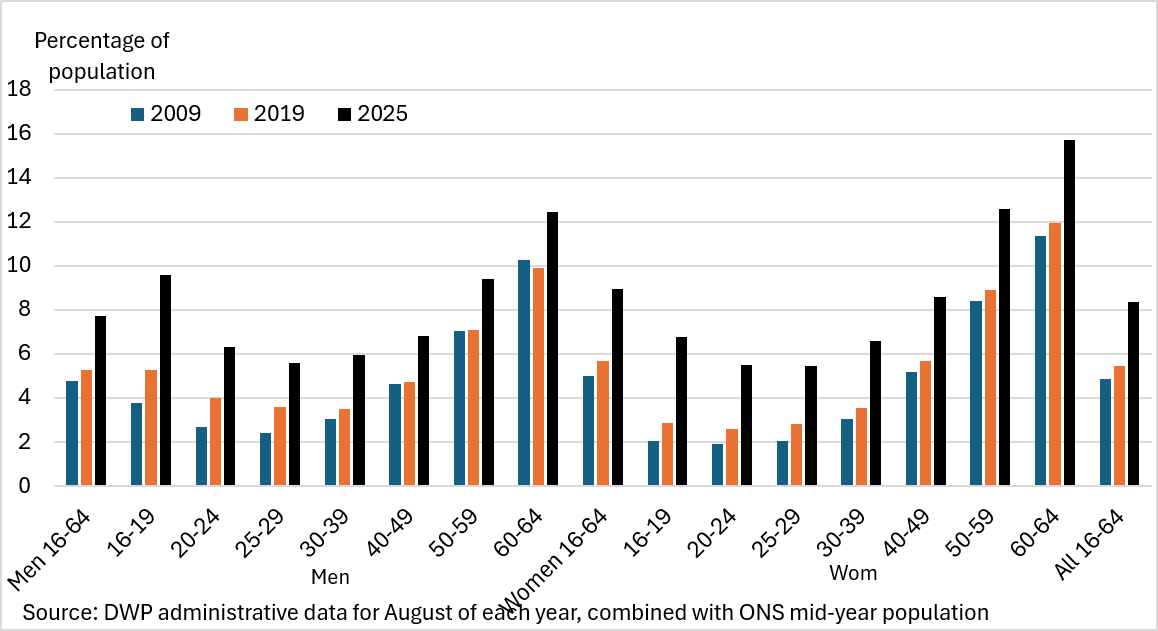
Chart 3.6: Growth in disability benefits, by age and gender
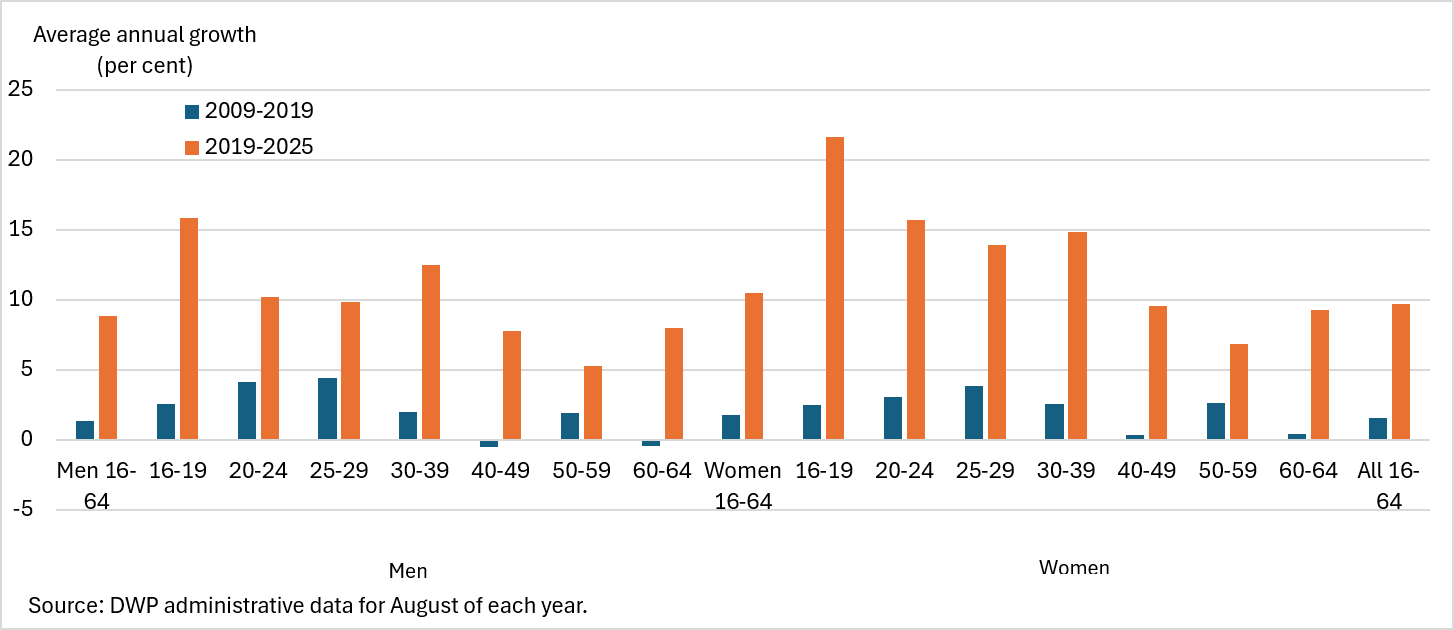
Condition
3.29. Charts 3.7 and 3.8 show how the primary reported condition among working age claimants has changed over the past 16 years. In interpreting this information, 2 key caveats need to be borne in mind:
- around three-quarters of PIP claimants report more than one health condition, and a large proportion report several.[footnote 23] It is possible that the ‘primary’ condition is not the one that has the most impact on the claimant – we do not have details of how systematically assessors and decision makers approach recording of conditions – and it is also possible that the condition with the most impact changes over time. It also means that the primary condition may not be the determining condition for both components of PIP or DLA – the condition most affecting a claimant’s daily living experience may not be the one that causes mobility difficulties, or vice versa
- how conditions are recorded changes over time. This is particularly true of mental health and neurodevelopmental conditions that have become more recognised in recent years. A change in how conditions are recorded for the inflow of claimants will only slowly impact on the number of claimants seen in the stock. Conditions in PIP and DLA are also recorded differently.[footnote 24] The impact of this is evident in the ‘all other psychiatric and neurodevelopmental conditions’, especially at the start of the series. At least part of the fall in the prevalence of conditions in this category will arise from the separate recognition of anxiety and depression, and autism in the system
3.30. Bearing these points in mind, it appears that mental health conditions and autism have increased significantly over the period, and particularly since the pandemic. In contrast, the 2 main musculoskeletal conditions have increased only slowly, and given the age profile of the claimants reporting these conditions, will be more affected by demographic change than the mental health and neurodevelopmental conditions.
Chart 3.7: Disability benefits prevalence by primary reported condition
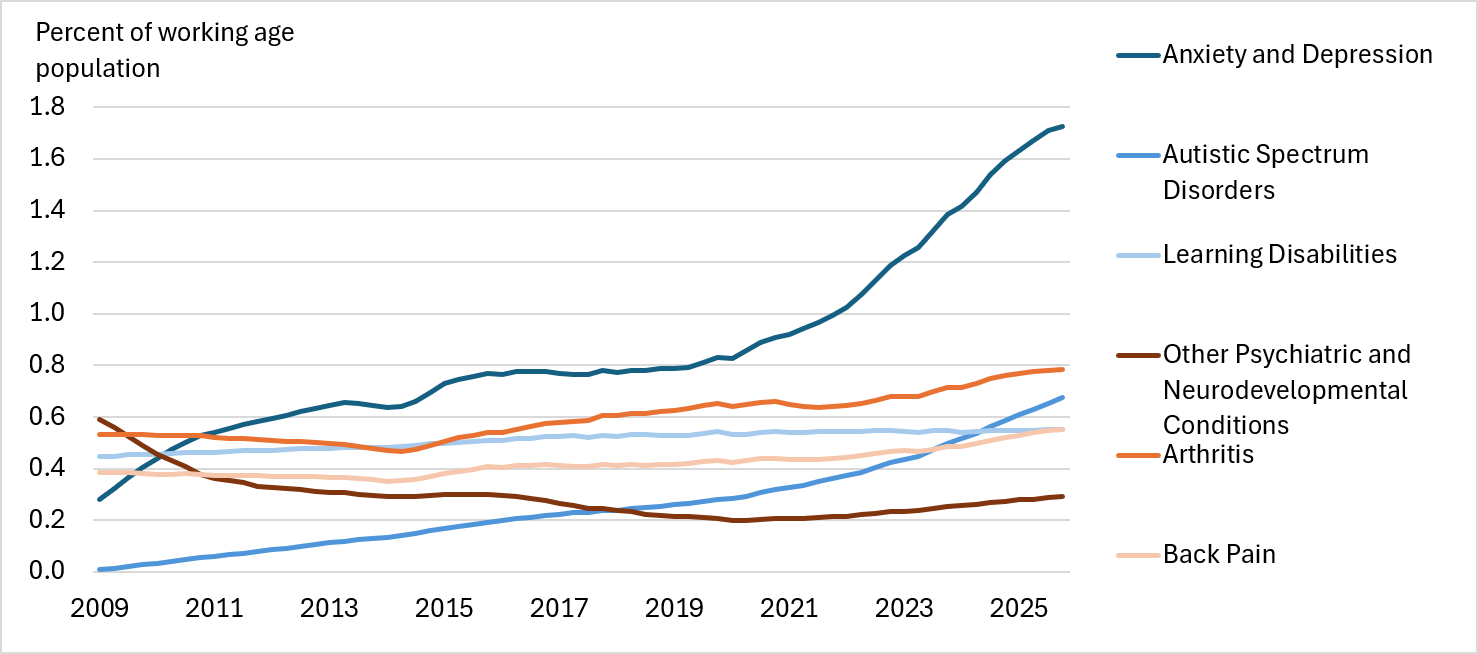
3.31. Chart 3.8 shows the trends in prevalence for selected primary conditions, by age group. Care needs to be taken in comparing different conditions as they are not shown on a uniform scale; the interval between the data points is 10 years then 6 years, and the August 2009 data for the oldest group covers men aged 60 to 64 only. Main points are:
- the drop in all other conditions between 2009 and 2019 is likely to be due to more specific classification of health conditions
- anxiety and depression has increased across the age range, with the highest prevalence among those aged 35 to 59. Between 2009 and 2019, the largest increases were among people in their fifties, while since the pandemic, the biggest increases have been for people aged 30 to 44. The largest relative increases (compared to their original level) have been among the under 25s, although as a share of the population, the increase among this age group is still lower than for those aged 30 to 44
- arthritis and back pain increase with age, and there has been relatively little change in either
- there has been particularly sharp growth in autism at younger ages in the past 6 years (some of the growth in the previous 10 will be a result of changes in recording). Very few people report autism as a primary condition among the older age groups.
- learning disabilities decline with age, but have shown a small increase across all groups from age 20 upwards. There has not, however, been a noticeable quickening of pace of growth since the pandemic. Among 16 to 19 year olds, the prevalence of learning disabilities as a primary condition has fallen
3.32. The lack of data on secondary conditions places a limitation on this analysis, as part of the observed trend may simply reflect an increasing tendency to place certain conditions as primary conditions above others that have a similar impact on the claimant.
Chart 3.8: Disability benefits prevalence by age and condition
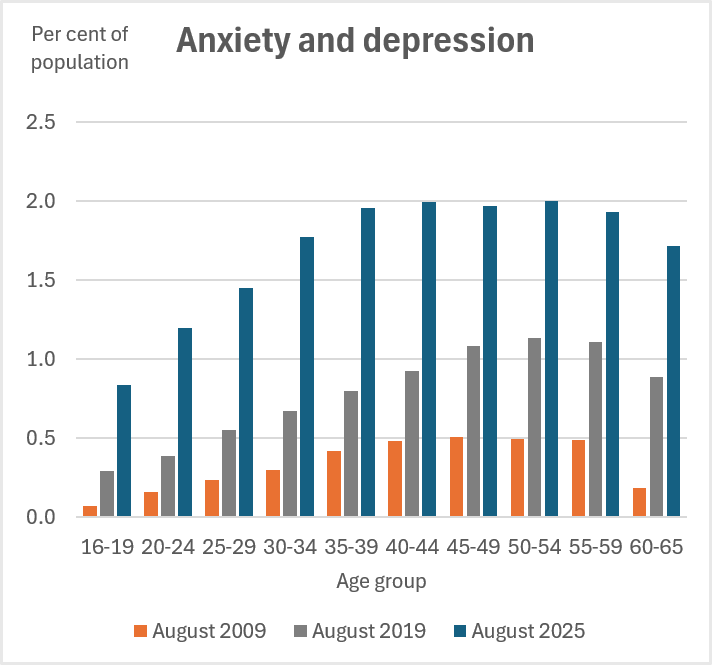
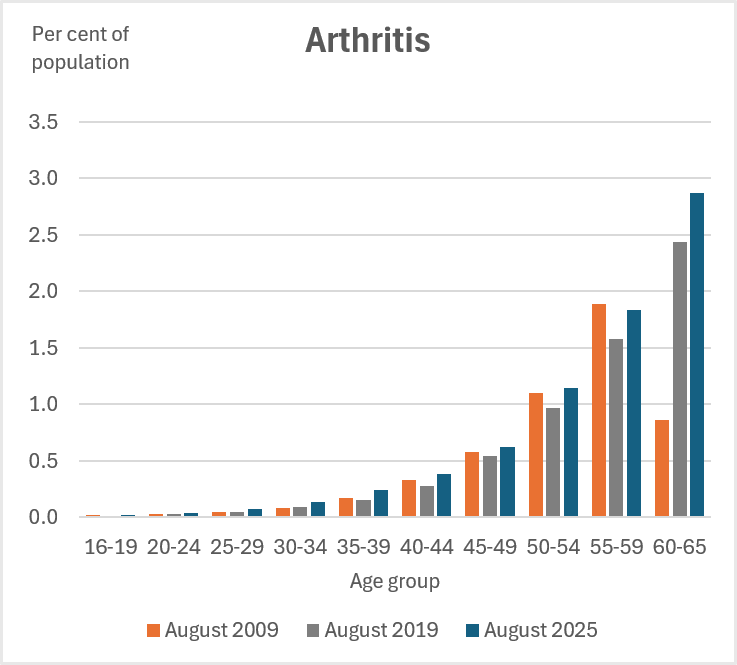
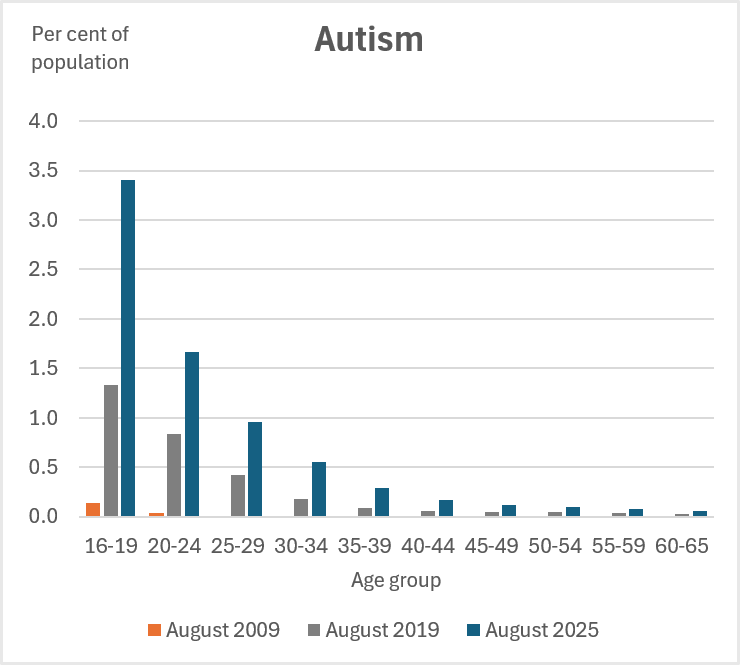
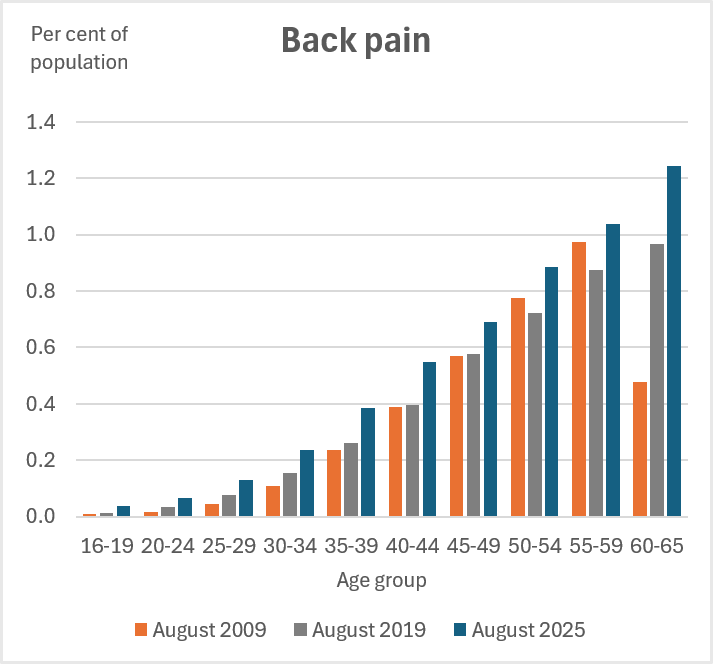
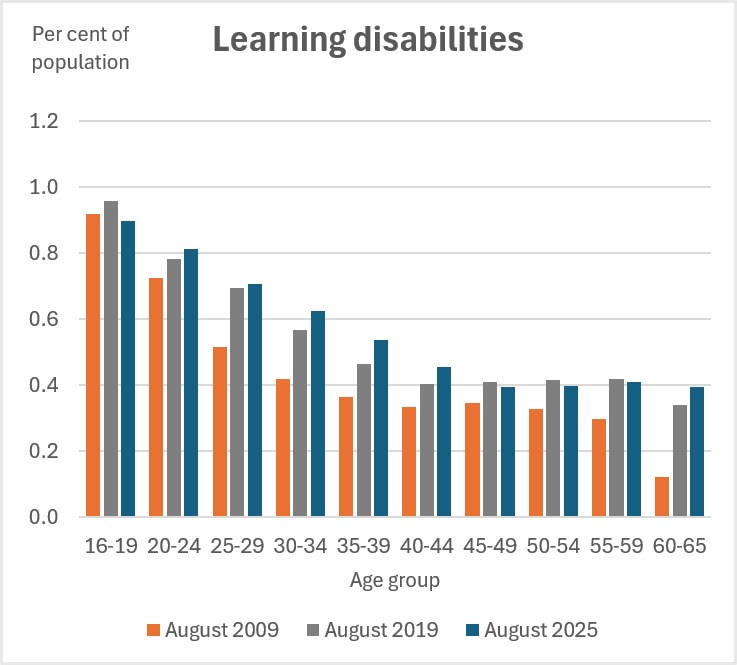
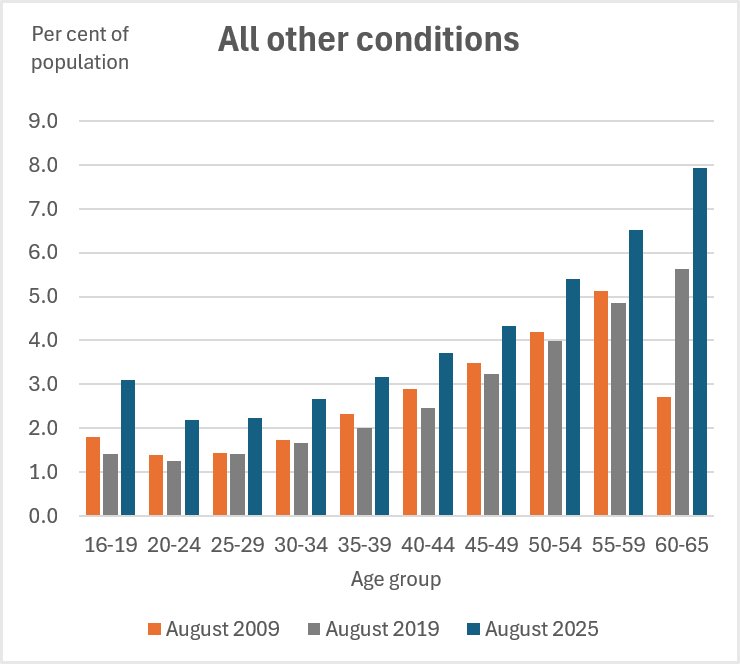
Source: DWP administrative data.
Figures are for England and Wales. 60 to 65 group is men aged 60 to 64 only for August 2009.
Forecast uncertainty
3.33. Both expenditure and caseload forecasts are based on several forecast judgements, and it is wise to consider how the outlook changes were those judgements to be changed. Box 3.3 gives an overview of the key assumptions behind the forecasts.
3.34. In the short- to medium-term the parameter having the most impact on caseload and expenditure is the inflow of new claims. Outflow rates are very low, as is the extent to which trends in average awards deviate from the overall annual uprating of the benefit, so these will only have a material impact over the longer-term, unless there are sudden and very large changes in them, which would normally only arise because of a major change in policy.
3.35. For recent forecasts, following OBR guidance, we have assumed that new claims in the medium-term settle at 0.168% of the working age population a month – this is guided by the increase in new claims seen post-pandemic, between June 2021 and December 2023, assuming that half of the rise in claims seen over this period unwinds over the forecast. OBR base their judgement on the recovery of real household disposable income after the steep rises in the cost of living seen during this period. Inflows are derived from new claims by the success rate assumption: this is set at the level seen in recent years, so inflows are set at around 55% of claims.
3.36. Chart 3.9 shows the results of varying the inflow assumptions:
- a higher scenario where claims, as a percentage of the working age population, return to their peak levels seen in January 2024
- a lower scenario where claims, as a percentage of the working age population, return to the rates seen prior to the pandemic
3.37. Because the working age population is growing, the lower scenario shows inflows stabilising at a higher level than was seen pre-pandemic. The central forecast is also not mid-way between the higher and lower scenarios as the inflow rate in June 2021 was already well above the pre-pandemic level.
3.38. The 2 scenarios shown do not define the range of possible outcomes – given the significant degree of uncertainty, the size of the disabled population, and potential variations in other key parameters of the forecast, the inflows, caseload or expenditure outcomes could be above or below the range shown in Chart 3.9.
3.39. The lower scenario, with a 40% drop in inflows compared to FYE 2025 levels, shows a less steep rise in caseload and the various measures of expenditure: as a share of GDP expenditure almost stabilises under this scenario. However, the scenario illustrates the extent to which the existing caseload and its low likelihood of leaving dominates the medium-term forecast, with inflows making a relatively small difference, even for large changes.
Chart 3.9: Working age disability benefits, alternative scenarios
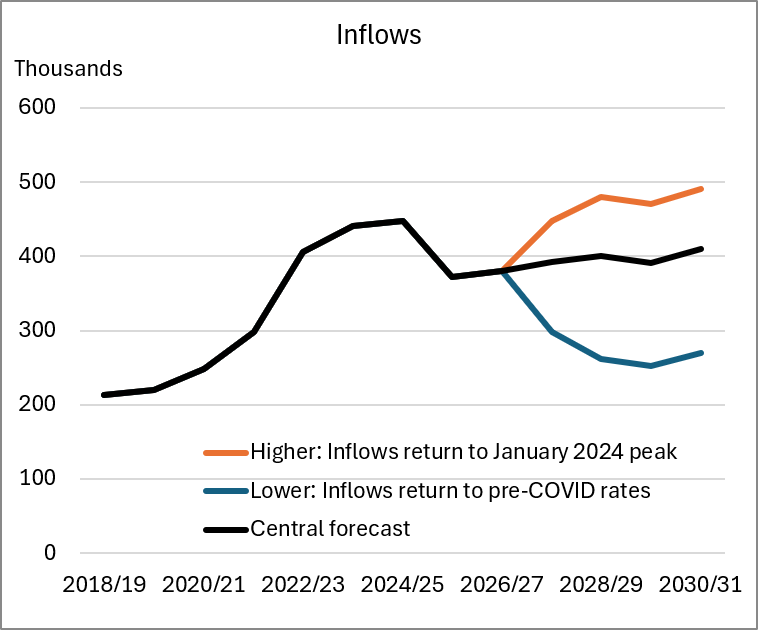
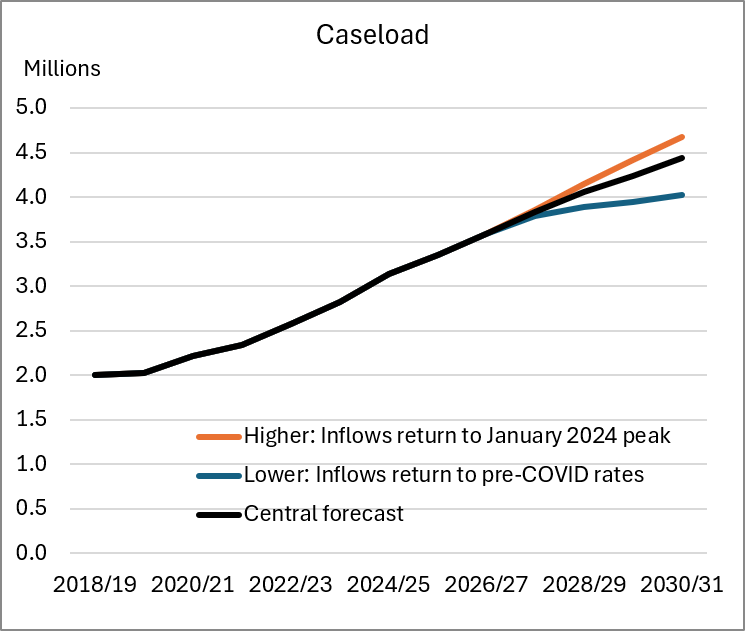
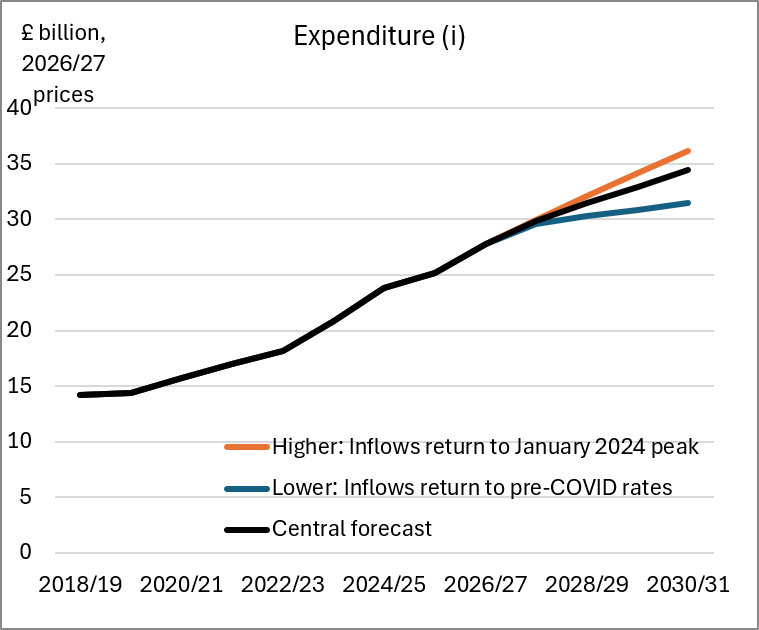
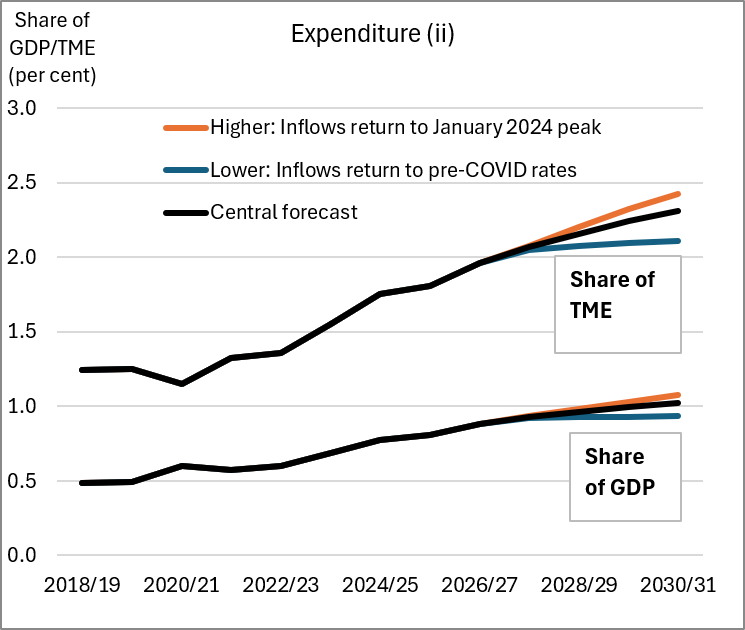
Source: DWP modelling on Spring 2026 forecasts
Box 3.3: forecasting PIP
In their Welfare Trends Report (2019), the OBR outlined the various methods for forecasting PIP in the first 8 years since it was announced, with some of the strengths and weaknesses of each. The current forecast is based on an ‘aggregate bottom-up’ model that forecasts the main elements of the customer journey:
- new claims, award rates and therefore inflows
- outflows, which with inflows determines the caseload
- average awards, which incorporate the annual uprating of benefit rates using the OBR assumption for CPI, and payments of arrears of benefit
- adjustments to allow for future changes to policy or benefit delivery; leading to
- expenditure
This approach necessarily involves some simplifications, although a complex model taking into account a much wider range of factors is not necessarily better or more accurate. In particular, movements within the caseload – the effect of changes of circumstances and award reviews – are not explicitly modelled and are wrapped up in the modelling of average awards. This modelling looks at the 8 possible rates of PIP and the share of the caseload each accounts for, and projects those forwards.
While modelling approaches aim to identify parameters with a sufficient degree of stability over time that minimise the uncertainty of the future outlook, for PIP the experience of the 13 years since its introduction has shown that many of the parameters are either volatile (such as new claims) or heavily trended (such as outflow rates). As a consequence, mechanical approaches, whether simple extrapolation or a more complex regression approach, will often result in implausible forecasts that can also oscillate wildly from one update to the next. Furthermore, as the next chapter discusses, there are many plausible factors that are likely to affect PIP, but it is impossible to create a mathematical link between these factors (if they are measurable in the first place) and PIP, and if a quantifiable link existed it would also require forecasts of these determining factors, which for many do not exist.
Therefore, the exercise of judgement, making use of as much relevant information as possible but without drawing a mathematical link between it and PIP, is critical to the PIP forecast. In particular: will a parameter stabilise, will it revert to a previous level or move towards it, and when will this happen? Assuming that strong trends cannot continue forever, turning points in series are notoriously hard to predict in both scale and timing, leading to a high degree of uncertainty.
The forecast is an iterative process and is described in more detail by OBR. At each forecast, DWP propose forecast assumptions based on the recent data, taking account of previous OBR judgements on those assumptions. These will be discussed with the OBR, involving additional supporting information as required, and either agreed or amended by them before settling on the final forecast. OBR also periodically review the forecast methodology and assess the accuracy of the forecast in their annual Forecast Evaluation Report, as well as explaining the main changes in the forecast at each iteration in their Economic and Fiscal Outlook.
Longer-term outlook
3.40. The OBR publish longer-term projections of benefit expenditure, which for working age benefits are based on less detailed modelling than applies in the medium-term forecast. This assumes that the average amount of benefit rises in line with average earnings, rather than prices, and allows for projected demographic changes. It does not, however, consider a further increase in prevalence of disability benefits receipt at each age, as has been seen over the past 15 years and is forecast for the next 5. This methodology results in spending on working age disability benefits remaining relatively stable as a share of GDP after 2030. The latest projections are set out in the ‘Fiscal risks and sustainability report’ (OBR, 2024). Published figures do not show working‑age disability benefits separately.
Caseload dynamics
3.41. The number of people in receipt of PIP is dependent both on the numbers flowing onto the benefit, or ‘inflows’, and the numbers flowing off the benefit, or ‘outflows’, and it is the balance of these 2 that determines the net increase or decrease in the caseload each month or year. Typically, the number of ‘outflows’ will vary with the size of the caseload, although its composition also matters. If health conditions are likely to improve, they are more likely to do so fairly quickly than after a long period, meaning that the likelihood of someone leaving the benefit is usually higher early on in the claim, and lower later. This also means that as the benefit ‘ages’, the likelihood of outflow falls across the caseload as a whole, as claims of longer duration take up a growing share of that caseload.
3.42. This also means that for a new benefit like PIP, even a constant inflow will still lead to a rising caseload, and with a relatively low outflow rate caseload growth can continue for decades before stabilising. This was the case on DLA, which was still growing 2 decades after it was first introduced.
3.43. As shown below, the inflow to PIP is not constant, and nor are the outflows (either in rates or volumes), which has resulted in further growth in caseload over and above that which would normally be expected for a stable benefit that is now in its 14th year.
3.44. Within the PIP system, we also need to take account of the people who come onto the system from DLA, particularly those who were migrated as part of the ‘full PIP rollout’ process. Separating these out is important for understanding the dynamics, as a person transferring from DLA is likely to already have had their health condition for many years, and many more years than someone making a claim to a disability benefit for the first time.
PIP inflows, outflows and caseload
3.45. Chart 3.10 illustrates how the inflows to and outflows from PIP have driven the PIP caseload since its inception. This includes both people of working age and those aged over pension age. Inflows in the early years of the chart include a large number of DLA reassessments, whilst since the pandemic they have been driven mostly by new claims. The number of outflows from PIP meanwhile has stayed relatively stable, despite the large increases in caseload, and far lower than inflows, resulting in an ever-increasing caseload.
Chart 3.10: PIP inflows, outflows and caseload
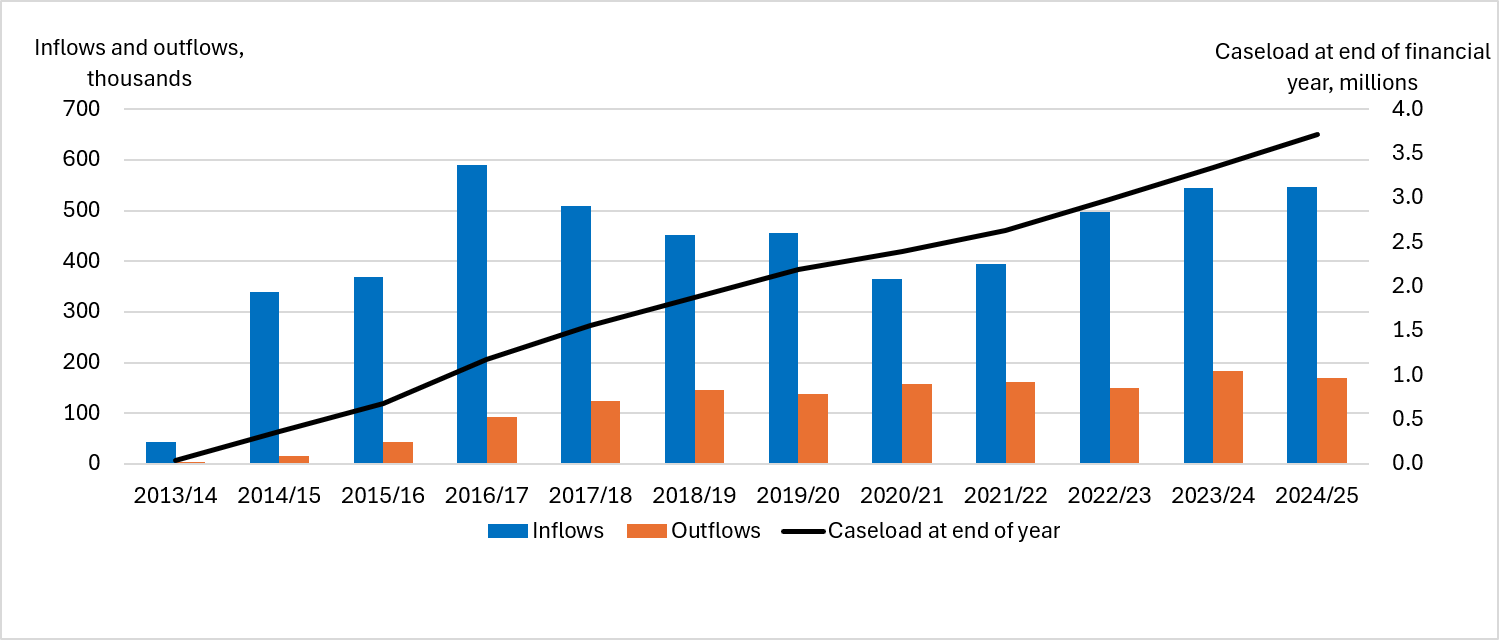
Inflows
New claims and registrations
3.46. Chart 3.11 shows new claims for DLA and PIP registrations. The availability of DLA data means that a truly comparable series cannot be provided across the whole period, but the relative trends are observable. The first panel shows the number of new claims for DLA and PIP in Great Britain (so including Scotland), covering both adults and children. The data for FYE 2013 permits a breakdown of child and adult claims, giving a basis for considering how the trends in PIP new claims and registrations compared to DLA before.
3.47. The chart suggests DLA claims were broadly flat between 2005 and 2013, with a slightly higher number during the late 2000s recession. Once PIP was introduced, there was a step-up in claims in FYE 2014, then a steady rise in the subsequent years.
3.48. The second panel shows registrations for PIP for England and Wales. There was a steady increase in new claim registrations up to FYE 2020, with a temporary pause when the pandemic occurred. There then ensued a much faster increase in new claim registrations up to FYE 2024, though claims then levelled off in FYE 2025, and early indications from April 2025 suggest claim volumes are now falling, though still well above the pre-pandemic level.[footnote 25] As noted above, OBR assume claims will fall so as to reverse half of the 22,000 a month increase that occurred between June 2021 and December 2023.[footnote 26]
Chart 3.11: PIP registrations and DLA new claims
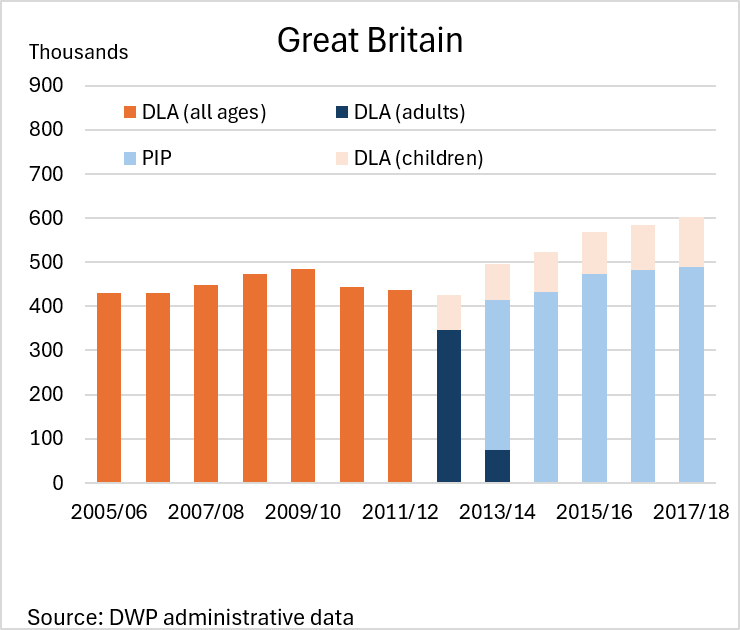
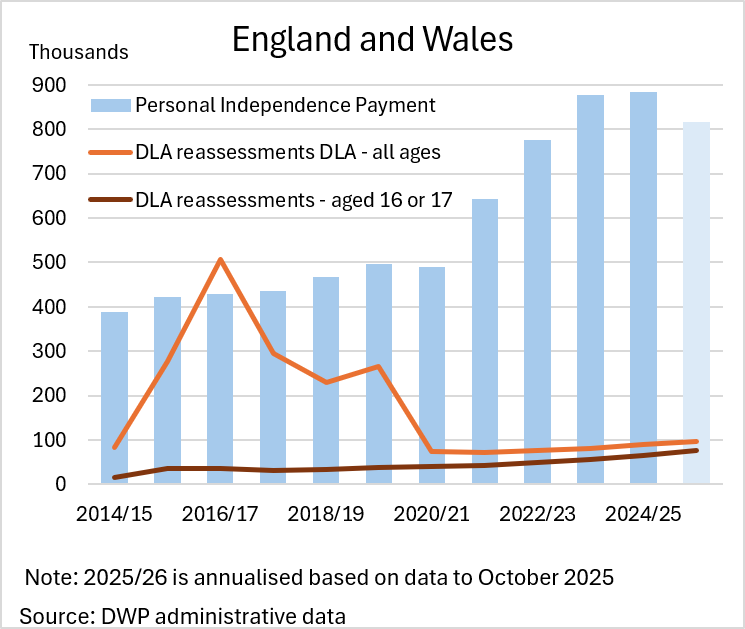
Source: DWP Administrative Data
3.49. The second panel also shows reassessment registrations from DLA. Significant numbers of these were undertaken between FYE 2015 and FYE 2020, mostly managed reassessments, but also including those occurring at a claimant’s request, or when a child claimant reaches age 16. Since the pandemic, managed reassessments have been paused, and in the latest few months around three-quarters of reassessments have been for those reaching age 16.[footnote 27] As the caseload of child DLA continues to increase, these reassessments can also be expected to continue to rise.
Initial decisions
3.50. Chart 3.12 shows initial decisions for new claims and for reassessments from DLA, for ‘normal rules’ claims, so excluding those treated under Special Rules for End of Life (SREL). Those treated under SREL have consistently had success rates above 95%, and those claims that are not awarded are usually due to the claim being withdrawn, or there being other reasons for disallowance prior to a referral being made to the assessment provider – for example, due to not meeting the eligibility criteria that are not related to the claimants’ functional capabilities.
3.51. In the first year of PIP, the outcomes are rather different to those for subsequent years. This is likely to be a compositional effect, at least in part, with claims that could be cleared more quickly accounting for a much larger proportion of clearances than would be the case in steady state. Such claims would have a disproportionate impact on the overall results, although it is not possible to say in which way the outcomes are biased, other than withdrawn claims accounting for around 10% of clearances in this year, compared to 1 % to 3% in subsequent years. This compositional effect would have been inflated by there being insufficient capacity to process all claims, such that by mid-2014 the median end-to-end clearance times for new claims exceeded 9 months (DWP, 2026, Table 1A). It should also be noted that half of claims would have clearance times in excess of the median, some substantially so.
3.52. The subsequent recovery in clearance times may also have influenced the FYE 2015 award rates, pushing them higher, as median clearance times dropped from over 9 months to under 3 months by the end of the year. There are 3 possible explanations for this, all of which could contribute to the higher award rate seen in that year:
- a compositional effect: the lengthier wait for a decision could have meant a higher proportion of claimants with longer term functional impairments – perhaps the corollary of the higher level of withdrawn claims in the previous year, with shorter-term claimants withdrawing claims before they get to an assessment.[footnote 28]
- if there is some room for debate about whether a claimant meets a certain threshold or not, when there is more pressure to clear cases, it could be more likely that assessors recommend or decision makers decide in favour of the claimant, whether consciously or subconsciously
- clarification of how the guidance should be applied as experience of the new benefit grew, resulting in lower award rates in subsequent years
3.53. From FYE 2016 onwards, new claim award rates have hovered around the 40% mark, declining to a low point of 35% in FYE 2020, and rising then to 45% by FYE 2024. Since the pandemic, the proportion of claims that were disallowed pre-assessment has roughly halved. This may be due to easements on the timeframes allowed for submitting forms and evidence or a reduction in non-attendance at assessment, coinciding with the introduction of telephone and video assessments.
Chart 3.12: PIP initial decision outcomes, normal rules
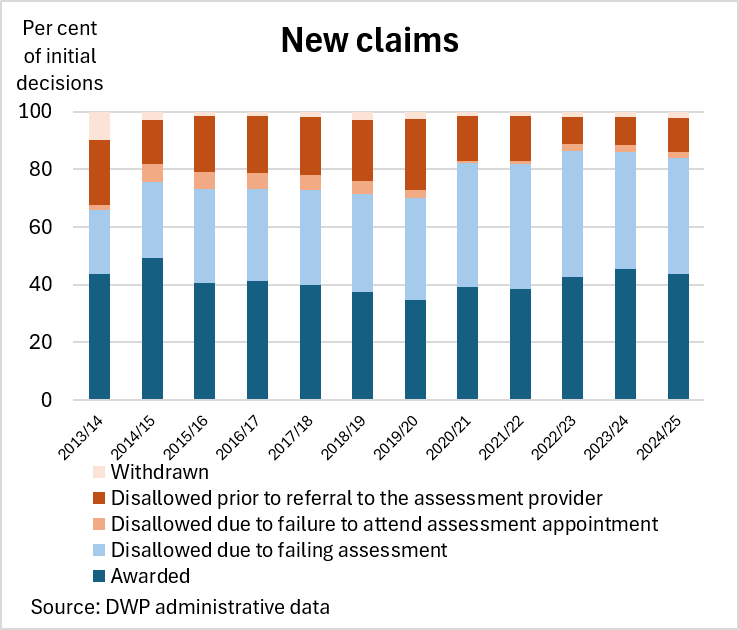
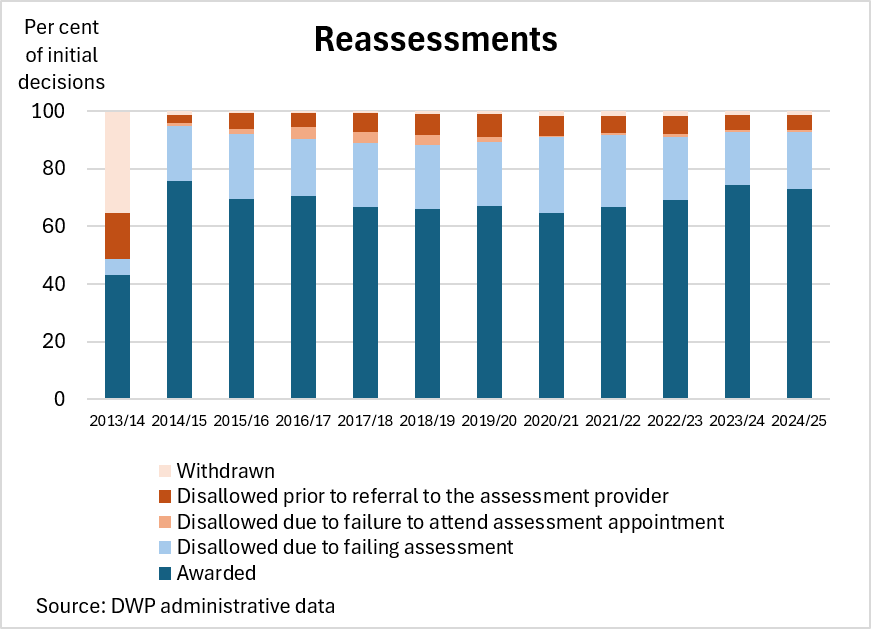
Source: DWP Administrative Data
3.54. The pattern for reassessments from DLA is similar to that for new claims, other than the award rate being around 30 percentage points higher. The volume of reassessments in FYE 2014 was very small, and likely to be dominated by particular sorts of cases. As chart 3.11 showed, the composition of reassessments has changed significantly, with existing working age claimants of DLA being reassessed under the ‘full PIP rollout’ programme dominating the years from FYE 2015 to FYE 2020, but child DLA claimants reaching age 16 accounting for most of the cases post-pandemic.
3.55. The trends in pre-assessment disallowances and withdrawals obscure the picture for the award rates where a claimant has attended an assessment, whether in person or remotely, or a decision could be made based on the paper evidence alone. Chart 3.13 shows the trends in these award rates for both new claims and reassessments from DLA. These both show a steady drop from the inception of PIP in FYE 2014 up to the pandemic – with a steeper drop in the first 2 years (though note the small number of DLA reassessments in FYE 2014). Then, since the pandemic, there has been a rise in the initial award rate for both, though flattening off in FYE 2025.
Chart 3.13: PIP initial award rates, assessments only, normal rules
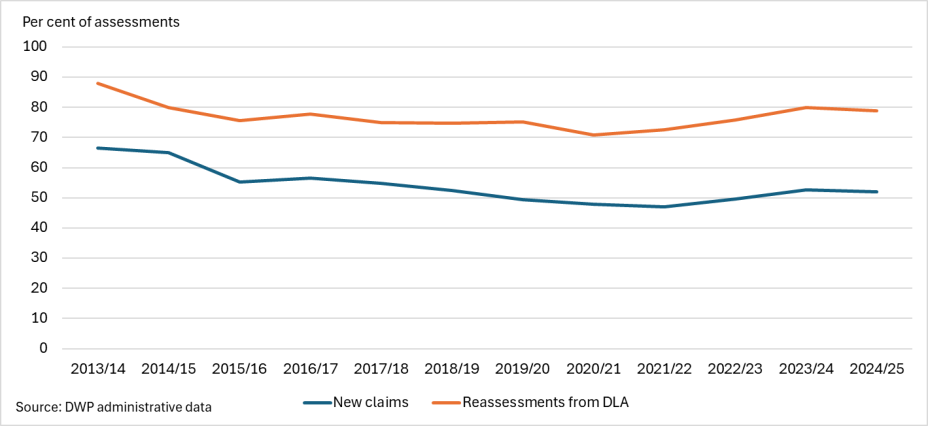
Claim decisions post Mandatory Reconsideration
3.56. For those who are not awarded PIP at the initial decision, or those who do not accept other elements of the decision (such as amount awarded or the length of award), they can request a Mandatory Reconsideration (MR), and if still not satisfied, go on to appeal that decision.
3.57. Since PIP was introduced, 40% of initial disallowance decisions, including both new claims and DLA reassessments, have had an MR, and 6% (15% of the MRs) resulted in an award being made, pushing up the award rate by 2 percentage points (DWP, 2026, Table 5D_(i))[footnote 29]. In the last 3 complete years, the figures were 33%, 3% and 10%, and 1 percentage point, respectively.
3.58. Chart 3.14 shows the percentage of PIP claims made that are successfully awarded PIP either at the initial decision or MR stage.
3.59. For new claims, in the pre-pandemic period, claimants were more likely to be awarded PIP the higher age band they were in, although the difference between the 16 to 24 and 25 to 34 groups was minimal, at around one-third of claims being awarded PIP. This increased to over half for claimants aged 55 or over.
3.60. There was a jump in the award rate during the pandemic. The reasons for this are hard to disentangle, given the introduction of ‘holistic decision-making’ in late 2019. This was initially introduced on PIP at the MR stage. “Holistic decision making allows our staff to take extra time, if needed, to make a decision on benefit entitlement following a health assessment. This extra time has often allowed more evidence to be provided to support the decision-making process. It has also allowed more time for our staff to listen to people claiming benefits and to help people understand the reasons why a decision has been made”. (DWP, 2021). It was later extended to initial decisions. As this almost coincided with the pandemic, where operational changes needed to be introduced at speed, and face-to-face assessments could no longer be done, the causes of the increase in the award rate cannot be attributed.
3.61. However, award rates have remained at a higher level than pre-pandemic and edged up between FYE 2022 and FYE 2024. Furthermore, the difference between age groups has reduced, with the largest increases in award rates among 16 to 24 year olds.
3.62. The lower panel of Chart 3.14 shows the picture for reassessments from DLA. Apart from the claims from child DLA claimants reaching age 16, since 2020, other reassessments have been confined to where the claimant initiates a reassessment, so the periods pre- and post-pandemic are not comparable.[footnote 30]
3.63. The main things to draw from this panel are:
- the award rate for claims from child DLA claimants reaching age 16 was less than two-thirds in the years before the pandemic but has now risen to over 80% in the years since
- other reassessments from DLA follow the opposite pattern, in large part reflecting the different composition between the 2 periods, with claimant-initiated reassessments having a lower award rate
- however, reassessments from DLA have a consistently higher award rate than new claims from those of a comparable age, which will reflect the fact that such claimants have already been claiming for a while, and therefore are more likely to have longer-term health conditions and disabilities.[footnote 31]
Chart 3.14: PIP awards, post Mandatory Reconsideration, by age
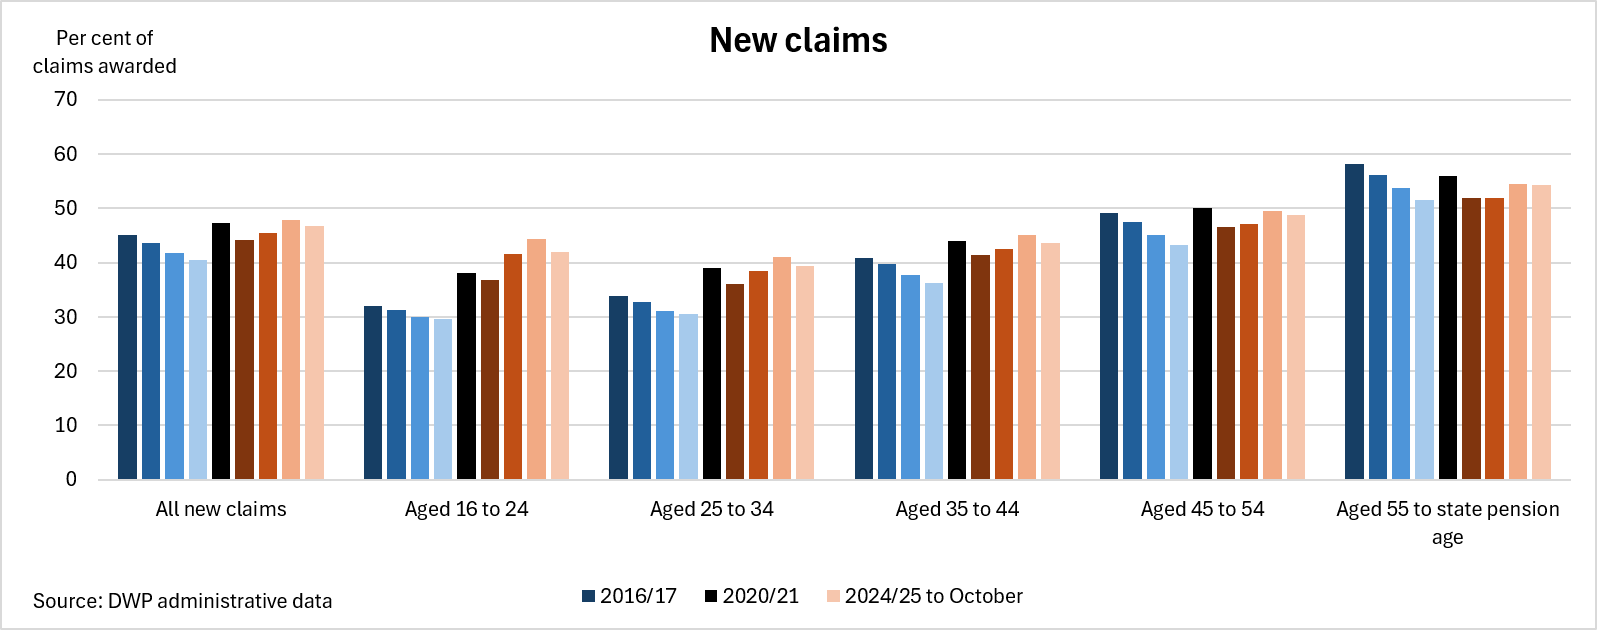
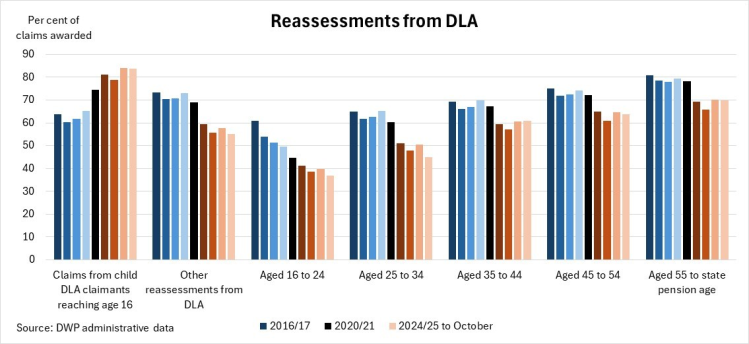
3.64. Chart 3.15 gives award rates split by a claimants’ primary medical condition. This chart contains the most prevalent groups of conditions within the caseload. As noted above, it should be noted that it’s likely many claimants will have more than one and maybe multiple health conditions that impact on their daily living and mobility. The overall award rate can change even when at a condition level there is no change, as a result of change in the mix of primary conditions reported by claimants.
Chart 3.15: PIP awards, post Mandatory Reconsideration, by primary medical condition
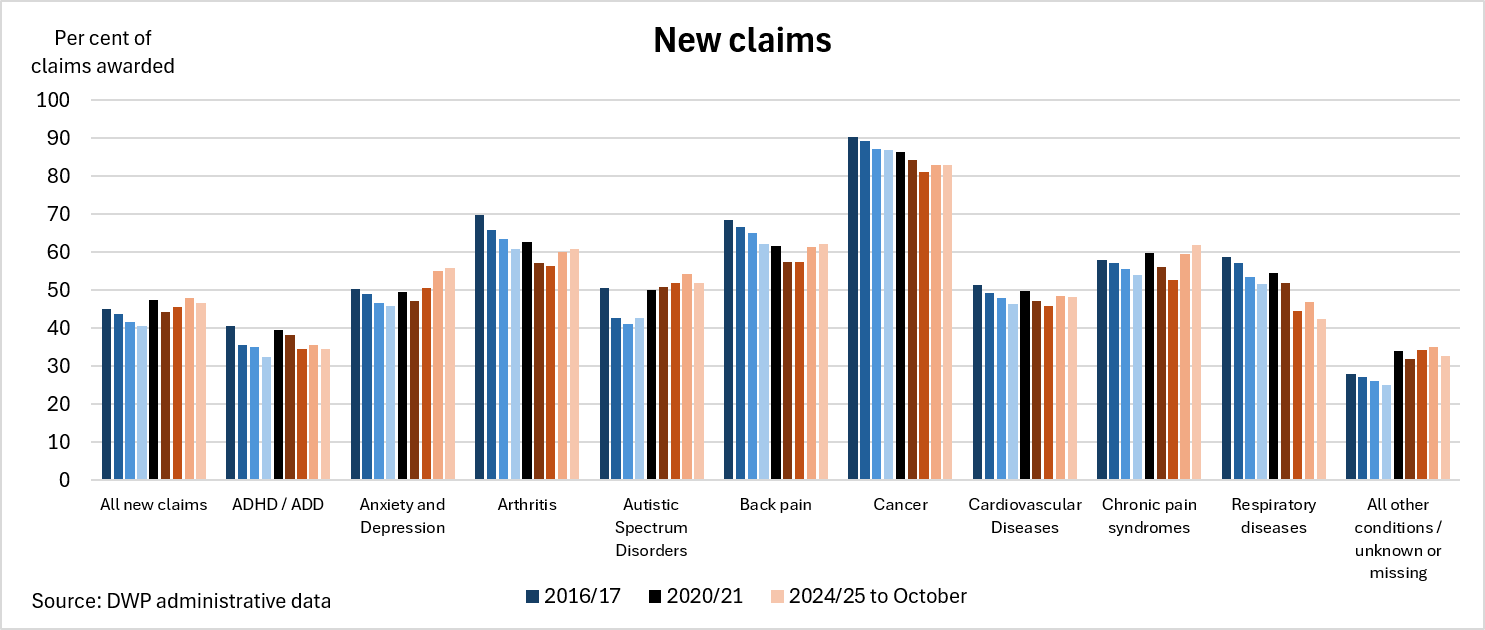
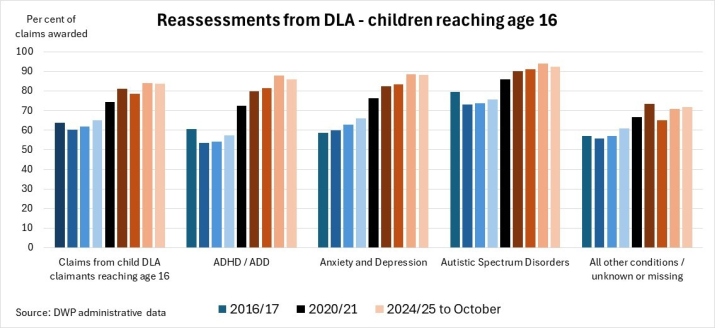
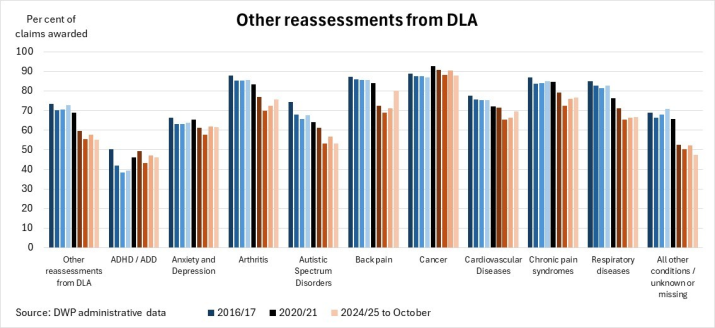
3.65. Award rates for individual health conditions among new claims present a mixed picture, with some being consistently higher post-pandemic (autism, anxiety and depression), while some have been broadly flat (ADHD/ADD, cardiovascular diseases) or falling (cancer, learning disabilities, respiratory diseases). The main musculoskeletal conditions had seen a fall in award rates in the years prior to the pandemic, but more recently have seen award rates start rising again.
3.66. Claimants with cancer have had a consistently far higher award rate than others, ranging between 80% and 90%. Claimants with ADHD/ADD meanwhile have had lower award rates, typically between 30% and 40%. In general, conditions that are more likely to be seen in older people have higher award rates than those that make up a higher proportion of reported conditions among young people, helping explain the age pattern of award rates shown in Chart 3.14.
3.67. The middle panel of Chart 3.13 shows that award rates for child DLA claimants reaching age 16 are higher than new claims. All the main condition groups see a rise in award rates following the pandemic, with them now ranging mainly between 80% and 90%. The increases for ADD/ADHD and anxiety and depression are particularly large.[footnote 32]
3.68. The drop in award rates for other DLA reassessment cases post-pandemic is spread across most of the main health conditions, though this is confined to claimant-initiated reassessments and volumes are relatively small.
Outflows
3.69. There are various ways in which outflows can be measured, as well as various reasons why they occur. As with many other benefits, the longer a claimant receives a benefit for, the less likely they are to move off it. Chart 3.16 shows 2 of the available measures: the proportion of selected inflow cohorts who remain in receipt of the benefit at a particular time later on, and the proportion of people who have reached a given duration on benefit, who then leave the benefit in the following year. In both cases, if a claimant returns to PIP subsequently, that is treated as a new claim.
3.70. The first panel shows clearly how cohorts of claims to PIP, whose award was made in particular years, reduce in size over time. These are presented as percentages remaining on the benefit as the cohorts are of different sizes. As duration is measured relative to claim clearance date, rather than registration date, the effective duration will vary with how quickly a decision is reached on the claim, and this has varied over time.
3.71. While the proportions remaining on benefit were similar for the 2014 and 2016 cohorts, the 2018 and 2020 cohorts show lower rates of outflow, meaning more claimants in each cohort continuing to receive PIP.[footnote 33] The 2022 cohort shows initial indication of having an even lower outflow rate than 2020.[footnote 34] As an example, 74% of claimants awarded in 2016 were still claiming after 3 years, while for the 2020 cohort, that had risen to 81%.
3.72. The second panel shows the likelihood of leaving PIP in the next year given the claimant has reached a given duration – or the ‘conditional probability’ of leaving, by year of inflow cohort. The likelihood of leaving has fallen over time, most noticeably for the 2017 inflow cohort onwards – those where the cases with 2-year awards (the most common) would reach their review from 2019 onwards – coinciding with the introduction of ‘holistic decision-making’ (described in more detail in paragraph 3.60).
Chart 3.16: Outflows from PIP
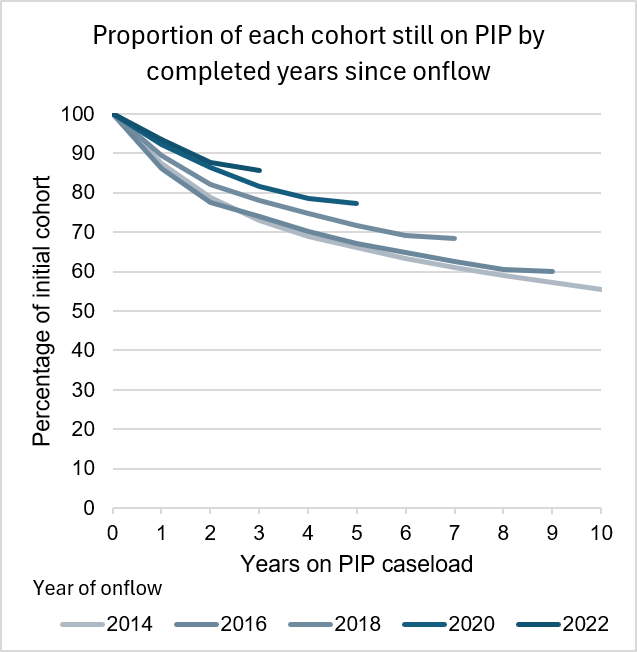
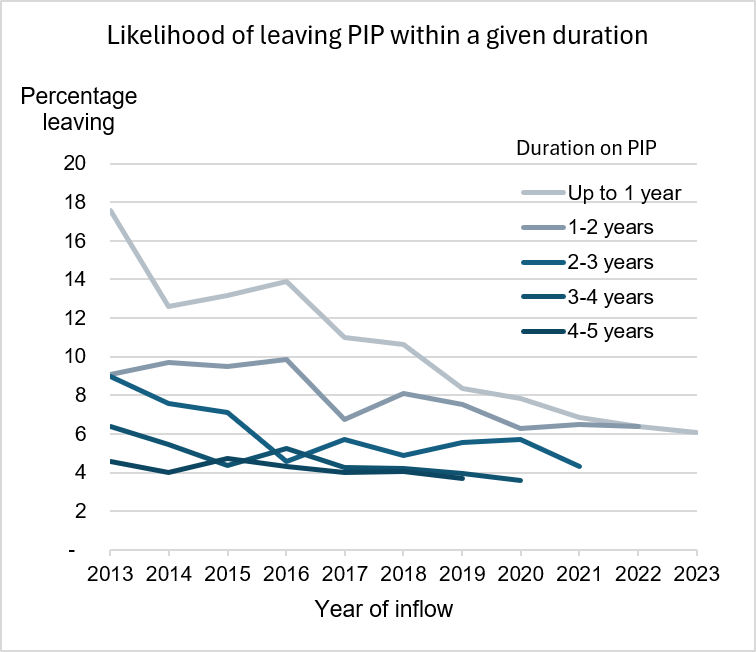
Source: DWP Administrative Data
Conclusion
3.73. The receipt of working age disability benefits (PIP and previously DLA) has risen continuously over the decades since their introduction, but the rate of increase has quickened since the pandemic. Expenditure has followed suit.
3.74. This increase is both due to more people being awarded and a reducing likelihood of people leaving. The higher awards are a mostly driven by higher claims, but there has been a small increase in the likelihood of an award since the pandemic for new claims, and a larger increase for claimants who were previously receiving DLA as a child. While the change in award rates coincides broadly with the pandemic, it may be driven by changes in decision-making approaches introduced a few months before then.
3.75. While the increases in receipt have been broadly-based in terms of age, sex and condition, the biggest increases in prevalence – the proportion of the population receiving PIP (or DLA) – have been seen among 16 to 19 year olds, and among women. By condition, the largest increases have been for mental health (anxiety or depression) and neurodevelopmental (autism) conditions – although some of the latter increase may arise from changes in the way conditions are recorded.
Further work
3.76. This chapter has considered several aspects of the trends in disability benefits caseloads and expenditure, but there remain many areas where further work is needed to build a stronger understanding of the factors influencing the headline totals.
3.77. A particular area of investigation is the dynamics of the PIP caseload, including:
- separating inflows into new claims and different types of DLA reassessments, as well as investigating inflows that are not treated in the published statistics as clearances, where it is unclear why these occur
- separating outflows into different causes, including death, scheduled Award Reviews (ARs) and other reasons. Homing in on ARs will help better understand how changes in the volume of ARs undertaken, and their outcomes, have influenced outflows
- identifying the number of claimants moving to or from Scotland, and those who leave ‘working age’ through reaching state pension age
- further analysis on duration and outflows from the benefit, including by key characteristics (age, sex, condition), and also whether and when those who leave subsequently return, and their characteristics
- the role of the disputes process (mandatory reconsiderations and appeals) in award and outflow volumes, and how this has changed over time.
3.78. Work is needed to understand changes in average awards, beyond the annual uprating of benefits – for example looking at the points awarded and on what activities and descriptors, at both new claim stage and subsequently.
3.79. Geographical trends may also offer some insights – have certain types of area seen faster growth in caseloads than others?
3.80. The 5 year time horizon of current OBR forecasts may not be sufficient to act as a base for considering the impact of potential reforms to the system, so a 15 year projection (potentially with alternative scenarios) is to be developed to help enable the longer-term impacts of any changes to be considered, as well as identifying whether there are potential other issues that will arise (positively or negatively) beyond the OBR forecast horizon.
References in Chapter 3
Department for Work and Pensions (2021) Shaping future support: The health and disability green paper. London: DWP. Available at: Shaping future support: the health and disability green paper
Department for Work and Pensions (2025) Benefit expenditure and caseload tables 2025. London: DWP. Available Benefit expenditure and caseload tables 2025
Department for Work and Pensions (2026) Personal Independence Payment: Clearance/Outstanding Times and Customer Journey Statistics to January 2026, England and Wales. London: DWP. Available at: Personal Independence Payment: Clearance/Outstanding Times and Customer Journey Statistics
Office for Budget Responsibility (2024) Fiscal risks and sustainability report. London: OBR. Available at: Fiscal Risks and Sustainability Report
Office for Budget Responsibility (2026) Economic and fiscal outlook: March 2026. London: OBR. Available at: Economic and fiscal outlook March 2026
4. Factors influencing increased claims and expenditure
4.1. Chapters 2 and 3 show the general rise in self-reported disability and claims for disability benefits over a long period, and a quickening of that pace since the pandemic. It is highly likely that there are multiple contributors to these changes, with some factors having relevance over a long period of time, with the effect of others being more concentrated at particular points. Various organisations, such as the OBR, IFS, and the Resolution Foundation, as well as internal DWP analyses have looked into these, and the main hypotheses, along with the supporting evidence that exists, are summarised here.
4.2. It is not possible to prove or quantify most of the drivers of disability benefits demand – not least because they will interact with each other and not always be obvious to the claimant themselves. However, a number of potential drivers are highlighted below, based on the relevance of health and household finances, together with the timings of increases in PIP claims. Many of these have been the subject of valuable analysis and research outside government, but the complex interactions between drivers and limitations on available data have made it difficult to draw firm conclusions.
Longer-term term influences
4.3. Demographic change is a key factor underlying any long-term trends. An increasing proportion of the working age population come from older age groups, where health conditions are generally more common. In 2010, the large cohort of 1960s baby boomers were in their forties. This cohort had reached their fifties by 2020 and were over 55 by 2025. The previous and subsequent cohorts are much smaller[footnote 35], even when births are supplemented by net inward migration. Since disability benefit receipt increases with age, the ageing of this cohort will have increased benefit receipt, even if the likelihood of receiving benefits at any given age was unchanged.
4.4. However, the effect of demographic change over a medium-term horizon is fairly limited, as its effects tend to be steady but slow. Though DWP has not estimated this effect for disability benefits, it has done so for incapacity benefits (DWP, 2025a, Table 1.13), with less than 8% of the growth in these benefits over the 6 years to 2024 being accounted for by demographic change.
4.5. Increasing prevalence of self-reported disability is the other factor underlying longer-term trends, as noted by the OBR in its 2019 Welfare Trends Report. However, it observes that this is a combination of changes in actual incidence of disability, awareness and recognition of disability and the effects of disability.
4.6. Increasing likelihood of claiming a disability benefit is similar to, but not the same, as the self-reporting of disability, with similar subsidiary factors influencing it. Awareness of the benefits available, and to a lesser extent what is required to qualify for them, is a one-way street – once people are informed that there is additional support available, such knowledge cannot be unlearned.
4.7. As explained in Chapter 3, equalisation of, and the subsequent rise in, state pension age has also had an impact on receipt of disability benefits. The introduction of PIP, covered in the OBR’s 2019 Welfare Trends Report is also likely to have a significant impact. With a substantial proportion of claimants of disability benefits receiving them for a long time, the effect of system reforms like PIP are likely to have an impact that is still increasing one, two or three decades after the policy change was first introduced.
4.8. It is relatively straightforward to estimate the contribution of demographic change to a change in the number of claimants and expenditure, assuming that nothing else changes. A reasonable estimate of the impact of state pension age changes, assuming that nothing else happens, can also be made. However, the remaining influences on benefit claiming, including most policy changes, cannot be separated from one another – in part because there is no comprehensive, consistent and objective measure of the actual incidence of disability.
Post-pandemic changes
4.9.The steady growth in both disability prevalence and disability benefit receipt among the working age population seen before the pandemic, subsequently accelerated after it. They are likely to have been accelerated by:
- direct health impacts of the COVID-19 virus: in early 2024, around 200,000 people aged 16 to 64 years in England and Scotland were reporting long-term severe symptoms from long COVID – symptoms that had lasted more than a year and limited their daily activities “a lot” (ONS, 2024, Table 2)[footnote 36]. The number of PIP claimants with COVID recorded as their main disabling condition is much lower at around 6,000, although the nature of the symptoms means many more claimants could be experiencing long COVID as a secondary health condition, or it could have exacerbated any pre-existing health condition(s), with or without a diagnosis. In any case, the fact that the number of PIP claimants with COVID as their main condition has changed little over the last 18 months suggests that it is not currently a strong driver of demand
- indirect impacts of the pandemic and associated lockdowns on physical health (through reduced activity) and mental health (through reduced social interaction and increased anxiety)
- greater medical recognition of certain health conditions, including neurodevelopmental and mental health conditions – which applied prior to the pandemic too but could have been more pronounced since
- greater recognition and awareness of disability in the wider population, again a longer-term phenomenon that could have become more pronounced post-pandemic
NHS capacity
4.10. The impact of health changes may have been exacerbated by NHS capacity struggling to keep up with demand since the pandemic, leading to longer waiting lists for treatment. There is a lack of evidence that this has had a strong impact at the aggregate level, although analysis is limited by the aggregate nature of the available data. Analysis by IFS suggests that NHS waiting lists have made a relatively small contribution to the increase in claims for health-related benefits since 2021 (Warner and Zaranko, 2025). In contrast, the National Institute for Economic and Social Research (NIESR) finds that ill-health-related economic inactivity and NHS waiting lists are positively correlated post-pandemic when no such relationship existed beforehand. They argue that the advent of this correlation, along with the broad-based spread in the increase in ill-health inactivity across different health conditions, suggests that there is a stronger causal link between waiting lists and ill-health inactivity (NIESR, 2024).
4.11. Whether or not there is a causal link between waiting lists and self-reported disability and/or benefits claims, the OBR have suggested that improvements in NHS waiting lists alone would have a limited impact on economic working-age inactivity (OBR, 2023)[footnote 37].
Cost of living
4.12. Cost-of-living pressures may have increased the (real and perceived) financial need to claim benefits. The annual rate of inflation, as measured by the Consumer Prices Index (CPI) peaked at 11.1% in October 2022, shown in Chart 4.1. Annual increases in benefit rates each April are based on the level of inflation in the previous September, so benefit incomes lagged behind this peak. High inflation caused a fall in the real value of earnings (second panel of Chart 4.1) and household incomes (third panel) in FYE 2023. Although they have since recovered to above or around their previous peak levels, on average, people’s perceptions of their current financial position and future risks may not have fully recovered.
4.13. Qualitative research conducted by Basis Social on behalf of DWP explored further what prompted people to claim PIP, and the support they received. This indicates that financial pressures will, in some cases, be the trigger for initiating a claim: “Whether the gap is long or short, the trigger to starting their own claim is likely to come from a conversation with a formal or informal advisor, prompted by either increased impact of their condition (such as worsening symptoms, reduced capability) or a change for the worse in their financial circumstances (like no longer being able to work, sick pay coming to an end).” (DWP, 2025). The research also identified a group of claimants for which the financial benefit was the main motivation for claiming, rather than the impact of their condition.
4.14. The research also interviewed a selection of advisers, both generalist and specialist. The report observed that welfare benefits advice is just one of the services general advice services offer, and advisors are often qualified to advise on other problems, such as debt or housing. Nonetheless, conversations about PIP were a significant part of their day-to-day workload. Depending on the needs of the client they can offer informational, practical, and emotional support to their clients throughout their PIP claim journey and are able to signpost to wider support services. Thus, seeking general advice on financial hardship may be a starting point for a more specific conversation about PIP.
4.15. A smaller qualitative study conducted in-house by DWP staff in late 2021 found: “most of the interviewed individuals had not considered applying for PIP previously, either because of no previous need or because they were previously unaware of the benefit, although they may have been eligible. Main triggers for their current PIP application involved health deterioration, financial hardship and employment concerns. Furlough was not a strong factor in their decision to apply for PIP, in part because it was inapplicable to most individuals interviewed. Removal of the Universal Credit (UC) uplift was experienced by some individuals as a consideration in their PIP application, but other individuals were unaware of its existence.” (DWP, 2022).
Chart 4.1: Indicators of cost of living and income
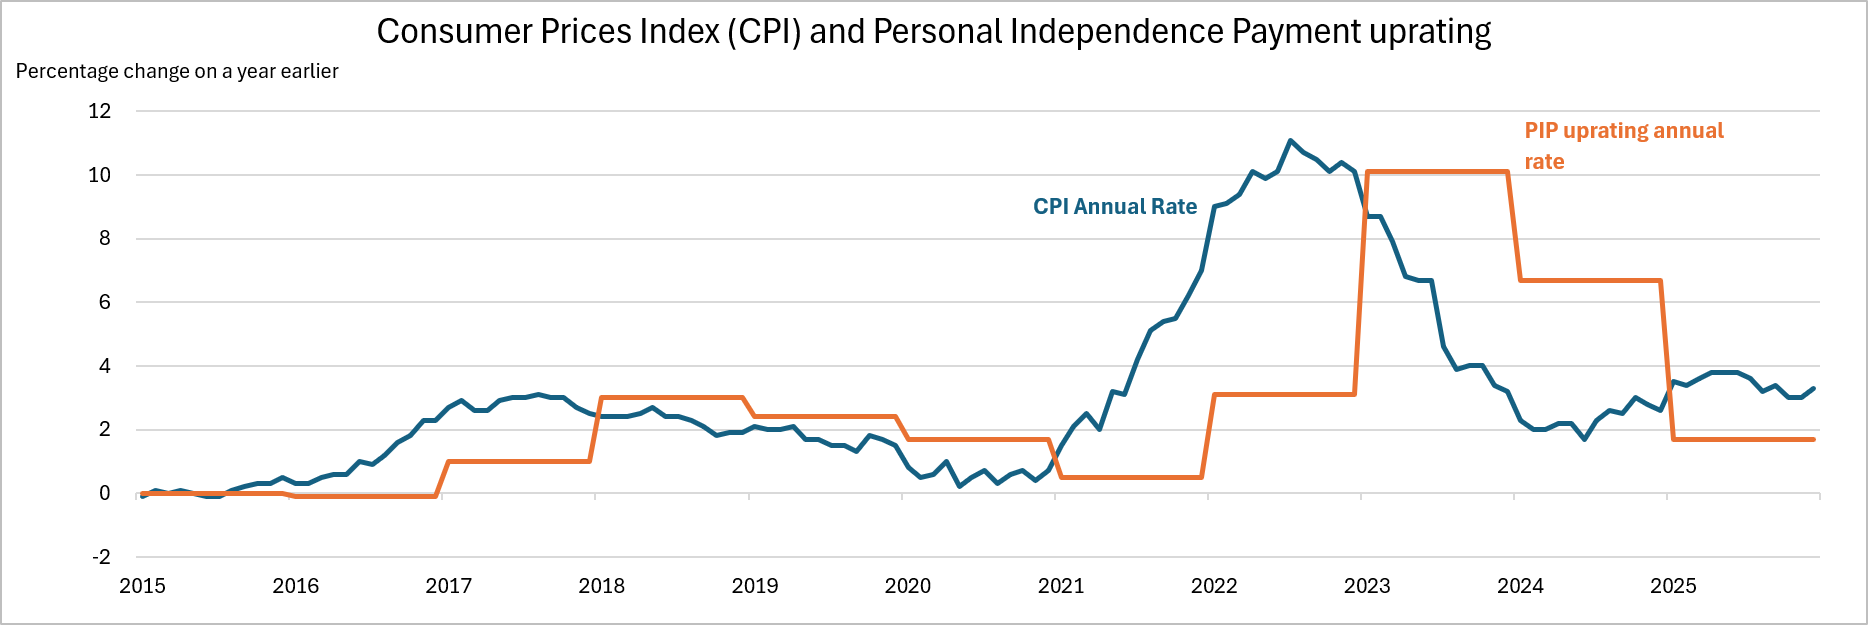
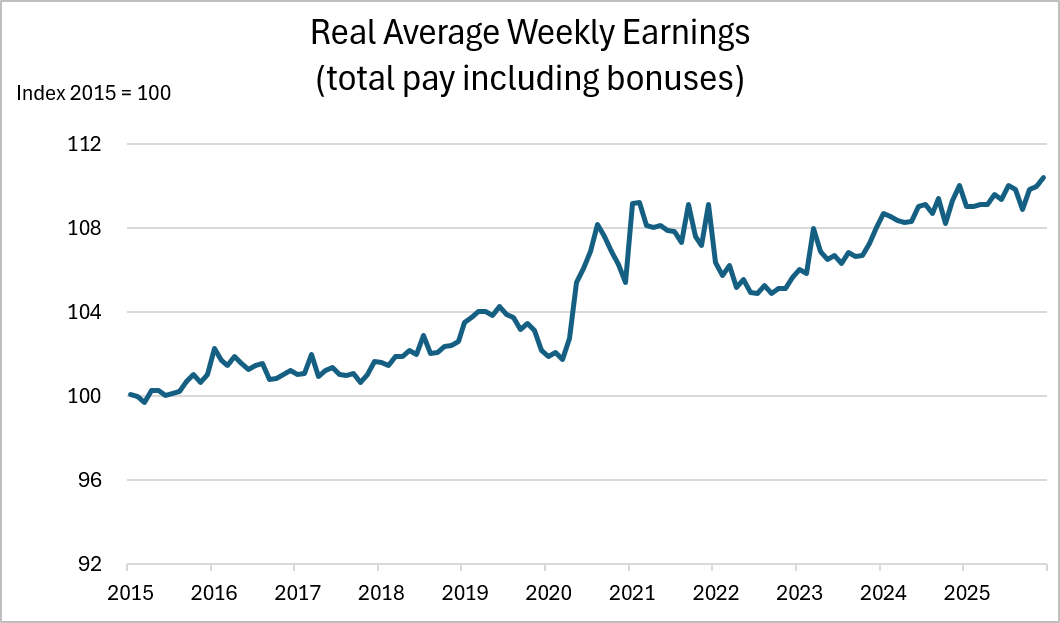
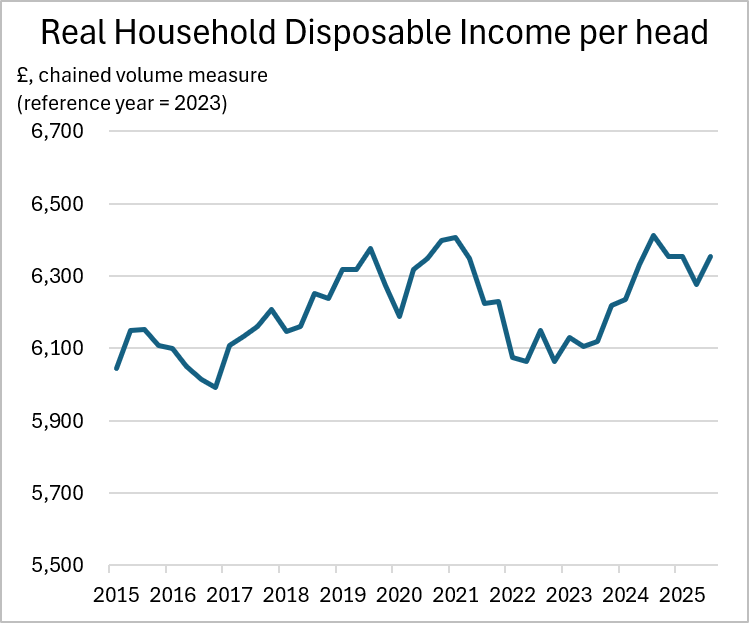
Sources: Office for National Statistics; Department for Work and Pensions
4.16. One of the most significant and widely reported components of inflation was the increase in domestic fuel prices. Their impact on household finances was reflected in the much greater number of people receiving advice from Citizens Advice on fuel and fuel debt, shown in Chart 4.2. Such people may have been seeking additional sources of income to help them meet rising costs, and contact with support bodies, healthcare professionals or benefit advisers may result in being ‘signposted’ towards PIP. In the case of Citizens Advice, even before the COVID-19 pandemic and the cost-of-living crisis, a significant proportion (between 12% and 21%) of advice about fuel, fuel debt and rent or Council Tax arrears also involved advice about PIP. It was the single benefit most likely to be discussed with those issues. Over the period from 2022 and 2023, which included peak inflation, these proportions increased sharply to between 21% and 28%. They have been slightly lower in the latest period (financial year 2026), while the number of clients advised continues to grow for several of these issues, suggesting that people’s confidence in their household finances may be lagging behind improvements in average inflation, earnings and incomes.
Chart 4.2: Contact with Citizens Advice
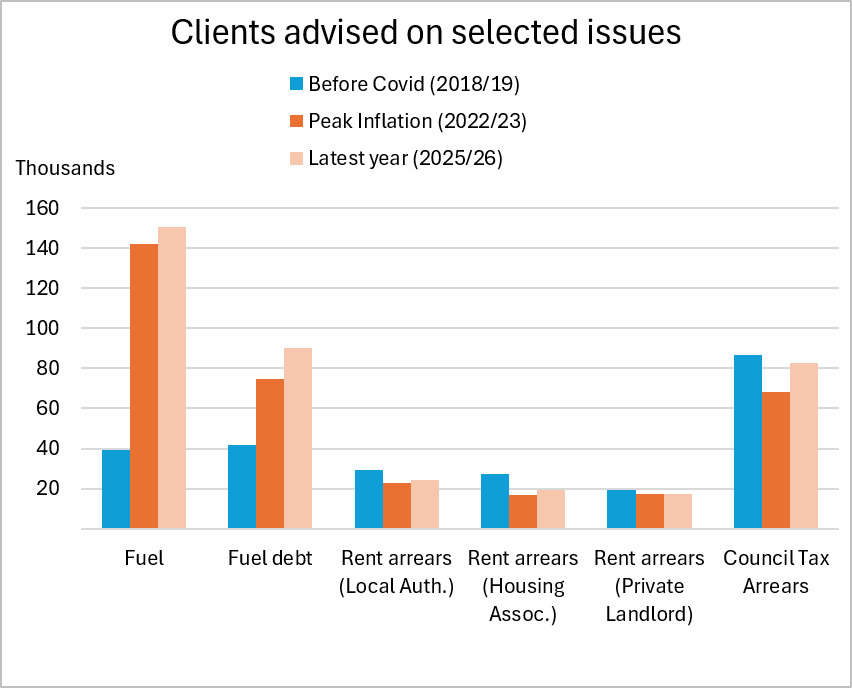
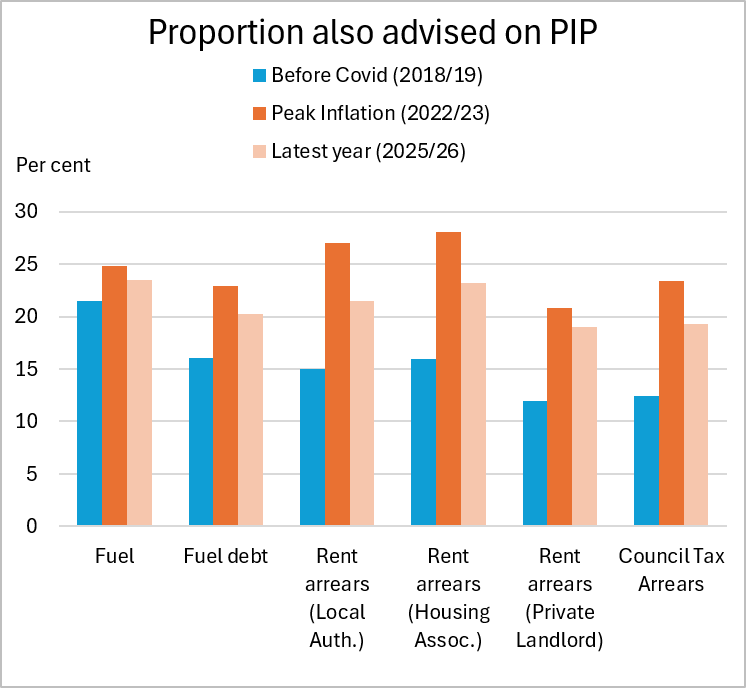
Source: Advice Issues, Citizens Advice
Benefit system incentives
4.17. This may have been exacerbated by incentives in the benefit system that can encourage people to claim health-related benefits. The Resolution Foundation have highlighted a fall of 7.6% in the real-terms value of standard unemployment benefit between 2010 and 2024, including 2 particularly sharp falls due to cost-of-living pressures and the removal in September 2021 of the temporary £20 a week UC uplift (first introduced during the pandemic) (Judge and Murphy, 2024). The basic benefit for a single adult after 2 months’ unemployment is equivalent to 17% of previous in-work income, the lowest proportion in the Organisation for Economic Co-operation and Development[footnote 38] (OECD) (The Economist, 2024)[footnote 39]. The OBR (2024) have also suggested that changes in the relative value of health-related and non-health-related out of work benefits has contributed to a rise in claims for incapacity-related benefits.
4.18. Combined with the additional conditionality requirements for people on unemployment benefits to look for work, this increases the incentives for people with health conditions to apply for incapacity benefits (such as the health element of UC) and potentially disability benefits.
4.19. Although these incentives were in place prior to the pandemic, their impact may have been advanced by the pandemic and the cost-of-living challenges. The large numbers of additional people claiming unemployment and then health-related benefits during the pandemic may have increased awareness and signposting towards disability benefits, including among people who previously may not have realised that eligibility for PIP is not affected by employment status. Furthermore, while many people may not have an awareness of the relative value of health- and non-health-related benefits in advance of receiving the former, once they are in receipt of higher amounts, they will be reluctant to give them up.
4.20. Incentives in the benefit system and changes in health may have influenced labour market behaviour, with large increases in the number of economically inactive people reporting long-term sickness or disability as their main reason, shown in Chart 4.3, including large numbers of older people who were already out of work. For example, analysis by the IFS finds that of the 1.1 percentage point increase between Q1 2020 and Q3 2022 in the share of 50 to 64 year olds who are inactive for health‑related reasons, around 0.8 percentage points (73%) occurred among people who had not worked in at least 5 years, suggesting that changes in inactivity are not solely driven by recent labour market exits (Boileau and Cribb, 2022).
4.21. Having moved into this type of inactivity, only a minority of people rejoin the labour force. On average, 14% of inactive people (excluding students) moved into the labour market each year between 2019 and 2023, including only 5% of inactive long-term sick people (DWP, 2024, Table FLW008)[footnote 40]. While inactivity for long-term sickness or disability started increasing ahead of the pandemic, the flattening of the trend broadly coincides with the flattening of the trend in new PIP claims, though not the volume of claimants, which continues to rise.
4.22. Labour market statistics over this period should be interpreted with caution. The Office for National Statistics warns about data volatility in the LFS over recent years, due to low sample sizes, and recommend using multiple sources to assess trends (ONS, 2025). One such attempt, by the Resolution Foundation, suggests that the overall inactivity rate could have already been much closer to pre-pandemic levels between summer 2022 and summer 2024. However, they believe that the increases in people inactive due to long-term sickness or disability are more likely to be genuine, given trends in benefits statistics (Corlett, 2024).
Chart 4.3: Economic inactivity due to long-term sickness or disability
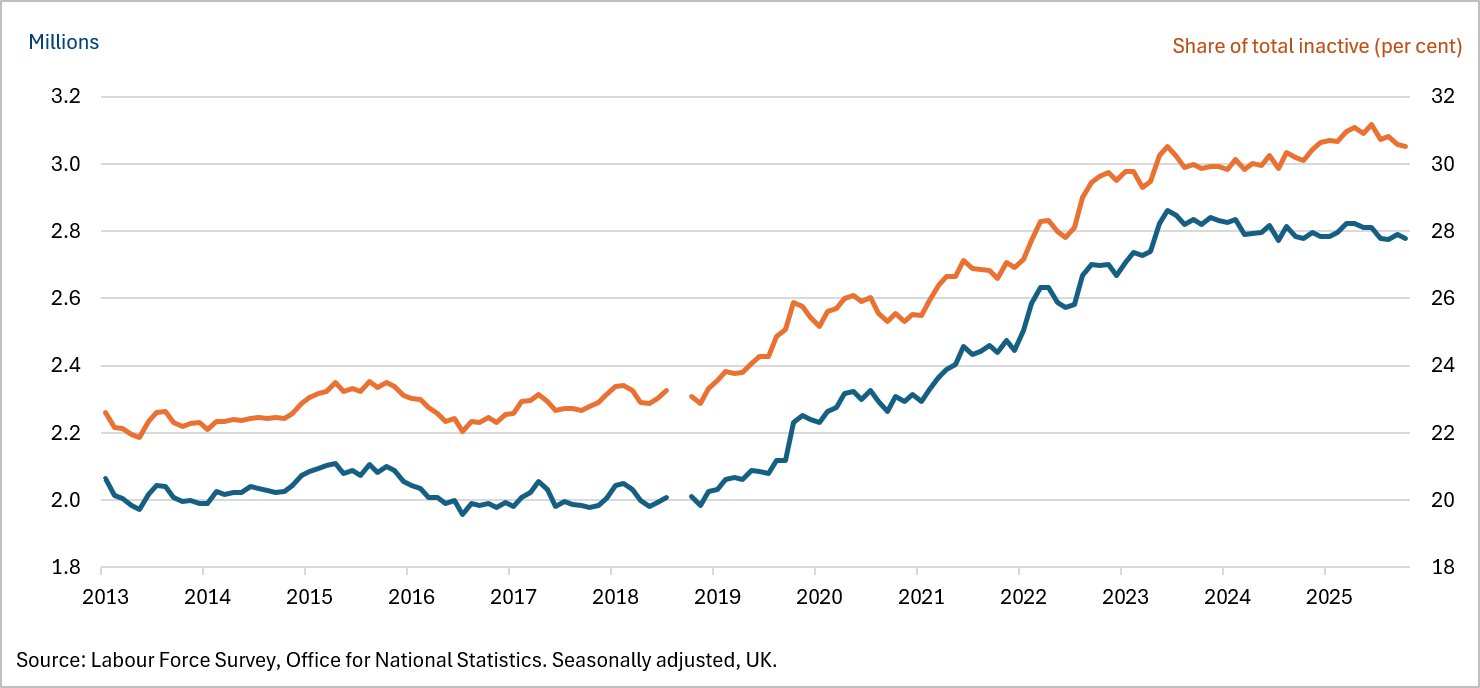
4.23. In addition, in 2020, as a result of the pandemic, face-to-face assessments were replaced by telephone assessments, and to a small extent video assessments. While some face-to-face assessments resumed when it was safe to do so, around four-fifths of assessments are still done over the telephone, and only one in twenty are face-to-face. Around a tenth are paper-based assessments, which were undertaken prior to the pandemic where a full in-person assessment was not necessary for the HCP to make a recommendation. It is possible that this switch in mode of assessment will have contributed to the changes in registrations for PIP, and outcomes, although in the absence of a counterfactual it is not possible to verify.
4.24. The various drivers above can interact with one another to change the number of people receiving PIP and total expenditure – influencing not only the rate at which people join the benefit, but also the rate at which they leave. The changes in exits and durations on PIP were explored in the outflows section of Chapter 3.
International comparisons
4.25. Benefit systems vary across countries in their eligibility criteria and generosity, while some support may be provided through non-benefit systems such as health services. The support provided through specific health- and disability-related benefits is often dependent on the level of general benefits for people who have low incomes or are out of work. This makes comparisons between countries difficult to interpret.
4.26. However, the IFS has compiled post-pandemic data across 9 European countries (including the UK), Australia, Canada and the USA (Latimer, Pflanz and Waters, 2024).
4.27. It finds that UK spending on disability benefits has increased by over 30% since the pandemic and by 20% on incapacity benefits. Over the same period, across 11 similar countries, all but one have seen stable or falling spends on their nearest equivalent benefits, with only Denmark seeing a significant increase. Even then, Denmark’s increase is lower than the UK’s, at 13%, and follows a period pre-pandemic when health-related benefit claims were falling, whereas they were rising for UK disability benefits, though not incapacity benefits.
4.28. IFS suggests that there are UK-specific factors driving recent trends beyond the after-effects of the pandemic and the rising cost of living, as we would expect to see more similar trends in other comparable countries that also experienced these shocks, albeit to somewhat differing degrees. They say it is possible that the nature of the UK economy and public services mean that UK benefits are more responsive to health or cost challenges than other countries. They note that the UK is one of the few countries with a disability cash benefit like PIP, which is not conditional on employment or income.
4.29. They also note that there is also some evidence that the UK had a larger health shock than elsewhere. The share of people reporting a disability has increased by 5 people per 100 in the UK, whereas it was more like 2 people per 100 on average across the European Union. There has also been increase in economic inactivity due to ill health in the UK but not in most comparable countries. However, if worsening health was the only factor driving increased health-related benefit claims, we would expect to see some increase in claims in other countries, even if those increases were slower than in the UK. Instead, we see no increase in most comparable countries.
4.30. IFS note that an important piece of context is that UK health-related benefit spending was lower than that in many comparable countries before the pandemic. In 2019, the UK spent 1.3% of GDP on health-related benefits – below the OECD average (1.6 % of GDP). If the forecasts for the UK at the time were realised, the UK’s 2028 health-related benefit spending would still be similar to the 2019 levels for comparable countries such as the Netherlands or New Zealand.
References in Chapter 4
Boileau, B and Cribb, J. (2022) Is worsening health leading to more older workers quitting work, driving up rates of economic inactivity? London: Institute for Fiscal Studies. Available at: Is worsening health leading to more older workers quitting work, driving up rates of economic inactivity?
Corlett, A. (2024) Get Britain’s stats working: Exploring alternatives to Labour Force Survey estimates. London: Institute for Fiscal Studies. Available at: Get Britain’s Stats Working: Exploring alternatives to Labour Force Survey estimates
Department for Work and Pensions (2022) Triggers to claiming Personal Independence Payment. London: DWP. Available at: Triggers to claiming Personal Independence Payment
Department for Work and Pensions (2025a) Pathways to Work: Reforming benefits and support to get Britain working (Green Paper). London: DWP. Available at: Pathways to Work: Reforming Benefits and Support to Get Britain Working Green Paper; Case for Change Evidence & Pathways to Work: Reforming Benefits and Support to Get Britain Working Green Paper - GOV.UK
Department for Work and Pensions (2025b) Applicants’ journeys to claiming Personal Independence Payment. London: DWP. Available at: Applicants’ Journeys to Claiming PIP
Department for Work and Pensions (2024) The employment of disabled people: 2024. London: DWP. Available at: The employment of disabled people 2024
Judge, L. and Murphy, L. (2024) Under strain: investigating trends in working-age disability and incapacity benefits. London: Resolution Foundation. Available at: Under strain Resolution Foundation
Latimer, E., Pflanz, F. and Waters, T. (2024) Health-related benefit claims post-pandemic: UK trends and global context. London: Institute for Fiscal Studies. Available at: Health-related benefit claims post-pandemic: UK trends and global context, Institute for Fiscal Studies
National Institute of Economic and Social Research (2024) UK economic outlook: Spring 2024. London: National Institute of Economic and Social Research. Available at: Box B: NIESR UK Economic Outlook - Spring 2024
Office for Budget Responsibility (2019) Welfare trends report. London: OBR. Available at: Welfare Trends Report
Office for Budget Responsibility (2023) ‘Fiscal risks and sustainability report – July 2023’. London: OBR. Available at: Fiscal risks and sustainability, July 2023 – CP 870
Office for Budget Responsibility (2024) Welfare trends report. London: OBR. Available at: Welfare Trends Report 2024
Office for National Statistics (2024) Self-reported long COVID, England and Scotland: May 2024, Table 2. Newport: ONS. Available at: Self-reported long COVID, England and Scotland - Office for National Statistics
Office for National Statistics (2025) Labour market overview. Newport: ONS. Available at: Labour market overview
The Economist (2024) A growing number of Britons are on disability benefits. Available at: A growing number of Britons are on disability benefits
Warner, M. and Zaranko, B. (2025) The relationship between NHS waiting lists and health-related benefit claims. London: Institute for Fiscal Studies. Available at: The relationship between NHS waiting lists and health-related benefit claims
5. Characteristics of current claimants
5.1. In Chapter 3, we looked at the trends in disability benefits’ claimants, including by age, gender and condition. It found that in August 2025:
- working age women were more likely to receive a disability benefit (8.9% of them did so) than working age men (where 7.7% did)
- the prevalence of disability benefit receipt increased with age, with the exception of people under 25, who have a higher rate of claiming than those immediately older than them, particularly so in the case of males aged under 20. 8.2% of 16 to 19 year olds receive a disability benefit, falling to 5.5% among 25 to 29 year olds, then rising to reach 14.1 % of 60 to 64 year olds.
- women are more likely to receive disability benefits than men in all age groups above the age of 30; below 30, men are more likely to receive these benefits than women
- 1.7% of working age people received disability benefits with a primary condition of anxiety or depression; arthritis was the next most common primary condition at 0.8 %
- the distribution across different age groups of the main conditions was very different – with neurodevelopmental conditions more concentrated among younger people, musculoskeletal conditions more prevalent among older people, with anxiety and depression fairly evenly spread among the groups aged 30 or older
5.2. Table 5.1 summarises the distribution of the working age PIP and DLA caseload across age, gender and primary conditions. This chapter then goes on to look at some of the other characteristics of PIP and DLA claimants. This analysis will be developed further in due course.
Table 5.1: Characteristics of working age claimants of PIP and DLA
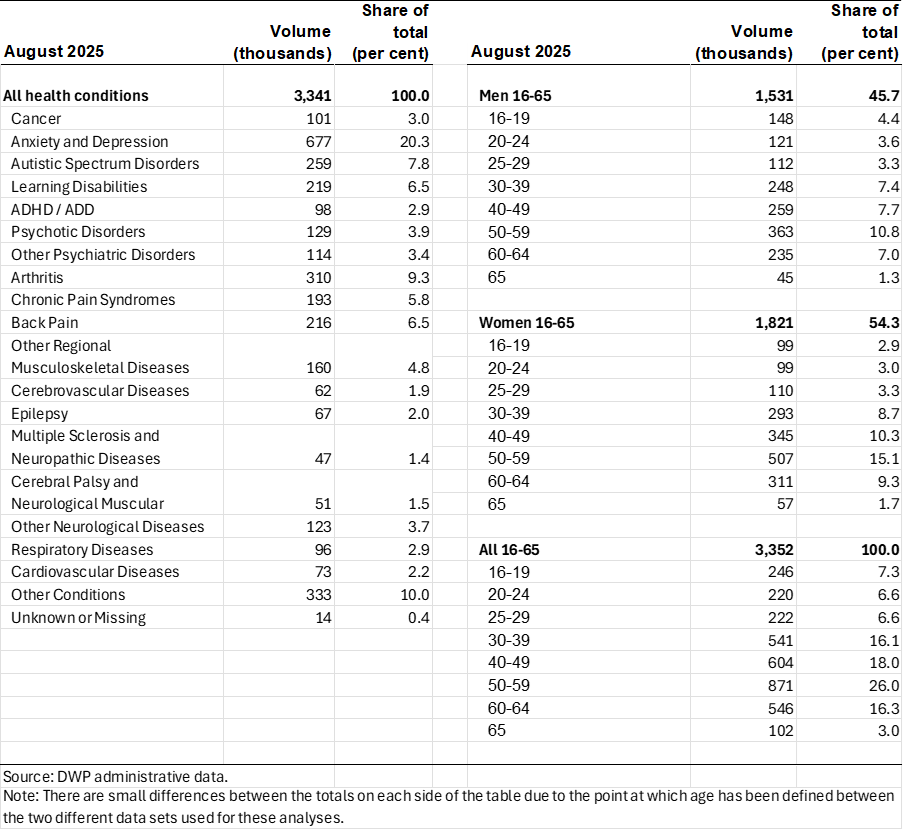
5.3. Chart 5.1 shows how primary reported conditions among PIP claimants vary by age.[footnote 41] PIP claimants aged under 25 have notably different conditions associated with their claim when compared to the over 25s. Broadly, autism, ADD/ADHD and learning disabilities are far more common among 16 to 24 year old PIP claimants, while anxiety or depression, musculoskeletal conditions and cancers, and most other conditions, are more common among ages 25 to 65. 79% of 16 to 24 year old PIP claimants have a psychiatric condition recorded as their primary medical condition, compared to just 38% for 25 to 65 year old claimants.
5.4. Autism and ADD/ADHD are most common at the youngest ages, and their proportion decreases with age. Likewise, learning disabilities are more common under 30 and their proportion also decreases with age, though more slowly. Anxiety or depression accounts for at least 9% of claims across all ages but is most common between the ages of 25 and 46, where it accounts for at least 25% of claims.
Chart 5.1: PIP primary condition by age, England and Wales, April 2025
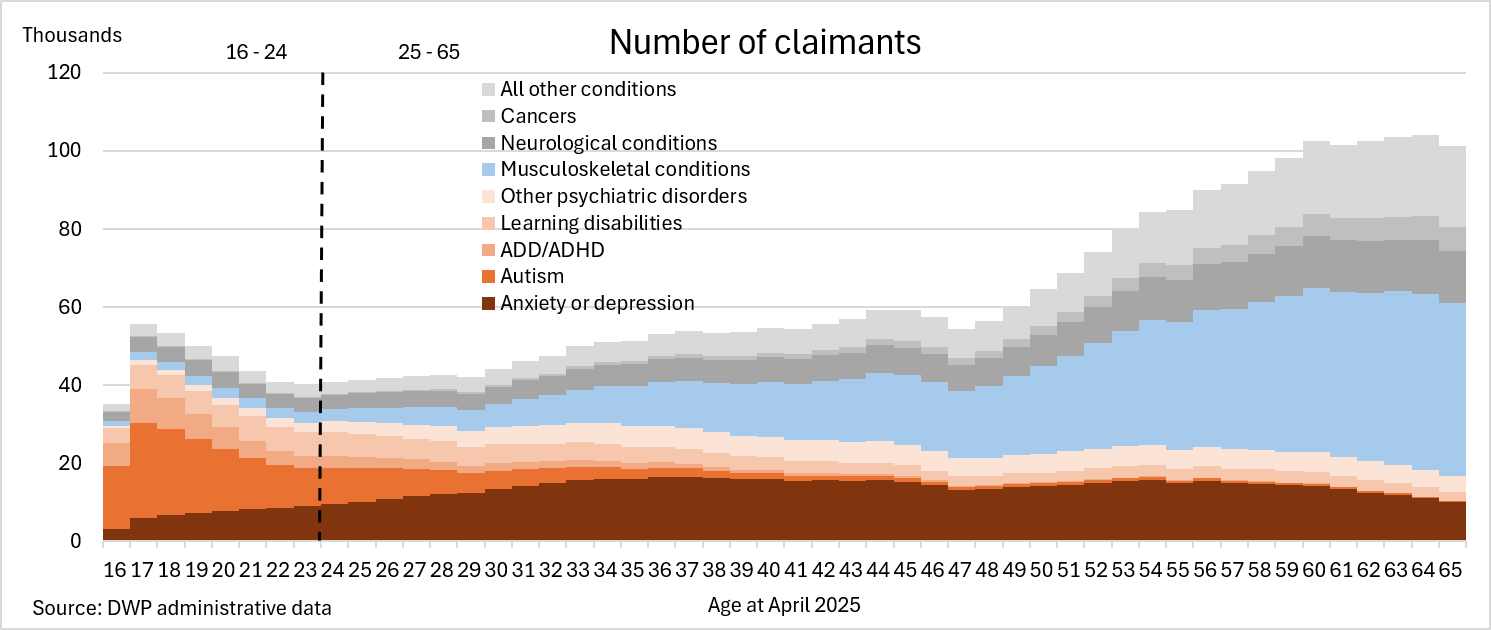
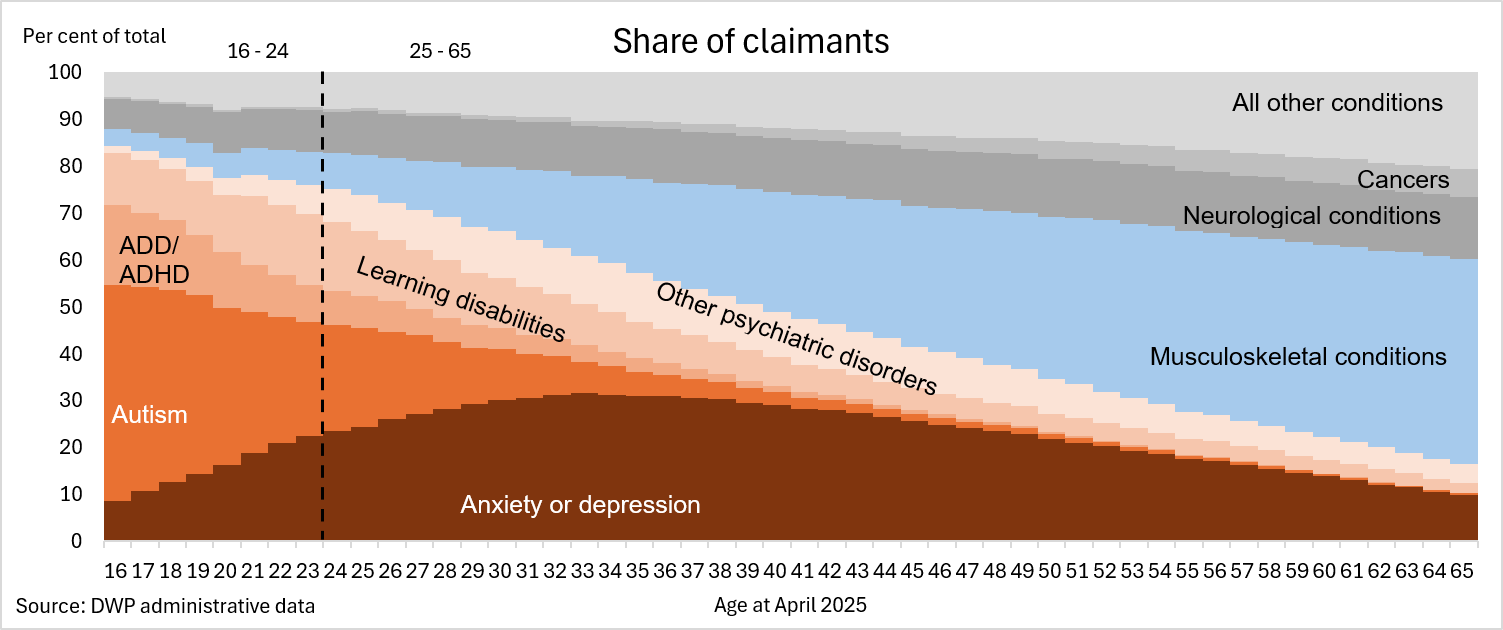
Rates received
5.5. Chart 5.2 shows the rates of PIP received, divided into the daily living and mobility components. At least 94% of claimants at all ages receive the daily living component, whereas for the mobility component only 75% of claimants in their late 30s receive it, and even by age 65, 18% of claimants do not have a mobility award.
5.6. Younger people have the highest proportion of enhanced awards for both daily living and mobility components. This is more prevalent for the cohort who are reassessed from DLA when they reach age 16, but still evident in new claims as well.
5.7. The proportion in receipt of the enhanced daily living rate declines with age (though absolute numbers still rise from about age 30, and particularly age 50). After the mid-30s, the proportion in receipt of the enhanced mobility rate rises steadily to reach 55% by age 65, while receipt of the standard mobility rate falls a little.
Chart 5.2: PIP rates received, by age, England and Wales, April 2025
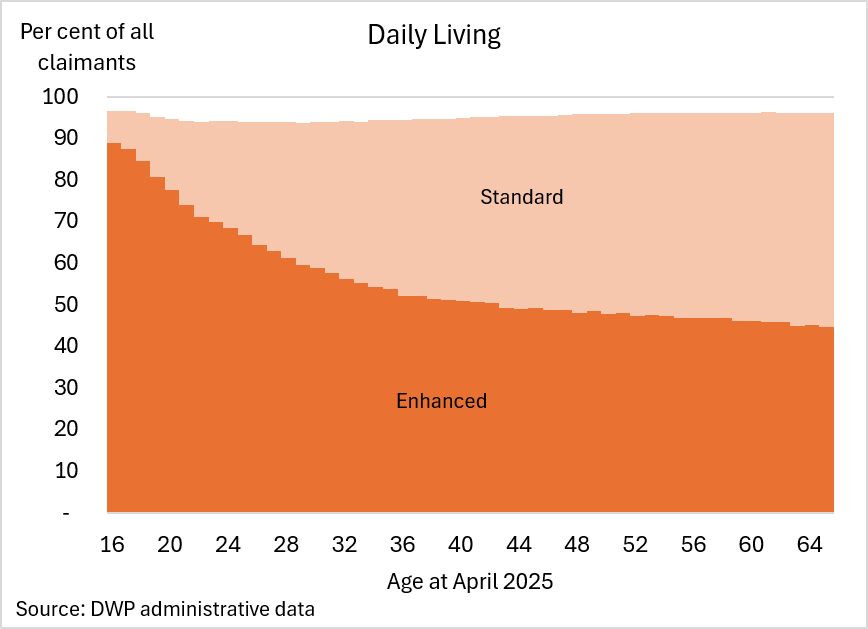
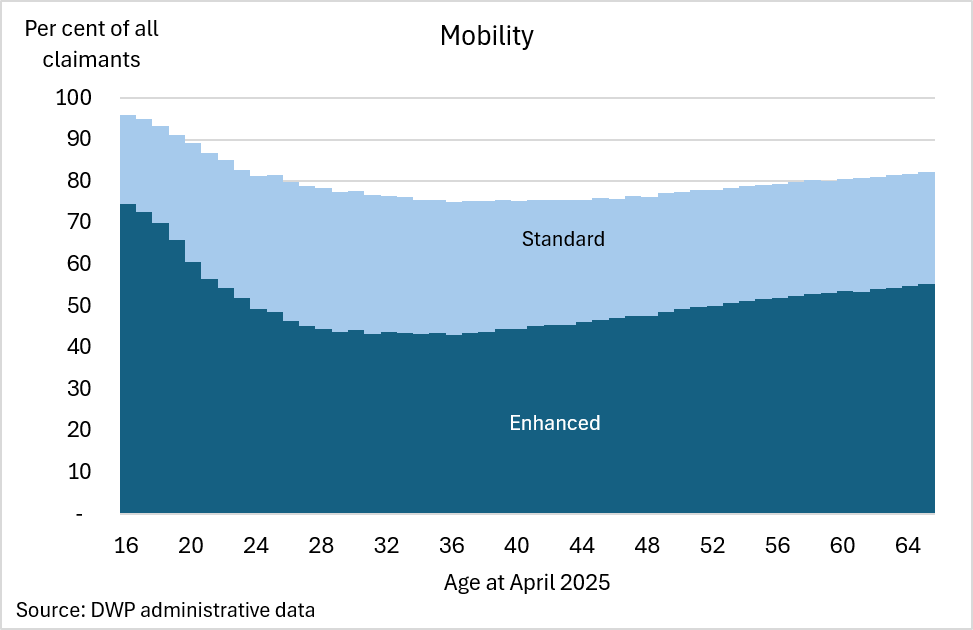
Source: DWP Administrative Data
Ethnicity
5.8. There is limited information on ethnicity of PIP and DLA claimants. Information on ethnicity is not actively recorded in DWP administrative datasets as this information is not required to process people’s claims or to decide about whether someone is entitled to PIP. The FRS provides analysis of state support by the ethnic group of the benefit unit head, pooling 3 years’-worth of data to enhance the sample, given the small size of some ethnic minority groups. Table 5.2 shows this for FYE 2022 to FYE 2024. It relates to all PIP claimants, not just those of working age.
5.9. All ethnic minority groups shown have a lower likelihood of receiving PIP than average, with the exception of benefit units with a Pakistani head, who have an average likelihood of claiming. Some of the differences in claiming between the ethnic groups could be down to a different age structure, or variations in the geographical location of different ethnic minority groups.
Table 5.2: PIP claiming by ethnic group of benefit unit head
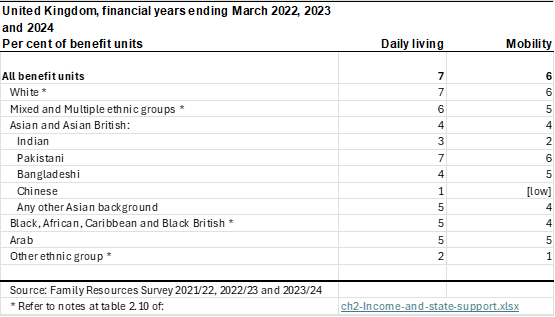
Receipt of other benefits
5.10. Chart 5.3 provides a breakdown of receipt of other benefits by working age PIP and DLA claimants, by component and rate. Fuller information on multiple benefit receipt is available in the data pack accompanying the Pathways to Work Green Paper (DWP, 2025, tables 1.1 to 1.5). Around two-thirds of working age disability benefit claimants receive an incapacity benefit (UC health or ESA), while almost three quarters receive either this or non-health-related UC. This varies according to the components and rates of PIP/DLA received:
- recipients of enhanced daily living are most likely to receive another health-related benefit (around 70% doing so), and 57% receive the Limited Capability for Work and Work Related Activity (LCWRA) element of UC (or its equivalent in ESA).[footnote 42]
- least likely to receive another health-related benefit are those who receive only one component – around half of these claimants do so. Over a third of these claimants receive neither UC (whether health-related or not) nor ESA, while only around 30% receive the LCWRA element of UC. These were also the claimants who are most likely to be regarded as having Limited Capability for Work (LCW) in UC (or its equivalent in ESA), with over 10% being so.[footnote 43]
- recipients of standard daily living fall between these 2 extremes, with almost 62% receiving another health-related benefit and 46% receiving the LCWRA element of UC (or ESA equivalent)
- claimants with an enhanced mobility component are more likely than others to receive contributory ESA without any means-tested benefits (UC or income-related ESA), which is likely to reflect the on average older age profile of these claimants.
Chart 5.3: Working age disability benefits receipt by rate and receipt of income-replacement benefits, England and Wales, May 2024
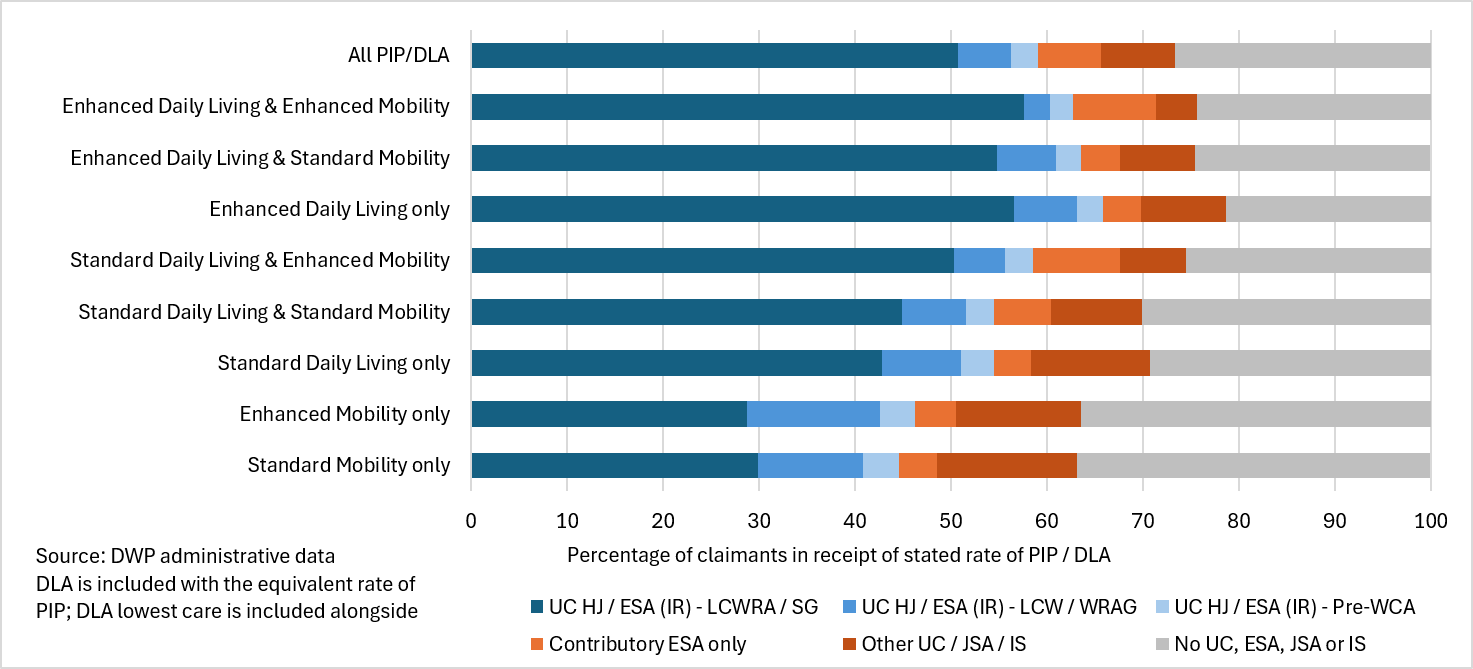
5.11. Looked at another way, those with the UC LCWRA (or ESA equivalent) are most likely to receive PIP (72% did) and receive the enhanced rates. Claimants of contributory ESA only are fairly similar in this respect. Fewer than 40% of claimants regarded as having LCW in UC received a disability benefit, and this fell to under 30% for those awaiting a Work Capability Assessment: this group will include a lot of claimants with shorter-term conditions that therefore would not meet the criteria for claiming PIP, although they may do subsequently.
Geography
5.12. Prevalence of disability benefits varies significantly by country and region, as seen in Chart 5.4. Wales and North East England each have almost 11% of their working age population in receipt of PIP or DLA, while London and the South East of England have close to 6% in receipt. Generally speaking, the further somewhere is from London, the higher the rate of receipt.
5.13. Although almost two-thirds of PIP claimants also receive an incapacity benefit, either UC or ESA, there is some variation in concurrent receipt, with 61.4% of working age PIP or DLA claimants in the South East having one (or more) of these benefits, and Wales and the North East of England having over 68% receiving one (or more) of these benefits. In contrast to its position on prevalence of disability benefits, PIP or DLA claimants in London are more likely than average to receive an incapacity benefit. Claimants of PIP or DLA in London are also the most likely to receive an incapacity benefit or non-health-related UC, along with the North East of England, where almost 76% do so.
Chart 5.4: Working age disability benefits prevalence, by country and region, and receipt of income-replacement benefits, May 2024
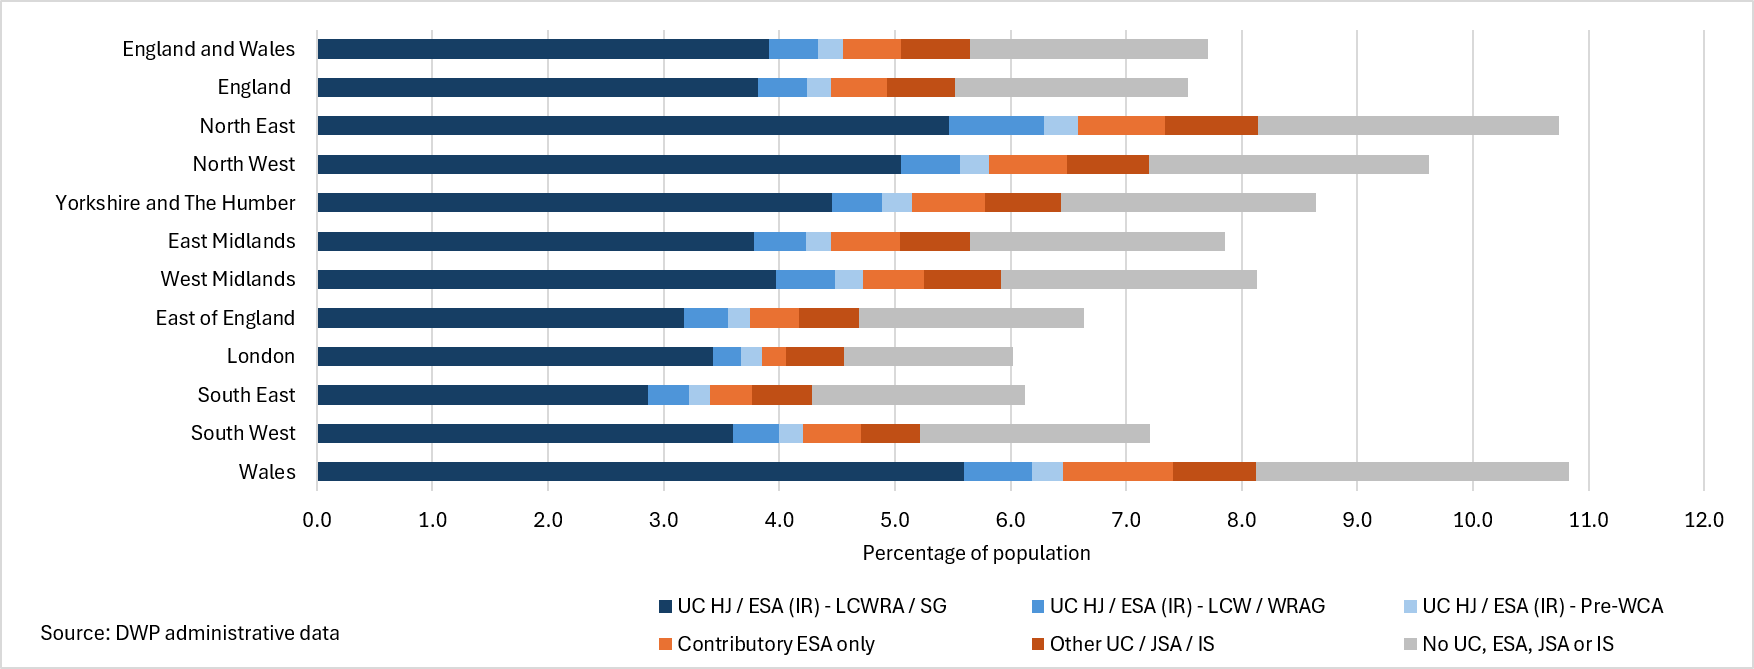
5.14. However, countries and regions are large areas containing a significant amount of diversity, and there is more variation within regions than there is between them.
5.15. Table 5.3 shows the unitary or lower-tier local authorities with the highest and lowest prevalence of working age disability benefits receipt. Care needs to be taken in interpreting these figures as due to local government reorganisation some unitary authorities (in particular) have replaced a diverse range of lower-tier authorities, with average prevalence rates that mask the variation within the area. Previous analyses of prevalence of health and disability benefits showed Easington local authority (covering the coastal area of County Durham around Seaham and Peterlee) as having one of the highest rates of benefit receipt, but since 2009, this has been covered by Durham unitary authority. Easington was one of many former coal mining areas to have high rates of health and disability benefits receipt.
5.16. Those areas with the highest prevalence of disability benefits can be summarised as mainly covering:
- the South Wales valleys – a major former coal mining area
- seaside towns such as Blackpool, Great Yarmouth and Tendring (covering Clacton-on-Sea)
- urban areas around Merseyside, and in the North East of England
5.17. Those with the lowest prevalence of disability benefits include:
- affluent boroughs in South West London and districts beyond the London boundaries in a West, South West and southerly direction
- Oxford and Cambridge and their hinterlands. These populations will be younger than average due to the large number of students, and therefore expected to have a low rate of receipt. Rates for the permanent population of these areas are likely to be higher.
Table 5.3: Working age disability benefits prevalence by unitary / lower-tier local authority, highest 20 and lowest 20
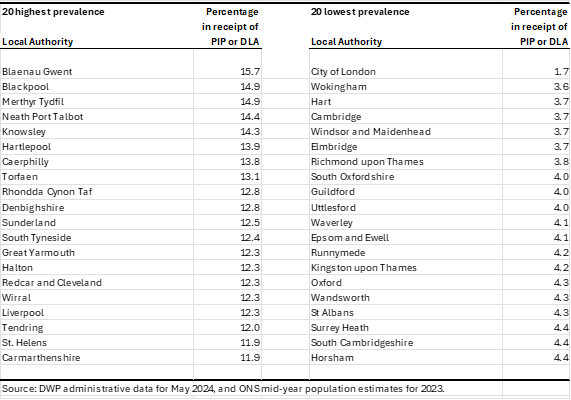
5.18. Table 5.4 shows the highest and lowest prevalence for each country and region, illustrating the intra-regional variation. In 5 of the regions, the areas with the highest prevalence include seaside towns, with 4 others being former mining and industrial areas. The areas with the lowest prevalence in their region (or country) include more affluent rural or London commuter areas and university cities, while Newcastle-upon-Tyne is both a university city and a former industrial area – with relatively high receipt (and higher than any London borough) but in a region where all other areas have higher prevalence.
Table 5.4: Working age disability benefits prevalence within countries and regions
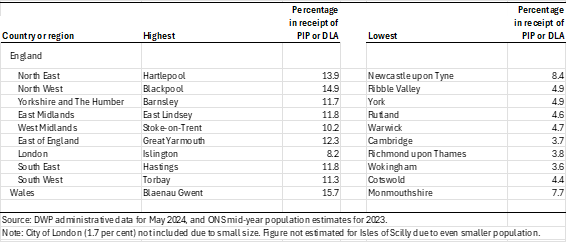
Further work
5.19. The characteristics covered in this chapter and Chapter 3 are not the only dimensions that can be considered with the available data. There are many other characteristics of PIP and DLA claimants that could looked at, and further work is planned in several areas. This includes:
- points awarded, activities and descriptors
- effect of the disputes process
- reasons for leaving PIP -employment and PIP
- wider household circumstances, including marital status
- position on the income distribution
- use of the Motability scheme
- associated carers receiving carer-related benefits and elements
5.20. This list is not exhaustive, and we are open to suggestions as to other areas to consider, data permitting.
References in Chapter 5
Department for Work and Pensions (2025) Pathways to Work: Reforming benefits and support to get Britain working. Available at: Pathways to Work: Reforming Benefits and Support to Get Britain Working Green Paper
6. Customer satisfaction and experiences of claiming PIP
6.1. This chapter summarises a range of our published social research on customer satisfaction and experience. Following an overview of PIP customer satisfaction drawing on our Customer Experience Survey (CES) we have synthesised and mapped evidence against the PIP customer journey to draw it together meaningfully.
The Customer Experience Survey
6.2. The CES is an ongoing survey designed to monitor customer satisfaction with services offered by DWP. [footnote 44] Rather than all DWP customers, CES surveys customers who have had contact with DWP in the past 3 months. Findings from CES are used across the department to inform improvements in service delivery and included in DWP’s Annual Report and Accounts as the department’s primary customer experience performance metric.
Headline results
6.3. Results show that PIP has lower rates of overall customer satisfaction than DWP services overall. In 2024 to 2025, satisfaction with PIP was 81% compared to 87% for DWP overall. Satisfaction has improved in recent years for both PIP and DWP overall (DWP, 2025d).
Chart 6.1 Customer satisfaction with all DWP benefits and PIP
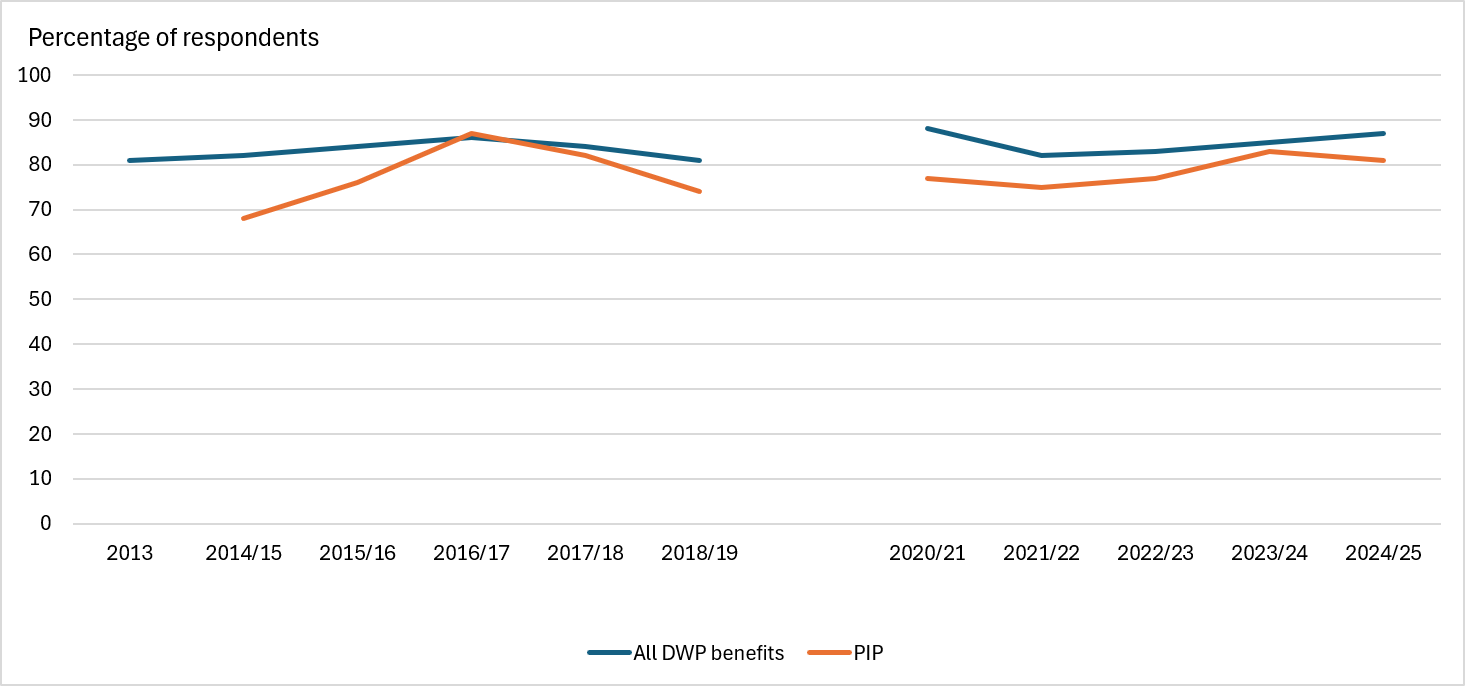
Drivers of customer satisfaction
6.4. The CES presents results from survey questions that map to 4 Customer Experience Drivers:
- Get it Right
- Make it Easy
- Communicate Clearly
- Professional and Supportive
Below we compare PIP customer results to DWP overall results.
Get it Right
6.5. On many questions that relate to the Get it Right driver, PIP customers were similarly satisfied to DWP customers overall, with the greatest difference being for the satisfaction with the time it took DWP to tell them the outcome of their claim (75% for PIP and 80% for DWP overall).
6.6. PIP and DWP customers overall again similarly agreed that: DWP colleagues did what they said they would (83% for both PIP and overall); DWP colleagues provided them with accurate information (79% for PIP and 80% overall); DWP made payments when they said they would (96% for both PIP and overall); DWP paid them the amount they said they would (94% for PIP and 93% overall); and they did not experience any problems with their new claim or change of circumstances (74% for PIP and 76% overall).
Make it Easy
6.7. The Make it Easy driver questions are where the greatest differences in agreement are observed between PIP and overall customers, highlighting potential difficulties PIP customers experience in the ease of using and interacting with DWP services.
6.8. Customers were similarly likely to agree that: it was easy to find all the information they needed on GOV.UK (85% for PIP and 88% overall); they were able to get the information they needed the first time (76% for PIP and 75% overall); and they did not have to contact DWP more than once to explain the same information (64% for PIP and 66% overall).
6.9. However, PIP claimants were less likely to agree that: they found it easy to make a new claim or report a change of circumstances (56% for PIP new claimants and 77% for overall new claimants; 67% for PIP change of circumstances and 82% for overall change of circumstances); it was easy to use DWP services (65% for PIP and 80% overall); and they found it easy to contact DWP about their claim (64% for PIP and 76% overall).
Communicate Clearly
6.10. PIP customers had similar results to Communicate Clearly driver questions as overall customers. PIP and overall customers similarly agreed that: they had a good understanding of what would happen next (77% for PIP and 80% overall); DWP told them when they should expect a decision on their benefit eligibility (77% for PIP and 76% overall); and decisions about their claim were explained clearly (82% for both PIP and overall).
6.11. The greatest difference was when customers were asked whether they agreed DWP communicated clearly with them (77% for PIP and 81% overall).
Professional and Supportive
6.12. In response to the Professional and Supportive driver questions, PIP customers were similarly likely to agree that DWP colleagues: handled their request professionally (84% for PIP and 85% overall); and understood their needs (75% for PIP and 78% overall).
6.13. PIP customers were less likely to agree that DWP tailored services to their personal circumstances (66% for PIP and 72% overall).
Box 6.1: the PIP customer journey
To help to contextualise our evidence on customer experience, this summarises how the customer journey through PIP can progress.
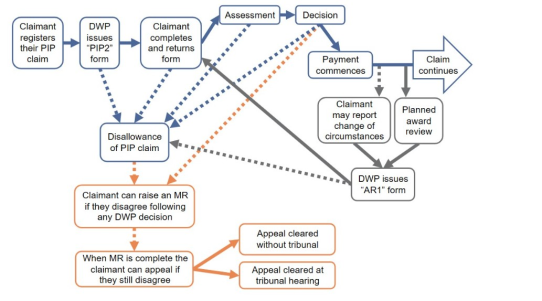
Stage 1: applicant registers their claim to PIP by completing a form called the PIP1. This can be completed using the PIP new claims telephone line or, in a limited number of postcode areas, online. The application form enables DWP to check whether basic qualifying conditions are met. For example, to apply for PIP you have to be aged between 16 and pension age (currently 66) and normally live in the UK.
Stage 2: DWP issues the “How your disability affects you” (PIP2) form, for completion by the applicant. This can be issued and completed on paper or digitally in most cases. Some applicants, such as people with appointees to manage their affairs, are not yet able to complete the PIP2 digitally, although this should be available soon.
Stage 3: applicant completes and returns PIP2 form – this can lead to:
- automatic referral to the Assessment Provider (AP)
- disallowance of the claim based on the information in the PIP2 form
- disallowance of the claim if the applicant fails to return the PIP2 form in time without being identified as having additional support needs
Stage 4: under normal circumstances, the applicant may have their claim assessed based on the paper evidence already submitted, or may be called for a telephone, video, or face-to-face assessment conducted by a qualified Healthcare Professional (HCP). The applicant may:
- attend and participate in their assessment
- fail to attend or participate in the assessment, which can lead to disallowance
Stage 5: DWP makes a decision based on the HCP advice and any additional evidence received. The outcome may be:
- an award, including a monetary amount of the award for both daily living and mobility components and, if appropriate, the period of time that should be allowed before a review of the award takes place
- a disallowance due to failing the assessment
Stage 6: if awarded, payment commences.
Stage 7: when the claim is in payment, a claimant must report any changes of circumstance relating to the claim, and this may lead to a review of the award.
Stage 8: claims may undergo a planned award review when they reach the end of their review period (unless they received an ongoing award, where they’ll receive a light touch review after 10 years).
Stage 9: in the case of a reported change of circumstance or a planned award review, an “AR1” form is issued.
Stage 10: if the claimant disagrees with a decision on their claim, including where an award has been given, they can ask for a mandatory reconsideration (MR). In an MR, a case-manager, independent of the one who made the original decision, reviews the claim and the decision made. At this stage, the claimant can also submit further information and evidence.
Stage 11: after the MR has been completed, if the claimant still disagrees with the decision they are able to lodge an appeal with His Majesty’s Courts & Tribunal Service. At a tribunal, a judge and one or two experts who are impartial and independent of DWP, will make a decision about the claimant’s case.
Stage 12: some appeals are cleared without a tribunal hearing, where the following outcomes are possible:
- withdrawn by the customer, or struck out by the tribunal
- lapsed – where DWP change the decision in the customer’s favour
Stage 13: some appeals are cleared at a tribunal hearing, where the following outcomes are possible: - DWP decision upheld by the tribunal - DWP decision overturned by the tribunal
PIP customer experience
6.14. Our body of research evidence, which we continually add to, provides rich insight into why customer satisfaction with PIP is lower than for other benefit lines.
6.15. We carry out research to identify and explore ways we can improve, through examining PIP applicants’ experiences in detail. This means our research often focuses on issues that are challenging, like the sharing of personal information about health impacts on daily life, or people who are more likely to experience challenges with PIP, such as those with fluctuating health conditions or a pre-disposition to anxiety. As such, our evidence can seem negatively biased although the underlying aim is to highlight how we can adapt to transform positively.
6.16. In this context the Health Transformation Programme (HTP) is implementing service design changes drawing on our learning in a “business as usual” (BAU) context to transform the PIP journey of the future.
6.17. Below, we present key findings from our own research on customer experience, predominantly on BAU PIP as well as exploratory work, some of which is informed by external bodies and representative organisations. We have synthesised our evidence to broadly reflect the different stages of the PIP customer journey and summarised cross-cutting themes. Numbers in brackets relate to the reports containing the evidence, and these are listed at the end of the chapter.
Application
Deciding to apply
6.18. Our research has shown that there is confusion around the eligibility criteria for PIP. There is a high volume of online information about PIP, but much of it is not from official sources. Analysis of PIP-related searches made via Google show that over three-quarters of searches result in people accessing sites other than GOV.UK (DWP, 2024a; DWP, 2025a).
6.19. Applicants have highlighted that the volume of online information can be confusing, leading them to limit the amount of time spent searching and instead just progressing with an application. This can lead to ineligible applications which result in customer disappointment and frustration (DWP, 2025a).
6.20. We have found a high degree of uncertainty around how the PIP award relates to the experience, or impact, of a condition rather than the presence or diagnosis of it (DWP, 2025a) and about entitlement for customers who are in work (DWP, 2024a). Whilst DWP provides numerous resources and signposts to information and support designed to help applicants at different stages of the journey, people are not always aware of this, or don’t access it (DWP, 2025a; DWP, 2025b).
6.21. We know that the decision to apply for PIP is often prompted by changes in health or disability status, financial hardship, or employment concerns. Some people may delay starting an application for months or years. This delay in initiating an application is commonly caused by a lack of motivation, a perceived lack of urgency, and/or not wanting to ask for help (often linked to not wanting to claim state benefits). Some applicants report waiting as long as possible – and exhausting all other alternatives – before beginning their PIP application. These applicants can then face additional emotional challenges throughout their journey, as their financial and health-related needs have increased DWP, 2021a; DWP, 2024a; DWP, 2025a; DWP, 2025b).
6.22. People may begin their journey to applying for PIP with negative preconceptions about PIP and DWP, often influenced by media narratives, personal experiences, or stories shared by others. These perceptions can create significant emotional barriers - such as shame, fear of judgement and anxiety (DWP, 2025b; DWP, 2025c).
6.23. In our research, many respondents report a feeling of uncertainty and trepidation about the PIP process (what will happen, how long it will take and what will be required of them), and of discomfort at the prospect of being assessed. Such feelings can cause health conditions, especially mental health conditions, to deteriorate or trigger anticipatory anxiety (DWP, 2025b, DWP, 2025c).
Registering a claim (PIP1 form) and completing an application (PIP2 form)
6.24. Currently, we offer most customers the default option of registering their claim by telephone, with a PIP staff member completing the PIP1 form whilst the customer is on the line. Under the HTP, we have started to offer a small number of applicants (based on their home address being in a select number of postcodes) the option of completing the PIP1 form digitally so we can test how that works before extending this option.
6.25. Whilst the initial application call is generally considered to be “easy” or at least “easier than expected”, with staff considered “friendly and helpful”, some customers find using the telephone difficult, if not a significant barrier (DWP, 2018). We know from our research on channel choice, that the telephone is the preferred route for more complex or high stakes queries such as those relating to payments, and where applicants lack digital confidence. (DWP, 2024b).
6.26. Our research highlights that the completion of the “How your disability affects you”, or PIP2, form is a particularly difficult stage in the PIP journey for most customers. Some applicants, typically with higher literacy and one primary condition, report that the PIP2 is relatively “straightforward” although this is not a common view (DWP, 2024a). The PIP2 form is 25 pages and the accompanying “information booklet” is 50 pages (DWP, 2013). The prospect of completing the “lengthy and complex” application, can be overwhelming, “daunting to start and draining to complete” for some customers which can lead to further delays in starting an application (DWP, 2024a, DWP, 2024c, DWP, 2024d). Whilst the paper form has been described as “intimidating”, online applicants report reduced stress and anxiety and are more likely to submit the application on the day they start it. (DWP, 2021b). Despite the length of the form, some applicants feel that it doesn’t enable them to portray the full and complex impacts of their conditions (DWP, 2021b; DWP, 2024c).
6.27. Applicants report that they can find the questions asked in the PIP2 complex and confusing. Issues are reported by people who do not have physical disabilities, as they feel this renders a lot of the questions, especially in relation to mobility, irrelevant, although they are still required to complete them (DWP, 2025c). As a result of the perceived discrepancy between the questions and the nature of mental health and neurodevelopmental conditions, customers with these conditions report difficulty understanding how to answer the questions in the PIP2 form. They highlight concerns that the questions are designed to catch them out or trip them up, which contributes to a sense of anxiety (DWP, 2025c).
6.28. People with fluctuating conditions also tend to report struggling to complete the PIP2 form accurately, in a way that is both honest and likely to secure an award of PIP. They report a sense they need to reflect how their condition is at its worst. It can be difficult to describe how a fluctuating condition impacts in a general way as required in the form, leading applicants with such conditions feeling frustrated and likely to be misunderstood. Further, the nature of their condition can mean flare-ups curtail how much effort and time they can devote to the completion of the PIP2 and can impact their mental health. (DWP, 2024b)
6.29. Other factors that we’ve heard affect how well customers can engage with the PIP2 form relate to literacy, not having English as a first language, mental processing issues or learning difficulties including dyslexia and other issues related to their health condition, such as dexterity. (DWP, 2024a)
6.30. For many applicants the process of having to reflect on their lives and health conditions, which may be rooted in trauma, and detail personal and sensitive aspects of these in the PIP2 form, is challenging and can be upsetting (DWP, 2024c; DWP, 2025b).
6.31. Voluntary sector support organisations have highlighted how applicants typically require reassurance and support in progressing their PIP applications due to a lack of confidence (DWP, 2025b).
Supporting evidence
6.32. Providing supporting evidence alongside the completed PIP2 can also be challenging, with some applicants saying that they struggled with this aspect, either because they had no formal diagnosis and therefore nothing to submit or were unable to access or collate records due to changes in living circumstances such as moving areas) or not knowing how to access their records (DWP, 2024a).
6.33. People with mental health or neurodevelopmental conditions report concerns around providing sufficient evidence of the impacts of their conditions, even with diagnoses. This can exacerbate feelings of impotence, anxiety and depression (DWP, 2025c).
6.34. When prompted, some of our research respondents mentioned that they did not provide evidence because they assumed if it was necessary, it would be explicitly requested of them, and they did not recall that this was the case (DWP, 2024a).
Channel preference: application
6.35. As we have moved to offering a wider range of ways to engage with DWP, we have built our understanding of customer preferences and propensities to use different channels such as telephone or online. Our research consistently finds that PIP customers want a range of ways to interact with us, with telephone being a preferred method for complex issues such as payment issues, complaints or disputes and online options preferred for simple tasks (DWP, 2024b)
6.36. We know that internet access is high amongst our PIP customers, with more than 4 in 5 accessing the internet in 2024 (DWP, 2024b). Whilst people recognise there could be accessibility and efficiency benefits to completing a PIP application digitally, including being able to apply at any time, (DWP, 2024d) there are barriers for PIP customers using the internet. These can be related to health conditions or a lack of digital skills, or more general apprehension about making a mistake. Amongst existing internet users, their biggest concerns in using digital channels are around fraud and security (DWP, 2024b, DWP, 2025c).
Assessment and decision
6.37. Sometimes a decision on the award of PIP can be made without any further information being required or an assessment by an HCP.
6.38. When customers are required to take part in an assessment, they say this tends to cause anxiety. The prospect of being “judged” by an assessor and uncertainty around the assessment format contribute to feelings of unease (DWP, 2025c).
6.39. Some applicants are not aware that the assessment is carried out by a medical professional. We undertook exploratory research regarding the use of assessors with varying degrees of specialism to determine the potential impact on customers. Generally, research participants were in favour of specialisation, where assessors were “matched” to their condition, highlighting that it made them feel understood, listened to and supported, and built confidence and trust. Some reported being willing to delay their assessment or use a different channel to their preferred one, to have an assessment by a specialist. However, there is a balance to be struck as over-emphasising an assessor’s specialism had a negative impact, with participants doubting that the specialist would assess them as an individual given their expertise and pre-determined beliefs about their condition. This could inhibit some applicants’ willingness to share their personal experiences (DWP, 2024e).
6.40. Although most applicants don’t require support with the assessment itself, emotional or moral support is appreciated. As with all stages of the journey, applicants value being informed about what to expect (DWP, 2025b).
Channel preference: assessments
6.41. Assessments can be conducted over the telephone, by video-call or in-person, although historically awareness of the option to choose a mode has been low (DWP, 2024b). There is no clear preference for mode of assessment with it being largely a product of individual circumstances (DWP, 2021c). For example, some people are unable to hold a handset for any or an extended period or are unable to communicate by telephone (DWP, 2021c) whilst others welcome the fact that they have greater control over their environment and can put coping strategies in place if using the telephone. Others report that face-to-face assessments, whilst daunting, allow them to better “show” the impact of their health condition or neurodiversity (DWP, 2025c).
6.42. Our research on channel choice for future assessments revealed that applicants are most likely to say they would like the same channel through which their most recent assessment was conducted (DWP, 2024f).
6.43. Customers who are confident that they have supporting evidence for their application tend to feel less anxious about the assessment as they don’t feel a need to convince the assessor (DWP, 2025c).
Experience of assessments
6.44. Our evidence shows varied experiences of actual assessments, with assessor interaction being a primary driver of whether the experience is positive or not. Our exploratory research with condition focused assessors suggests that being listened to builds trust and rapport, which in turn leads to confidence in the process (DWP, 2024e). Some customers report struggling to make their case or feeling misunderstood, and some felt unprepared for the process of being “interviewed” (DWP, 2024a). Some applicants who scored zero points at assessment said that, with hindsight, they wanted to be more directive in their assessment in terms of what they wanted the assessor to hear about (DWP, 2024a).
6.45. A common issue raised by customers at assessment stage is that assessors often repeat questions that applicants feel they have already responded to in their forms. This repetition can be for legitimate reasons, with the assessor needing an applicant to explain the impact of their condition more fully, whether and how it changes, or to seek clarification. However, it can cause anxiety as customers worry the assessor hasn’t reviewed their case, that they haven’t provided the “right” information or that the assessor is trying to catch them out (DWP, 2025c). Some applicants have issues with recall and comprehension, which made them more prone to worry about making mistakes (DWP, 2025c).
6.46. Research participants with mental health conditions report frustration related to a perceived disproportionate focus on questions relating to physical ability during the assessment. Customers without physical impairments view mobility questions as irrelevant. This, in turn, can cause people with mental conditions stress, as it detracts from them discussing the impact of their mental health on their daily lives (DWP, 2025c).
6.47. Positive interactions with an assessor are characterised by the assessor explaining the assessment process, customers having a high degree of confidence in the assessor’s ability to assess their condition and the assessment feeling tailored to the applicant’s condition (or understanding the purpose of questions which felt less relevant (DWP, 2024b).
Decision
6.48. Once the decision about a PIP award has been made, a letter is sent to the applicant with the decision, detail on the score for each PIP activity, what to do if there is any disagreement with a decision, and signposting to other benefits, support and advice. If eligible for PIP, the letter will also provide the date of first payment and how long until the claim will be reviewed (DWP, 2024a; DWP 2026a).
Understanding the decision
6.49. Whilst most applicants report they have a good understanding of the decision about their PIP claim, their understanding of how DWP had reached their decision and how the form, evidence and assessment had been considered is lower.
6.50. Reasons why applicants may not understand the specifics of the decision letter include:
- skim-reading the letter because they are only interested in the decision, or because it is seen as too long and wordy
- difficulty reading, understanding and remembering information because of a health condition, illness or disability
- not understanding how the decision has been made due to disagreeing with the decision or feeling that the points awarded do not accurately reflect the impact of their condition or disability, or what they said to the assessor (DWP, 2018; DWP, 2024a)
Responses to the decision
6.51. Applicants report a range of responses to receiving the decision on their PIP award. Relief is experienced by those receiving the outcome they are hoping for. However, when people don’t agree with the decision, receiving the letter can be demoralising, and they may feel disappointed or angry. In these cases, the way in which the decision is communicated can affect how they feel about it, particularly as applicants may see the assessment for PIP as a “judgement” of their health condition or disability and the way they experience this. For example, some people experiencing fluctuating conditions felt that the information they received lacked clarity about how decisions were made. This increased fears that they had been misunderstood during their assessment, and the impacts of their conditions had not been fully understood (DWP, 2024c; DWP, 2025b; DWP, 2025c).
Support to understand the decision
6.52. Some PIP applicants report seeking out help to understand the decision letter. Applicants needing support to understand their letter may have a learning disability, low literacy, or speak little English. They report feeling that the decision letter uses complex wording or contains a lot of information (DWP, 2018).
6.53. When people who scored zero points and therefore were deemed ineligible for PIP were asked if they understood the outcome, they said including additional information with the decision letter could be helpful. More detail on how their case was scored, and access to assessor notes, were suggested (DWP, 2024a; DWP 2025b).
Mandatory Reconsiderations
6.54. After receiving their PIP decision letter, applicants who disagree with the outcome can request an MR. MR is the initial formal stage for challenging a PIP decision, where a customer chooses whether to re-engage with DWP to pursue their application further or to disengage from the process, unless they later return due to a review or change in circumstances.
Reasons applicants request a Mandatory Reconsideration
6.55. PIP applicants who request an MR often do so because they do not originally receive a PIP award. Some feel that their assessor was unfair during the health assessment, which made them more likely to go on to request an MR. Other reasons for requesting an MR include customer’s confidence in their eligibility and a desire to ensure that all medical evidence is considered (DWP, 2018; DWP, 2024a; DWP, 2025c).
6.56. Paradoxically, applicants who score zero points at assessment tend to be confident in their eligibility for PIP, believing that the zero points score is an error, either by the assessor or due to how they responded to questions during the health assessment (DWP, 2024a).
Reasons applicants do not request a Mandatory Reconsideration
6.57. Customers who do not receive a PIP award and decide not to pursue their claim further tend not to have another plan in mind. They generally lack awareness of other benefits that might be available to them as well as where they can find this out. These customers require information on next steps and potential support services that can help them. In addition, customers often benefit from access to support to address wider needs that could relate to finances, housing, relationships, employment and managing their health conditions, and they may not know where to access this support (DWP, 2025b). Those suffering with anxiety report feeling a disconnect between the information in the decision letter and what they had told the assessor which leads them to challenge the decision (DWP, 2025c). However, some of these customers lack the emotional energy to continue the process to the MR stage (DWP, 2025c). Customers who choose not to submit an MR also express emotional fatigue, which contributes to their decision not to pursue an MR (DWP, 2025b).
Awareness and understanding of Mandatory Reconsiderations
6.58. Applicants tend to have low understanding and awareness of the MR process; after receiving the decision letter understanding of MRs often remains limited (DWP, 2018; DWP, 2025b). Customers express that additional detail in the decision letter would be helpful. This includes what the process involves and what to do to start the process, as well as signposting and encouragement to access support at this stage (DWP, 2018; DWP, 2024a; DWP, 2025b).
6.59. When seeking further information about MRs, DWP is not considered a helpful source of advice and support, largely due to concerns around impartiality when they have already given a decision the applicant disagrees with. Some customers carry out online research or revert to social media to find out more about the process. Such customers tend to feel more confident about challenging their decision. A small number of customers use the PIP enquiry line (DWP, 2018).
Submission of additional evidence at Mandatory Reconsideration
6.60. The most common reason for submitting additional evidence at MR stage is acquiring new information since an original application. Customers also cite not knowing what would be useful when they apply or experiencing a change in condition since applying. Some are encouraged to provide further evidence by health professionals at the MR stage, who highlight the importance of providing the most up-to-date information (DWP, 2018). PIP customers have suggested improvements to the MR process would include better communication, specifically clearer guidance about the process, and signposting to support to help them through the processes (DWP, 2025b).
Channel preference: Mandatory Reconsiderations
6.61. PIP customers have differing preferences about how to contact DWP to raise a dispute or make a complaint. Currently, there is no online option for raising a dispute. Many indicate that they would prefer to do so online if a digital option was available (DWP, 2024b). Some customers express a preference for speaking directly with a DWP agent at the MR stage to explain their reasons for challenging a decision and to better understand the next steps (DWP, 2026b).
Appeals
6.62. Appeals are the next stage in disputing a decision after an MR and are managed independently by HM Courts and Tribunals Service. This process allows customers to have their case reviewed outside of DWP.
Reasons applicants appeal
6.63. Commonly, appeals are motivated by dissatisfaction and/or disagreement with an MR outcome. As with MRs, applicants are more likely to submit an appeal if they do not receive an award. At the appeal stage, customers report doubting that their application has been fully reconsidered by DWP, with some feeling that the decision letter and the MR outcome are similar. Those who do not proceed to the appeal stage cite finding the process too stressful to continue further (DWP, 2018).
Awareness and understanding of the appeals process
6.64. As with MRs, applicants have a limited understanding of the appeals process (DWP, 2018). Some seek guidance from informal sources such as friends and family or through searching online, only a few use formal sources (DWP, 2025b). At the appeals stage, customers are more likely to contact DWP to clarify information, rather than to seek support or advice. DWP is not considered a source that customers can approach during an appeal, as, like for MRs, applicants suspect DWP will not give them impartial advice (DWP, 2018). Customers need both emotional support to motivate them to request an appeal as well as practical support, such as help filling out forms (DWP, 2025b).
Submission of additional evidence at appeal
6.65. The reasons for supplying further medical evidence at the appeal stage are similar to those at the MR stage. Customers often use the time between the MR and tribunal to obtain evidence they have previously been unable to source. Many are encouraged to seek additional evidence by support organisations, which advise them on the types of evidence that will be helpful. Reasons cited for not submitting this evidence earlier include not having it in time, not knowing what would be useful, changes in their condition, or the fact that the evidence is oral and therefore cannot be submitted in written form (DWP, 2018).
6.66. Most customers who pursue an appeal attend their tribunal in person, with mixed experiences. Those who have a negative experience report feeling rushed or struggling to explain their condition. When customers feel that the panel is independent and able to assess their case objectively, as well as including medical professionals who fully understand their conditions, this leads to a positive experience (DWP, 2018).
Award Reviews
6.67. Award Reviews ensure that customers continue to receive the correct level of support through PIP. They may be planned, occurring at scheduled intervals, or unplanned, triggered by changes in a customer’s health or personal circumstances. Overall, customers have a good understanding of their PIP award from the information included in the decision letter, such as how long it will last and when the review is due to take place (DWP, 2018). However, customers find the Award Review process stressful. Customers do not anticipate the arrival of the “AR1” review forms so far in advance of their current award end date, which is a deliberate strategy to allow people sufficient time to complete them. Many customers are unaware that their current award is due to end and attempts to better understand the process by contacting DWP can be met with challenges in accessing the right information (DWP, 2025b).
6.68. The stress and anxiety associated with an Award Review are comparable to what customers experience during their initial PIP application, with the AR1 form closely resembling the PIP2 in terms of length and coverage. Many perceive the review process as an attempt to withdraw or reduce their PIP entitlement, which can cause significant distress. Customers with conditions that are unlikely to change often question the rationale for conducting reviews (DWP, 2025b).
6.69. Customers seek both emotional and practical support to help them better understand the Award Review process and its purpose. This support often comes from the same sources that assist them during their initial application, including knowledgeable family members or Citizens Advice. (DWP, 2025b).
6.70. There is uncertainty about how to complete the AR1 form and the reasons for doing so, particularly when customers have not experienced a change in their condition. Some feel the form is designed to “catch them out” and conduct their own research online about Award Reviews, although they are concerned that the information they find might not be comprehensive (DWP, 2025b).
Cross cutting themes
6.71. Whilst we have mapped our evidence to the customer journey, there are a range of cross cutting themes:
- emotional impacts of the PIP journey on applicants
- complexity of communications such as the PIP2 and decision letters
- multi-channel access requirements, with preferences shaped by individual circumstances
- limited understanding of evidence requirements and that award decision is based on impacts of health condition(s) not diagnoses
- trust and fairness; applicants need to feel they have been able to demonstrate the impact of their condition(s)
- support needs, which tend to met by third party organisations, friends and family, even when support is available through DWP
There are multiple opportunities for transformation.
The Health Transformation Programme
6.72. The HTP is transforming the PIP service, introducing a simpler application process, including an option to apply online, improved evidence gather and a more tailored journey for customers. These changes are especially important for customers with fluctuating conditions, mental health conditions, and/or low digital confidence.
6.73. The HTP is also developing a new single Health Assessment Service for all benefits that use a functional health assessment. We are testing new approaches to assessments, including improving how assessors interact with customers and exploring the use of specialist assessors. These efforts aim to make assessments feel more personalised and fair, reducing emotional burden and increasing confidence in the process.
6.74. Additionally, the programme is exploring better ways to communicate decisions and signpost customers to wider support services. By offering more tailored channels and clearer guidance, HTP is working to ensure that customers feel understood, supported, and empowered throughout their PIP journey.
Our approach to evidence for the Health Transformation Programme
6.75. The HTP is expected to run until 2029 and is a large and complex programme. In this context we are carrying out small-scale tests and experiments alongside user research to inform specific parts of the process and journey, ahead of formal evaluation activities taking place when the programme has scaled.
6.76. We continue to deliver a rolling programme of behavioural insight studies. These enable us to provide rapid insights to feed into the design of future services, helping us to understand how service users perceive and respond to different initiatives without disadvantaging or burdening them.
6.77.Our revised evaluation strategy for HTP was published in March 2026 (DWP, 2026c). The previous evaluation strategy was published in 2023.
References in chapter 6
Department for Work and Pensions (2013) Example – PIP2 how your disability affects you. London: DWP. Available at: Example - PIP2 how your disability affects you
Department for Work and Pensions (2018) Personal Independence Payment Claimant Research – Final Report. London: DWP. Available at: Personal Independence Payment claimant research – final report
Department for Work and Pensions (2021a) Triggers to Claiming Personal Independence Payment. London: DWP. Available at: Triggers to claiming Personal Independence Payment - GOV.UK
Department for Work and Pensions (2021b) Claimant views on ways to improve PIP and ESA questionnaires. London: DWP. Available at: Claimant views on ways to improve PIP and ESA questionnaires - GOV.UK
Department for Work and Pensions (2021c) Claimant experience of telephone-based health assessments for PIP, ESA and UC. London: DWP. Available at: Claimant experience of telephone-based health assessments for PIP, ESA and UC - GOV.UK
Department for Work and Pensions (2024a), Experiences of PIP applicants who received zero points at assessment. London: DWP. Available at: Experiences of PIP applicants who received zero points at assessment - GOV.UK
Department for Work and Pensions (2024b) Digital skills, channel preference, and access needs: Personal Independence Payment customers. London: DWP. Available at: Digital skills, channel preference, and access needs: Personal Independence Payment customers - GOV.UK
Department for Work and Pensions (2024c)The Impact of Fluctuating Health Conditions on Assessment. London: DWP. Available at: The Impact of Fluctuating Health Conditions on Assessment - GOV.UK
Department for Work and Pensions (2024d) Apply for PIP Digital Self-Serve: Evaluation Summary. London: DWP. Available at: Apply for PIP Digital Self-Serve: Evaluation Summary - GOV.UK
Department for Work and Pensions (2024e) Specialism in the Health Assessment: Initial Exploratory Research. London: DWP. Available at: Specialism in the Health Assessment: Initial Exploratory Research - GOV.UK
Department for Work and Pensions (2024f) Health Assessment Channels Research. London: DWP. Available at: Health Assessment Channels Research - GOV.UK
Department for Work and Pensions (2025a), Applicants’ Journeys to Claiming PIP: Research. London: DWP. Available at: Applicants’ Journeys to Claiming PIP: Research - GOV.UK
Department for Work and Pensions (2025b) Additional Support Needs in the PIP Claim Journey. London: DWP. Available at: Additional Support Needs in the PIP Claim Journey - GOV.UK
Department for Work and Pensions (2025c) Understanding PIP Applicant Experiences: the experience of applicants with anxiety. London: DWP. Available at: Understanding PIP applicant experiences: the experience of applicants with anxiety - GOV.UK
Department for Work and Pensions (2025d) DWP customer experience survey: benefit customers 2024 to 2025. London: DWP. Available at: DWP customer experience survey: benefit customers 2024 to 2025
Department for Work and Pensions (2026a) Personal Independence Payment (PIP): after you’ve applied. London: DWP. Available at: Personal Independence Payment (PIP): After you’ve applied - GOV.UK
Department for Work and Pensions (2026b) PIP Mandatory Reconsiderations: Customer Research Findings. London: DWP. Available at: PIP Mandatory Reconsiderations: Customer Research Findings - GOV.UK
Department for Work and Pensions (2026c) Health Transformation Programme Evaluation and Monitoring Strategy 2026’. London: DWP. Available at: Health Transformation Programme Evaluation and Monitoring Strategy 2026 - GOV.UK
7. Perceptions of disability benefits
7.1. This chapter explores awareness of and attitudes towards disability benefits over time. Analysis was conducted using data from the British Social Attitudes Survey[footnote 45]. Public support for spending on disability benefits has always been higher than support for other working age benefit recipients such as unemployed people, but there has been a relative decline in support since 2017.
Public attitudes to welfare
7.2. Between 2010 and 2022, there was a general fall in anti-welfare attitudes (National Centre for Social Research, 2023). From 2009 to 2012, around 35% of respondents agreed that “many people who get social security do not really deserve any help”. This had fallen to around 15% by 2019, and has edged closer to a quarter in recent years, as shown in Chart 7.1.
Chart 7.1: Attitudes towards welfare benefits
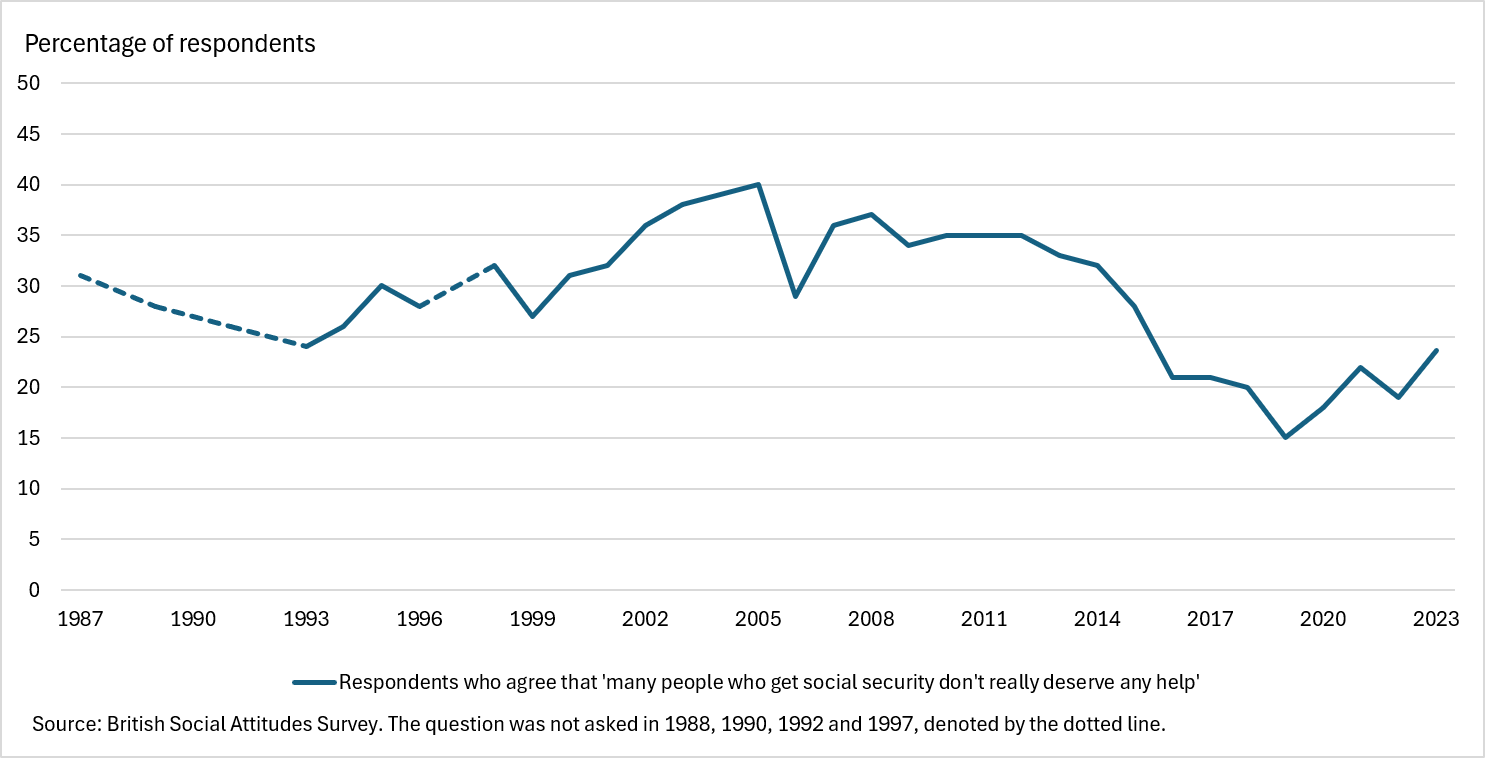
7.3. Again in 2010, 29% of respondents felt that “the government should spend more money on welfare benefits for the poor, even if it leads to higher taxes” (National Centre for Social Research, 2023). This figure rose to 37 % in 2022, shown in Chart 7.2.
Chart 7.2: Attitudes towards spending money on welfare benefits
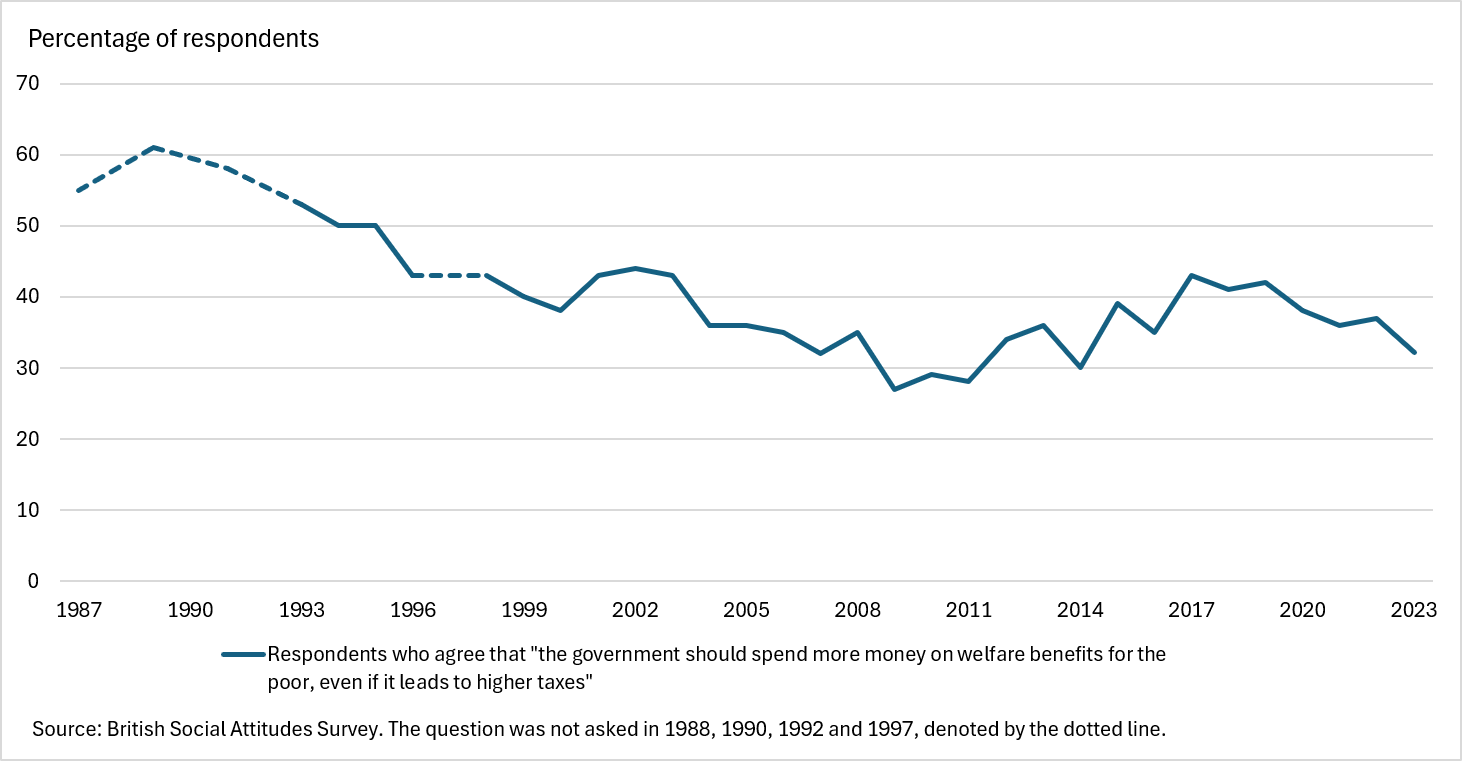
Public attitudes towards disability and welfare
7.4. Every few years, respondents were asked whether they would like to see more or less government spending on benefits for disabled people who cannot work and unemployed people. Support for increased spending for disabled people has been consistently higher than for unemployed people. Chart 7.3 shows the full range of responses in relation to spending on disabled people.
7.5. Those in favour of spending less on disability benefits has been consistently below 10%, except in 2024. Support for spending more on disability benefits fell during the 2000s, but rose again up to 2017. This has since fallen to its lowest level – but still around 45% of respondents were in favour of spending more. Geiger (2025) also explores this in his work on PIP and public opinion, stating that whilst support has declined, very few people believe there should be less spending on disability benefits.
Chart 7.3: Attitudes towards spending for disabled people who cannot work
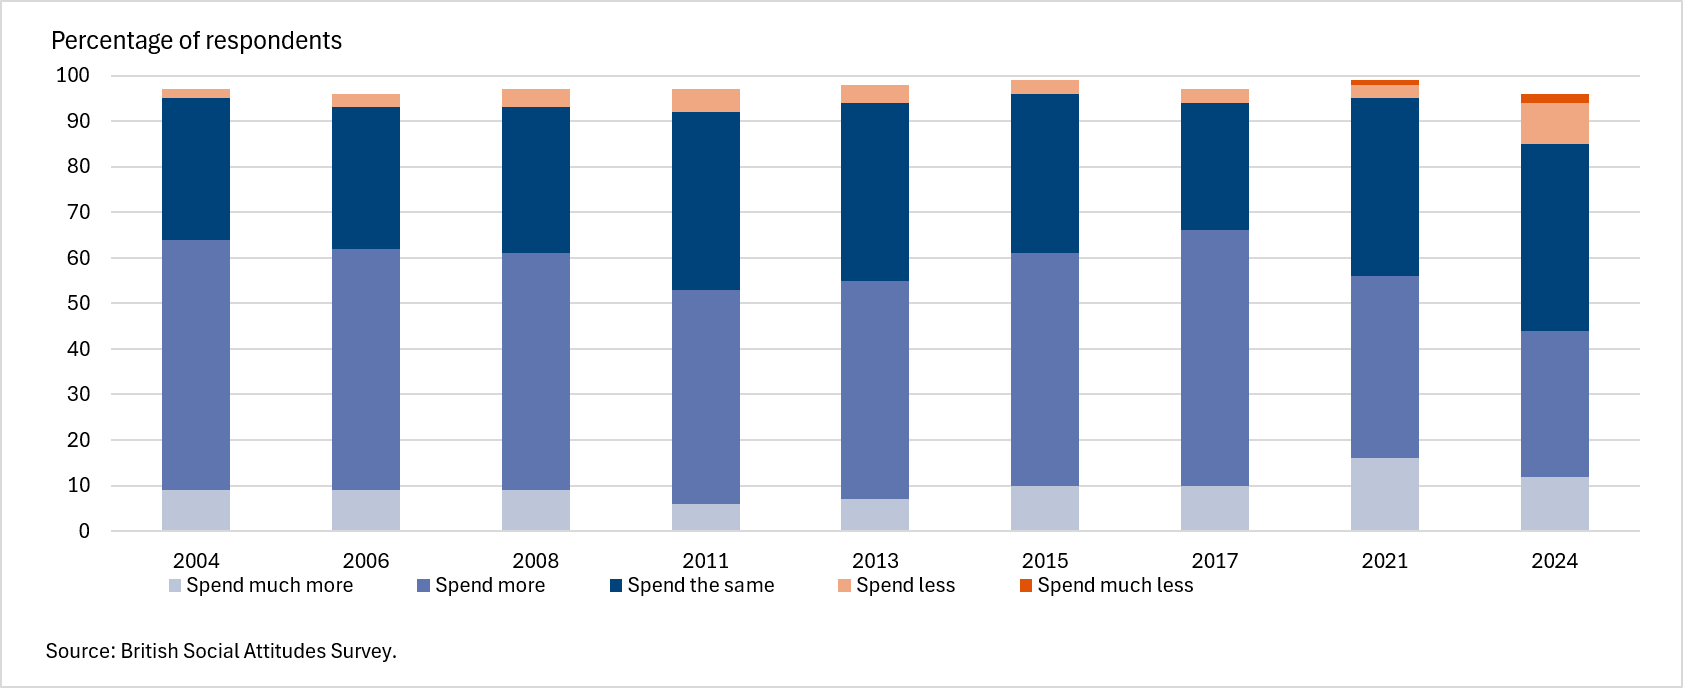
7.6. When it comes to claiming disability benefits, in 2024 public opinion on the process of claiming disability benefits was evenly split, with 29% of respondents feeling it was ‘too easy’, 29% feeling it was ‘too difficult’ and 35% responding that they perceived claiming disability benefits to be ‘neither too easy nor too difficult’ (National Centre for Social Research, 2025).
7.7. Again in 2024, the requirement that exists for people with a disability who are claiming benefits “to take measures to find appropriate work’ was seen as “about right” by 62% of respondents with only 11% who believe it was “too weak” (National Centre for Social Research, 2025).
7.8. Even when comparing different health conditions, in 2023 around 75% of respondents thought that claimants who cannot work because of a disability or health condition should receive the same amount of benefit regardless of their disability or health condition. Of those who thought different health conditions should receive different levels of benefit, physical health was most favoured, followed by cognitive, with mental health being the least favoured, shown in Chart 7.4.
Chart 7.4: Attitudes towards disability benefit amount and health condition

Public awareness of PIP
7.9. A large majority of the general population are aware of PIP and awareness is near universal among disabled people. Findings from wave 2 of the Perceptions of DWP survey (2026a) found that 85% of the general population and 92% of disabled people were aware of PIP. The proportion who had either not heard of it or only heard but knew nothing else was 31% of disabled people compared to 42% of the general population.
7.10. Despite awareness of PIP as a benefit being high, awareness of the PIP eligibility criteria is less so (DWP, 2026b). Awareness of the eligibility criteria was higher among PIP claimants and participants with a disability or health condition than the general population.
7.11. Participants were given several statements about the PIP eligibility criteria and asked whether these were true or false.
- 65% of the general public correctly identified that PIP eligibility is related to having a disability or health condition that affects everyday tasks, compared to 85% of PIP claimants and 74% of participants with a disability or health condition
- around half (47%) of the general public correctly recognised that people in paid work are eligible for PIP, compared to 67% of PIP claimants and 53% of participants with a disability and health condition
- however, there was a misconception as to how PIP eligibility relates to work. Only 19% of the general public correctly recognised that PIP eligibility is not determined by a person’s ability to work, compared to 33% of PIP claimants and 21% of participants with a disability or health condition
- 41% of the general public correctly identified that PIP eligibility is not determined by a person’s income, compared to 66% of PIP claimants and 53% of participants with a disability and health condition
References in Chapter 7
Baumberg Geiger, B. (2025) The PIP cuts and public opinion. Available at: The PIP cuts and public opinion
Department for Work and Pensions (2026a) Perceptions of the Department for Work and Pensions: Wave 2. London: DWP. Available at: Perceptions of the Department for Work and Pensions: wave 2 (May to June 2025)
Department for Work and Pension (2026b) Perceptions of the Department for Work and Pensions: Wave 3. London: DWP. Available at: Perceptions of the Department for Work and Pensions: wave 3 (October to November 2025) - GOV.UK
National Centre for Social Research (2023) British Social Attitudes Survey 40: Poverty. Available at: British Social Attitudes, National Centre for Social Research
National Centre for Social Research (NatCen) (2025) British Social Attitudes Survey 42: Repairing Britain. Available at: BSA 42, Repairing Britain, National Centre for Social Research
8. The impact that receiving PIP has on disabled people’s lives
8.1. The difference that receiving PIP makes to people’s lives is difficult to measure directly, it may be spent in any way the recipient choses, thus potentially making a difference to all aspects of people’s lives. This chapter pulls together some of the different evidence on the impact PIP income makes including on wellbeing, spending, employment and the various aspects of independence in daily life.
Cost of disability and use of PIP income
8.2. PIP is intended as a contribution to the additional costs of disability, and the department has undertaken a literature review of the additional costs of disability drawing together an extensive range of published evidence.
8.3. We know, from The Uses of Health and Disability Benefits (DWP, 2023), that the money claimants receive for PIP and other benefits is typically not ringfenced for specific types of cost but rather is pooled with other sources of income and spent according to individual or household priorities. As such the impact of PIP will cover a broad range of aspects of disabled people’s lives. It is those aspects we wish to understand in greater detail.
Wellbeing
8.4. PIP income would be expected to improve the wellbeing of disabled people who receive it. An attempt to quantify this impact has been conducted by the think-tank Pro Bono Economics (PBE) for anti-poverty charity Z2K (Rodriguez Cabrera, 2025). This uses the longitudinal large scale study Understanding Society to observe the trends in life satisfaction, and to estimate the independent impact of receiving disability benefits such as PIP and DLA.
8.5. The report identifies that life satisfaction (scored on a 0 to 10 scale) is 1.22 points lower on average for disabled individuals than non-disabled individuals. They also estimate that receipt of disability benefits improves life satisfaction scores by 0.79 points controlling for other factors. This suggests that disability benefits play an important role in closing the disability wellbeing gap between disabled and non-disabled people.
8.6. Pro Bono Economics estimates the wider economic value of this wellbeing impact as £12,300 annually per person or £42 billion across the entire PIP and DLA caseload.
Spending
8.7. Analysis by the charity Citizens Advice (Berry and others, 2024), has shown how spending patterns vary for their clients who receive debt advice. Where the client is anticipating a future PIP decision, Citizens Advice has supported clients to produce 2 different spending budgets, one in the situation where they receive PIP and another where they do not. By analysing the differences between these 2 budgets, it shows which areas of spending are most affected by the future receipt of PIP.
8.8. It showed that spending was most affected in the categories of Care and Health, followed by Food. There were smaller or no impacts for Home, Communication, Energy, Transport, Personal, Water and Insurance.
8.9. It should be noted that the people in the situation of receiving debt advice are not expected to be typical of the broader population receiving PIP.
Employment
8.10. Wider academic literature shows that internationally disability benefits tend to disincentivise work, both by giving people alternative sources of income, and through rules that reduce benefit entitlement as people earn or earn more. Other countries can see large employment impacts of receiving income from their disability benefits (ranging from 15 to 30 percentage points) (Klein Tesselink and Melios, 2025). However, PIP is different from many international examples because entitlement to the benefit is not affected by working.
8.11. The evidence outlined in this section covers 2 attempts to isolate the impact of PIP on employment, one by DWP and one by academics. Taken together they form a mixed picture, however it indicates on balance that it is likely that PIP receipt does discourage employment but at a low level compared to international examples.
8.12. There were 5.5 million disabled people in employment in the UK in Q2 2025 and the disability employment rate was 52.8%, compared to 82.5% for non-disabled people. This means the disability employment gap was 29.7 percentage points and early indications suggest the disability employment gap is widening.
8.13. For PIP claimants, there is a clear negative association between receiving the benefit and likelihood of employment. Employment rates are low on the PIP caseload, with 20% of the working age caseload employed in March 2024 (DWP, 2025a), compared to 53% of all working age disabled people (DWP, 2025b). The IFS has shown that as people have reductions in their disability benefits, they are more likely to move into work (Cribb and others, 2022). This association is consistent with some people moving off disability benefits as their health improves, and the reduction in disability benefits encouraging some into work. As such it doesn’t show necessarily whether PIP income causes people to reduce, cease or choose not to enter employment.
8.14. Research commissioned by The Trussell Trust (Biggs and others, 2023) suggests both that some people use PIP income to reduce their hours of work, or stop working. However, on the other hand, it also finds that some people use PIP to access services that allow them to work, such as adapted vehicles for travelling. As such it is possible that PIP has a complex impact on employment with different factors working in opposite directions (UNISON, 2018).
Cohort analysis
8.15. DWP benefit records can be matched to HM Revenue & Customs data on employment, and individuals can be tracked over time. These analyses take those claimants who had a decision on a new PIP award in FYE 2023, tracking them for the 12 months prior to the decision, and for the 24 months subsequently. In interpreting the charts, remember that the median end-to-end journey time in FYE 2023 averaged almost 4 months – and for half of decisions the claimant’s wait will have been longer – so a significant proportion of the 12 months prior to the decision covers the period after a claim has been made.
8.16. Chart 8.1 shows that the employment rate of people who claim PIP falls in the period leading up to, during and, after their claim to PIP. This reflects the general phenomenon that people claim PIP in a period in which their health may be worsening, and so they are also likely to reduce their employment in this period. Some of this effect after the claim may also be caused by PIP income enabling people to reduce their employment. The analysis in this section aims to isolate any effect caused by the income people receive from PIP. Though we show those with an initial decision in FYE 2023, there is a similar picture for the cohorts with a decision in the previous financial year.
8.17. The employment trends for those who are successfully awarded PIP differ from those who are disallowed. They have a lower employment rate at the point of claiming by 13 percentage points. Those who are awarded PIP have a faster decline in employment following their claim, seeing declines in their employment rate 12 months later of 9 percentage points, whereas those who are disallowed have a 3 percentage point decline in their employment rate.
Chart 8.1: Employment rate of awarded and disallowed claimants
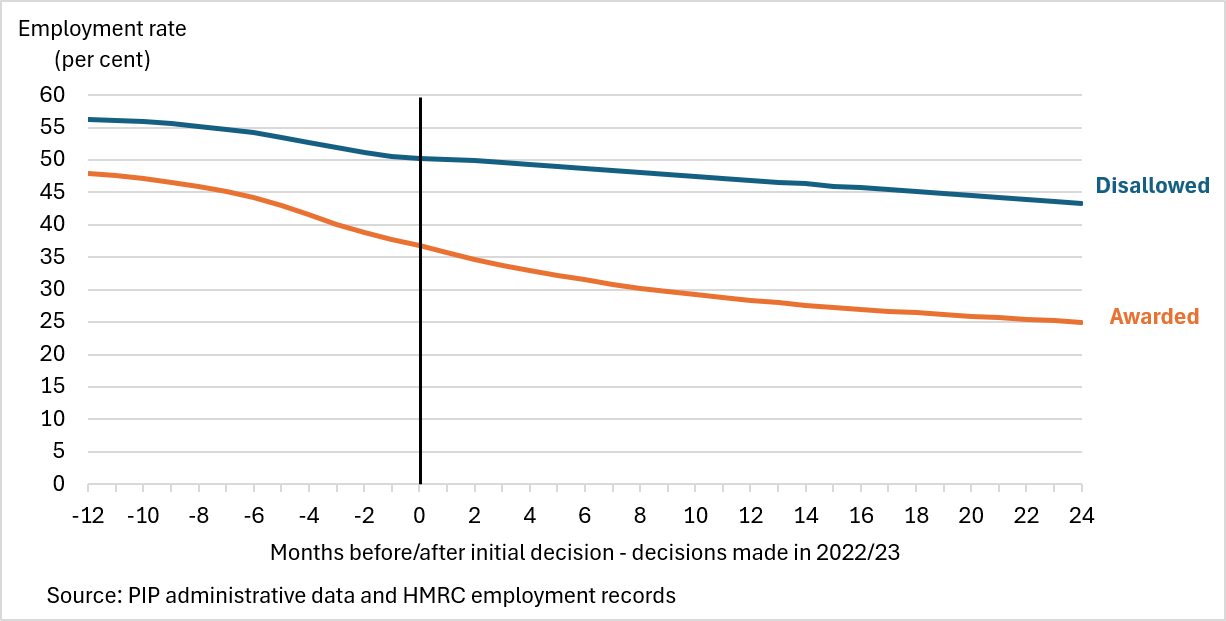
8.18. At this point we cannot distinguish the difference that is due to awarded claimants having worse health, versus that caused by the impact of receiving PIP income. Therefore, Chart 8.2 attempts to isolate the effect of being awarded PIP by comparing those who are marginally awarded the daily living component of PIP by receiving just enough points to qualify compared to those who marginally fail to receive that award. The assumption is that these 2 groups have similar levels of health impairment, and so any observed difference in employment is mostly explained by the income that one group received from PIP.
Chart 8.2: Employment rate of claimants close to the award threshold
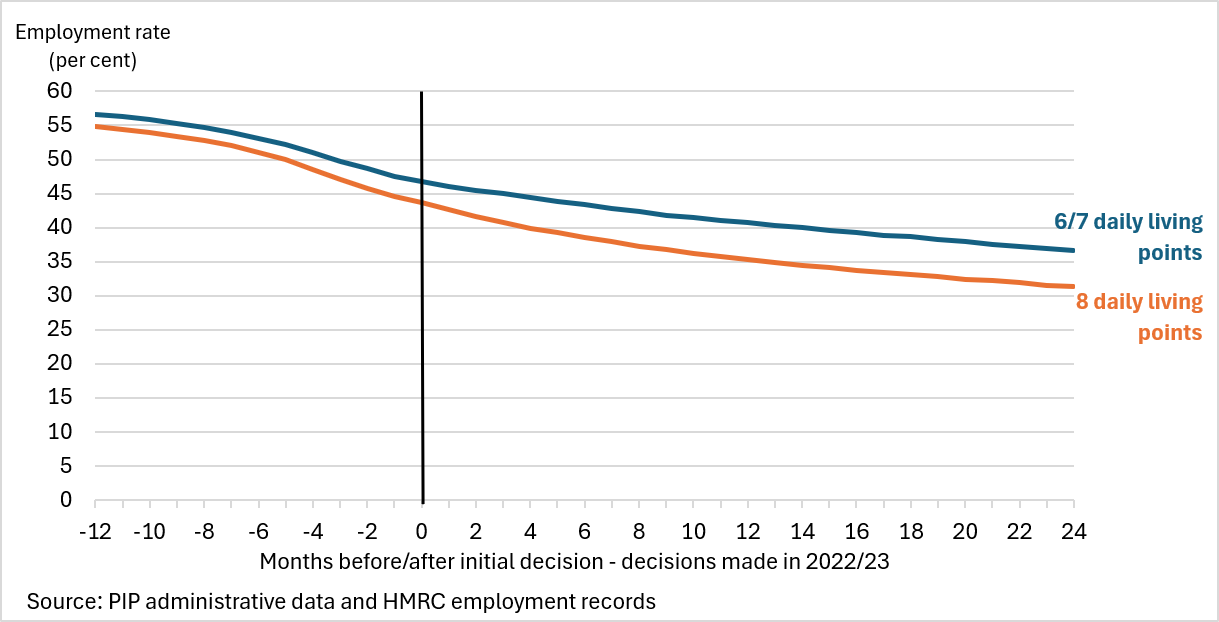
8.19. Though not shown here, this analysis has been repeated for 2 cohorts, with decisions made in FYE 2022 and FYE 2023, and also for claimants with and without a mobility component awarded at the same time. For some of these comparisons, the employment rate prior to claiming closely tracked each other; these examples are likely to represent the most reliable evidence as it is only at the point of receiving PIP that employment rates start to diverge. In other cases, some divergence in employment rates was already visible prior to the decision.
8.20. Across these different comparisons, groups that just scored enough points to get PIP daily living experienced a slower decline in employment rate than those who just missed out. There was a small divergence in employment between the month of an initial decision and 12 to 24 months later, varying from one to two percentage points across groups, and over and above that divergence which would be seen were the pre-decision trends continued. This may suggest that receiving PIP causes a decrease in employment for those on the threshold of eligibility for PIP, but it implies that any impact is small.
8.21. Underlying differences in the impact of disability will remain when comparing those above and below the eight-point threshold which may explain some of the remaining divergence in the employment rate. In some comparisons there is a difference in the employment rate prior to and at the point of the assessment outcome, highlighting that the 2 comparison groups are not like for like. The same analysis has been run on a pre-COVID cohort and factoring in awards at the MR stage with no material change in trends.
Academic analysis
8.22. A 2025 academic study by Klein Teeselink and Melios (2024), as yet not peer reviewed, has attempted to identify the independent impact of PIP receipt on employment, using Understanding Society data. This study used 2 “natural experiments” to estimate the impact of receiving disability benefits.
8.23.The first used the changes between DLA and PIP; this change made people with minor physical health conditions less likely to receive a benefit (by 5.6 percentage points), and people with mental health conditions more likely to receive them (by 6.0 percentage points). However, the study did not identify any significant impact on employment rates for either of these groups, suggesting that any independent impact of PIP receipt on employment would be small.
8.24. Conversely, the second natural experiment used the different award rates by different provider regions and did find an employment impact, but only for unmarried individuals. For those that had lower access to PIP, employment rates were higher by 2.9 to 3.3 percentage points. The authors argue that this reflects stricter PIP assessment regimes increasing employment, but also that spousal income might buffer the impact of benefit loss.
8.25. The authors note that these findings of small or no employment impacts contrast to international comparisons, where employment is reduced to a much larger extent by receipt of disability benefits, from 15 to 30 percentage points and that PIP’s non-means tested design might explain this difference.
8.26. The department would welcome additional evidence or academic responses to the above evidence on the impacts of PIP on employment.
Independence
8.27. There is no single accepted definition of independence for disabled people. However, a range of research highlights the ways in which receipt of PIP allowed people to increase their mobility, be active and reduce their reliance on friends and family.
Mobility
8.28. Research suggests that the Motability Scheme is a key benefit for those who qualify for PIP. A report by Motability (2021) found that 94% of those on the Motability Scheme said they otherwise would not have been able to get a vehicle that met their disability needs. 86% of respondents also reported improved ability to access places and people.
8.29. A report by MS Society (2020) found that 95% of Motability Scheme users said it enabled them to get ‘out and about’ and 89% said that it allowed them to attend medical appointments.
Being active
8.30. Research by the Activity Alliance with the Dwarf Sport Association (Johnson and Spring, 2018) found that a majority of disability benefit claimants (65%) said they rely on benefits to be active. However, this survey was over-indexed to those with physical disabilities so may not be fully representative of the broader disabled population. This suggests benefits make a positive contribution to narrowing the activity gap between disabled and non-disabled people, by providing financial security and paying for transport, and activity related costs.
8.31. Concerningly, this research also found that just under half (47%) were fearful of losing their benefits if they are seen to be more active. A more recent survey by Activity Alliance and IFF Research (2023) found that 37% of disabled people feared that staying active will result in benefits or financial assistance being removed.
Reducing reliance on friends and family
8.32. A range of qualitative research gives examples of ways that PIP and disability benefits can reduce disabled people’s reliance on friends and family by:
- getting taxis instead of needing lifts
- employing people to do housework or care tasks
- accessing technology to give greater independence
References in Chapter 8
Activity Alliance and IFF Research (2023) Annual Disability and Activity Survey 2022 – 23. Manchester: Activity Alliance. Available at: Annual Disability and Activity Survey: 2022-23
Biggs, H., Wildman, J., Hamid, A. and MacGregor, A. (2023) Disability and financial hardship: how disability benefits contribute to the need for food banks in the UK. London: The Trussell Trust. Available at: Disability and financial hardship: How disability benefits contribute to the need for food banks in the UK
Berry, C., Hignell, K., Hunter, T., Rennison, R. and Rose, M. (2024) Disability benefits: lessons from the front line. London: Citizens Advice. Disability benefits: Lessons from the front line. Available at: Disability benefits: lessons from the front line
Cribb, J., Karjalainen, H. and Waters, T. (2022) Living standards of working‑age disability benefits recipients in the UK. London: Institute for Fiscal Studies. Available at: Living standards of working age disability benefits recipients in the UK
Department for Work and Pensions (2023) Uses of health and disability benefits. London: DWP. Available at: Uses of Health and Disability Benefits
Department for Work and Pensions (2025a) Pathways to Work: Reforming benefits and support to get Britain working. London: DWP. Available at: Pathways to Work: Reforming Benefits and Support to Get Britain Working Green Paper
Department for Work and Pensions (2025b) Employment of disabled people: 2025 Supplementary table MSR001. London: DWP Available at: Employment of disabled people 2025
Johnson, E. and Spring, E. (2018) The activity trap: disabled people’s fear of being active. Manchester: Activity Alliance. Available at: The Activity Trap - Benefits or Being Fit: Disabled people’s fear of being active
Klein Teeselink, B. and Melios, G. (2025) The Employment Effects of Disability Benefits Without Work Restrictions. Available at: The Employment Effects of Disability Benefits Without Work Restrictions
Motability (2021) Impact Report 2020/21. London: Motability Foundation. Available at: Impact report 2020/21
MS Society (2020) Enough: Make welfare make sense. London: Multiple Sclerosis Society. Available at: MS: Enough - make welfare make sense
Office for National Statistics (2023) Annual Disability and Activity Survey: 2022–23. Available at: Annual Disability and Activity Survey: 2022-23
Rodriguez Cabrera, K. (2025) More than money: The lifelong wellbeing impact of disability benefits. London: Pro Bono Economics. Available at: PBE, More than money: The lifelong wellbeing impact of disability benefits
UNISON (2018) Punished for going to work: The experience of UNISON disabled members claiming Personal Independence Payment (PIP). London: UNISON. Available at: Punished for going to work: The experience of UNISON disabled members claiming Personal Independence Payment (PIP)
-
These benefits do not include those paid regardless of a person’s health condition or disability, the main examples being State Pension and Pension Credit paid to people above pension age, a large proportion of whom have health conditions or disabilities. ↩
-
The Department for Work and Pensions covers Great Britain for many benefits, but some areas of provision have been devolved to the Scottish Government: these are shown in Figure 1.1 as those benefits where DWP coverage is for England and Wales only. The Scottish Government has started to replace the inherited DWP benefits with its own. Northern Ireland has its own welfare legislation, though this replicates the system in use in England and Wales. ↩
-
No estimates have been made for Universal Credit Disabled Child Elements, nor the Carers Addition or Severe Disability Addition in Pension Credit. ↩
-
Note that the broad age group of the carer could be different to the person cared for, so working age disabled people could have carers who are above state pension age, though these typically would not receive payments of CA or UC CE. Around 27% of working age claimants of CA care for children, and a further 19% care for people over state pension age (equivalent figures are not available for UC CE). ↩
-
Until state pension age was equalised for men and women at age 65 in 2018, the upper age limit for claiming DLA, and the lower age limit for AA, was set at 65 for both men and women. ↩
-
The Department of Social Security was one of the constituent departments of DWP when the latter was set up in 2001. ↩
-
Since equalisation of state pension age was completed, this threshold is now at state pension age. ↩
-
As set out in Schedule 2 of the social security (PIP) Regulations 2013. ↩
-
After the uprating calculation is applied, the weekly benefit rates are rounded to the nearest 5 pence. This is unlikely to have much impact on the value relative to inflation over the medium term. ↩
-
Most surveys now align to the Government Statistical Service Harmonised Standard, but this has led to discontinuities in the historical data. The overall context of the survey in question may also influence how people respond to disability questions. ↩
-
For the majority of measures this is defined as people aged 16-64, but some use working age population, as determined by state pension age. This will not make a material difference to the percentages shown. ↩
-
Looking further back to the 1970s, the General Household Survey and subsequent General Lifestyle Survey show a slow but steady increase in prevalence of longstanding limiting illnesses – from 14% of the population (of all ages) in 1974 to 19% in 2011. ↩
-
Some of these measures are affected by state pension age changes, which tends to steepen the observed trend while it is rising, as a result of it bringing in older age groups where health conditions and disability are more likely. ↩
-
Physical or mental health condition or illness lasting or expected to last 12 months or more which limits the ability to carry-out day-to-day activities “a lot”. ↩
-
Mental health conditions cover those citing ‘depression, bad nerves or anxiety’ and ‘mental illness or other nervous disorders’. Musculoskeletal conditions cover ‘problems or disabilities connected with … arms or hands; legs or feet; and back or neck’. ↩
-
The screening tool assesses ADHD characteristics of inattention, hyperactivity and impulsivity during the six months prior to interview. Screening positive for ADHD (a score of four or more on the ASRS) does not mean that someone has the condition, rather that they warrant a more comprehensive assessment. ↩
-
All participants completed the 17-item PTSD Checklist - Civilian (PCL-C) irrespective of whether they reported a traumatic event. Those scoring 50 or more who also scored positively for specific domains in the Diagnostic Statistical Manual (DSM) IV were identified as screening positive for PTSD in the past month. A positive screen did not indicate presence of PTSD, rather the presence of sufficient symptoms to warrant further investigation. ↩
-
Autism was screened for using an adapted version of the 20-item Autism Spectrum Quotient (AQ-20). Full examinations were carried out with a subset of participants by clinically trained interviewers using the Autism Diagnostic Observation Schedule, 2nd edition (ADOS). ↩
-
GDP and TME denominators are for the United Kingdom as a whole. ↩
-
In line with public finances convention, we use the GDP deflator as the measure of inflation, which covers a wider range of goods and services than the Consumer Prices Index (CPI) and its variants. This means year-on-year fluctuations can be caused by differences between the two measures, and the fact that uprating of disability benefits is based on CPI inflation for the year to the September prior to uprating, whereas the GDP deflator is contemporaneous to the expenditure year. ↩
-
The drop in caseload between these 2 years is 225,000 at a lower level of rounding. ↩
-
As at November 2025, there remained 105 thousand working age claimants on DLA who remain to be moved, as well as almost 50,000 above state pension age. ↩
-
Only primary condition is currently recorded on PIP and DLA analytical datasets. This figure is derived from scrutiny of a sample of 400 claimants undertaken in 2021, but is broadly in line with other sources that collect data on multiple conditions, such as the LFS. ↩
-
This analysis makes the best attempt to create a consistent view across both benefits, based on clinical advice. ↩
-
The chart shows an annualised estimate based on outturn from April to October 2025, multiplied by 12/7. This does not allow for seasonality, in particular the much lower claims seen each December, which are not fully compensated for by the higher claims in January, so will be an over-estimate for the year as a whole, if lower claim volumes are sustained. ↩
-
Estimate is based on comparing June 2021 and November 2023, due to the seasonal low recorded each December. ↩
-
The chart uses reassessments for those aged 16 or 17 as a proxy for these, since the published data on Stat Xplore for child DLA to PIP reassessments refers to clearances rather than registrations. ↩
-
Because of the lengthy clearance times, the majority of claims made in 2013/14 would not have been cleared until 2014/15, but different clearance outcomes are likely to reach their peak at different stages of the customer journey. ↩
-
This table also shows appeals where the initial decision was a disallowance. However, it includes cases where an award was made at MR stage, but the claimant was dissatisfied with that award. Therefore, this cannot be used to determine how many further claims are awarded at appeal stage – this will be covered in further work. ↩
-
Note too that claimants may close their DLA claim, or reach the end of the DLA award, without registering a claim for PIP – such claimants are not included in these figures. For those reaching the end of their child DLA award, it is probable that those who do not claim PIP are, on average, those who are less likely to be successful in a PIP claim. ↩
-
This does not hold post-pandemic for claimants aged 16 to 24. Since a new claim to working age DLA could not be made from mid-2013 onwards, it is likely that in the latest years these cases are a particular subset of child DLA claimants but who are not counted among that group. ↩
-
Cancer is not shown for this category as there are fewer than 500 such cases a year. ↩
-
2015 was similar to the years either side. To aid clarity, not all years are shown, but the key difference between 2014-2016 cohorts and those afterwards holds for the missing cohorts. 2013 is excluded due to small numbers of claimants flowing on, who are unlikely to be representative of all the claimants who registered a claim in 2013; the 2013 profile is below that for 2014. ↩
-
2023 onwards are not shown due to limited data points, but are similar to 2021 as far as the data is available. ↩
-
The post World War II baby boom, although it peaked slightly above the 1960s one, was much shorter-lived; this cohort would have been just below men’s state pension age of 65 in 2010. ↩
-
Estimates from the Winter Coronavirus (COVID-19) Infection Study, waves 3 and 4 (during the period January to March 2024) suggest that 177,000 people reported durations of 52 weeks or more. However, there were also large numbers of people who did not report a duration. If their pattern of durations were the same as those who did report, there would be more than 200,000 with symptoms for 52 weeks or more. ↩
-
In 2023, the Office for Budget Responsibility estimated that 2.9 million people on the NHS waiting list in 2022 were of working age – less than half the total. In their modelled scenario, halving the NHS waiting list over five years would reduce working-age inactivity by around 25,000 people. ↩
-
Organisation for Economic Co-operation and Development – an intergovernmental organisation of 38, mostly developed, countries ↩
-
Analysis by the OECD, using data for 2023 or latest available for each country ↩
-
The rates for pre-pandemic years were similar. ↩
-
The exclusion of DLA in this chart only has a material impact on 16 year olds, who are in the transition between child DLA and PIP, though it is less likely to make a difference to the shares accounted for by each condition or group of conditions. Unlike the comparisons in Chapter 3, this is not presented as a share of the population, so some variation between ages reflects variations in the relative size of cohorts. ↩
-
This relates only to income-related ESA, which is being replaced by UC, and does not include those in receipt of the Support Group element in contributory ESA. ↩
-
Not all of these will receive additional money as a result, as the LCW element (and the Work-Related Activity Group component in ESA) was withdrawn for new claimants from April 2017. ↩
-
CES replaced the previous Claimant Service and Experience Survey (CSES). Due to significant methodological changes the results are not directly comparable across the two surveys. COVID-19 prevented the completion of fieldwork for the Customer Experience Survey 2019/20, meaning there is no annual level data to report for that year. ↩
-
The National Centre for Social Research (NatCen)’s annual British Social Attitudes (BSA) survey asks a representative sample of the population what it’s like to live in Britain and what they think about how Britain is run. Since 1983 it has been measuring and tracking changes in people’s social, political and moral attitudes. ↩