The Self-Employment Income Support Scheme final evaluation
Published 17 July 2023

© Crown copyright 2023
This publication is licensed under the terms of the Open Government Licence v3.0 except where otherwise stated. To view this licence, visit nationalarchives.gov.uk/doc/open-government-licence/version/3 or write to the Information Policy Team, The National Archives, Kew, London TW9 4DU, or email: psi@nationalarchives.gov.uk.
Where we have identified any third party copyright information you will need to obtain permission from the copyright holders concerned.
This publication is available at https://www.gov.uk/government/publications/the-self-employment-income-support-scheme-final-evaluation/the-self-employment-income-support-scheme-final-evaluation
A joint evaluation by HM Treasury (HMT) and HM Revenue and Customs (HMRC) of the Self-Employment Income Support Scheme (SEISS).
Acknowledgements
HMT and HMRC would like to give thanks to our peer reviewers, Robert Joyce from the Institute for Fiscal Studies (IFS), and Iven Stead and Tim Blackman from the Department for Transport (DfT), who reviewed a draft of this evaluation. All decisions made about subsequent revisions to the evaluation were made by HMT and HMRC and all conclusions are our own.
Glossary
| Term | Definition |
|---|---|
| SEISS | The Self-Employment Income Support Scheme was set up by the government to provide financial support to self-employed individuals in response to the COVID-19 pandemic. |
| Self-employed | A person is self-employed if they run their business for themselves and take responsibility for its success or failure. Self-employed individuals are not paid through Pay As You Earn (PAYE), and they do not have the rights and responsibilities of an employee. Someone can be both employed and self-employed at the same time, for example if they work for an employer during the day and run their own business in the evenings. |
| Income Tax Self Assessment (ITSA) | Self Assessment is a system HMRC use to collect Income Tax from those who do not have tax deducted automatically from wages, pensions and savings. People and businesses with other income (including COVID-19 grants and support payments) must report it in a tax return for the year the income was received. |
| Eligible population | Self-employed individuals who were assessed for the SEISS and deemed potentially eligible according to the policy criteria. To be eligible to claim their business must have been adversely affected by the COVID-19 outbreak and they must intend to continue to trade. |
| Assessed as ineligible population | Individuals who were assessed for eligibility for the SEISS grants but were deemed ineligible on the grounds of either earning more than £50,000 in trading profits, earning £0 or less in trading profits or having non-trading income as a larger proportion of total income than trading income. It does not include individuals who did not complete a self-employed schedule on their tax return, such as those paid through PAYE, company owner managers or directors of limited companies. |
| Newly self-employed eligible population | Individuals who started trading in the 2019 to 2020 tax year and who were assessed for the SEISS and deemed potentially eligible according to the policy criteria only for the fourth and fifth grants. To be eligible to claim their business must have been adversely affected by the COVID-19 outbreak and they must intend to continue to trade. |
| Error and fraud | Error is non-deliberate over or under-payment, typically due to mistake, misunderstanding or misapplication of rules. Fraud is any deliberate omission, concealment, or misinterpretation of information, or the false or deceptive presentation of information or circumstances in order to gain an advantage. |
| PAYE | Pay As You Earn is the system for deducting and collecting Income Tax and National Insurance contributions from employment income. |
| RTI | RTI (Real Time Information) is the system used by employers to report to HMRC each time they pay their employees. Under RTI, information about PAYE, NICs and other deductions is transmitted to HMRC by the employer every time an employee is paid. |
| Agent | Someone who acts on behalf of a self-employed person to help them meet their tax obligations, including accountants, tax agents or other professionals. |
| RBT | Reasonable Belief Test. Claimants were asked to declare that as a result of the reduced activity, capacity or demand suffered, they reasonably believed there would be a significant reduction in their trading profits in the relevant period compared to what they would have expected in the absence of the COVID-19 pandemic. This applied from the third SEISS grant. |
| FID | Financial Impact Declaration (often referred to as a ‘turnover’ test). The Financial Impact Declaration (FID) was introduced for the fifth SEISS grant to determine the value of the grant for those who had become self-employed or a member of a partnership before the 2019 to 2020 tax year. The FID required a comparison of turnover in the ‘pandemic year’ with an earlier representative period. Where turnover fell by 30% or more a higher rate grant was paid. Other eligible claimants received the lower rate grant. |
| NPIs | Non-pharmaceutical interventions. These were behavioural and social interventions applied as part of the government’s response to the COVID-19 pandemic. These are measures intended to reduce COVID-19 transmission by reducing contact rates in the general population, for example national lockdown and social distancing measures. |
| Counterfactual assessment | A counterfactual assessment models what would have happened in the absence of the SEISS. |
| Tax gap | The tax gap is the difference between the amount of tax that should, in theory, be paid to HMRC, and the amount that is actually paid. |
| Deadweight | Desired policy outcomes that would have taken place without the intervention under consideration. |
| Value for Money | A way of assessing the value from government spending, and the optimal use of resources to achieve the intended outcomes. |
| CJRS | The Coronavirus Job Retention Scheme. The scheme was launched in April 2020 and aimed to protect jobs affected by the COVID-19 pandemic. The scheme initially offered employers the opportunity to apply for a grant to fund the wages of their employees who were on furlough, equivalent to 80% of usual wages up to £2,500 per month. |
| The Green Book | The Green Book is guidance issued by HMT on how to appraise policies, programmes and projects. It also provides guidance on the design and use of monitoring and evaluation before, during and after implementation. It is published on GOV.UK. |
Executive summary
Introduction
The COVID-19 pandemic had far-reaching consequences for the UK labour market, households, businesses, and the economy more widely – some of which are still being felt. The Self-Employment Income Support Scheme (SEISS) was announced on 26 March 2020 as part of the government’s economic response to the COVID-19 pandemic, bringing broad parity with the Coronavirus Job Retention Scheme (CJRS) which provided support for the employed.
The primary objective of the SEISS was to support self-employed individuals whose businesses had been adversely affected by COVID-19 restrictions. It sought to quickly support individuals most reliant on their self-employed income, who would have lost out financially due to COVID-19, enable self-employed people to remain in business, and provide support broadly equivalent to the CJRS.
The SEISS sought to do this in a way that targeted support as much as possible on those who needed it most and minimise the risk of error and fraud. However, the policy design needed to adapt to the circumstances of the self-employed cohort which presented different challenges to the employed population. The different characteristics of the self-employed population and the nature of the data HM Revenue and Customs (HMRC) collects meant there were different issues to consider in the policy design.
The SEISS was delivered as a series of 5 grants available between May 2020 and September 2021, that self-employed individuals could claim based on their Self Assessment tax records. It was delivered at pace, with the first grant opening for applications on 13 May 2020. The scheme aimed to support those most reliant on self-employed income by setting criteria based on annual trading profits and the share of income from self-employment.
As the effects of COVID-19 eased and the economy reopened, further criteria were introduced to ensure the scheme was more targeted towards those most affected by the disruptions. These included a Reasonable Belief Test (RBT) from the third grant onwards where claimants had to declare that they reasonably believed their trading profits were reduced as a result of COVID-19, and a turnover test on completion of a Financial Impact Declaration (FID), for the final grant which opened on 29 July 2021.
Across the lifetime of the scheme, a total of 2.9 million eligible self-employed individuals claimed SEISS grants, totalling £28.1 billion.
This final evaluation completes the government’s evaluation of the scheme following best practice from the Green and Magenta books, with any deviation from this guidance clearly highlighted. A Value for Money (VfM) assessment following the ‘4 Es’ structure that is widely used when assessing this subject is also included.
An interim evaluation published in October 2022 set out initial impact findings on the first 3 grants of the scheme, alongside an evaluation of the processes by which the scheme was delivered and accessed by claimants, covering the entire lifespan of the scheme. The final evaluation covers the impacts across all SEISS grants and also assesses the scheme’s VfM, including a consideration of deadweight, and lessons learned. It has been peer reviewed by 3 external reviewers to provide independent challenge.
Key findings
1) The SEISS was good VfM, with a positive net benefit to society of £14.2 billion and a social benefit to cost ratio of 3.8: 1.
This evaluation uses the principles of the Green Book to estimate all the costs and benefits to society of the SEISS and finds that the SEISS provided a Net Present Value (NPV) of £14.2 billion in current prices. The total benefits created by the scheme are estimated to be worth £19.3 billion, with an accompanying social cost of £5.1 billion. These estimates have some uncertainties and further detail is provided in chapter 5, but overall, the assessment finds that the scheme represents good VfM. A proportion of the initial cost of grants (£28.1 billion) was reclaimed through additional tax and National Insurance contributions (NICs) paid, and benefit payments avoided, meaning the scheme’s effective net cost was £19.5 billion.
The SEISS was primarily an income support scheme, designed to support those most in need and to enable them to remain in business. By supporting claimants’ businesses, it had wider indirect benefits as those businesses in turn sustained additional business activity that would not have existed without the scheme. These benefits are estimated at between £0.2 billion and £1.5 billion. Additionally, wider economic activity was supported such as consumer spending as a result of the scheme successfully supporting incomes. These additional effects are estimated at around £8.5 billion. Targeting of the SEISS at those with self-employed profits of no more than £50,000 per year through the eligibility criteria also had an equity benefit estimated at £10.5 billion, based on the standard Green Book method.
Given the extraordinary nature of the COVID-19 pandemic and the uncertainty it created, it was important that support was provided at pace to provide security and reassurance to self-employed individuals who were impacted by COVID-19 and facing an uncertain economic shock. A complicated application process and eligibility criteria could have unintentionally denied support to those who needed it or put them off from claiming the support they required.
The lack of timely self-employment data held by HMRC also meant that there were challenges in balancing the need for cost-effectiveness with ensuring those who most needed support could get it. Eligibility to the SEISS was based on matching claims against information already held on HMRC’s system in order to combat the risk of error and fraud, and improve the ease of making claims. The eligibility rules were tightened over time as more data became available. However, there is some evidence of support going to those who did not necessarily require it. Potential deadweight in the scheme is estimated at around £2.8 billion, although this is likely to be a slight over-estimate due to limitations of the methodology.
Additionally, the eligibility criteria for the SEISS excluded some groups such as those whose trading profits just failed to meet the requirement to have more than 50% of total income from trading profits, or those who were newly self-employed in 2019 to 2020. A lesson learned from the SEISS is that improved data and more timely reporting of self-employed profits could have led to improved targeting of the scheme, a reduction in deadweight and the inclusion of some groups who were not able to access the scheme. Whilst targeting mechanisms were introduced over time as the path of the COVID-19 pandemic became clearer, better data on self-employed business performance and the impact on different sectors may have allowed for more targeted support to be introduced more quickly and in a more effective way.
The government has committed to further action to identify data gaps to help its ability to understand the self-employed population. HMRC ran a data consultation between 20 July and 12 October 2022 and published a Summary of Responses which also includes proposed next steps. This could give policy makers more options in the future. The government have also set out plans for the introduction of Making Tax Digital for Income Tax from April 2026, which will begin to provide a more up-to-date data picture of the income and expenditure levels of self-employed individuals. The government will continue to review the data it collects to ensure future policy measures requiring economic support are effectively targeted whilst also balancing the cost of collection.
2) The SEISS was designed and implemented swiftly. The scheme was easy to understand, and the claim process was simple.
HM Treasury (HMT) and HMRC worked together to design and implement the SEISS, at the same time as the CJRS was being delivered. It was important to deliver support to as many self-employed people who needed it as quickly as possible. While Self Assessment tax data provided the best available evidence to assess eligibility for the SEISS, it is significantly less timely than the Pay As You Earn (PAYE) data that was used for the CJRS. Self Assessment tax returns are filed annually, with trading profits reported with a time lag.
To protect against fraud risks, for the first 3 SEISS grants, only those who traded in the tax year 2018 to 2019, were eligible to apply, which meant newly self-employed were not eligible for the SEISS at first. When 2019 to 2020 Self Assessment tax return data became available, the newly self-employed in this tax year and those newly eligible based on this additional trading profits data were brought into the scheme’s eligibility rules.
Payments were made quickly following the launch of the scheme: individuals were invited to apply on a specified date between 13 May 2020 and 18 May 2020, based on their Unique Tax Reference number. By 25 May 2020, 88% of claims for the first SEISS grant had been paid. 99.4% of SEISS claims were paid within the government’s target of 6 working days from application.
According to HMRC research there were high levels of claimant satisfaction with the SEISS claim process, with 96% of claimants rating their overall experience of applying for the SEISS as either good or very good. Claimants were highly positive about the application process, with 90% feeling most aspects were clear. A lesson learnt from the design and implementation of the SEISS is the benefit of simple scheme rules enabling fast and efficient delivery. For any future similar scheme, the government may want to reconsider customer eligibility reviews and a pre-population process for taxable grants.
Full details of the process evaluation findings can be found in the SEISS interim evaluation.
3) The SEISS helped support trading profits and incomes for many self-employed people who were most affected by COVID-19.
The SEISS supported a large number of self-employed people who would otherwise have seen a drop in income. This ensured they could maintain living standards, and support their business activity to continue, despite the public health motivated restrictions on economic activity.
To ensure that economic activity continued where COVID-19 restrictions allowed, SEISS claimants were able to continue to work, start a new trade, or take up other employment, including voluntary work, provided they intended to continue trading as a self-employed individual and met all other eligibility criteria.
Self Assessment data was a critical part of the design of the SEISS, but some groups fell outside the scheme criteria. This included directors of limited companies and company owner managers who take their profits in dividends.
The scheme needed to be easy to understand and the claim process easy for eligible claimants to access the grants. This constraint on scheme design for the earlier grants meant that it was not possible to create a highly detailed scheme that could perfectly account for the wide variety of individual circumstances. This means some payments, though claimed legitimately, may have gone to self-employed individuals that did not need the support – representing a form of deadweight.
Analysis suggests the eligibility criteria put in place were set at an effective level to meet the objectives of the scheme. These thresholds were created to ensure support was provided to self-employed people most in need (with trading profits of no more than £50,000), and most dependent on their trading income (with trading profits at least equal to their non-trading income). A more complicated design based on tapered support around these thresholds would have meant claims taking longer to process and support not being paid out in time to those who needed it most.
Providing financial support could in theory lead to people reducing work effort, and therefore their income. This is known as an ‘income effect’. Using a counterfactual methodology to measure the causal impacts of the SEISS, there is some limited evidence for the existence of an income effect. Although this analysis is only valid for a limited group around the £50,000 trading profits eligibility threshold, it potentially indicates a localised behavioural effect in that income from SEISS grants may have disincentivised economic activity for individuals around this specific point in the income distribution.
It appears measures to create more targeted support were effective in reducing the provision of grant income to stronger performing self-employed businesses.
4) The SEISS helped support businesses to continue trading in the short term, however whether the scheme had a longer-term impact on business survivability is less clear.
The SEISS enabled claimants to sustain their self-employment trading activity, with fewer permanent business cessations compared to a scenario without the SEISS. Eligible claimants were found to be 2.8 percentage points more likely to remain trading in 2020 to 2021 than those assessed as ineligible at the scheme’s £50,000 average trading profits eligibility threshold for the first 3 SEISS grants. However, due to the lag in Self Assessment data, the scheme’s impact on longer-term business survivability is less clear. Using the equivalent methodology to assess the likelihood of claimants continuing to trade relative to those assessed as ineligible for the last 2 SEISS grants, the difference was small and not statistically significant.
This shows the importance of timely support for the self-employed during the COVID-19 pandemic. Preventing individuals from ceasing to trade avoided a likely period of either inactivity or unemployment, with the associated risk of long-term economic scarring.
5) Error and fraud were effectively managed throughout the lifetime of the SEISS, even as stricter eligibility criteria were introduced, to successfully target the scheme
The government effectively mitigated the risk of error and fraud through the use of data already held by HMRC.
The final estimate of overall error and fraud from the SEISS is estimated to be 5.2% (within a range of 4.2% to 6.3%). The rate of error and fraud increased in 2021 to 2022, driven by the RBT in the fourth and fifth SEISS grants. These levels compare favourably with the overall UK tax gap for Self Assessment which is estimated to be 12.4% in 2020 to 2021 and 11.2% in 2021 to 2022, and for the Self Assessment Business tax gap which is around 20%.
Due to the nature of the scheme, it was likely that the SEISS would be a target for opportunistic fraud and organised crime, and that some customers would make mistakes.
While the rates and monetary value of error and fraud for the fourth and fifth grants increased due to the self-certification elements within the RBT (introduced from the third grant onwards) and the FID introduced for the fifth grant, these changes to the policy design contributed to better targeting and an overall exchequer cost saving due to the reduced take-up and lower value of the grants paid out. The exact saving from the FID is uncertain due to other factors such as the changing economic situation but could be up to £2.5 billion when comparing the drop-off in take-up between the fourth and fifth grants.
Since the start of the compliance activity into the SEISS and up to 31 March 2023, HMRC has recovered and prevented a loss of over £466 million with compliance activity still ongoing.
Chapter 1: Introduction
1.1 Evaluation scope
The SEISS was designed to support self-employed individuals (including members of partnerships) whose self-employment activities had been adversely affected by COVID-19.
Evaluation of the SEISS is being undertaken to provide transparency and accountability around the use of public funds and to learn lessons for the future. The SEISS interim evaluation was published in October 2022. The interim evaluation provided findings for the process evaluation across all 5 grants of the scheme, and an initial impact evaluation limited to findings from the first, second and third grants only, with findings conveying the short-term impacts of the scheme.
This final evaluation provides findings on the impact of the scheme covering all 5 SEISS grants. This evaluation also includes an assessment of the VfM of the scheme, including a consideration of possible deadweight.
1.2 Evaluation objectives and questions
This final SEISS evaluation assesses the extent to which the scheme achieved its intended outcomes and the wider effects of the scheme. The key objective of the SEISS was to support self-employed individuals whose businesses had been adversely affected by COVID-19 restrictions. It also sought to quickly support individuals most reliant on their self-employed income, who would have lost out financially due to COVID-19; enable self-employed people to remain in business; minimise the risk of error and fraud; and provide support broadly equivalent to the CJRS.
The evaluation follows guidance on evaluation best-practice as outlined in the Magenta Book, and the economic principles for appraisal and evaluation as outlined in the Green Book where applicable. A draft of this evaluation was reviewed by 3 external peer reviewers who critically assessed it to provide independent oversight and quality assurance of both the evaluation approach and the robustness of the findings.
The evaluation has been conducted in-house using the expertise of the HMRC and HMT’s analytical teams. This is a common approach to government evaluation, as outlined in the Magenta Book.
Evidence used in the SEISS evaluation derives primarily from analysis of management information and Income Tax Self Assessment data. Further information about evidence sources and analytical methods is provided in the accompanying information and the counterfactual technical note to this evaluation.
1.3 Background to the SEISS
The SEISS was designed to support self-employed individuals (including members of partnerships) whose self-employment activities had been adversely affected by COVID-19 restrictions. The scheme was part of a broader COVID-19 support package that included the CJRS, uplift in Universal Credit (UC), local authority grants, government-funded loans, and tax payment deferral schemes.
The SEISS sought to ensure that support for the self-employed was equivalent to that provided for the employed population through the CJRS (with 80% of average trading profits in the first SEISS grant aligning with 80% of PAYE earnings at the start of the CJRS). The SEISS aimed to support individuals most reliant on their self-employment income, targeting those with average trading profits of no more than £50,000, and who received at least half of their income from self-employment.
The SEISS was designed and delivered using information already held by HMRC through Self Assessment. This effectively mitigated the risk of error and fraud by claimants of the SEISS by removing the need for claimants to make their own calculations or provide additional evidence to HMRC which would have increased the administrative burden of delivering the scheme. Self-certification elements such as the RBT and the FID were introduced later in the scheme, both of which increased the rate of error and fraud but were cost saving measures overall. Reliance on data already held by HMRC limited the scheme’s ability to target everyone who may have needed support, such as the newly self-employed in 2019 to 2020, those who failed to submit tax returns by the necessary deadline, or directors of limited companies who do not receive trading income.
1.4 SEISS delivery
Between May 2020 and September 2021, 5 grants were made available to those who were eligible to claim. To ensure support was delivered at speed and to minimise the risk of error and fraud, identifying the potentially eligible population and calculation of grants was based on data HMRC already held from Self Assessment tax returns. This data was used to pay grants at scale without the need for any calculations or other significant input from the majority of claimants.
The interim evaluation found within 12 days of launch, 88% of claims for the first SEISS grant had been paid, and across the whole scheme over 99% of claims were paid within 6 days. Research showed there were high levels of satisfaction with the claim process, with the vast majority of claimants (96%) rating their overall experience of applying for the SEISS as either good or very good. Claimants were also very positive about the application process, with 90% feeling most aspects were clear.
As the scheme progressed HMRC took the decision to introduce personal claim dates for the potentially eligible population. This was effective in reassuring customers that they would be able to make a claim from a particular date and in managing the high contact levels around the opening of the claim window for the earlier grants. HMRC also learned from customer feedback to send claim messages by email, to make the messages short, and to include the claim date early in the text. These are process and communication learning points for any future scheme.
To be eligible for the first, second and third SEISS grants (in 2020 to 2021), individuals were required to have filed their 2018 to 2019 Self Assessment tax return on or before 23 April 2020. The value of the first 3 grants was based on an average of the trading profits declared on tax returns covering the period 2016 to 2017 until 2018 to 2019. For the fourth and fifth grant (in 2021), the 2019 to 2020 tax return had to be filed by 2 March 2021. Using the 2019 to 2020 tax return meant eligibility for the scheme could be widened to include those newly self-employed or newly eligible who met the filing deadline.
Individuals were required to confirm that they had been adversely affected by COVID-19 for the first and second grants. For the third, fourth and fifth grants, claimants had to meet a more specific test, the RBT, declaring that they reasonably believed that any reduced activity, capacity or demand due to COVID-19 would result in a significant reduction in their trading profits compared to what they would otherwise have expected to achieve during this period. Guidance asked claimants to keep evidence of the impact of the COVID-19 pandemic on their business.
The value of the fourth and fifth grants was based on an average of the trading profits declared on tax returns covering the period 2016 to 2017 until 2019 to 2020. Using a 4-year average of profits accounted for fluctuations in trading income and profits over time.
The value of the fifth grant was also determined by a turnover test, called the FID. This was designed to target the most generous support at those experiencing a slower recovery, while continuing to support those who were reopening their businesses. The FID meant that those declaring a larger reduction in turnover received a grant based on 80% of 3 months’ average trading profits, whereas those who suffered a smaller reduction in trading profits received a grant worth 30% of 3 months’ average trading profits.
The FID was designed using a comparison of ‘pandemic year’ turnover (April 2020 to April 2021) to turnover from an earlier year included in a filed tax return. This data was only available for the fifth grant.
To be eligible for the SEISS, individuals also needed to be trading at the point of claiming and intend to continue trading in the following tax year. Recipients of SEISS grants were allowed to continue to trade, start a new trade and/or take on other employment, but they could not permanently cease trading. When new tax data was available ahead of the fourth and fifth grants being launched, individuals who had ceased trading were no longer eligible for the scheme.
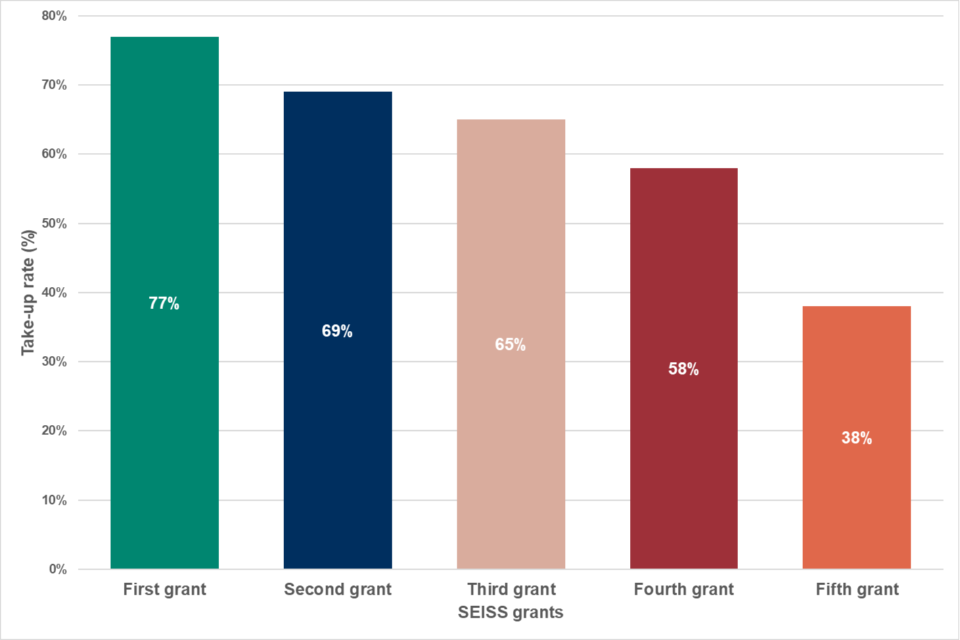
Table 1.1 summarises the total number and value of claims made for each SEISS grant. The number of claims declined with each successive grant, likely as a result of both an improving economic recovery and the introduction of the RBT and FID. The take-up rate, defined as the proportion of potentially eligible self-employed individuals for each grant who made a claim, is also shown, and declines in a similar manner.
Table 1.1 Number and value of claims for each SEISS grant
| Grants | Total number of claims (000s) | Total value of claims (£ millions) | Average value of claims (£) | Take-up rate (%) |
|---|---|---|---|---|
| First grant | 2,610 | 7,591 | 2,900 | 77 |
| Second grant | 2,351 | 5,931 | 2,500 | 69 |
| Third grant | 2,194 | 6,219 | 2,800 | 65 |
| Fourth grant | 1,958 | 5,518 | 2,800 | 58 |
| Fifth grant | 1,262 | 2,846 | 2,300 | 38 |
| Total across all grants | 10,374 | 28,105 | 2,700 | - |
| Total across individuals | 2,897 | 28,105 | 2,800 | - |
The eligibility rules evolved throughout the 5 iterations of the scheme to reflect the changing economic conditions and social restrictions, and to ensure the grants continued to be targeted at self-employed people most affected by the pandemic. Table 1.2 outlines the eligibility criteria throughout the 5 grants. More detail can be found in the accompanying information document published alongside this evaluation.
Changes setting out the statutory rules were introduced via the second SEISS Treasury Direction to allow claims from new parents and reservists. The changes meant that some new parents who did not submit a 2018 to 2019 tax return, or whose trading profits were less than their non-trading income in that year, may have become eligible. Similarly, self-employed reservists may have become newly eligible.
If newly eligible, these groups could claim both the first and second grant. For reservists who were assessed as ineligible on the basis of their 2019 to 2020 Self Assessment returns, HMRC assessed their eligibility and based their grant calculations on information from either their 2018 to 2019 Self Assessment return or an average of their 2016 to 2017, 2017 to 2018 and 2018 to 2019 tax returns. These groups also needed to meet the other standard eligibility criteria to secure support from the SEISS.
As stated above, the SEISS was designed to support individuals most reliant on their income from self-employment. The use of trading profits to determine eligibility meant that individuals receiving their income from other sources such as short-term employment contracts or investment income like dividends were not eligible. Individuals on a PAYE employment contract may have been eligible for the CJRS. Requiring claimants to have included trading income on their tax return was the best way of both targeting support and operationalising the SEISS at scale and at pace.
Using data outside of Self Assessment tax returns to increase eligibility would have put additional strain on HMRC’s operational capabilities, resulting in slower payments. Tax returns were a critical part of demonstrating earnings for the self-employed population and not using them would have increased the risk of error and fraud.
To ensure quick delivery of support, SEISS grants were paid via lump sums. The SEISS grants were not intended to provide a month-by-month replacement of income. Targeting and self-certification were introduced into the scheme over time with the RBT in place from the third grant onwards, and the FID for the fifth grant. Both of these were introduced to improve targeting and reduce the risk of deadweight within the scheme. However, they were not introduced sooner due to the need for support to be delivered in a broad manner that did not deter legitimate claimants in the early stages of the pandemic when economic restrictions were most severe.
Table 1.2 SEISS eligibility criteria
| Grant | Qualifying period | Criteria | Grant value % (according to turnover amount in the fifth grant) | Grant cap (£) |
|---|---|---|---|---|
| First grant | Impacted on or before 13 July 2020 | Business adversely affected by the COVID-19 pandemic. | 80 | 7,500 |
| Second grant | 14 July 2020 – 19 October 2020 | Business adversely affected by the COVID-19 pandemic. | 70 | 6,570 |
| Third grant | 1 November 2020 – 29 January 2021 |
RBT Claimant must declare that they reasonably believed that any reduced activity, capacity or demand due to COVID-19, would result in a significant reduction in trading profits, compared to what they would otherwise expect to have achieved during this period. Note: For this, and the subsequent grants, the adversely affected test also applied, but in practice it was met by someone meeting the RBT. |
80 | 7,500 |
| Fourth grant | 1 February 2021 – 30 April 2021 | RBT | 80 | 7,500 |
| Fifth grant | 1 May 2021 – 30 September 2021 |
RBT In addition: The FID was introduced to determine the amount of the grant. Individuals who suffered a 30% or smaller reduction in turnover received 30% of 3 months’ average trading profits, while the rate was 80% for those who suffered a greater reduction in turnover. |
80/30 | 7,500/2,850 |
1.5 The closure of the SEISS
The number and value of SEISS claims was highest for the first SEISS grant, corresponding to the initial wave of COVID-19, paid out between May and July 2020. Take-up declined with each successive grant as shown in figure 1.1 below. Introducing the RBT for the third SEISS grant onwards and FID for the fifth grant, alongside improving economic conditions and reduced restrictions over time, are likely to have contributed to take-up declining to 38% for the final grant.
Figure 1.1: Take-up rate of the SEISS across the 5 grants
Source: HMRC SEISS data
Sample size: Approximately 3.4 million individuals were potentially eligible for each SEISS grant, declining to 3.3 million for the final grant. Small changes in the numbers of eligible and ineligible individuals between grants occur as HMRC reviewed and monitored HMRC data systems to identify all potentially eligible individuals and to ensure that only genuine HMRC customers are invited to claim
Notes: Uses SEISS claims up to 28 October 2021, consistent with the final statistics publication
Table 1.3 Take-up rates of the SEISS grants
| SEISS grant | Take-up rate (%) |
|---|---|
| First grant | 77 |
| Second grant | 69 |
| Third grant | 65 |
| Fourth grant | 58 |
| Fifth grant | 38 |
The fifth and final SEISS grant was paid out up to the end of September 2021, coinciding with the easing of restrictions and the withdrawal of other COVID-19 support such as the CJRS. SEISS grants were subject to Income Tax and NICs and SEISS amounts were reported on individual’s Self Assessment tax returns for 2020 to 2021 and 2021 to 2022. HMRC looked into developing a process to pre-populate tax returns with the amount of grants received but it proved too complicated to deliver in time. Instead HMRC developed an ‘autocorrect’ process. This added SEISS grants to a tax return where they had not been included. However, some customers had entered the grants in the wrong boxes, so a separate process had to be designed with supporting legislation to allow customers to amend those returns by telephone.
There is ongoing work on how HMRC’s information and data-gathering powers could be updated to further enable digitalisation of services, improve compliance and reduce administrative burdens. The Tax Administration Framework Review (TAFR) is part of the government’s 10-year Tax Administration Strategy to ensure legislation, guidance and processes surrounding tax administration are suitable to deliver the digital tax system the UK will require in the future. A TAFR Information and Data Call for Evidence was published on 27 April 2023. This work focuses primarily around improving the range of information and data HMRC collects, uses and shares across government. Securing higher quality data from existing third parties could improve the accuracy of data-matching and pave the way for wider use of pre-population of Self Assessment tax returns.
Chapter 2: Error and fraud
2.1 Introduction
This chapter addresses the following evaluation question:
- what was the scale of error and fraud associated with the scheme throughout its delivery and how has HMRC dealt with it?
The SEISS interim evaluation published in 2022 provided a detailed overview of HMRC’s compliance approach, including the establishment of a Taxpayer Protection Taskforce. This information can be accessed through the interim evaluation or the 2022 to 2023 HMRC Annual Report and Accounts. This section will focus on updated methodology and findings since the SEISS interim evaluation was published in 2022.
During the design phase of the scheme, government priorities were to deliver a scheme that would provide financial support quickly to the eligible self-employed, while minimising error and fraud. The scheme therefore made use of data that HMRC already held on its system and could verify, mitigating the risk of customers manipulating evidence in order to make a claim or claim a larger value of grant.
Pre-payment controls were put in place to address notable risks, including from organised crime groups who could have hijacked customer identities or manipulated Self Assessment returns to secure grants to which they were not entitled. These controls proved very effective and resulted in less fraud across the scheme than anticipated. Compliance activity is still ongoing across all COVID-19 schemes and up to 31 March 2023, HMRC has prevented and recovered over £1.4 billion, of which £466 million relates to the SEISS.
This chapter draws evidence from the work conducted by HMRC analysts to assess the level of error and fraud for the SEISS, which used a wide-ranging evidence base including HMRC administrative data. A package of measures designed to minimise the risk of organised crime, opportunistic fraud and customer error was built into the claims process and was deployed for each iteration of the scheme.
2.2 Error and fraud estimate
The final estimate of error and fraud for the entirety of the scheme (all 5 grants) is between 4.2% to 6.3%, with a most likely value of 5.2% (£1.2 billion to £1.8 billion, most likely value of £1.5 billion). This is an increase from last year’s most likely estimate and is above the top of last year’s estimate range (2.7% to 4.8%, most likely value of 3.6%). The decomposition of the overall estimate into each individual risk is shown in the technical report on error and fraud published as part of HMRC’s Annual Report and Accounts. This also provides further detail on the methodology for calculating error and fraud.
HMRC have recently completed and reviewed the results of a Random Enquiry Programme covering the fourth and fifth SEISS grants. A statistically significant number of claims were selected at random for a post-payment compliance audit, the result of which has given new insight on the FID and the RBT. The increase in error and fraud in this year’s estimate is largely driven by the RBT in the fourth and fifth SEISS grants.
HMRC also has more complete data from Self Assessment tax returns covering the whole of 2020 to 2021 and 2021 to 2022 which gives a more comprehensive understanding of the claimant population.
Updated estimates have been published in the 2022 to 2023 Annual Report and Accounts along with an updated technical publication with more detail on the final estimates.
The interim evaluation suggested the reason for the increase in the error and fraud rate for the later grants was likely to be due to some individuals anticipating the eligibility criteria and therefore manipulating information on their 2019 to 2020 tax return, as well as the introduction of the FID for the fifth grant. The original estimate for the error and fraud associated with the FID was 0.6 percentage points of the 3.6% total estimate. This has since been revised to 0.3 percentage points of the updated 5.2% total estimate. While there were taxpayers who had a discrepancy between the turnover reported on the Self Assessment tax return and the FID, the Random Enquiry Programme found that there were instances where this could be explained, and taxpayers were found to be compliant.
Although the error and fraud rate increased the overall cost of the fifth grant, the introduction of the FID is still estimated to be an overall cost-saving measure. This is due to the inclusion of a lower-rate grant (worth 30% of trading profits) and the reduction in take-up of the fifth grant. The exact saving from the FID is uncertain, due to other factors such as the changing economic situation, but could be up to £2.5 billion when comparing the drop-off in take-up between the fourth and fifth grants.
The RBT was introduced from the third SEISS grant onwards in order to improve targeting. This test required traders to confirm they believed they would suffer a reduction in their trading profits compared to what they would otherwise have expected in the absence of the pandemic. The RBT was devised to act as a ‘nudge’ for claimants intended to induce a behaviour change, and asked the customer to keep evidence to prove their reasonable belief that they would be impacted. Post-payment, it is difficult to establish the counterfactual to prove that the customer’s belief they would suffer a reduction in trading profits was not well grounded.
New insight from the Random Enquiry Programme has allowed HMRC to fill some evidence gaps and has shown that error and fraud from the RBT is larger than previously thought. Some customers were unable to provide evidence to support their claim. The error and fraud rate associated with the RBT for the fourth and fifth SEISS grants was estimated to be negligible in the interim evaluation, but has since been revised upwards to 2.2%, at a monetary cost of £613 million.
Further detail on the nature of the compliance risks can be found in the updated technical publication on error and fraud. To provide context to the SEISS estimates and to underline the comparative effectiveness of the compliance measures built into the scheme, they can be compared to the tax gap estimates. One important caveat with such a comparison is that the tax gap is estimated including the downstream impacts of compliance, meaning this estimate is for the error and fraud rate remaining after compliance activity has already occurred, whereas the estimates presented for the COVID-19 schemes do not include compliance recoveries. The most likely error and fraud figure for the whole life cycle of the SEISS scheme is 5.2%.
Compared to the Self Assessment tax gap, which covers a similar population to the SEISS, there is a tax gap of 12.4% in 2020 to 2021, and 11.2% in 2021 to 2022, so the SEISS is subject to a much lower rate of non-compliance than is seen elsewhere for this population. This appears even more favourable in comparison to the Self Assessment Business tax gap highlighted in the latest measuring tax gaps publication and the prior publication which stands at around 20%. This will cover a broadly similar population to the SEISS claimant population as it excluded large partnerships, who are unlikely to have been eligible for the SEISS based on the £50,000 trading profits cut-off.
2.3 Compliance approach
From the beginning, it was expected that the SEISS would be a target for fraud and that customers operating at pace and under pressure would make mistakes. Therefore, a range of measures to protect the scheme against organised crime, opportunistic fraud, and customer error were designed into the SEISS, which drew on analysis and intelligence of the likely significant risks.
The approach is outlined in detail in the SEISS interim evaluation and summarised below:
- promoting compliance – through education, good customer service, and providing easy ways for customers to make correct claims or correct and repay overclaims, including establishing an online portal
- preventing non-compliance – to limit incorrect or fraudulent claims being accepted, compliance controls were built into the scheme design and the claims process itself
- post-payment compliance – through additional powers given to HMRC as well as developing automatic correction methods and the creation of a taskforce specifically designed to recover overpaid COVID-19 grants
Since the start of the compliance activity into the SEISS and up to 31 March 2023, HMRC has recovered and prevented a loss of over £466 million with compliance activity still ongoing. Further details on the SEISS compliance outcomes can be found in HMRC’s Annual Report and Accounts for 2022 to 2023.
Additionally, repayments occur when customers entitled to a grant choose to repay it voluntarily, or when customers repay due to error or fraud without a prompt from HMRC. Up to end of March 2023, there has been a total of £51 million unprompted repayments and disclosures of SEISS grants.
Although the pre-payment controls and post-payment compliance action have succeeded in tackling error and fraud within the SEISS, there are 2 process decisions that could benefit from reconsideration for any future similar scheme that may help reduce the need for compliance interventions, albeit with some downsides.
Firstly, a decision was taken to exclude agents from making claims on behalf of their clients. This was in part to secure rapid delivery of the scheme, as building in claims for agents would take time, as well as to ensure HMRC could check that only one claim per grant was made by and paid out to each customer. Feedback from agents and representative bodies indicates that if they had been more directly involved in the claims process they could have ensured only those who were eligible claimed the grants and that receipt of the grants was recorded in the correct box on later tax returns.
Secondly, a decision was taken to invite claims from those who had indicated on their 2018 to 2019 tax return that they had ceased self-employment. The government knows that the self-employed population is volatile, with many pausing their trades, or ceasing one activity and commencing another a short time later. These traders would still have been eligible for the grant. At the outset the government was keen to ensure all those who might be eligible were invited to make a claim, at which point the claimant would then have to confirm whether they met the detailed scheme rules.
This decision led to 2 large scale post-payment compliance campaigns to check the trading position and recover grants that were paid to those who, despite confirming that they were still trading in the claim, had in fact not continued to trade. Some of this activity could have been avoided if this group had never been invited to claim, although a review process would have been needed to include cases where the customer had not been invited to claim but could show they had traded in the relevant tax year.
Chapter 3: The impact of the SEISS on incomes
3.1 Introduction
This chapter contributes towards answering the following evaluation questions:
- to what extent did the SEISS support claimants’ incomes?
- what impact did the eligibility criteria have on the scheme achieving its policy objectives?
- who was impacted by the SEISS and what can be learned from the relationships between their characteristics and the outcomes/impacts of the scheme?
- what impact did the SEISS have on claimants’ self-employment activity?
3.2 Overall assessment
The SEISS supported many self-employed individuals during the pandemic who would otherwise have experienced a decline in income. The impact of support varied across SEISS recipients, reflecting the diversity of the self-employed population and the variation in impact of the pandemic on their businesses. A lesson here is that improved data, including better understanding of sectors, and more timely information to understand the impact of the pandemic on businesses, could have helped reduce this range of outcomes.
This chapter assesses the impact of the SEISS across the entirety of the scheme using a range of analysis. There is a significant degree of uncertainty associated with some of these results, given that it is impossible to know what would have happened in the absence of the pandemic.
Taking the evidence together suggests 3 key conclusions:
-
The 2021 to 2022 tax year data shows the SEISS continued to ensure many self-employed individuals who would otherwise have been in significant financial difficultly were supported through the pandemic. On average, the SEISS appeared to protect profits of recipients that would have otherwise suffered falls in trading profits of 33% in 2020 to 2021 and 17% in 2021 to 2022. However, there were a range of outcomes for this population, with some self-employed people likely receiving more money than their pre-pandemic income, whereas others may have needed more support to maintain pre-pandemic income. The effect is particularly acute when looking at those sectors which were most affected by COVID-19 restrictions, for example arts, entertainment and recreation. Sectors least affected by restrictions experienced significant gains compared to their pre-pandemic income when taking into account the value of SEISS grants, although these were tempered by better targeting over time.
-
The SEISS eligibility criteria of having no more than £50,000 of trading profits and at least half of income from self-employment were set to support those people who were likely to be most impacted by a decline in their self-employed income. On average, self-employed individuals who were assessed as ineligible for the SEISS and those assessed as eligible but did not claim the SEISS did not fare worse, with significant improvements in average profits of 21% and 33% respectively in 2021 to 2022 compared to pre-pandemic. This is compared to eligible claimants who experienced a 17% decrease in average trading profits without the SEISS grant, and a 9% increase in average trading profits including the SEISS grant. The need to get support to people quickly combined with the lack of real-time information for the self-employed population meant it was not possible for early grants to have an overly complex design. However, the targeting of the SEISS was improved over time with the introduction of additional needs-based criteria to target the most generous support at those experiencing a slower recovery.
-
Although evidence is mixed, there may have been a localised behavioural change by self-employed people on higher incomes as a result of receiving SEISS grants, whereby receiving the grants resulted in reduced income, possibly due to lower work effort, known as an income effect in economic theory. This effect appears to have increased for the fourth and fifth grants. It is worth noting that for any significant income replacement grant, it would be expected to see some behavioural response. However, this behavioural effect can only be credibly evidenced for those with higher incomes. It is expected that the income effect would be less likely for individuals with lower incomes, and those who received smaller grants, but this cannot be tested by this analysis.
3.3 Trading profits analysis
If the SEISS was successful at achieving its primary aim of supporting self-employed incomes during the pandemic, trading profits in 2020 to 2021 and 2021 to 2022 might be expected to remain broadly in line with the historic trends. Before assessing the causal impact of the SEISS, this chapter considers the average trading profits of the self-employed population during the pandemic (2020 to 2021 and 2021 to 2022), compared to pre-pandemic, to examine the difference in outcomes between SEISS recipients and non-recipients. Outcomes are compared for several key groups related to their SEISS eligibility and use: ‘eligible claimants’, ‘potentially eligible non-claimants’, ‘assessed as ineligible’ and ‘newly self-employed eligible claimants’ (who were ineligible in 2020 to 2021 but eligible in 2021 to 2022).
Figure 3.1: Mean trading profits based on SEISS claimant status

Source: HMRC SEISS data matched to Self Assessment taxpayer information
Sample size: Approximately 4.2 million individuals
Notes: Only includes individuals if they filed at least one self-employed page on a Self Assessment return for 2019 to 2020 and 2020 to 2021 for the first 3 SEISS grants and 2021 to 2022 for the fourth and fifth SEISS grants, and some outliers are removed
Table 3.1 Mean trading profits based on SEISS claimant status
| Tax year | Eligible claimants including SEISS grant (£) | Eligible claimants excluding SEISS grant (£) | Potentially eligible non-claimants (£) | Assessed as ineligible (£) | Newly self-employed eligible claimants including SEISS grant (£) | Newly self-employed eligible claimants excluding SEISS grant (£) | Full self-employed population (£) |
|---|---|---|---|---|---|---|---|
| 16/17 | 14,315 | 14,315 | 13,961 | 35,501 | - | - | 16,618 |
| 17/18 | 14,843 | 14,843 | 14,307 | 36,330 | - | - | 17,766 |
| 18/19 | 15,641 | 15,641 | 14,191 | 33,769 | - | - | 18,192 |
| 19/20 | 15,919 | 15,919 | 14,511 | 36,324 | 10,723 | 10,723 | 16,992 |
| 20/21 | 18,056 | 10,678 | 15,183 | 37,770 | 11,597 | 11,597 | 19,415 |
| 21/22 | 17,344 | 13,157 | 19,235 | 43,834 | 16,199 | 12,702 | 20,564 |
Figure 3.1 shows that, on average, SEISS grants more than offset the decline in trading profits experienced by self-employed SEISS claimants in 2020 to 2021. This suggests that, had the SEISS not existed, claimants may have experienced a potentially large reduction in income, particularly in 2020 to 2021. However, there was significant variation in outcomes within this population.
In 2021 to 2022, the gap between average trading profits including the SEISS grants and excluding the SEISS grants reduced compared to 2020 to 2021. This could be explained by a combination of increased targeting, with the introduction of the FID for the fifth SEISS grant and the improved economic outlook during 2021. This is evidenced by lower take up rates for the fourth and fifth grants (58% and 38% respectively) indicating individuals may have started to experience an increase in trading profits as the economy opened up.
Trading profits increased by 9% to just over £17,000 in 2021 to 2022 compared to pre-pandemic profits in 2019 to 2020 (when including SEISS grants). This was slightly down on trading profits of just over £18,000 in 2020 to 2021, likely explained by improved targeting via the FID and lower grants for more strongly performing businesses. 59% of individuals saw an increase in profits in 2021 to 2022 compared to pre-pandemic profits in 2019 to 2020.
Figure 3.1 also suggests that newly self-employed individuals would have experienced a small level of year-on-year growth in average trading profits without the SEISS. Compared to historical trends of newly self-employed individuals among whom initial trading profits are generally lower, newer self-employed claimants appear to have made a stronger start to their business in 2019 to 2020 and were more able to continue trading in 2020 to 2021 before claiming SEISS grants in 2021 to 2022.
This suggests these businesses were more able to adapt to the shock to the economy. Over half (53%) of newly self-employed eligible claimants reported increased trading profits in both 2020 to 2021 and in 2021 to 2022, when the SEISS grant is excluded. When the SEISS grant is included in 2021 to 2022 (the year this group became eligible), over two-thirds (71%) experienced an increase in annual trading profits.
In comparison, those who were potentially eligible for the SEISS but chose not to claim experienced on average a strong recovery in annual trading profits in 2021 to 2022 (27%, up from 3% during 2020 to 2021). This suggests that this group generally did not need the SEISS because their businesses were better able to generate profits during the pandemic.
Those who were assessed as ineligible for the SEISS saw large increases in average trading profits in 2021 to 2022. This jump is mainly driven by those individuals who were assessed as ineligible due to having trading profits greater than £50,000 and supports the theory that businesses with higher trading profits were more able to adapt to the pandemic.
However, there was a significant range in outcomes, as sectoral analysis illustrates. Figure 3.2 compares the difference that the SEISS made for one of the most affected sectors (arts, entertainment and recreation) with one of the less affected sectors (construction). The SEISS topped up average profits for arts, entertainment and recreation to around pre-pandemic levels, whereas in construction it provided a significant surplus in 2020 to 2021.
This was less pronounced in 2021 to 2022, further evidence of the improved targeting for the last 2 grants. Construction was the sector with the highest number of SEISS claimants and covers a very broad range of activities as well as a dependency on other sectors (to avoid supply chain issues), which likely means effects from the pandemic within this sector also varied. The variation in effects by sector shows that the SEISS helped many individuals who were particularly affected by loss of income during the pandemic.
Figure 3.2: Mean trading profits for SEISS eligible claimants in the arts, entertainment and recreation and the construction sectors

Source: HMRC SEISS data matched to Self Assessment taxpayer information and the Standard Industry Classification produced by the Office for National Statistics (ONS)
Sample size: Approximately 1.2 million individuals
Notes: Only includes individuals if they filed at least one self-employed page on a Self Assessment return for 2019 to 2020 and 2020 to 2021 for the first 3 SEISS grants and 2021 to 2022 for the fourth and fifth SEISS grants, and some outliers are removed
Table 3.2 Mean trading profits for SEISS eligible claimants in the arts, entertainment and recreation and the construction sectors
| Tax year | Eligible claimants including SEISS grant - arts, entertainment and recreation (£) | Eligible claimants excluding SEISS grant - arts, entertainment and recreation (£) | Eligible claimants including SEISS grant - construction (£) | Eligible claimants excluding SEISS grant - construction (£) |
|---|---|---|---|---|
| 16/17 | 13,454 | 13,454 | 17,359 | 17,359 |
| 17/18 | 14,042 | 14,042 | 17,928 | 17,928 |
| 18/19 | 14,757 | 14,757 | 18,998 | 18,998 |
| 19/20 | 15,297 | 15,297 | 19,443 | 19,443 |
| 20/21 | 15,782 | 8,637 | 22,284 | 13,210 |
| 21/22 | 16,761 | 12,435 | 21,616 | 16,595 |
3.4 Income counterfactual analysis
Another potential explanation for the differing outcomes in figure 3.1 (that trading profits for claimants, excluding the SEISS, are lower than the assessed as ineligible group) is that there may have been an ‘income effect’; that is receiving the SEISS may have led to some claimants reducing the amount of work they undertook. An income effect is consistent with economic theory and therefore might be expected when a grant replaces earned income. However, it is difficult to test for as there is no way to know for certain how individuals would have behaved had the SEISS not been made available. A counterfactual assessment attempts to estimate what would have happened in the absence of the SEISS. An approach called ‘Fuzzy Regression Discontinuity Design (RDD)’ is used to test how claiming the SEISS affected behaviour, in order to consider the impact of the scheme.
RDD is a quasi-experimental evaluation tool that can help estimate the causal impact of an intervention (such as the SEISS) that was offered to a group of people who met certain eligibility criteria, by comparing outcomes either side of those criteria thresholds. These criteria will create a discontinuity (a change in the trend) in outcomes for individuals on either side of the eligibility thresholds. Quasi-experimental means that statistical techniques are used to estimate the impact of the intervention, given that the grants were not randomly allocated. Randomisation would have ensured no systematic differences between the treatment (assessed as potentially eligible for the SEISS) and counterfactual (assessed as ineligible) populations meaning any observed differences in observed outcomes could be directly attributed to the SEISS. However, randomisation would not be ethical in this case.
This analysis compares trading profits and total income in 2021 to 2022 for individuals immediately above and below the cut-off points for the fourth and fifth SEISS grants of £50,000 average trading profits, and average trading profits being 50% of total income. The interim evaluation published in October 2022 compared trading profits in 2020 to 2021 for individuals immediately above and below the cut-off points for eligibility for the first 3 SEISS grants. It reported that income from the first 3 SEISS grants may have allowed some individuals to slightly reduce hours worked (referred to as an ‘income effect’).
In this analysis a discontinuity occurs at the eligibility threshold because individuals with less than £50,000 average trading profits (calculated using whichever years individuals were actively trading between 2016 to 2017 and 2019 to 2020) often chose to claim the SEISS, whereas those above this threshold were assessed as ineligible. The fuzzy design allows for voluntary participation as not every individual with average trading profits below £50,000 claimed the SEISS.
The analysis looks at trading profits and total income, both including and excluding SEISS grants, as outcome variables. Whereas trading profits are the total net profits of individuals’ self-employed businesses, total income includes other sources of income the individual may have, such as employment, dividends, pensions or property.
Figure 3.3: Income bands based on average trading profits between 2016 to 2017 and 2019 to 2020 by SEISS eligibility status

Source: HMRC SEISS data matched to Self Assessment taxpayer information
Sample size: Approximately 4.2 million individuals
Notes: Only includes individuals if they filed at least one self-employed page on a Self Assessment return for 2019 to 2020 and 2020 to 2021 for the first 3 SEISS grants and 2021 to 2022 for the fourth and fifth SEISS grants, and some outliers are removed
Table 3.3 Income bands based on average trading profits between 2016 to 2017 and 2019 to 2020 by SEISS eligibility status
| Average (2016/17 to 2019/20) trading profit income bands | Eligible claimants (000’s) | Potentially eligible non-claimants (000’s) | Assessed as ineligible (000’s) |
|---|---|---|---|
| -0k | 0 | 0 | 271 |
| 0k-10k | 784 | 38 | 585 |
| 10k-20k | 798 | 319 | 78 |
| 20k-30k | 297 | 159 | 17 |
| 30k-40k | 101 | 77 | 7 |
| 40k-50k | 33 | 37 | 4 |
| 50k+ | 4 | 9 | 153 |
Figure 3.3 shows the majority of individuals assessed as potentially eligible for the SEISS had lower average trading profits of between £0 and £20,000 which is consistent with median self-employment income being much lower (around £10,000 in 2021 to 2022) compared to the individuals assessed in the RDD around the £50,000 threshold. There are a small number of individuals assessed as potentially eligible with average trading profits over the £50,000 threshold. This is because these individuals would have been assessed as potentially eligible on their single-year 2019 to 2020 trading profits but were assessed as ineligible based on their average trading profits.
Figures 3.4a and 3.4b compare the trading profits and total income of those just below and above the £50,000 trading profits eligibility criteria. Figure 3.4a shows trading profits in 2021 to 2022 as the outcome variable, both including and excluding SEISS grants, and figure 3.4b shows the same but for total incomes. Self-employed people who sit very marginally above or below the eligibility threshold ought to have had very similar trading profits and/or incomes when excluding SEISS grants and have other similar characteristics.
Therefore, any difference in trading profits and/or incomes is more likely to be the impact on behaviour that can be attributed to receiving SEISS grants. More details on this analysis can be found in the counterfactual technical note.
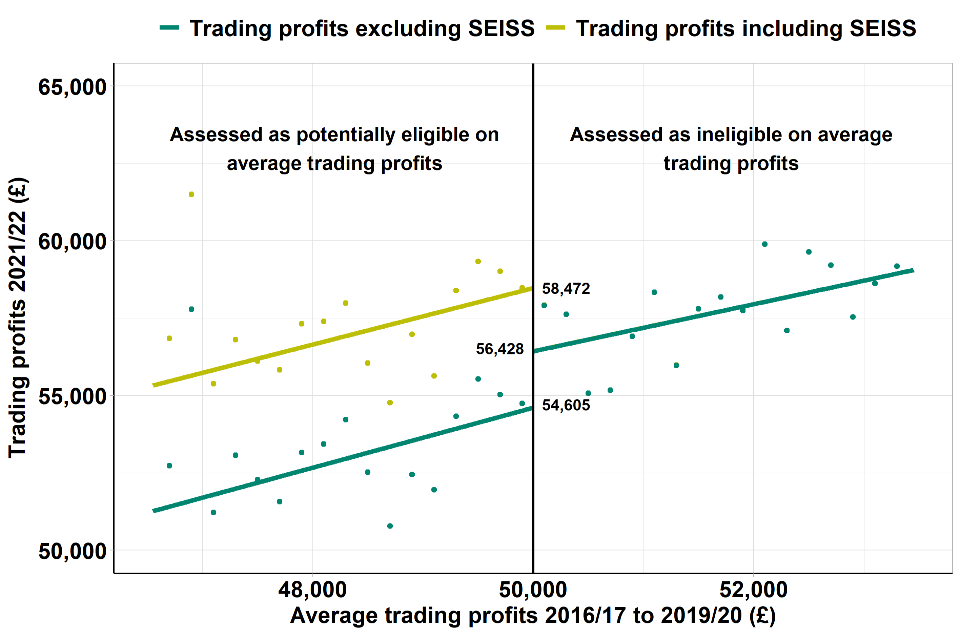
Figure 3.4a: RDD output for average trading profits (between 2016 to 2017 and 2019 to 2020) against trading profits in 2021 to 2022
Source: HMRC SEISS data matched to Self Assessment taxpayer information
Sample size: Approximately 17,000 individuals
Notes: Only includes individuals if they filed at least one self-employed page on a Self Assessment return for 2019 to 2020, 2020 to 2021 and 2021 to 2022, and some outliers are removed. All individuals included were ineligible based on their 2019 to 2020 Self Assessment return alone.
Table 3.4a RDD output for average trading profits (between 2016 to 2017 and 2019 to 2020) against trading profits in 2021 to 2022
| Outcome variable | 2021 to 2022 trading profits with average trading profits under £50,000 - A | 2021 to 2022 trading profits with average trading profits over £50,000 - B | Difference A-B = C | Difference in probability of claiming SEISS either side of £50,000 discontinuity - D | Estimate = C/D |
|---|---|---|---|---|---|
| 21/22 trading profits including SEISS (£) | 58,472 | 56,428 | 2,044 | 0.380 | 5,379 |
| 21/22 trading profits excluding SEISS (£) | 54,605 | 56,428 | -1,823 | 0.380 | -4,797 |
Figure 3.4b: RDD output for average trading profits (between 2016 to 2017 and 2019 to 2020) against total income in 2021 to 2022

Table 3.4b RDD output for average trading profits (of years 2016 to 2019) against total income in 2021 to 2022
| Outcome variable | 2021 to 2022 total income with average trading profits under £50,000 - A | 2021 to 2022 total income with average trading profits over £50,000 - B | Difference A-B = C | Difference in probability of claiming SEISS either side of £50,000 discontinuity - D | Estimate = C/D |
|---|---|---|---|---|---|
| 21/22 total income including SEISS (£) | 66,552 | 66,734 | -182 | 0.380 | -479 |
| 21/22 total income excluding SEISS (£) | 62,867 | 66,734 | -3,867 | 0.380 | -10,176 |
The analysis shows that, close to both thresholds, SEISS claimants in the potentially eligible group had on average lower non-SEISS trading profits and incomes than the assessed as ineligible group.
When comparing the groups that fall either side of the £50,000 threshold (figure 3.4a), the gap between the dark green lines at the threshold for trading profits excluding SEISS grants (£56,428 compared to £54,605) is statistically insignificant. Figure 3.4a also shows that for individuals with average trading profits close to the threshold of £50,000, their 2021 to 2022 trading profits are on average around £55,000. In the interim evaluation it was shown that individuals close to the £50,000 average trading profits threshold had 2020 to 2021 trading profits of around £40,000. This provides further evidence that businesses started recovering to pre-pandemic levels of trading profits in 2021 to 2022.
However, there is a statistically significant difference between the darker blue lines (figure 3.4b) at the threshold for total income excluding SEISS grants (£66,734 compared to £62,867). Comparing the average values for trading profits and total income at the threshold suggests the majority of total income for individuals close to the threshold is sourced from trading profits. Furthermore, deeper analysis into the sources of other non-trading income has not shown any significant differences between individuals assessed as potentially eligible and those assessed as ineligible. This suggests self-employment activity is driving much of the observed difference, however this is not translated into a statistically significant difference when isolating trading profits from total income.
Further analysis has indicated a difference in outcomes between self-employed individuals who are sole traders and those who are members of a partnership. Limiting the population to those with sole trader income has shown those assessed as potentially eligible based on average trading profits experienced trading profits excluding the SEISS that were on average around £2,000 lower in 2021 to 2022 than those assessed as ineligible, which is equivalent to around £8,000 per SEISS recipient. This difference is statistically significant at the 10% level which suggests that income from the SEISS grants may have slightly disincentivised economic activity (an ‘income effect’) for sole traders, who have greater autonomy over their business, but there is less evidence of an impact for self-employed individuals who are members of a partnership.
Overall, this provides some limited evidence that receiving SEISS grants was associated with lower incomes (excluding SEISS grants). This could suggest that receipt of SEISS grants may have led some claimants to reduce the amount of work they undertook, or to reduce their involvement in other economic activities. This is known as an ‘income effect’. The possibility of an income effect is consistent with economic theory of individuals’ working decisions where an unearned grant is received.
The size of this estimated effect in 2021 to 2022 is almost £4,000 near the £50,000 average trading profits threshold, which is equivalent to almost £10,000 per SEISS recipient of the last 2 SEISS grants. The population assessed in this analysis was eligible for the maximum value of the fourth SEISS grant capped at £7,500, and for the fifth SEISS grant either a maximum of £7,500 for those with a turnover reduction of 30% or more, or a maximum of £2,850 for those with a turnover reduction of less than 30%. This means this group will have been eligible to claim between £10,350 and £15,000 in SEISS grants. It is notable that this is a larger income effect than was found for the first 3 grants of around £5,000 per recipient. This may reflect the SEISS grants being paid out during the first half of the year, but trading profits are reported for the whole year and there was a strong economic recovery experienced during the second half of the year in 2021 to 2022 which may have contributed to improved trading income.
However, it is important to note that the extent of this income effect across the wider self-employed population is uncertain because the evidence is limited to total incomes either side of the £50,000 eligibility criteria, with no evidence of an income effect for trading profits unless the population is limited to sole traders only.
Furthermore, this analysis uses a specific sub-section of the SEISS population and whilst the demographics of this group are broadly representative of the self-employed population this finding is only valid around the £50,000 threshold and cannot be generalised to the entire population of SEISS recipients. Indeed, it is possible that behaviour for individuals close to the threshold could be due to a ‘substitution effect’ whereby individuals chose to work less in order to keep their trading profits below the eligibility cut-off in anticipation of eligibility for any continued or future support.
Therefore, this result is only directly valid for those individuals near the eligibility threshold (less than 1% of the total self-employed population) and may not be generalisable to the over 5 million individuals who were assessed for the SEISS, who may have different characteristics. It is expected that the income effect would be smaller for individuals with lower incomes, and those who received smaller values from the SEISS, but this cannot be tested by this analysis.
Chapter 4: Impact on businesses and the economy
4.1 Introduction
This chapter contributes towards answering the following evaluation questions:
- what contribution did the SEISS make to the outcomes and impacts identified?
- what impact did the eligibility criteria have on the scheme achieving its policy objectives?
- who was impacted by the SEISS and what can be learned from the relationships between characteristics and outcomes/impacts of the scheme?
- what impact did the SEISS have on claimants’ self-employment activity?
4.2 Overall assessment
SEISS was primarily intended to be an income support scheme, and the previous chapter assessed in detail the impact of the scheme in this respect. However, this chapter assesses the impact beyond this, especially on self-employed businesses and the macroeconomy. Overall, there are 3 key conclusions:
- In the short term, covering the first year of the pandemic, the scheme had a positive effect on business survivability, with claimants more likely to continue trading than potentially eligible non-claimants, or those assessed as ineligible
- The longer-term effect during the second year of the pandemic is less clear. Due to the lag in Self Assessment data it is not possible to fully assess the longer term impact of the SEISS on business survivability
- In addition to the effects on business survivability, there were some macroeconomic benefits from the scheme. The income provided to individuals from the SEISS had the impact of supporting demand during the pandemic and reducing the size of the negative shock to the economy, while helping businesses continue trading prevented periods of unemployment or inactivity
4.3 Business survivability analysis
Analysis of business survivability shows that SEISS claimants were more likely to continue trading than potentially eligible non-claimants or those assessed as ineligible for the scheme. This suggests the SEISS may have had a positive effect in helping businesses to survive during the pandemic.
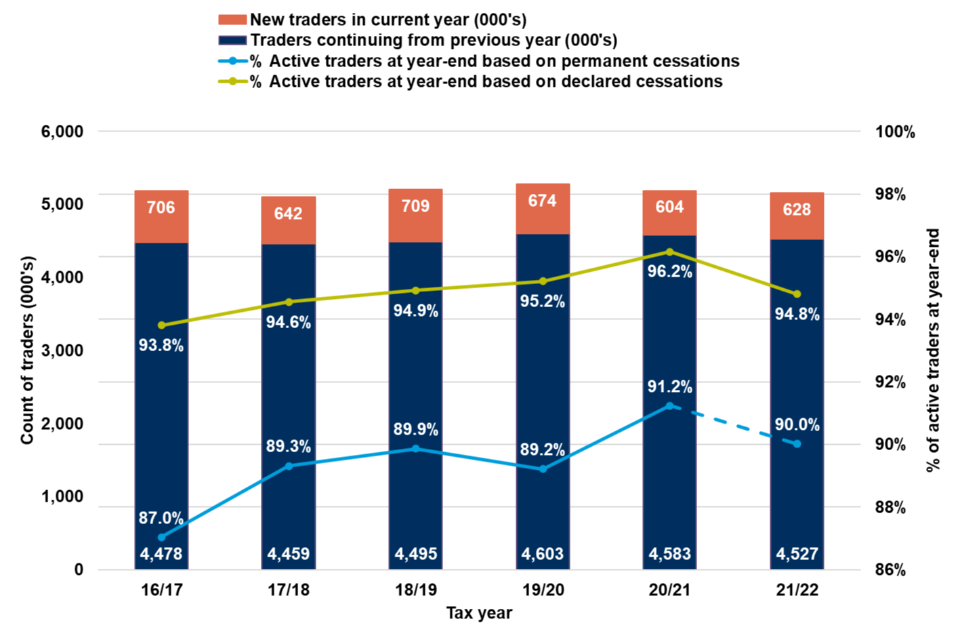
Figure 4.1: Churn of full self-employed population
Source: HMRC SEISS data matched to Self Assessment taxpayer information
Sample size: Approximately 5.3 million individuals
Notes: Includes the full self-employed population from 2016 to 2017 and 2021 to 2022 who are new traders in current year and traders continuing from previous year
Table 4.1: Churn of full self-employed population
| Tax year | Count of new traders in current year (000’s) | Traders continuing from previous year (000’s) | Active traders at year-end based on permanent cessations (%) | Active traders at year-end based on declared cessations (%) |
|---|---|---|---|---|
| 16/17 | 706 | 4,478 | 87.0 | 93.8 |
| 17/18 | 642 | 4,459 | 89.3 | 94.6 |
| 18/19 | 709 | 4,495 | 89.9 | 94.9 |
| 19/20 | 674 | 4,603 | 89.2 | 95.2 |
| 20/21 | 604 | 4,583 | 91.2 | 96.2 |
| 21/22 | 628 | 4,527 | 90.0 | 94.8 |
Analysis of the full self-employed population (at the individual level) shows an increase in business survivability during the first year of the pandemic (91.2% of traders in 2020 to 2021 remained active at year-end based on permanent cessations or 96.2% based on declared cessations). However, it should be noted that the full self-employed population includes individuals that were not assessed for the SEISS and individuals that ceased trading before the pandemic. Individuals not assessed for the SEISS includes new businesses that commenced trading during or after 2019 to 2020, which comprise around 15% of the total population each year. As such, this analysis includes traders who were more able to adapt to the effects of the pandemic.
Analysis in the SEISS interim evaluation showed early signs that the SEISS was helping businesses to continue trading. It should be noted that this analysis is limited to the subset of the self-employed population who were assessed for eligibility for the SEISS. Rolling forward this analysis to 2021 to 2022 tax year finds a reduced impact from the SEISS in terms of longer-term business survivability. However, this analysis should be treated with caution as it is limited to cessation dates as declared on Self Assessment returns. It is not possible to determine whether these represent permanent or temporary closures, or whether an individual has started an alternative business in the next tax year, or has not declared a cessation date. Within the 2021 to 2022 tax year, 27% of eligible claimants with declared business cessations had newly commenced employment within the tax year, compared to 29% of potentially eligible non-claimants and 12% of the assessed as ineligible population.
Figure 4.2: Percentage of active traders at year-end based on declared cessations

Source: HMRC SEISS data matched to Self Assessment taxpayer information
Sample size: Approximately 4.2 million individuals
Notes: Includes active traders for each eligibility criteria at year-end from 2016 to 2017 and 2021 to 2022 based on declared cessations
Table 4.2: Percentage of active traders at year-end based on declared cessations
| Tax year | Eligible claimants (%) | Potentially eligible non-claimants (%) | Assessed as ineligible (%) | Newly self-employed eligible claimants (%) |
|---|---|---|---|---|
| 16/17 | 99.2 | 99.2 | 99.0 | - |
| 17/18 | 99.5 | 99.4 | 99.3 | - |
| 18/19 | 99.1 | 99.0 | 99.2 | - |
| 19/20 | 99.2 | 98.3 | 99.3 | 98.5 |
| 20/21 | 97.7 | 94.9 | 95.4 | 99.1 |
| 21/22 | 95.8 | 95.3 | 94.9 | 94.9 |
Following receipt of 2021 to 2022 tax returns it is now possible to use a more robust approach in identifying true business cessations that occurred during the first year of the pandemic. For purposes of this analysis permanent cessations during 2020 to 2021 have been defined as individuals that traded or attempted to trade during that tax year and subsequently did not receive a notice to file a tax return for 2021 to 2022 (indicating they had informed HMRC they had ceased trading) or submitted a tax return for 2021 to 2022 for reasons other than trading. This more robust approach supports the early findings that the SEISS helped support businesses to continue trading but shows that using declared cessation dates provides an underestimate of actual business closures during 2020 to 2021.
Figure 4.3: Percentage of active traders at year-end based on permanent cessations

Source: HMRC SEISS data matched to Self Assessment taxpayer information
Sample size: Approximately 4.2 million individuals
Notes: Includes active traders for each eligibility criteria at year-end from 2016 to 2017 and 2021 to 2022 for active traders based on permanent cessations
Table 4.3: Percentage of active traders at year-end based on permanent cessations
| Tax year | Eligible claimants (%) | Potentially eligible non-claimants (%) | Assessed as ineligible (%) | Newly self-employed eligible claimants (%) |
|---|---|---|---|---|
| 16/17 | 99.0 | 98.8 | 98.1 | - |
| 17/18 | 99.9 | 99.9 | 100.0 | - |
| 18/19 | 98.4 | 99.8 | 99.8 | - |
| 19/20 | 98.7 | 99.3 | 99.6 | 95.5 |
| 20/21 | 95.4 | 90.7 | 90.6 | 97.0 |
| Estimated 21/22 | 93.6 | 91.0 | 90.2 | 88.9 |
Figure 4.3 shows that (at the individual level) those that claimed SEISS grants were more likely to continue trading in the short term than potentially eligible non-claimants and those who were assessed as ineligible. Amongst claimants, there was a 3.3 percentage points decrease in the percentage of active traders - from 98.7% in 2019 to 2020 down to 95.4% in 2020 to 2021. This is a smaller reduction than seen among potentially eligible non-claimants (8.6 percentage points decrease from 99.3% in 2019 to 2020 down to 90.7% in 2020 to 2021) and those assessed as ineligible (9.0 percentage points decrease from 99.6% in 2019 to 2020 down to 90.6% in 2020 to 2021). This suggests that the SEISS had a positive effect in helping businesses to survive during the pandemic.
In figure 4.3 the dashed lines show projected business cessations for 2021 to 2022. These have been estimated by applying the difference observed between declared and permanent cessations that occurred in 2020 to 2021 to declared cessations reported on 2021 to 2022 tax returns. This extrapolation has been applied because it is not possible to fully assess cessations in 2021 to 2022 until 2022 to 2023 tax returns are available. This extrapolation finds there were further business closures during 2021 to 2022, but with eligible claimants still having a higher proportion of businesses continuing to trade. However, this analysis must be treated with caution as it is likely that business survival rates experienced during 2021 to 2022 as restrictions were starting to ease will not be directly comparable to the first year of the pandemic.
There was no significant variation to these results by gender or region. Comparing across age bands showed some variation with the businesses of the 65+ age group, who accounted for around 5% of SEISS claims, being least likely to continue trading. This is consistent with the early indication reported in the interim evaluation, that this group had decided to retire instead of continuing to trade during the pandemic. There was also some variation in results across sectors with the lowest business survival rate being in accommodation and food service activities, which accounts for around 2% of SEISS claims.
4.4 Business survivability counterfactual analysis
The analysis in chapter 4.3 compared the overall outcomes for different groups, although it cannot be assumed that SEISS was the driving factor. This section uses an RDD approach to assess whether SEISS had a causal effect on business cessations. The methodology is akin to that used in chapter 3 to assess the impact of SEISS on incomes. There are similar limitations to this analysis in that it is only looking at a specific subset of the SEISS population, comparing individuals close to either side of the eligibility criteria. Further details of this approach are provided in the counterfactual technical note.
The first 3 SEISS grants were found to have a positive effect on business survivability using permanent cessations. Figure 4.4 shows those assessed as potentially eligible at £50,000 average trading profits threshold were 2 percentage points (the gap between 95% and 93% at the £50,000 threshold) more likely to remain trading in 2020 to 2021 than individuals who were assessed as ineligible on this threshold. To estimate the causal impact of claiming the SEISS, the difference in the probability of claiming the SEISS around the threshold needs to be applied. This shows eligible claimants near the £50,000 cut-off were 2.8 percentage points more likely to remain trading in 2020 to 2021 than those assessed as ineligible. This result is statistically significant at the 5% level which provides a degree of confidence that the observed difference reflects the impact of the SEISS, rather than arising due to chance.
Figure 4.4 RDD output for average trading profits (between 2016 to 2017 and to 2018 to 2019) against probability of remaining self-employed in 2020 to 2021 based on permanent cessations

Source: HMRC SEISS data matched to Self Assessment taxpayer information
Sample size: Approximately 12,000 individuals
Notes: Only includes potentially eligible non-claimants and assessed as ineligible individuals if they filed at least one self-employed page on a Self Assessment return for both 2019 to 2020 and 2020 to 2021, and some outliers are removed. All individuals included were ineligible based on their 2018 to 2019 Self Assessment return alone
Table 4.4: RDD output for average trading profits (between 2016 to 2017 and 2018 to 2019) against probability of remaining self-employed in 2020 to 2021 based on permanent cessations
| Outcome variable | 2020 to 2021 business survivability based on permanent cessations with average trading profits under £50,000 - A | 2020 to 2021 business survivability based on permanent cessations with average trading profits over £50,000 - B | Difference A-B = C | Difference in probability of claiming SEISS either side of £50,000 discontinuity - D | Estimate = C/D |
|---|---|---|---|---|---|
| 20/21 probability of remaining self-employed based on permanent cessations (%) | 0.950 | 0.930 | 0.020 | 0.750 | 0.027 |
Separately, the business survival analysis was also further assessed using the RDD approach outlined in chapter 3.5, looking at the probability of remaining self-employed in 2021 to 2022 based on declared cessation dates. This analysis suggests there is no clear longer-term effect in business survivability from access to the first 3 SEISS grants although this finding is not statistically significant. This analysis also suggests a small positive impact on business survivability in the short term from the last 2 SEISS grants with SEISS claimants being 1.0 percentage point more likely to remain trading in 2021 to 2022 than non-claimants, but this finding is again not statistically significant which means that it cannot be ruled out that this difference occurred by chance. However, given the limitations of declared cessations described in chapter 4.3, this analysis should be treated with caution. Further details on this and all the counterfactual analyses are provided in the counterfactual technical note.
The lack of robust evidence on longer-term business survival does mean there is a risk that despite an initial short-term benefit from the SEISS, the scheme may not have led to long-lasting benefits to self-employed businesses. There is also the possibility that some businesses may have remained open explicitly for the purpose of claiming the SEISS and then closed shortly after the end of the scheme. This could be interpreted as a negative outcome if the scheme prevented productive re-allocation of resources and supported those who left self-employment anyway.
However, the overall rate of business survival remains high based on the trend analysis shown in chapter 4.3, with 93.6% of claimants still trading in 2021 to 2022 based on currently available data, suggesting a high rate of businesses continuing to trade. The primary goal of the SEISS was to act as an income support scheme to allow the self-employed to continue to be economically active and reduce the risk of financial harm to this population rather explicitly supporting the business. Overall, the evidence suggests the scheme was generally successful at achieving this.
4.5 Macroeconomic effects
The primary objective of the SEISS was to be an income support scheme, rather than a macroeconomic stabilisation tool. But it is likely that the SEISS produced some macroeconomic benefits. These are expected to have been smaller in magnitude than the CJRS due to the smaller number of individuals supported by SEISS. Whilst these macroeconomic benefits are difficult to quantify due to data and methodological constraints, it has been possible to provide a qualitative assessment.
The scheme is estimated to have kept around 2.8% of SEISS claimants in business in 2020 to 2021. This is equivalent to the scheme helping around 70,000 individuals remain in self-employment. Without the SEISS, it likely that many of these individuals would have become unemployed or inactive, leading to a loss in economic output compared with a scenario where the scheme did not exist.
Other businesses which would not have closed would still have suffered significantly without government support, and benefited from the increased economic activity, as a result of the SEISS and other schemes such as the CJRS. Without this additional activity the economic consequences of the pandemic are likely to have been severe and could mean that the rate of business survival is an underestimate as the counterfactual cannot discount for the role other support played in supporting the wider economy.
In addition, by increasing claimants’ incomes above the level that they otherwise would have been, the SEISS likely boosted consumer spending and self-employed business investment. These outcomes will have also supported demand in the wider economy and likely resulted in SEISS having a positive fiscal multiplier effect. The fiscal multiplier captures the additional impact of fiscal measures on economic activity beyond their immediate effect on demand. It encompasses the indirect effects of these measures as a result of increasing private incomes and spending.
The multiplier effect has 2 aspects. Firstly, those who received direct support from the SEISS will have had the benefit of increased demand for their goods or services as a result of the increased economic activity from the extra spending. Secondly, those who did not receive any direct support from the government during the pandemic will still have benefited indirectly from increased spending by others that was generated by the support schemes.
The Office for Budget Responsibility (OBR) assumed the size of the multiplier to be 15% in 2020 to 2021 for the CJRS in November 2020. This then tapers down over the rest of their forecast to a 2% benefit in 2024 to 2025, meaning £1 of direct spending initially generates 15 pence of additional economic activity falling to 2 pence over time. Given that the SEISS was a labour market intervention which also provided additional spending power to individuals, and a lack of other robust estimates, it is assumed that the multiplier for the 2 schemes will be comparable. However, there are some factors which may mean they differ, although there are theoretical reasons for either a higher or lower multiplier, including:
- SEISS grants supported the business owner directly as opposed to employees. They could use these grants to cover the fixed costs or reinvest in their business, slightly increasing the size of the fiscal multiplier relative to the CJRS
- self-employed individuals could be less risk-averse than employees, and as a consequence spend more of the money they receive through the grants to invest back into their business
- self-employed individuals are more likely to experience income volatility, as opposed to employed individuals. The SEISS grants guaranteed income for the duration of the scheme, and so recipients may have been more likely to engage in precautionary savings during this period
- as it was a direct cash transfer, SEISS recipients might have decided to work less than they would have in the absence of SEISS, as discussed in the finding of an income effect outlined in chapter 3.4. This would reduce the size of the fiscal multiplier relative to the CJRS
There is considerable uncertainty around what a true fiscal multiplier for the CJRS or the SEISS should be, due to a number of challenges:
- at the time of the OBR’s estimate (November 2020), there was uncertainty over the future path of the pandemic and the economic recovery. At that time the CJRS was announced to close in March 2021, and the third SEISS grant was expected to be the last grant. However, both schemes were then extended with the CJRS closing in September 2021 and 2 additional SEISS grants being provided in the 2021 to 2022 tax year. These factors mean the OBR’s multiplier may have under-estimated the impact of the SEISS
- the OBR’s forecast was made before the success of the vaccine rollout was known or whether it would lead to an easing of restrictions earlier than expected. In isolation, lifting restrictions earlier could impact the multiplier by increasing consumer and business confidence, reducing the need for precautionary savings and removing supply constraints from the economy by allowing businesses to trade normally
- there is a case for a ‘lagged multiplier’ effect, which is that the schemes helped the economy ‘bounce back’ after restrictions eased, and so the timeframe of the multiplier should be extended past the duration of the rollout of the SEISS grants to fully capture their impact. For example, individuals’ ability to spend the additional support was constrained by certain sectors such as restaurants or leisure centres not being open during some stages of the pandemic
The OBR’s multiplier of 15% and its subsequent tapering is used as the central estimate of the impact of the SEISS on supporting wider economic activity. However, as highlighted above, there is some uncertainty as to what the true multiplier would be for the SEISS, and so could under-estimate the true benefit of the scheme. This wider fiscal stimulus equates to a wider social benefit of the scheme as shown in table 4.5, where discount factors and the impact of inflation are also accounted for as per appendix 6 of the Green Book so that any benefits after the year in which spending takes place are adjusted accordingly. The benefits are small relative to the overall size of the economy at less than 0.1% of GDP. The SEISS was part of a wider package of government support to the economy including the CJRS and the Coronavirus Business Interruption Loan Scheme.
Table 4.5: Estimates of the multiplier effect of the SEISS
| Tax year | 20/21 | 21/22 | 22/23 | 23/24 | 24/25 | Total |
|---|---|---|---|---|---|---|
| First 3 SEISS grants multiplier (£ millions) | 2,186 | 1,986 | 1,416 | 769 | 250 | 6,607 |
| Fourth and fifth SEISS grants multiplier (£ millions) | - | 860 | 617 | 335 | 109 | 1,922 |
| Cumulative total benefit (£ millions) | 2,186 | 2,846 | 2,033 | 1,105 | 359 | 8,529 |
It should be noted that the Bank of England base rate rose from 0.1% to 0.25% in December 2021 after the SEISS had ended and has continued to rise regularly and now stands at 5% as of June 2023. Rising interest rates in response to high levels of inflation may have dampened the size of the multiplier benefit beyond the 2021 to 2022 financial year and means the benefit of the fiscal stimulus may be less due to the economic conditions. However, as most of these factors and constraints on the economy have emerged after the SEISS was designed and implemented, the overall VfM assessment continues to account for these benefits to reflect the circumstances under which the SEISS was implemented.
4.6 Newly self-employed analysis
Newly self-employed individuals, who started trading in 2019 to 2020, were only potentially eligible for the fourth and fifth grants. As these individuals were potentially unsupported by the SEISS during 2020 to 2021, they may have moved into employment, as defined by HMRC’s Real Time Information (RTI) data, as an alternative way to support themselves.
This analysis shows that despite over 400,000 self-employed individuals not being able to access the first 3 SEISS grants, the majority were able to continue trading or support themselves either by moving into employment, or already having access to this source of income. Only 30,000 individuals (7.5%) are seen to be moving out of the labour market. Broader analysis of the labour market flows across the whole population during the pandemic showed that across the lifetime of the SEISS, there was an increase in the flow of self-employed individuals leaving employment relative to the years prior.
This analysis showed that the flows increased from 276,000 individuals in 2018 to 2019 to 347,000 in 2019 to 2020 (26% increase) and to 384,000 individuals in 2020 to 2021 (39% increase from 2018 to 2019). This means this behaviour is not isolated to just the newly self-employed and is considerably lower than the trend for the total self-employed population. This analysis also does not account for other types of support that may have been accessed.
Figure 4.5: Newly self-employed movement to PAYE employment

Source: HMRC Self Assessment taxpayer information matched to RTI data
Sample size: Approximately 410,000 individuals
Notes: Only includes self-employed individuals who were assessed for SEISS eligibility based on their 2019 to 2020 Self Assessment return but not their 2018 to 2019 return
Table 4.6: Newly self-employed movement to PAYE employment
| Number of newly self-employed movements | Apr 2020 - Jun 2020 | Jul 2020 - Sept 2020 | Oct 2020 - Dec 2020 | Jan 2021 - Mar 2021 | Apr 2021 - Jun 2021 | Jul 2021 - Sept 2021 | Oct 2021 - Dec 2021 | Jan 2022 - Mar 2022 |
|---|---|---|---|---|---|---|---|---|
| Moved out of PAYE | 20,000 | 25,000 | 30,000 | 30,000 | 30,000 | 35,000 | 35,000 | 35,000 |
| Moved into PAYE | 15,000 | 25,000 | 35,000 | 45,000 | 50,000 | 55,000 | 60,000 | 65,000 |
| Remained in PAYE | 100,000 | 95,000 | 90,000 | 90,000 | 90,000 | 85,000 | 85,000 | 85,000 |
| Remained out of PAYE | 275,000 | 265,000 | 255,000 | 250,000 | 240,000 | 235,000 | 230,000 | 225,000 |
Table 4.7: Cumulative movement of the newly self-employed movement to PAYE employment between the first and last quarter
| Cumulative proportion of the population | Apr 2020 - Jun 2020 | Jan 2022 - Mar 2022 |
|---|---|---|
| Moved out of RTI | 4% | 9% |
| Moved into RTI | 4% | 16% |
| Remained in RTI | 25% | 21% |
| Remained out of RTI | 67% | 55% |
Figure 4.5 shows the movements of the newly self-employed population into PAYE employment.
- around 85,000 (20%) are already in employment at the start of the pandemic and therefore may have received income support from alternative sources (such as the CJRS)
- by the final quarter of 2021 to 2022, 65,000 individuals (16%) had moved into employment. The reasons for individuals moving to employment are unclear. It may be the case that self-employed individuals were shutting down their business and gaining employment in another company due to the wage stability this offered relative to self-employment which may be seen as riskier. They may possibly have received support from the CJRS once the eligibility criteria were extended
- 225,000 individuals (55%) did not move into employment during 2020 to 2021 and therefore were not eligible for either the CJRS or the SEISS, though may have received other government support
- of this group that were not eligible for the SEISS and the CJRS, 205,000 individuals consistently filed Self Assessment returns, and 20,000 individuals can be seen as moving out of the labour market
- the remaining 35,000 (9%) moved out of PAYE employment, but as they would have been in employment when the pandemic began, may have been eligible for support from the CJRS before they left employment
- of this 35,000, 25,000 consistently filed Self Assessment returns
- the remaining 10,000 can be seen as moving out of the labour market
To provide further context for this group, a split by sector has been provided, with a focus on the proportion of individuals moving to employment out of those that were not in PAYE employment before the pandemic. These sectors are as defined by Self Assessment data and do not necessarily reflect the sector an individual would have joined from moving into PAYE employment.
Figure 4.6: Movement of 2019 to 2020 newly self-employed into PAYE employment by sector

Source: HMRC Self Assessment taxpayer information matched to RTI
Sample size: Approximately 160,000 individuals
Notes: Only includes self-employed individuals who were assessed for SEISS eligibility based on their 2019 to 2020 Self Assessment return but not their 2018 to 2019 return
Table 4.8: Movement of 2019 to 2020 newly self-employed into PAYE employment by sector
| Proportion of sector not in RTI pre-pandemic who move into RTI | Apr 2020 - Jun 2020 | Jul 2020 - Sept 2020 | Oct 2020 - Dec 2020 | Jan 2021 - Mar 2021 | Apr 2021 - Jun 2021 | Jul 2021 - Sept 2021 | Oct 2021 - Dec 2021 | Jan 2022 - Mar 2022 |
|---|---|---|---|---|---|---|---|---|
| Other service activities | 4% | 7% | 9% | 12% | 13% | 15% | 16% | 18% |
| Construction | 5% | 8% | 10% | 12% | 14% | 16% | 17% | 18% |
| Transportation and storage | 5% | 9% | 12% | 14% | 17% | 18% | 19% | 20% |
| Wholesale and retail trade | 5% | 8% | 12% | 14% | 17% | 20% | 22% | 23% |
| Human health and social work activities | 7% | 11% | 14% | 17% | 20% | 22% | 24% | 26% |
| Arts, entertainment and recreation | 7% | 14% | 19% | 21% | 25% | 26% | 27% | 29% |
Figure 4.6 shows the proportion of newly self-employed individuals moving into employment, split by sector. This shows that arts, entertainment and recreation and human health and social work activities, the sectors most consistently affected by the pandemic, had the largest shifts into employment.
4.7 Self-employment support in other countries
The SEISS was an unprecedented policy intervention for self-employed people within the UK to support them through COVID-19. The scale of the economic disruption caused by the pandemic led many other countries to take similar steps to the UK to offer direct support to the self-employed population. Often, an aim was to ensure that they did not lose out relative to employees who were able to access job retention or other employment based support schemes.
Evidence on the impact and value of other self-employed support schemes during the COVID-19 pandemic is limited, with detailed evaluations generally not available. However, there are some comparisons that can be made with the design of self-employed support schemes in other countries. This is not an extensive list of all countries that have similar schemes, and it is worth noting that there were many varying factors between other economies, for example the severity of COVID-19 impact and the level of restrictions put in place.
Many support schemes in other countries required claimants to have lost income or reduced ability to trade as a result of the COVID-19 pandemic, similar to the UK’s RBT, and the later introduction of the FID. France, Germany, Denmark, Portugal and Australia all had similar eligibility requirements around how much an individual’s business was impacted by COVID-19. Denmark for example, required a loss of turnover of 30%, whereas Portugal required 40% and France 50%.
Australia’s eligibility was split into 3 bands based on hours of work lost due to COVID-19, rather than a reduction in turnover. Generosity of these schemes varied compared to the SEISS, but all were designed such that those more impacted would receive higher grants. In monetary value terms, France, Australia and Portugal offered per month around half of the maximum SEISS grants, whereas Germany offered a maximum of slightly less, and Denmark offered slightly more.
Other countries such as Spain, the Netherlands, Canada and the USA offered self-employed income support through a relaxing of the eligibility for unemployment benefits. This involved topping up incomes, based on the minimum wage, up to a maximum limit. Canada and the USA also offered flat rate grants as well as support via unemployment benefits. In the case of the USA, this was done in tandem, whereas Canada initially introduced a flat rate grant before offering support through unemployment benefits.
New Zealand similarly offered a flat rate grant for both employed and self-employed individuals, and this was the only support offered. Where countries provided a flat rate grant, these were often less generous than the SEISS. No other country that HMRC is aware of has published an estimate of the rate of error and fraud in their self-employed income support, so it cannot be determined whether the use of turnover tests and other eligibility criteria in those schemes increased the rates of error or fraud. However, in many countries, such as Denmark, the turnover test was based on self-declaration and so it may be expected that this increased the risk of error and fraud within their scheme.
While difficult to determine the exact length, due to various policy or name changes being subsequently announced, a broad comparison of the duration of these schemes can still be made. The self-employed support offered in other countries generally lasted for a similar duration to that made available in the UK. Even though there were differing regularity of payments, most other countries started their income support schemes around a similar time (between March 2020 and May 2020) and finished around a similar time (between June 2021 and December 2021). Notably, France, Germany, Canada and the Netherlands provided self-employed income support over a similar timeframe to the SEISS. Australia, New Zealand and Portugal provided support over a shorter period than the SEISS and the USA longer.
HMRC and HMT will continue to monitor any similar evaluations of COVID-19 income support schemes in other countries. At the time of writing this evaluation, there are none that HMRC or HMT are aware of.
Chapter 5: Assessing the value for money of the SEISS
5.1 Methodology and overall assessment
This chapter assesses the overall VfM of the SEISS and the extent to which it achieved its objectives.
To appraise the VfM of the SEISS, the evaluation uses 2 alternative approaches: i) social value – the scheme’s value to society, which considers its overall effect on public welfare and is the primary methodology set out in the Green Book for appraising government policies, and ii) exchequer value – the scheme’s direct effect on the public finances.
A major difference between the social value and the exchequer value is how they treat the transfer of resources from the government to individuals and organisations. Following the Green Book guidance set out in section 6.3 , the SEISS payments are treated as a transfer of resources between groups but do not create or destroy resources and does not make society as a whole better or worse off. Therefore, the scheme transfer payments are not treated as full costs when determining the Net Present Social Value of the SEISS, but they are fully taken into account when determining the exchequer impacts and exchequer value of the SEISS.
Where feasible and sufficiently analytically robust, the costs and benefits of the scheme have been quantified, with ranges of uncertainty, caveats and limitations clearly stated. However, it has not been possible to quantify all costs and benefits of the SEISS. The evaluation highlights the possible impact of these additional qualitative benefits and costs and discusses how they might impact the overall assessment. However, they are not included in the final estimate of the costs and benefits of the scheme.
Overall, the SEISS represented good VfM. The scheme is estimated to have provided social benefits of £19.3 billion at a social cost of around £5.1 billion. The social costs and benefits represent the broad consequences of the SEISS, through the positive outcomes it achieved for the economy during the pandemic and the opportunity cost of the scheme or any negative consequences that may have occurred. This provides the best comparison for establishing an overall VfM assessment of the scheme.
For comparison, the exchequer cost of the scheme (the cost to the government of providing this support), is estimated at £19.5 billion once accounting for the impact of additional UC payments that would have occurred in the absence of the scheme, and the increase in tax revenue that resulted from supporting economic activity during the pandemic.
The primary benefits of the SEISS are identified as:
-
the scheme was well targeted at individuals with lower incomes and provided support to those likely to have been impacted by the pandemic. Supporting those on lower incomes has a welfare benefit to society
-
the scheme reduced the slowdown in economic activity during the pandemic by continuing to support demand and helped the economy recover more quickly after restrictions were removed
-
the scheme encouraged self-employed individuals to continue their trade and remain economically active where possible
The scheme had some social costs including:
-
some claims were made fraudulently or paid out in error which did not contribute to the scheme achieving its objectives but did add to the exchequer cost of the scheme
-
some payments, though claimed legitimately, did not contribute to the scheme achieving its aims and may be interpreted as deadweight
-
significant increases in exchequer spending. Future tax rises may be distortionary in nature and thus create a cost to society beyond simply transferring resources between individuals and government
This assessment follows best practice as set out in the principles for assessing VfM by the National Audit Office (NAO) in assessing the scheme against the 4 following metrics, known as the ‘4 Es’. This is a well-established basis for conducting VfM assessments:
-
Effectiveness – the outcomes achieved by the scheme and the extent to which they matched the scheme’s objectives. This includes supporting individuals and businesses and contributing to economic recovery
-
Equity and equality – the extent to which the scheme reached everyone it was intended to and whether this was delivered in a fair and equal way. This includes the progressivity of the policy, as well as an assessment of support according to protected characteristics
-
Economy and costs – the cost of the scheme and the resources used to achieve these objectives. This includes the scheme’s delivery and implementation costs, as well as how much was paid out directly to claimants
-
Efficiency – the relationship between the 3 factors above, meaning the extent to which resources were well targeted in achieving the objectives of the SEISS and not wasted. This includes an assessment of deadweight within the scheme and the levels of error and fraud
Table 5.1: Quantified VfM of the SEISS
| Social value, £ billions | Exchequer value, £ billions | |
|---|---|---|
| Effectiveness | 8.8 | 3.0 |
| Equity | 10.5 | N/A |
| Total benefits | 19.3 | 3.0 |
| Economy and costs | -3.9 | -22.4 |
| Efficiency | -1.2 | -4.1 (included within economy) |
| Total cost | -5.1 | -22.5 |
| Net Present Value | 14.2 | -19.5 |
5.2 Effectiveness
The key objective of the SEISS was to support self-employed individuals (including members of partnerships) whose self-employment activities had been adversely affected by COVID-19. Additional objectives were to:
- quickly support individuals most reliant on their self-employment income who would otherwise have lost out financially due to the COVID-19 pandemic
- enable self-employed people to remain in business
- minimise the risk of error and fraud
- provide support broadly equivalent to the CJRS
As shown in the trading profits analysis (chapter 3.3), the SEISS was well targeted at those who most needed support. Evidence from Self Assessment returns demonstrated that claimants of the SEISS were more impacted by the pandemic on average than those assessed as ineligible and potentially eligible non-claimants.
Additionally, as shown in the interim evaluation, the scheme was rolled out quickly, and over 99% of claims were paid within the government’s target of 6 working days. Support was delivered to recipients in a timely and efficient manner, providing support, stability, and certainty during an unprecedented economic shock.
The effectiveness of the scheme is defined by the social benefits it created by meeting these objectives. The main benefits of the scheme are identified below:
-
the benefit of keeping individuals in self-employment, preventing periods of unemployment or economic inactivity
-
some self-employed individuals will also act as employers, and so this benefit of preventing unemployment or inactivity can be extended to their employees who may have lost their job had the business owners not been supported. Similarly, there may also be an impact on supply chains from businesses closing
-
maintaining household incomes and thus supporting consumption and aggregate demand
5.2.1 Keeping individuals in self-employment
As outlined in chapter 4.5 the SEISS is estimated to have kept 2.8% of self-employed individuals in business as a result of receiving the first 3 grants, equivalent to around 70,000 self-employed individuals. Preventing these individuals from ceasing to trade avoided a likely period of either inactivity or unemployment and unnecessary costs and losses associated with shutting down and restarting a business, with the associated risk of long-term economic scarring. The SEISS not only kept businesses open but meant that economic activity and trading profits could still be generated even if they were lower than normal (as shown in chapter 3.3) rather than declining to zero as the business closed.
Using further evidence from analysis in chapter 4.6, 10,000 (34%) of the total 35,000 newly self-employed who did not file a 2020 to 2021 Self Assessment return and were not already in RTI, moved into employment by the end of 2021 to 2022, leaving 25,000 (66%) at risk of not being employed. This may over-state the size of the flow to employment given this occurs over a 2-year timeframe, but does constitute a reasonable lower bound estimate for this analysis. HMRC have analysed the Department for Work and Pensions’ (DWP) data which estimates that on average these individuals would have been out of the labour market for between 6 and 9 months leading to lost economic output. Although this is based specifically on unemployment data, it is taken as a reasonable proxy for the length of time during which economic activity would be lost.
The value of economic output preserved as a result of keeping individuals in self-employment is therefore a social benefit of between £200 million and £440 million based on average trading profits depending on the size of the flow to employment and the length of time out of the labour market. Different assumptions have been tested to ensure the robustness of this assessment, and a central estimate of £297 million based on trading profits is used for the overall VfM calculation.
This analysis only covers the first 3 SEISS grants due to limitations in the business cessation data described in chapter 4.3 of this evaluation. It is possible that there was an additional economic benefit from the fourth and fifth grant in the same regard although it would be expected to be of a smaller magnitude. However, as there is no way to quantify this robustly based on currently available data it has not been included here, meaning the overall VfM assessment may be an under-estimate of the value of the scheme.
5.2.2 Employees of self-employed businesses
A small proportion of self-employed businesses will also act as employers of additional staff. The SEISS grants were paid to the owners of self-employed businesses but may have also indirectly supported the employees of this business if they allowed the business to continue trading. However, the impact of this is harder to estimate as:
- it is likely that many individuals who were indirectly supported by the SEISS in this manner may also have been eligible to be on furlough through the CJRS, risking double counting the benefit
- where the individual was not eligible for CJRS support, they may have continued to be employed unless the overall business was at risk of being closed
Only a small proportion of self-employed traders are estimated to have labour costs - estimated at around 270,000 of the 4.4 million sole traders in 2020 to 2021. The average amount paid out on staff costs where these costs are non-zero is around £32,000 for 2020 to 2021, and around £20,000 for 2021 to 2022. Given that the proportion of businesses at risk of closing without the SEISS is estimated at 2.8% and only a small proportion of these are estimated to have staffing costs, it is likely that there was only a small benefit from the SEISS of preventing lost economic activity by allowing self-employed business to continue employing staff. The benefit is uncertain and difficult to distinguish from the benefits of the CJRS, and so is not included in the overall VfM assessment.
5.2.3 Supporting demand
In addition to directly supporting individuals who claimed the grant, the SEISS will have provided a wider fiscal stimulus. By supporting incomes, individuals were able to spend more than they otherwise would have done or invest more into their own business. This in turn provides an additional level of support to the economy.
This indirect benefit of increased economic activity is captured by the multiplier effect set out in chapter 4.5, with a total value of £8.5 billion in increased economic activity spread across the forecast period, tapering down to zero in the long term but providing a substantial short-term benefit to economic activity.
5.3 Equity and equality
Equity and redistribution were not an explicit goal of the SEISS, but as highlighted above it can still be considered part of the scheme’s value. The SEISS was designed to target those most in need of support via the income and trading eligibility criteria and the maximum payments were restricted (see table 1.2 for scheme details). Being able to demonstrate that these targeting measures were effective in supporting the intended population rather than high-income individuals with other means of support, should therefore be considered an important aspect of the VfM assessment.
5.3.1 Equity benefits
As discussed, the scheme provided important wellbeing benefits to recipients, and these are magnified for lower income individuals. The Green Book highlights that marginal utility of income is higher for a low-income recipient of additional income, meaning additional benefits are valued more by lower income individuals. The Organisation for Economic Co-operation and Development (OECD) also highlights reductions in income inequality as a worthwhile outcome as widening income inequality can adversely affect economic growth. The SEISS also provided equivalence with the CJRS by ensuring that the self-employed could also access support during the pandemic.
To quantify the benefits of equitable outcomes, it is necessary to estimate the marginal utility of income (the value of an extra pound of income to an individual). This increases as income levels decrease. For example, an additional £1 is worth more to someone on income of £20,000 than £40,000. The Green Book recommends using a factor of 1.3 for this analysis as a best estimate of the marginal utility of income. Consequently, the difference in total income between the median SEISS recipient compared to the median taxpayer overall, is weighted by 1.3 to reflect the positive welfare benefits of supporting those on lower incomes.
Applying this approach gives estimated redistributive benefits of £7.9 billion for the first 3 SEISS grants and £2.6 billion for the fourth and fifth grants in 2021 to 2022. These values are incorporated into the overall social benefit of the scheme.
5.3.2 Equivalence with the CJRS
The SEISS was designed to provide broadly equivalent support as the CJRS. Most SEISS grants were worth 80% of an individual’s average monthly trading profits, approximately equivalent to the CJRS which was worth 80% of usual wages. The second SEISS grant was worth 70% of average monthly trading profits and the fifth grant introduced a FID whereby some individuals who had been less impacted by the pandemic received a grant worth 30% of an individual’s average trading profits. These 2 grants broadly coincided with periods in which government support from the CJRS was tapered by the introduction of employer contributions.
The average claim for the first 3 SEISS grants was £2,900 or around £970 per month as the grant covered 3 months’ average trading profits. The average claim per CJRS employment in April, May and June 2020 was estimated at between £1,100 and £1,200 per month. These periods represented the highest usage of the CJRS where most employments that claimed the scheme were on furlough for the full month. This was also before flexible furlough was introduced, where individuals could undertake some work and only receive support from the CJRS for hours not worked, and so individuals were receiving support to cover their full hours.
Consequently, the SEISS does not appear more generous than the CJRS on a per month basis. However, the average employment was on furlough for just over 7 months, whereas the average SEISS claimant claimed 3.6 out of the 5 SEISS grants, equivalent to around 11 months’ worth of support. Additionally, the SEISS was delivered as lump sum grants whereas the CJRS only covered hours not worked, and so flexible furlough meant that individuals would not have been on furlough for every day of their furlough duration. Consequently, the average SEISS claimant received support worth £9,700, whereas the average employment on furlough received support of around £5,900.
The SEISS therefore appears to have paid out more per individual than the CJRS per employment due to being claimed more regularly and paid as lump sums, but the SEISS met the objective of being approximately similar to the CJRS in terms of support given on a monthly basis.
No explicit benefit is quantified from this equivalence between the SEISS and the CJRS for purposes of the VfM assessment. However, the self-employed were able to access similar support on a per month basis to employees during the pandemic meaning that one population was not unfairly disadvantaged over the other. It is worth noting that there are also significant differences to the scheme rules. To ensure that economic activity continued, SEISS claimants were able to continue to work, whereas the CJRS grant covered wages for hours not worked.
5.3.3 Equalities impact of the SEISS
Although not quantified in the overall VfM assessment, this evaluation also reviewed the impact of the SEISS on protected characteristics. The protected characteristics HMRC routinely collects data on are age and sex, both of which have been examined extensively in official statistics published on the scheme.
The analysis in this section focuses primarily on the additional protected characteristics of disability and ethnicity, as limitations on data quality prevent robust analysis of other characteristics. This section also analyses take-up rates in geographic areas ranked by their income deprivation.
The evidence suggests that there are no statistically significant differences in usage of the scheme by disability status, illustrated by the confidence intervals in figure 5.1 where disability status is defined by the 2010 Equality Act.
Figure 5.1: Usage rate of the SEISS for disabled and not disabled individuals
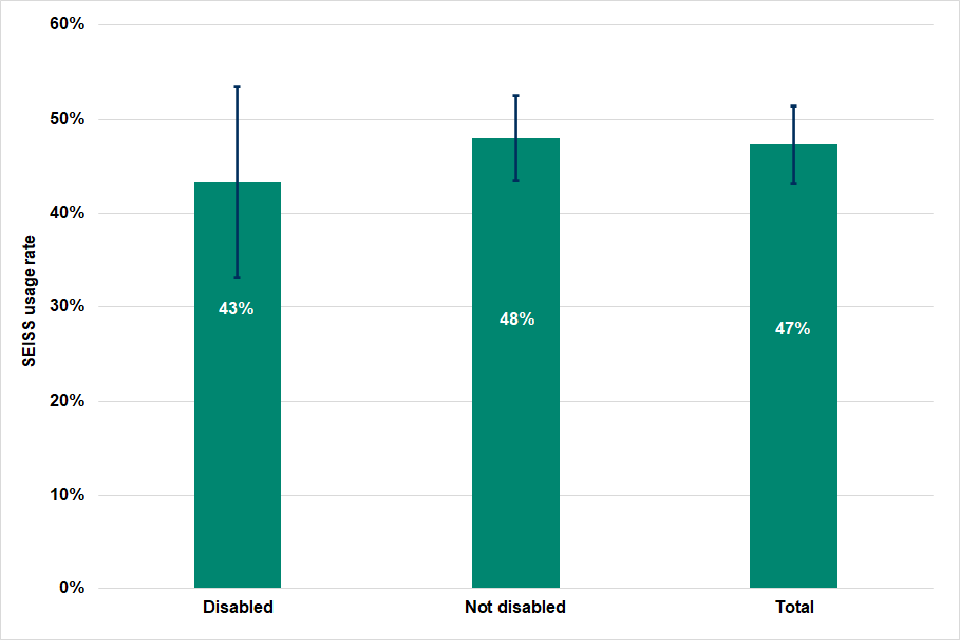
Source: Family Resources Survey (FRS) for 2020 to 2021
Sample size: 152 disabled individuals and 796 non-disabled individuals, weighted to reflect the characteristics of the population as a whole
Notes: Uncertainty ranges based on the first method in the published guidance document
Table 5.2: Usage rate of the SEISS for disabled and not disabled individuals
| Disability category | Usage rate (%) | Upper bound (%) | Lower bound (%) |
|---|---|---|---|
| Disabled | 43 | 53 | 33 |
| Not disabled | 48 | 52 | 43 |
| Total | 47 | 51 | 53 |
A different method to the above analysis is used to assess take-up rates of the SEISS in geographic clusters based on postcode, known as Lower layer Super Output Areas (LSOAs), with these areas ranked by income deprivation. Each LSOA has around 1,500 residents. The analysis uses data on the Indices of Multiple Deprivation (IMD) for England from 2019, with LSOAs being placed into deciles based on their IMD rank, with each decile representing 10% of LSOAs. The first decile represents the most deprived 10% of the country, whereas the 10th decile represents the least deprived 10%. The IMD is calculated using various domains of deprivation (such as crime and income) to feed into an overall score for a particular LSOA. Analysis of the IMD is not possible using the FRS, and sample size limitations also mean that the FRS is not appropriate for analysis by ethnic group, so this is also done by the LSOA method. The findings are presented in figure 5.2 for LSOAs in England.
The analysis cross-references this data on IMD with HMRC data on take-up rates of the SEISS grants within LSOAs. It shows that take-up of the grants is positively correlated with the level of income deprivation in a particular LSOA. Generally, across all UK nations, the more income deprived an LSOA is, the more likely it is for that LSOA to have a higher SEISS take-up rate. Ineligibility rates tended to increase for less deprived areas, such that the more deprived LSOAs generally had the lowest rate of those assessed as ineligible across all grants. Furthermore, more deprived LSOAs formed a larger proportion of the total recipient population over time. This could suggest that grants were better targeted over time as new criteria such as the RBT and FID were introduced but may also be impacted by other factors such as different patterns of economic recovery.
Figure 5.2: Aggregate take-up of the SEISS grants by the IMD decile of LSOAs in England

Source: HMRC data on SEISS recipients matched to IMD data by LSOA
Sample size: All SEISS claimants grouped into 32,844 LSOAs across England, with an average population of 1,500 per LSOA
Notes: Data used is aggregated by geographic clusters, and so we cannot infer individual behaviour
Table 5.3: Aggregate take-up of the SEISS grants by the IMD decile of LSOAs in England
| SEISS grant - IMD decile | SEISS 1 (%) | SEISS 2 (%) | SEISS 3 (%) | SEISS 4 (%) | SEISS 5 (%) |
|---|---|---|---|---|---|
| 1st decile | 77 | 73 | 70 | 66 | 46 |
| 2nd decile | 78 | 72 | 69 | 64 | 45 |
| 3rd decile | 77 | 71 | 68 | 62 | 43 |
| 4th decile | 77 | 70 | 66 | 60 | 39 |
| 5th decile | 76 | 69 | 65 | 58 | 37 |
| 6th decile | 76 | 68 | 64 | 56 | 35 |
| 7th decile | 76 | 68 | 63 | 55 | 34 |
| 8th decile | 76 | 68 | 63 | 55 | 33 |
| 9th decile | 75 | 67 | 62 | 54 | 32 |
| 10th decile | 75 | 66 | 60 | 52 | 31 |
Analysis shows that in LSOAs across England where ethnic minorities are a larger proportion of the total population, there tends to be a higher take-up rate of the SEISS. Figure 5.3 shows this analysis for the proportion of the population that is of an ethnic minority. In the chart each dot represents an English LSOA. The positive correlation between the proportion of the LSOA’s population that is of an ethnic minority and the take-up of the scheme is shown as a line of best fit. The same positive correlation was found in the analysis of ethnic minority groups such as the black or Asian population, while the inverse is seen for the white population. This trend is also seen when analysing LSOAs in other UK nations and across all 5 grants.
As this data is at the geographic cluster level, it does not capture individual behaviour and may not fully account for differences in how COVID-19 may have impacted the different populations and other geographic characteristics. It highlights an overall trend but does not prove a causal relationship between ethnicity and take-up rates of the SEISS, and it should be noted that there is a strong correlation between ethnic minority groups and lower incomes as shown in the latest Ethnicity facts and figures. Nevertheless, based on the evidence available here there is no evidence of minority ethnic groups being less able to access support through the SEISS.
Figure 5.3: Correlation between take-up rate of the third SEISS grant and percentage of total population that is ethnic minority by LSOAs in England

Source: HMRC data on SEISS recipients matched to census data on ethnicity by LSOA in England
Sample size: All SEISS claimants grouped into 32,844 LSOAs across England, with an average population of 1,500 per LSOA
Notes: Data used is aggregated by geographic clusters, and so individual behaviour cannot be inferred
Table 5.4: Correlation between take-up rate of the third SEISS grant and % of total population that is ethnic minority by LSOAs in England
| Intercept | Gradient | Endpoint |
|---|---|---|
| 0.626 | 0.14 | 0.766 |
The UK Statistics Authority published in 2021 the Inclusive Data Taskforce Recommendations Report, which provided recommendations for how to improve the inclusivity of UK data and evidence. In response to recommendation 3.2 on the representativeness of key surveys and administrative datasets, HMRC made a commitment to evaluate its approach to protected characteristics data collection, including an assessment of the feasibility of collecting additional demographic information that is not currently routinely collected. The first annual report details the progress made on this commitment and the other commitments made by HMRC and across government.
5.4 Economy and costs
The economy element of measuring VfM considers the cost of the scheme. This goes beyond the gross spend on the scheme. The Green Book emphasises that economic appraisal should be done relative to the Business as Usual (BAU) option, and so should account for how the Exchequer would have been impacted had the SEISS not been made available. This means the value saved in potential UC payments is incorporated into the cost of the scheme.
Additionally, for a comprehensive VfM assessment, other costs have been considered including the cost to HMRC of delivering the scheme (for example the cost of additional staffing or IT infrastructure), the cost of increased government debt and cost of servicing this, and the additional tax revenue from increased economic activity supported by the pandemic.
5.4.1 Direct exchequer cost of the scheme
In March 2022, the OBR published its estimate of the net cost of the SEISS. The total value of grants paid was £28.1 billion, but accounting for the estimated rate of NICs and Income Tax paid on this reduces the net cost of the scheme to £24 billion. At the March 2023 Spring Budget, HMRC revised this estimate down to £23.9 billion due to a slightly higher rate of Income Tax paid on the fourth and fifth grants than initially projected. The gross and net cost of each grant is shown in the table below:
Table 5.5: Gross and net cost of the SEISS
| Grant | Gross cost (£ millions) | Income Tax (£ millions) | NICs (£ millions) | Net cost (£ millions) |
|---|---|---|---|---|
| First grant | -7,590 | 775 | 390 | -6,425 |
| Second grant | -5,930 | 595 | 305 | -5,030 |
| Third grant | -6,220 | 605 | 315 | -5,295 |
| Fourth grant | -5,520 | 540 | 290 | -4,690 |
| Fifth grant | -2,850 | 230 | 130 | -2,485 |
| Total | -28,105 | 2,750 | 1,430 | -23,925 |
5.4.2 Administrative costs of the SEISS
The administrative costs of the SEISS is estimated at £76 million, of which £57 million relates to the 2020 to 2021 tax year and the remaining £19 million relates to 2021 to 2022. This covers staffing and IT costs, capital spending and other expenditure required to deliver the scheme. The opportunity cost, meaning the cost of delivering the scheme that could have been spent on alternative government policies or programmes, is defined as a social cost as well as an exchequer cost.
5.4.3 Compliance yield recoveries
HMRC has recovered £246.5 million through the Taxpayer Protection Taskforce in incorrectly claimed SEISS grants, plus £15.9 million prior to the taskforce being established. A further £51 million has been recovered through voluntary repayments and unprompted disclosures. These figures are also netted off the cost outlined in chapter 5.4.1. This differs from the £466 million referenced in chapter 2 as this includes prevention of grants being paid to those assessed as ineligible as well as recoveries, but prevention does not impact the net cost of the scheme as it is already excluded from the gross cost.
5.4.4 UC savings
Had the SEISS not existed, there would have likely been an increase in individuals claiming welfare support from DWP through UC. In the case of the SEISS, this would occur both from individuals closing their business and becoming unemployed, and secondly from individuals keeping their business open but earning sufficiently low trading profits that they were eligible to also receive support from UC or receive more support if they were already eligible.
Analysis produced by DWP provides an estimate of these savings. As discussed in chapter 4.5, it is estimated that around 70,000 additional individuals remained in self-employment. SEISS claimants who would have left self-employment or closed their business had they not received SEISS were likely to have become unemployed due to the economic restrictions in place. Using data provided by DWP on average claim amounts and take-up derived from a survey-based model, the additional saving is estimated to be between £85 million and £320 million. The overall VfM calculation uses a central estimate of £130 million.
There is also an additional Income Tax and NICs saving as a result of keeping these individuals in business. Without the SEISS these individuals were likely to have been unemployed or economically inactive and thus not paid any tax on their business income. HMRC cannot identify for certain when within the tax year individuals would have ceased trading, but assuming this is evenly distributed throughout the tax year, so that each business on average would not have traded for 6 months, the additional tax revenue from allowing this trade to continue is estimated at between £30 million and £45 million. The lower of these figures is used in the final calculation.
Additionally, DWP have provided an estimate of how much more may have been paid out to new UC claimants who remained in self-employment, but would have had lower incomes without the SEISS, and those who were already claiming UC but eligible to a higher amount. This is estimated at around £1.46 billion for the first to third SEISS grants and £240 million for the fourth and fifth grants.
As well as the direct saving of reduced exchequer costs through less spending on UC, the government will also have benefited from reduced administrative costs due to having to process fewer UC claims as individuals were receiving support from the SEISS instead. However, there is not a robust method to quantify this, and it is expected to be small relative to the overall costs and benefits of the scheme, and so this is not included in the VfM assessment.
5.4.5 Indirect impacts on the Exchequer
As highlighted in the Effectiveness section in chapter 5.3, there was an increase in economic activity across the whole economy beyond the direct impact on the recipients of SEISS grants. This increased economic activity leads to increased tax revenue for the government due to higher incomes or profits for businesses, and increased VAT receipts and other indirect taxes depending on how the spending is used.
The UK’s tax to GDP ratio was estimated at 33.5% by the OECD for 2020 to 2021. This measure captures the range of different ways in which increased economic activity may return to the government rather than looking at specific tax rates. This creates additional tax revenues of around £2.2 billion for the first 3 SEISS grants and £640 million for the fourth and fifth grants. This is also netted off the cost of the scheme to more accurately reflect its true impact on the Exchequer.
5.4.6 Cost of increased government debt and social cost of exchequer finance
Established guidance set out in section 5.4 of the Green Book does not recommend accounting for the increase in government debt and the cost of servicing this as government spending is normally set out and accounted for at fiscal events, with individual policy decisions made within a fixed fiscal envelope. However, as the SEISS created a significant increase in government borrowing that was not initially part of the government’s spending plans, it has been included in this case as it creates an additional cost to the Exchequer in the form of debt interest.
Additional borrowing can lead to a higher cost of servicing government debt, as well as a future reduction in other public spending, or an increase in tax to reduce the debt. Increased government debt and tax rises simply represents a transfer between present and future taxpayers and therefore are not a social cost. The OBR’s March 2020 Economic and Fiscal Outlook supplementary fiscal tables: expenditure suggested that at this time increasing national debt by £5 billion would cost around £0.1 billion within the 2020 to 2021 tax year. This is a simplified (and conservative) estimate factored into the exchequer costs, given the difficulty of estimating debt-servicing costs for a specific in-year period. Scaling this to the cost of the SEISS creates an additional exchequer cost of around £0.4 billion.
For the social value calculation, there is also a cost to society of raising additional funds. All increases in government spending are financed by either borrowing, taxation or reduced spending elsewhere. Theory suggests a reduction in economic efficiency will arise from the transfer of resources from the private to public sector. DWP’s social cost-benefit analysis framework calls this the Social Cost of Exchequer Finance and estimates this at 20%, therefore for every £1 raised, the economy is supressed by 20 pence. Applying this to the net exchequer cost (minus the error and fraud and deadweight components calculated below), as estimated in section 5.5.1, creates an increase in social costs of the SEISS of around £2.5 billion for the first 3 SEISS grants and £1.2 billion for the fourth and fifth grants.
5.5 Efficiency of the scheme
The efficiency of the SEISS is defined by how well it met its objectives, or whether similar results could have been achieved while reducing the cost of providing support to both the Exchequer and society.
This is measured in 2 ways:
- error and fraud: non-compliant claims do not contribute to the scheme achieving its objectives yet increase the cost to the Exchequer
- deadweight: can be thought of as the proportion of spend allocated to delivering desired outcomes that would have happened even in the absence of the policy intervention. In the circumstances of an unprecedented pandemic, what would have happened in the absence of the intervention is a difficult concept to measure
An estimate of error and fraud is included in the VfM assessment as a social cost of the scheme. Conceptually, both deadweight and error and fraud are transfers and so would not ordinarily be included as social costs as per the Green Book. However, grants that were claimed in error or fraudulently may not have been used for socially beneficial activities and could have negative consequences, meaning they are included in the NPV as social costs.
Deadweight payments represent spend that may not have contributed to the objective of the SEISS, but do not necessarily have a social cost either. Deadweight payments increase the exchequer cost of the scheme and add to the social cost of exchequer finance without necessarily creating benefits, but they do not add to the social costs directly.
5.5.1 Error and fraud
For 2020 to 2021, HMRC’s most likely estimate of error and fraud in the SEISS was £629 million equivalent to 3.2%, with a range between 2.8% and 3.5%. This equates to between £560 million and £699 million. For 2021 to 2022, the most likely estimate of error and fraud in the SEISS was higher at £843 million (10.1%) with a range between 7.5% and 12.9%. This equates to between £629 million and £1,078 million. Net of Income Tax and NICs, the values applied in the VfM calculation are £530 million for the first 3 grants, and £717 million for the fourth and fifth.
As highlighted in chapter 2, these figures compare favourably to HMRC’s overall estimate of the tax gap. Consequently, although these values still represent negative VfM for the SEISS, the fact that the SEISS error and fraud estimates are below the tax gap estimates for this population shows the scheme succeeded in minimising error and fraud.
5.5.2 Deadweight
For the VfM study to be comprehensive, it is important to acknowledge where costs arose that did not directly contribute to its objectives. The objectives of the SEISS are set out in chapter 5.2 of this evaluation. Like the CJRS, the SEISS will have had wider macroeconomic benefits beyond the direct impact to the individuals who received it, though these are expected to have been smaller in magnitude than the CJRS due to the smaller number of individuals supported by the SEISS. Consequently, even payments that went to those who were less in need of income support or at lower risk of closing their business will have contributed to the success of the SEISS by helping to stimulate additional macroeconomic activity. The discussion below may therefore over-estimate deadweight by failing to account for the wider benefits of the scheme. Without the SEISS and the CJRS, the economy may have suffered further from additional income losses and business closures. Additionally, providing support in a timely manner will have had a positive impact on business confidence and stability.
Every policy intervention of this type will contain some element of deadweight. At the time the SEISS was introduced there was uncertainty with regard to the path of the COVID-19 pandemic and how the economy would be impacted, and while that lessened over time it remained until the scheme closed in September 2021. The SEISS was deliberately designed to have a broad reach to minimise the effects of this uncertainty, and to maximise support for those most reliant on their self-employed income. Reducing the generosity of the grants or restricting eligibility risked not fully supporting individuals who needed the grants and ran the risk of deterring individuals with valid claims.
Additional complexity may have reduced the certainty the scheme provided and delayed payments, potentially resulting in further economic harm and higher customer contact for HMRC with a consequent negative impact on resources. However, the scheme did evolve over time to reflect changing economic circumstances, such as reducing the value of the second grant to 70%, rather than 80%, of trading profits and introducing the RBT from the third grant onwards.
5.5.2.1 Increased turnover or profits
Deadweight can be considered in different ways in VfM assessments and the following sections look at different possible approaches. One potential definition of deadweight would be estimating the grants paid to claimants who saw their trading profits or turnover increase without the SEISS. This could be interpreted as these individuals still achieving similar outcomes for their business despite the pandemic and thus not needing the SEISS. This corresponds to £3.5 billion of support paid out to claimants of the first 3 SEISS and £2.4 billion paid out to claimants of the fourth and fifth SEISS grants. However, this definition of deadweight has significant limitations. It fails to account for:
a. individuals who would have expected to see a bigger increase in trading profits or turnover than they were able to achieve because of the COVID-19 pandemic, particularly the newly self-employed
b. high levels of volatility within the self-employed population and their incomes, making a one-year comparison of profits or turnover over-simplistic
c. tax and NICs which will be recovered from paid out grants
d. the impact on total income and other behavioural choices made during the COVID-19 pandemic
e. in-year variation such as an individual who saw a significant impact to their business in lockdown, but bounced back when economic restrictions eased
f. wider economic benefits of the grants being paid out as a fiscal stimulus to the economy, with the income support increasing spending during a time of economic disruption
g. the positive impact of announcing a generous support scheme on business and consumer confidence
The calculation has therefore been re-estimated on a total income basis, and also accounts for Income Tax and NICs recoveries, applies an estimated average growth of self-employed profits based on historic trends, and compares to individuals highest trading profits from the years over which individuals were assessed for SEISS eligibility. As a result, it is estimated that £1.5 billion was paid out to those claiming the first 3 SEISS grants and who increased their total income above a reasonable expected projection of what would have been achieved without the pandemic, and a further £1.3 billion paid out to claimants of the fourth and fifth grants on the same basis. This only accounts for limitations a to d and so does not reflect these individuals’ indirect contribution to the wider economic recovery through the multiplier effect discussed above or the in-year variation in trading profits they may have experienced.
These payments are not evidence of non-compliance. Individuals may well have been significantly impacted by the pandemic when claiming, only for their business to perform well over the rest of the tax year. This definition also imposes backwards-looking criteria on individuals based on their reported business performance, which is not an adequate test of how business owners would have felt at the time that economic restrictions were first announced. Therefore, this estimate is likely to over-estimate the extent of deadweight in the scheme, but is used as the best available method for the purposes of the VfM assessment.
5.5.2.2 The value of the SEISS grants
Analysis presented in chapter 3 shows that the average claimant of the first 3 SEISS grants had trading profits around £2,200 higher in 2020 to 2021 with the SEISS included compared to the year before. This could be interpreted as the scheme being more generous than needed or poorly targeted. Under this interpretation deadweight would be considered as a percentage of the grant paid to each individual, with the amount that took individuals back in line with previous business performance considered to be well targeted spending, but anything above this is considered deadweight.
This interpretation is subject to similar limitations to those set out in section 5.5.2.1. Once again, this is applying backwards-looking criteria to defining deadweight. It does not fairly capture the uncertainty that existed at the time the government was implementing the scheme and individuals were claiming the grants. It also fails to account for the macroeconomic benefits of the SEISS and the in-year variation in trading profits claimants will have experienced.
The net value of payments that over-compensated SEISS claimants, when accounting for limitations a to d as set out within section 5.5.2.1, is estimated at £3.4 billion for the first 3 grants, and £1.6 billion for the fourth and fifth grant. However, due to the limitations identified this is not interpreted as deadweight as it is likely an over-estimate.
The results of this over-compensation analysis could be interpreted as showing that the SEISS was too generous on average. However, there are still large numbers of individuals who lost out even with the SEISS included, and they would have seen bigger falls in their income if the SEISS was less generous. HMRC lacked real-time data with which to target the SEISS to individual circumstances. Had the scheme been initially less generous than 80% of trading profits, there would have been some sectors that were severely impacted, which would have been under-compensated such as transportation and storage and arts, entertainment and recreation.
Additionally, even with the SEISS included, 43% of those who have provided Self Assessment returns for 2019 to 2020 and 2020 to 2021 show a decrease in trading profits between those years, and 41% of the population show a decrease between 2019 to 2020 and 2021 to 2022. Consequently, although the average SEISS grant may have created a slight over-compensation effect, making the grants less generous would have had significant negative consequences for large numbers of the SEISS-claiming population.
Overall, the SEISS appears to have achieved a balance of providing an appropriate level of support on average despite limitations in how it could be targeted and provided effective income support to its recipients. However, there is still a wide range of outcomes within the self-employed population, which by its nature is very diverse. Improved data on this population may have allowed the scheme to be more targeted to individual outcomes, for example by identifying severely impacted sectors of the economy, or by using more up-to-date data on trading profits.
5.5.2.3 The income effect and behavioural responses to the SEISS
As noted above, the grants represent a transfer from government to individuals that does not create or destroy resources, and thus have no social cost or benefit in of itself. A more comprehensive definition of deadweight uses the economic concept of deadweight loss, which is the cost to society created by inefficient markets. This can be applied to the SEISS through further consideration of the finding of an income effect discussed in chapter 3.4.
An income effect means that individuals could choose to work fewer hours, as a result of receiving the SEISS grants that increase their income. The lost economic output that would have been generated by markets working more efficiently had the scheme not been in place could therefore be seen as deadweight. This is because the value of work people chose not to do as a result of receiving the SEISS reflects the value of the SEISS that the government did not need to pay.
HMRC is not able to identify what individuals do with their non-working hours. This could be increased leisure time or socially beneficial activities such as caring responsibilities or volunteering, activities which were of particular importance during the COVID-19 pandemic and which many people engaged in. This is particularly important, as the deadweight aspect of the income effect is minimised when considering that what individuals chose to do with their extra non-working hours likely had wider economic and social benefits.
The income effect identified through the counterfactual analysis above is only valid for the population included in the analysis. As the analytical method requires a focus on relatively higher-income individuals close to the £50,000 trading profits cut-off for eligibility, it cannot be generalised to the whole population of SEISS claimants. The income effect is also observed on total income rather than just trading profits, suggesting the behavioural change is more pronounced for those with other income sources.
Economic theory suggests that the income effect will decline for individuals further away from this threshold, as those on lower-incomes are generally likely to prefer the opportunity to increase their income rather than taking more non-work time. This effect is also likely to decline as lower-income individuals receive less income from SEISS grants, as this leads to a proportionately smaller increase in disposable income, which further reduces the incentive to reduce hours worked.
If the income effect is only applied to individuals who had average trading profits of over £40,000 when assessed for the SEISS, the value of the income effect as a cost to society would be £0.3 billion based on the counterfactual for the first 3 grants, and £0.4 billion for the fourth and fifth grant. Given the challenge of generalising the income effect, this is likely to under-estimate the true cost of the SEISS from the income effect, although it is expected that the income effect would be smaller for groups not included in the counterfactual based on economic theory. Because the group assessed for this analysis was eligible to claim the maximum amount in SEISS grants, and they were already on the highest earning level possible, finding a small income effect suggests that most SEISS grants had been used to replace genuine lost income.
As SEISS claimants will have had a wide range of experiences during the COVID-19 pandemic, it was arguably inevitable that with a scheme of this size, it might have been too generous for some parts of the population. Due to the timing of Self Assessment tax returns, there was a lack of real-time data, which meant that monitoring the effect of the scheme was challenging.
5.5.2.4 Conclusions around possible deadweight
There is evidence that there was some deadweight within the SEISS. An estimate for possible deadweight of £2.8 billion, based on increased total income across the 5 grants, has been factored into the VfM assessment. This methodology is judged to be the most comprehensive of those suggested above as it covers the whole SEISS population and most clearly identifies the population with positive business outcomes even without considering the SEISS in their trading profits. However, this does not account for the wider economic benefits of the SEISS and the in-year variation in trading profits individuals will have experienced and so is likely to over-estimate deadweight.
5.6 VfM summary
As discussed, the SEISS represents good VfM, with significant benefits derived from an equitable distribution of income and supporting economic activity. A detailed breakdown of the VfM assessment is presented below.
Table 5.6: Line-by-line VfM assessment for the SEISS
| Benefit or cost of the SEISS | Social costs/benefits (£ billions) | Exchequer costs/benefits (£ billions) |
|---|---|---|
| Effectiveness | ||
| Businesses saved | 0.3 | N/A |
| UC savings from businesses saved | N/A | 0.1 |
| Income tax and NICs from businesses saved | N/A | 0.0 |
| Indirect economic impacts as a result of the multiplier effect | 8.5 | N/A |
| Indirect exchequer impacts | N/A | 2.9 |
| Equity | ||
| Equity benefits | 10.5 | N/A |
| Economy | ||
| Gross spending | N/A | -28.1 |
| Voluntary repayments | N/A | 0.1 |
| Compliance recoveries | N/A | 0.3 |
| Income Tax recouped | N/A | 2.7 |
| National Insurance contributions recouped | N/A | 1.4 |
| Universal Credit savings from income support | N/A | 1.7 |
| Cost of delivering the scheme | -0.1 | -0.1 |
| Social cost of exchequer finance | -3.8 | N/A |
| Cost of servicing debt | N/A | -0.4 |
| Efficiency | ||
| Deadweight | N/A | -2.8 (included within Economy) |
| Error and fraud | -1.2 | 1.2 (included within Economy) |
| Overall | ||
| Benefits | 19.3 | 9.2 |
| Costs | -5.1 | -28.6 |
| Total | 14.2 | -19.5 |
Chapter 6: Final evaluation conclusions
The evidence presented in this evaluation shows that the SEISS was effectively designed and delivered at pace in response to the COVID-19 pandemic and supported the incomes of self-employed individuals who were most in need of financial support.
The impact and importance of this support varied across SEISS recipients, reflecting that the self-employed population is very diverse and the impact of COVID-19 on their businesses varied. The SEISS succeeded in ensuring most self-employed people were protected from a significant drop in income that they may otherwise have experienced.
The analysis also shows that the SEISS helped support businesses to continue trading. The eligibility criteria for the scheme ensured that the SEISS supported lower income workers most reliant on self-employment trading profits. Some workers either side of the eligibility thresholds had contrasting outcomes due to constraints on the scheme’s design.
The need to get support to people quickly meant it was not possible for early grants to have an overly complex design, especially with the lack of real-time information. This meant that support could not be adjusted with variations in business performance, and meant it was unlikely support would perfectly compensate individuals for lost trading profits.
Based on a detailed assessment presented in chapter 5, the SEISS can be shown to have been good VfM overall. The scheme achieved its objectives by supporting those most in need and by stimulating the wider economy during a period of significant disruption. There is some evidence of inefficiencies around the scheme, as shown by the assessment of deadweight and error and fraud. However, these should be understood in the context of the overall value of the scheme to society which appears to be highly positive. The SEISS appears to have been well designed in limiting these costs and offered good VfM.
The SEISS became better targeted over time. The scheme was adapted to ensure support continued to be targeted at self-employed individuals most affected by COVID-19, with the RBT introduced from the third grant and the turnover test via the FID for the fifth and final grant. To protect against fraud risks, for the first, second and third SEISS grants, only those who traded in the tax year 2018 to 2019, were eligible to apply, which meant some self-employed were not eligible for the SEISS at first.
When 2019 to 2020 tax return data became available, the newly self-employed were brought into the scheme. When designing the scheme, the government was keen to ensure that while limiting deadweight and error and fraud were priorities, it was also important not to dissuade legitimate claimants from accessing the SEISS or deny access to those who required support.
From the outset, measures to minimise error and fraud were incorporated into the design of the scheme. Effective controls were put in place to address concerns of potential organised crime attacks. Compliance activity to tackle abuse has continued after the scheme closed using the full range of HMRC powers – both civil and criminal. The continuing use of the RBT for the fourth and fifth grants and introduction of the FID for the final grant meant that while the risk of error and fraud rates increased, the SEISS was better targeted as a result.
Evidence collected in this evaluation provides some lessons, reflecting on the scheme’s design and delivery:
- the overall success of the scheme represents a positive lesson learnt regarding delivery at pace to provide certainty in the early stages of COVID-19. This highlights the success of working across government to deliver the SEISS using the best available data and partnering with outside experts and tax professionals throughout the life of the scheme to ensure the claims process, guidance and customer products were accessible and understandable
- the findings suggest that having more timely data on the self-employed population would be beneficial for any future policy interventions in several respects. Although on average the SEISS appears well targeted, there is a range of outcomes in individual experiences, both for those receiving the grant and those who were assessed as ineligible. Improved data could help enable the government to assess eligibility on more up-to-date information, and allow support to be better targeted in proportion to need. A lack of data on the performance of self-employed trades during the pandemic and uncertainty over the future path of the pandemic means that improving the policy with the right targeting mechanisms to reduce this deadweight would have been very challenging
- more timely and comprehensive data could also improve access to future schemes. Overall, the newly self-employed were able to continue trading or move into PAYE employment despite not being eligible for the SEISS in 2020 to 2021, but there are some who did lose out, and there is likely to be a lot of variation in outcomes despite the positive overall average result. More comprehensive and timely data could allow these individuals to be included in a future policy intervention and the intervention to be targeted appropriately
- the government has committed to further action to identify data gaps to help its ability to understand the self-employed population. HMRC ran a data consultation between 20 July and 12 October 2022 and published a Summary of Responses which also includes proposed next steps. A Call for Evidence was published on 27 April 2023 on ‘Improving the data HMRC collects from its customers’. This focuses primarily around improving the range of information and data HMRC collects. Securing higher quality data from existing third parties could improve the accuracy of data-matching and pave the way for wider use of pre-population. More extensive pre-population of taxpayer returns presents opportunities to relieve burdens on taxpayers and enables easier compliance, so could improve the overall experience of paying tax and benefit future compliance yield
- plans to introduce Making Tax Digital for Income Tax from April 2026 are currently being undertaken and will in time help HMRC begin to have a more up-to-date picture of the trading and profit levels for self-employed customers. More timely data for this population could help improve targeting for future policy measures
- more reliable and granular sector data could have helped with better targeting of support. Sector data is currently collected through Self Assessment returns but is subject to limitations, with around 14% of claims made by those whose sector cannot be identified
- the government has reflected on the design, delivery and processes underpinning the SEISS and have concluded that there are a number of lessons or issues that on reflection would have been helpful to incorporate in the scheme design. These are largely focused on changes to streamline HMRC processes that would improve the customer experience for all potential claimants and not just those who successfully claimed their SEISS grants. These points such as reconsidering customer eligibility reviews and a pre-population process for taxable grants have been discussed in more detail within this evaluation and in chapter 3 of the interim evaluation