SEISS final evaluation - accompanying information
Published 17 July 2023

© Crown copyright 2023
This publication is licensed under the terms of the Open Government Licence v3.0 except where otherwise stated. To view this licence, visit nationalarchives.gov.uk/doc/open-government-licence/version/3 or write to the Information Policy Team, The National Archives, Kew, London TW9 4DU, or email: psi@nationalarchives.gov.uk.
Where we have identified any third party copyright information you will need to obtain permission from the copyright holders concerned.
This publication is available at https://www.gov.uk/government/publications/the-self-employment-income-support-scheme-final-evaluation/seiss-final-evaluation-accompanying-information
Introduction
This is an accompanying document to the Self-Employment Income Support Scheme (SEISS) final evaluation. It provides details on the range of data sources, research and analysis that has been used to inform the SEISS final evaluation.
In additional to internal data, commissioned research and internal analysis detailed in this evaluation, the SEISS final evaluation also used some information from other government departments, public bodies and intergovernmental organisations. These sources were primarily used to provide context.
1. Internal data sources
1.1 HMRC SEISS Official Statistics
HM Revenue and Customs (HMRC) produced SEISS Official Statistics which included figures from the start of the scheme in May 2020 through to the end of the scheme in September 2021. They were published approximately monthly between June 2020 and December 2021.
The information presented in these statistics show the number of individuals claiming the SEISS and the value of these claims. They include information on:
- age of claimants
- gender of claimants
- sector of self-employment activity
- geography
They include time series data of SEISS claims by different characteristics, including sector, gender, geography, age and claim and income bands. They also include cumulative statistics for the total number of SEISS claims and total value of claims made.
Information on the age, gender and postcode of residential address has been collected from the Self Assessment account for each individual. Sector information has been collected from the Self Assessment tax return for the tax year ending April 2020 and relates to the self-employment business description provided on that return. To produce geographic breakdowns, the claimants’ residential postcode was matched to the Office for National Statistics (ONS) data that links UK postcodes to geographic areas.
The SEISS statistics are experimental statistics and subject to revisions. There have been some improvements made to the methodology used to produce the statistics which has the potential to cause some small differences. This could affect the comparability of statistics over time.
Further details about the Official Statistics, including the data sources, methodology, limitations and revisions can be found in the monthly publications and associated background quality report.
1.2 HMRC SEISS data
The data used for the statistics publications and for other analysis of the SEISS population comes from HMRC’s system for administering SEISS. It covers the whole population of individuals who were assessed for SEISS eligibility, including those assessed as ineligible or those assessed as potentially eligible but who did not make a claim.
Data used in this publication covers SEISS claims made up to 28 October 2021. A small number of late claims will have been made after this date but this is not expected to impact any of the findings in this evaluation. This is consistent with the data used in the final statistics publication on the SEISS, published in December 2021.
1.3 HMRC Self Assessment returns data
In addition to the demographic information as described above, Self Assessment tax returns data has been used to provide income and business data from 2016 to 2017 tax year to 2021 to 2022 tax year (the latest tax year currently available). Variables sourced from Self Assessment tax returns to assess the impact of SEISS are trading profits and total self-employment income, counts of trades, trade commencements and cessations.
1.4 HMRC Pay As You Earn (PAYE) Real Time Information (RTI)
This database covers the amount of pay made each month to employees. This Management Information System enables analysis of employee’s area of residence, age, gender, and their employer’s industry or sector. Information on employees’ occupation, ethnicity and disability status is not available. Monthly statistics based on HMRC’s RTI system are published in a joint release between HMRC and the ONS. Data from HMRC’s RTI system was matched with HMRC Coronavirus Job Retention Scheme (CJRS) data in order to produce the CJRS Official Statistics.
2. Evaluation approach
The final evaluation is assessed on 3 main areas: error and fraud, the impact, and value for money (VfM) of the overall scheme. The questions that the evaluation addresses are outlined below.
Process:
- What was the scale of error and fraud associated with the scheme throughout its delivery and how has HMRC dealt with it?
Impact:
- To what extent did the SEISS support claimants’ incomes?
- To what extent did the SEISS reach those it was intended to?
- What contribution did the SEISS make to the outcomes and impacts identified?
- What impact did the eligibility criteria have on the scheme achieving its policy objectives?
- What impact did the SEISS have on claimants’ self-employment activity?
- Who was impacted by the SEISS and what can be learned from the relationship between characteristics and outcomes/impacts of the scheme?
VfM:
- How effective was the scheme?
- How fair was the scheme?
- How much did the scheme cost?
- How efficient was the scheme?
- Was the SEISS overall VfM?
Cross-cutting and policy themes:
- What lessons can be learned from the SEISS to inform future policy design and implementation?
3. Commissioned research
The evaluation references evidence from a quantitative survey with SEISS claimants conducted by the research agency Ipsos between August and September 2020. It also references findings from qualitative research with SEISS claimants conducted by Ipsos between September and October 2020. The research aims and design are outlined in the accompanying technical information for the SEISS interim evaluation.
4. Internal analysis
4.1 Error and fraud estimates (evidenced in Chapter 2)
To develop error and fraud estimates specific risks for the scheme were identified. These fall into 3 broad categories:
- organised crime
- opportunistic fraud
- error
Each component was estimated separately as different sub risks have been identified and quantified for each category. More information on the methodological approach can be found in the measuring error and fraud in the COVID-19 support schemes publication.
4.2 Trading profits analysis (evidenced in Chapter 3)
4.2.1 Aim of the analysis
The trading profits analysis aims to show trends of average self-employed trading profits over time by SEISS claimant status. This analysis is a continuation of the analysis that was presented in the SEISS interim evaluation, extended to cover the tax year 2021 to 2022 to show the continuing impact that SEISS had on the self-employed trading profits.
4.2.2 Datasets
For this analysis the SEISS administrative data was matched with the latest Self Assessment data. The dataset contains annual trading profits and total income for 2021 to 2022 back to 2016 to 2017, classifications of SEISS eligibility and claimant status, as well as various demographic identifiers including age, gender, sector and region. Self Assessment returns include data up to and including returns filed by 3 March 2023. Any returns filed after this date, or amendments made after this, are not included.
4.2.3 Definitions
The trading profits charts track individuals based on eligibility definitions for the first 3 SEISS grants from 2016 to 2017 through to 2020 to 2021, and then similarly for the fourth and fifth SEISS grants based on eligibility definitions in 2021 to 2022. As individuals’ eligibility status remained broadly consistent across the lifetime of the scheme this enables the impact of the SEISS to be displayed on a single chart. 91% of individuals who were assessed as potentially eligible for the first 3 SEISS grants (regardless of whether they actually claimed SEISS) were also assessed as potentially eligible for the fourth and fifth SEISS grants.
Within this assessed as potentially eligible population, 67% of those who claimed the first 3 SEISS grants continued to claim the fourth and fifth SEISS grants. 84% of individuals who were potentially eligible non-claimants for the first 3 SEISS grants remained potentially eligible non-claimants for the fourth and fifth SEISS grants. 83% of individuals who were assessed as ineligible for the first 3 SEISS grants were also assessed as ineligible for the fourth and fifth SEISS grants.
4.3 Income counterfactual analysis (evidenced in Chapter 3)
4.3.1 Aim of the analysis
The aim of the counterfactual analysis is to investigate the causal impacts of SEISS on trading profits and total incomes. To do this, a fuzzy regression discontinuity design around the eligibility cut-off of no more than £50,000 trading profits based on historical Self Assessment returns was applied. Full details of this methodology and its findings and limitations can be found in the counterfactual technical note.
4.3.2 Datasets
For this analysis the SEISS administrative data was matched with the latest Self Assessment data. The dataset contains annual trading profits and total income for 2021 to 2022 back to 2016 to 2017, classifications of SEISS eligibility and claimant status, as well as various demographic identifiers including age, gender, sector and region. Self Assessment returns include data up to and including returns filed by 3 March 2023. Any returns filed after this date, or amendments made after this, are not included.
4.4 Business survivability analysis (evidenced in Chapter 4)
4.4.1 Aim of the analysis
The business survival analysis aims to show trends of business survivability by SEISS claimant status. This analysis uses 2 approaches, the first is a continuation of the analysis using declared cessations that was presented in the SEISS interim evaluation, extended to cover the tax year 2021 to 2022 to show the continuing impact that SEISS had on business survivability. The second uses a more robust approach which identifies permanent cessations that occurred during the first year of the pandemic according to observed activity in the following tax year.
4.4.2 Datasets
For this analysis the SEISS administrative data was matched with the latest Self Assessment data. The dataset contains flags for business survivability using declared cessations for 2021 to 2022 back to 2016 to 2017, flags for business survivability using permanent cessations for 2020 to 2021 back to 2016 to 2017, classifications of SEISS eligibility and claimant status, as well as various demographic identifiers including age, gender, sector and region. Self Assessment returns include data up to and including returns filed by 3 March 2023. Any returns filed after this date, or amendments made after this, are not included.
4.4.3 Definitions
Declared cessations are defined as businesses where there is a date of cessation declared on the tax return for that tax year. It is not possible to determine whether a declared cessation represents a permanent or temporary business closure.
Permanent cessations have been defined as individuals that traded or attempted to trade during the preceding tax year and subsequently did not receive a notice to file a tax return for the following year (indicating they had informed HMRC they had ceased trading) or submitted a tax return for the following year for reasons other than trading.
4.5 Business survivability counterfactual analysis (evidenced in Chapter 4)
4.5.1 Aim of the analysis
The aim of the counterfactual analysis is to investigate the causal impacts of SEISS on business survivability. To do this, a fuzzy regression discontinuity design around the eligibility cut-off of no more than £50,000 trading profits based on historical Self Assessment returns was applied. Full details of this methodology and its findings and limitations can be found in the counterfactual technical note.
4.5.2 Datasets
For this analysis the SEISS administrative data was matched with the latest Self Assessment data. The dataset contains flags for business survivability using declared cessations for 2021 to 2022 back to 2016 to 2017, flags for business survivability using permanent cessations for 2020 to 2021 back to 2016 to 2017, classifications of SEISS eligibility and claimant status, as well as various demographic identifiers including age, gender, sector and region. Self Assessment returns include data up to and including returns filed by 3 March 2023. Any returns filed after this date, or amendments made after this, are not included.
4.6 Multiplier effect (evidenced in Chapter 4)
4.6.1 Aim of the analysis
The aim of the multiplier work was to quantitatively assess the indirect impact of the SEISS, beyond the immediate economic effects it had on demand by protecting individual’s incomes. The grants allowed businesses to continue trading, which in turn protects economic output, leading to benefits such as supply chains not being as significantly disrupted, supporting businesses excluded from the support through additional cash flow into the economy, and indirectly supporting jobs this way. These wider effects are quantified with the multiplier.
4.6.2 Datasets
The multiplier estimate used for the SEISS is that used by the Office for Budget Responsibility (OBR) in the November 2020 Economic and Fiscal Outlook when looking into impact of the SEISS and CJRS on Gross Domestic Product (GDP) growth and unemployment. This has a value of 15% in 2020 to 2021 and tapers down to 2% in 2024 to 2025. The OBR creates multipliers to be used on levels of spending and their implications for GDP.
There is uncertainty over the exact value of the multiplier. At the time of publication, there was still a lot of uncertainty, and not enough data on the effects of government intervention during and after an abnormal period when there were significant restriction on economic activity, so judgement is applied to the standard government spending multiplier. Following this, it is assumed that the multiplier effect from the spend on this fiscal measure would be a quarter of what typical spending is during more normal economic times. This figure is lower than multipliers generally, due to the restrictions imposed on the economy during the pandemic, which constricted spending and encouraged precautionary saving, even from recipients of the scheme.
The multiplier which the evaluation uses to calculate these indirect benefits is adjusted to allow the costs and benefits across different years to be compared on a present value basis. This discounted rate adjusts for social time preference, as people attach more value to consumption in the present. The method by which this is done is detailed in section 14 of the Green Book.
In addition to this, adjustments were made for inflation, so that the total costs and benefits could be estimated on a real terms basis. For this, the OBR’s GDP deflator was used to estimate an average value for each year of the following 5 years from the year the spend occurs in (2020 to 2021 for the first 3 grants, 2021 to 2022 for the fourth and fifth grants). These figures were then applied when estimating the total indirect economic impacts of the SEISS.
It is worth noting that the estimate provided by the OBR was published when the fourth and fifth SEISS grants had not been announced, and before the rollout of the vaccines began which allowed for a quicker reopening of the economy (and thus increase in economic activity) than previously expected. The multiplier may therefore be higher than 15% due to restrictions being lifted more quickly than expected, but it is challenging to credibly estimate this.
4.7 Newly self-employed analysis (evidenced in Chapter 4)
4.7.1 Aim of the analysis
The newly self-employed analysis aims to provide further information on the population that were not eligible for the first 3 SEISS grants due to not filing a tax return for 2018 to 2019 but were still self-employed. As this population is therefore unsupported in 2020 to 2021 this analysis seeks to determine if this population adjusted their behaviour to receive support from elsewhere, or if the lack of support resulted in certain outcomes such as individuals in this group leaving the labour market.
4.7.2 Datasets
This analysis utilised Self Assessment data covering the 2018 to 2019 to 2021 to 2022 tax years. This data was refined to only the newly self-employed (those that filed no Self Assessment return in 2018 to 2019 but did in 2019 to 2020). This was then matched onto HMRC’s PAYE RTI data using National Insurance numbers to determine if these individuals joined RTI at any point. The dataset contains flags to indicate which years Self Assessment returns were filed and when the individual was in RTI as well as various demographic identifiers including age, gender, sector, and region.
Using the RTI and Self Assessment flags within this data, new variables are created in order to determine the movement of an individual. This is a flag to indicate if they move out of the RTI dataset based on 4 outcomes:
- remaining out of RTI, where they were not in RTI to begin with and never joined
- moved into RTI, where they were not in RTI to begin with but moved in at some point
- remained in RTI, where they were in RTI to begin with and never left
- moved out of RTI, where they were in RTI to begin but moved out at some point
These outcomes were then aggregated for each quarter over the 2-year period to determine the number of people in each group. This was done cumulatively to show the movement across the 2 years rather than between quarters.
4.7.3 Definitions
The newly self-employed are defined as those who did not file a 2018 to 2019 Self Assessment return, but did in 2019 to 2020. They therefore would not have been eligible for the first 3 SEISS grants, but would have been potentially eligible for the fourth and fifth grants.
4.8 Self-employment support in other countries (evidenced in Chapter 4)
4.8.1 Aim of the analysis
The aim of this analysis is to provide a brief overview of similar schemes in other countries. This is not an exhaustive list of similar schemes but a sample of some similar schemes across the world. As there have not been evaluations of these schemes, information has been collected using literature. This has come from both government websites as well as articles published on these schemes in the cases where the government website does not provide adequate information.
France
France (Simmons and Simmons article)
Germany
Germany (Federal Ministry for Economic Affairs and Climate Action)
Denmark
Canada
Canada (government website) – CERB
Canada (government website) – Employment Insurance
Australia
Australia (government website)
Australia (The Guardian article)
New Zealand
New Zealand (government website) – Leave Support Scheme
New Zealand (government website) - Payment rates and processing times
United States of America
USA (Institute for Government)
USA (Pandemic Oversight Government website)
Netherlands
The Netherlands (government website)
Spain
Spain (Euraxess) – Unemployment benefit
Portugal
Monetary value exchange rate conversion
In order to determine and compare the relative generosity of the schemes, local currencies were converted to GBP using exchange rates from HMRC’s yearly average and spots rates publication, found here:
Average exchange rates for the year to 31 December 2021 – HMRC published figures
An average of the exchange rates from the 2020 to 2021 calendar year was used, as this is when the majority of support was paid.
4.9 Equity analysis (evidenced in Chapter 5)
4.9.1 Aim of the analysis
The purpose of this analysis is to assess the benefits created by the SEISS as a result of redistributing income towards those on lower incomes. The methodology follows the approach from appendix 3 of the Green Book. The analysis is conducted separately for the 2020 to 2021 and 2021 to 2022 tax years.
4.9.2 Datasets
In order to calculate the equity benefits of the scheme the following calculations are made. Firstly, the average total income of SEISS claimants is estimated with the SEISS component of their income removed. The average used is the median in order to reduce the impact of significant outliers on the analysis. This is taken from HMRC’s administrative data by matching Self Assessment returns to the data from the SEISS claiming system. This may slightly over-estimate the income of this population as a small population of SEISS claimants’ estimates are estimated to have closed their trade and thus been unemployed or economically inactive had the scheme not existed. It may however also be a small under-estimate as it does not account for the income effect, but this is not expected to have a large impact on the whole SEISS population.
Secondly, the average income of the total population is estimated, once again using the median. This is derived from HMRC’s Survey of Personal Incomes used to produce personal income statistics as shown on gov.uk. The analysis calculates the weighted median personal income of everyone included in the data. The suggested approach from the Green Book is that this figure should only be the median total income of all taxpayers. However, it is assumed that everyone effectively contributes to the exchequer in some way even if they do not pay income tax, as their economic activity will still lead to VAT receipts or other tax revenue.
The figures are then inputted to the formula below:
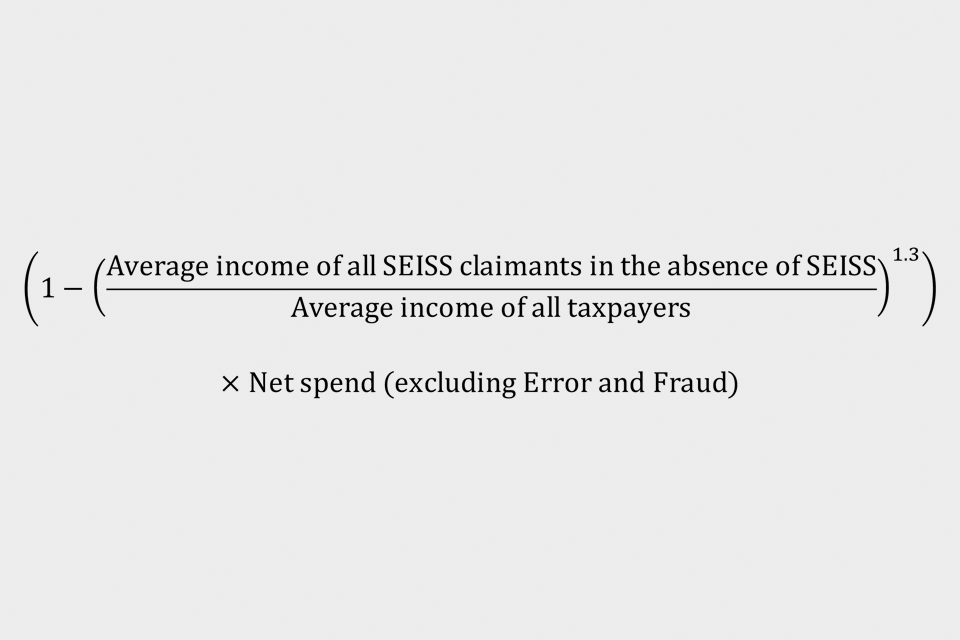
The median is used for this analysis in order to prevent it being impacted by outliers. This means that the further the income of SEISS recipients is from the median income of the general population, the more value the schemes had from a redistributive perspective. This benefit is then multiplied by the net spend of the scheme. This means not accounting for the component of the SEISS that is returned to HMRC through income tax and National Insurance contributions and the value that individuals would have received through Universal Credit (UC) instead had the scheme not existed. The value of error and fraud in the scheme is also removed from this calculation, as this is not judged to have any positive benefits.
4.10 Equalities assessment – Family Resources Survey (evidenced in Chapter 5)
4.10.1 Aim of the analysis
The evaluation reviews the impact of the SEISS on groups with different protected characteristics, particularly focusing on disability. HMRC only routinely collects data on age and gender, both of which have been examined extensively in official statistics published on the scheme. However, using the Family Resources Survey (FRS) administered by the Department for Work and Pensions (DWP), the impact of the scheme on other characteristics can also be examined.
The analysis presented here focuses on the characteristic of disability. Unlike the CJRS evaluation, ethnicity is not assessed using the FRS due to limitations on data quality and sample sizes which prevent robust analysis. Disability and ethnicity were identified as characteristics most likely to be correlated with how the pandemic may have impacted different groups.
The FRS was not able to fully capture the eligibility criteria for the SEISS, and the key variable of analysis is the usage rate of the scheme, defined as the percentage of the self-employed population using the SEISS according to the survey.
4.10.2 Datasets
HMRC has used the FRS covering the 2020 to 2021 tax year to assess the usage rate across protected characteristics. As this analysis only uses the 2020 to 2021 tax year it will not cover the impact of the fourth and fifth grants. However, it is not expected that the results for this period would look significantly different to the first, second and third grants. Additionally, the majority of claims for the SEISS occurred in 2020 to 2021 and so this analysis will capture the majority of the impact.
The evidence suggests that there are no significant differences in usage of the scheme by people with disabilities relative to those without disabilities or the overall population. The usage rate is estimated at 43% for the disabled population, compared to 48% for those who are not disabled. However, when accounting for the uncertainty ranges introduced by the sample size of the FRS this difference is not found to be statistically significantly different.
The analysis above does not investigate a causal relationship between disability and the uptake of the SEISS, however based on the evidence here the scheme does not appear to have had a significant adverse effect on groups with different protected characteristics. A lack of administrative data does mean that there is some uncertainty with these findings as they are only based on survey data.
4.11 Equalities assessment – Census data (evidenced in Chapter 5)
4.11.1 Aim of the analysis
This analysis aims to provide an understanding on the demographic make-up of the geographic clusters claiming the SEISS grants. It looks at the ethnic make-up of claimants, as well as whether or not they have a disability, to see if belonging to any of these groups meant there was a correlation between the prevalence of these groups and the take-up of the scheme. This analysis also assesses if the scheme was successfully targeted at lower income areas. In total, this analysis looks at the following characteristics of individuals, to assess among other things, whether there was discrimination in the rollout of the scheme:
- ethnic group
- disability
- income deprivation
4.11.2 Datasets
This analysis uses data at a Lower Super Output Area (LSOA) level. LSOAs are geographical areas with an average of 1,500 residents, or 650 households per area. England has 32,844 LSOAs, and Wales has 1,909. Census data for England and Wales was taken from the 2021 census published by the Office for National Statistics, with the estimates for both ethnicity and disability being true as of the 21 March 2021.
The most recently available data on Indices of Multiple Deprivation (IMD) for England and Wales are from 2019, which are published by the ONS. These provide an overall deprivation rate, as well as data on income and employment deprivation by LSOA level. Scotland carried out its census in 2022, and so data from this is not currently in the public domain due to the publishing schedule. With the most recently available census data being over a decade old, the decision was taken not to include Scotland in this analysis as the level of accuracy of this data was considered too poor.
HMRC captures data on the individuals who claimed SEISS, and can aggregate this data at an LSOA level (with an LSOA identifier code) using the postcodes individuals provide on their Self Assessment return, so as to provide general information on geographic clusters. The LSOA identifier code is then used to cross-reference HMRC data, such as the take-up rate of the scheme for each area, with publicly available data from the English and Welsh IMD from 2019, as well as ethnicity and disability data from the 2021 census.
The IMD data measures relative deprivation in LSOAs in England and Wales. The overall IMD is calculated using various domains of deprivation (such as Crime and Income deprivation) to feed into an overall score for a particular LSOA. This high level measure is used to divide the population into tenths (deciles), where each decile represents 10% of the population, with the first decile representing the most deprived 10% of the country, and the 10th decile representing the least deprived 10%. This is then used to illustrate take-up rate of each individual grant by IMD decile, to see if there is any relationship between the take-up of the grants, and the level of overall deprivation in an area.
The IMD data is also used in a more detailed manner, by looking specifically at the income depravity domain, and running a regression with take-up of the SEISS as a dependent variable. This helps assess the effectiveness of the targeting criteria, as the scheme was targeted by income levels.
Lastly, the census data is used to cross-reference the take-up of each LSOA, against the proportion of the population that is from different ethnic groups, or has a disability that impairs their day to day life at least a little. The aggregated groupings for ethnic groups are as follows:
- Asian - defined as Bangladeshi, Chinese, Indian, Pakistani, by or ‘Other Asian’ populations grouped together
- Black - defined as African, Caribbean, or ‘Other Black’ populations grouped together
- Mixed - defined as White and Asian, White and Black African, White and Black Caribbean, or ‘Other Mixed’ populations grouped together
- Other - defined as Arab, or ‘Any other ethnic group’ populations grouped together
- White - defined as English, Welsh, Scottish, Northern Irish, British, Gypsy, Irish, Roma, or ‘Other White’ populations grouped together
This analysis employs the use of scatterplots. The red line represents a correlation line between take-up for the third SEISS grant (represented on the y-axis) and the proportion of the population belonging to one of the protected characteristics analysed (represented on the x-axis).
The slope of this correlation line would then show how much of an increase of the variable on the x-axis correlates to an increase in take-up of the third SEISS grant, such that for the graph used in figure 5.3 in the main evaluation, an increase in the proportion of the population that is minority ethnic of 0.1 (10%) correlates to an increase in take-up of 0.014 (1.4%). The same positive correlation was found in the analysis of all other ethnic minority groups and across all SEISS grants.
4.12 Universal Credit savings (evidenced in Chapter 5)
4.12.1 Aim of the analysis
DWP have estimated the value of UC payments that would have occurred had individuals not received support from the SEISS instead. The aim of this project is to quantify the value of savings in benefits spending as a result of the SEISS. This is in line with Green Book guidance to compare to the impact of an intervention to no intervention. This means the cost of the scheme should consider that had businesses not been kept open by the SEISS, the number of people seeking to claim benefits support from DWP would have increased significantly, and so the cost of the SEISS should be interpreted as the cost only above and beyond what would have happened without the SEISS which would include a rise in UC spending.
4.12.2 Datasets
HMRC provided data analysis of trading profits and incomes as described in section 4.2 regarding the average change with and without the SEISS at different levels of income. DWP then used this data in their UC Model, which is based on the FRS (also used above in the protected characteristics analysis). DWP take the FRS for the 2019 to 2020 tax year and project the population covered by the survey forward into the pandemic period.
The analysis simulates the fall in incomes for this population over the pandemic and estimate the UC payments that would have been made in the absence of the SEISS using a micro simulation model. This simulation is then repeated using the observable change in incomes with the SEISS payments included. The difference in forecast UC payments between these 2 projections is taken as the estimated savings as a result of the SEISS. The methodology is applied separately for the 2020 to 2021 and the 2021 to 2022 tax year to separately estimate the impacts of the first 3 grants and then the fourth and fifth grants.
The methodology only uses the change in incomes observed in HMRC’s administrative data and so does not account for the income effect. However, the income effect is estimated to only impact those on higher incomes and not be generalisable to the whole self-employed population. This higher income population is less likely to be eligible for UC support and so should not significantly impact this analysis.
The model is able to account for the take-up rate of UC and the fact that not all unemployed individuals would have been eligible for benefits as benefits are assessed on a household basis. The analysis does not look at SEISS take-up by household characteristics that would impact UC eligibility. Consequently, some people may not have been eligible based on their partner’s income or savings, which the DWP model is able to account for by using micro-simulation.
One limitation of this methodology is that it assesses the impact of the SEISS in isolation. It is possible that the partner’s income may also have been impacted by the pandemic if they were self-employed or they earned income from other sources, but this is challenging to capture robustly, and risks double counting the savings from other interventions such as the CJRS. Nevertheless, this creates the possibility that these figures may slightly under-estimate the UC savings.
Annex A: The SEISS timeline
16 March 2020: The Prime Minister announced that people should work from home “where they possibly can”.
23 March 2020: The Prime Minister first announced lockdown measures.
26 March 2020: The Chancellor announced the SEISS.
4 May 2020: HMRC began contacting potentially eligible customers.
13 May 2020: The first SEISS grant opened for applications.
29 May 2020: The Chancellor announced the second SEISS grant.
13 July 2020: The first SEISS grant closed for applications.
17 August 2020: The second SEISS grant opened for applications.
24 September 2020: The Chancellor announced the third and fourth SEISS grants.
12 October 2020: The Prime Minister introduced local COVID-19 alert levels.
19 October 2020: The second SEISS grant closed for applications.
31 October 2020: The Prime Minister announced a new national lockdown.
30 November 2020: The third SEISS grant opened for applications.
29 January 2021: The third SEISS grant closed for applications.
3 March 2021: The Chancellor provides further information about the fourth SEISS grant and announces that there will be a fifth SEISS grant.
21 April 2021: The fourth SEISS grant opened for applications.
1 June 2021: The fourth SEISS grant closed for applications.
29 July 2021: The fifth SEISS grant opened for applications.
30 September 2021: The fifth SEISS grant closed for applications.