SEISS final evaluation - counterfactual technical note
Published 17 July 2023

© Crown copyright 2023
This publication is licensed under the terms of the Open Government Licence v3.0 except where otherwise stated. To view this licence, visit nationalarchives.gov.uk/doc/open-government-licence/version/3 or write to the Information Policy Team, The National Archives, Kew, London TW9 4DU, or email: psi@nationalarchives.gov.uk.
Where we have identified any third party copyright information you will need to obtain permission from the copyright holders concerned.
This publication is available at https://www.gov.uk/government/publications/the-self-employment-income-support-scheme-final-evaluation/seiss-final-evaluation-counterfactual-technical-note
Key findings
The Self-Employment Income Support Scheme (SEISS) was part of the government’s economic response to the COVID-19 pandemic. The primary objective of the SEISS was to support self-employed individuals whose businesses had been adversely affected by COVID-19 restrictions.
The counterfactual analysis follows a Regression Discontinuity Design (RDD) methodology focused on the eligibility thresholds to estimate the causal impacts of the SEISS on self-employed individuals’ behaviour and on business survivability.
Trading profits and total income
Findings indicate that receiving the SEISS directly influenced behaviour for individuals who were assessed as potentially eligible on average trading profits across earlier tax years. Compared to the counterfactual of the SEISS not being present, analysis indicates the presence of a localised income effect. The finding of an income effect is consistent with economic theory where eligible claimants may have reduced the amount of work they undertook or reduced their involvement in economic activities compared to those that were assessed as ineligible.
The size of this effect in 2021 to 2022 is almost £4,000 on total incomes near the £50,000 average trading profits threshold, which is equivalent to almost £10,000 per SEISS recipient of the last two SEISS grants. However, it is important to note that the extent of this income effect across the wider self-employed population is uncertain because the evidence is limited to total incomes either side of the £50,000 eligibility threshold, with no evidence of an income effect for trading profits. However, limiting the self-employed population to sole traders only (excluding members of partnerships) does provide evidence of an income effect of around £2,000 on trading profits, which is equivalent to around £8,000 per SEISS recipient.
Furthermore, this analysis uses a specific sub-section of the SEISS population and whilst the demographics of this group are broadly representative of the self-employed population, this finding is only valid around the £50,000 threshold and cannot be generalised to the entire population of SEISS recipients. The population assessed for this analysis were eligible for the maximum value of the fourth and fifth grants, meaning they will have been eligible to claim between £10,350 and £15,000 in SEISS grants. It is expected that the income effect would be smaller for individuals with lower incomes, and those who received smaller values from the SEISS, but this cannot be tested by this analysis.
It is however notable that this is a larger income effect than was found for the first 3 SEISS grants. The SEISS interim evaluation reported the size of the effect in 2020 to 2021 to be slightly over £2,000 near the £50,000 average trading profits threshold, equivalent to around £5,000 per SEISS recipient. The increase for 2021 to 2022 may reflect the SEISS grants being paid out during the first half of the year, but trading profits are reported for the whole year and there was a strong economic recovery experienced during the second half of the year in 2021 to 2022 which may have contributed to improved trading income.
Business survivability
Findings indicate access to the first 3 SEISS grants enabled claimants to sustain their self-employment trading activity, with fewer permanent business cessations compared to a scenario without the SEISS. Eligible claimants were found to be 2.8 percentage points more likely to remain trading in 2020 to 2021 than those assessed as ineligible at the scheme’s £50,000 average trading profits eligibility threshold for the first 3 SEISS grants.
This analysis uses a more robust measure of business survivability than was available for the SEISS interim evaluation (which found SEISS claimants were 2.1 percentage points more likely to remain trading in 2020 to 2021 than those assessed as ineligible at the threshold based on declared cessations). This result is statistically significant, but again uses a specific subset and cannot be generalised to the entire population.
However, given that this eligibility threshold is set towards those with higher incomes, it is likely that the finding of better business survival rates would be more pronounced for traders with lower profits. The RDD approach provides strong evidence that the differences in businesses continuing to trade in 2020 to 2021 can be attributed to the SEISS grants rather than other factors.
However, due to the lag in Self Assessment data, the scheme’s impact on longer-term business survivability is less clear. Using the equivalent RDD methodology to assess the likelihood of claimants continuing to trade in 2021 to 2022 relative to those assessed as ineligible at the scheme’s £50,000 average trading profits thresholds for the last 2 SEISS grants, the difference was a small positive at 1.0 percentage points, but this result is not statistically significant.
Chapter 1: Introduction
The SEISS was introduced at pace to support self-employed individuals (including members of partnerships) whose self-employment activities had been adversely affected by the COVID-19 pandemic. The SEISS was targeted at self-employed individuals with trading profits of no more than £50,000, and who received at least half their income from self-employment. The scheme was designed to support them with living costs, but they could also continue to work, start a new trade or take up a new employment. Over its lifetime, the SEISS provided over £28 billion in grants to 2.9 million self-employed individuals.
The SEISS interim evaluation reported on the counterfactual analysis based on the first 3 SEISS grants paid out during the 2020 to 2021 tax year. This SEISS final evaluation extends the counterfactual analysis, applying the approach to account for contamination across the various eligibility criteria, to include the last 2 SEISS grants paid out during the 2021 to 2022 tax year.
To be eligible for the last 2 SEISS grants, individuals were required to have filed their 2019 to 2020 Self Assessment tax return on or before 2 March 2021. They needed to have traded in the tax years 2019 to 2020 and intend to continue trading in 2020 to 2021 and 2021 to 2022. Individuals were first assessed using 2019 to 2020 income alone, being deemed potentially eligible if their trading profits were less than or equal to £50,000 and greater than zero and their trading profits made up 50% or more of their total income. If individuals were not potentially eligible based on 2019 to 2020 alone, their average income and trading profits could be assessed across earlier tax years. This technical report details the counterfactual analysis for the last 2 SEISS grants. It also includes a further measure using a more robust approach to determining actual business closures for individuals assessed for the first 3 SEISS grants.
This counterfactual analysis is quasi-experimental and estimates the causal impacts of the SEISS. Quasi-experimental means the analysis uses statistical techniques to estimate the causal impact, since the SEISS grants were not randomly assigned. Randomisation would have ensured no systematic differences between the treatment (assessed as potentially eligible for the SEISS) and counterfactual (assessed as ineligible) populations meaning any observed differences in observed outcomes could be directly attributed to the SEISS. However, randomisation was not appropriate here as it would have been unethical to withhold the SEISS from certain individuals purely for the purposes of evaluation.
This technical note provides a detailed explanation of the different elements that constitute the quasi-experimental methodological approach set out in the SEISS final evaluation.
Chapter 2: Developing the control and treatment groups
This analysis looks at 4 measures of causal impact:
- whether self-employed individuals experienced a change in trading profits in 2021 to 2022. This gives an estimate of the impact of the SEISS in replacing any loss in trading profits during the second year of the pandemic. Trading profits are analysed both including and excluding SEISS grants, to show the impact of receiving grants on both total trading profits and the performance of the business
- whether self-employed individuals experienced a change in total income in 2021 to 2022. This gives an estimate of the impact of the SEISS in replacing any loss in total income during the second year of the pandemic. As above, total income is assessed both including and excluding the value received in SEISS grants
- whether there was a change in the proportion of self-employed businesses surviving and continuing to trade in 2021 to 2022 based on declared cessation dates. This gives an estimate of the impact of the SEISS in helping individuals to remain trading during and after the pandemic
- whether there was a change in the proportion of self-employed businesses surviving and continuing to trade in 2020 to 2021 based on permanent cessations. This gives a more robust estimate of the impact of the SEISS in helping individuals to remain trading during and after the first year of the pandemic
This analysis follows a RDD methodology. RDD is an approach used to evaluate interventions/policies that are based on a cut-off point or threshold determining who is potentially eligible to participate. The RDD approach allows comparison of the people immediately above and below the cut-off point to identify the impact of the intervention/policy on a given outcome[footnote 1].
This method is appropriate in situations where individuals are assigned to a policy/intervention based on whether they are above or below a cut-off point, in this case whether their trading profits were above or below £50,000, and whether their trading profits were more or less than 50% of their total income. The advantage of this method is that assignment to the policy/intervention can be considered as good as random for individuals close to the cut-off. The eligibility cut-offs create a quasi-experimental control group of individuals assessed as ineligible, and a treatment group of individuals assessed as potentially eligible.
This RDD method uses an Intention to Treat (ITT) approach. Not everyone who was potentially eligible for the SEISS will have chosen to claim, the analysis therefore demonstrates the difference in outcomes between the potentially eligible and the assessed as ineligible populations, rather than the difference between the claiming population and the assessed as ineligible population. This can then be adjusted to show the impact of receiving the SEISS by accounting for the different probabilities of claiming on either side of the threshold. This adjustment gives a Local Average Treatment Effect (LATE) of actually receiving the SEISS. It is a local effect as it is only relevant to a small population near the eligibility thresholds (discussed further below).
To be eligible for the last 2 SEISS grants self-employed individuals had to meet certain income and trading criteria, and their business had to be adversely affected by COVID-19. It is not possible to apply all these eligibility criteria simultaneously using this method, therefore the analysis applies 4tests.
Table 2.1: Counterfactual test criteria
| Test | Description | Treatment group (Pass) | Control group (Fail) |
|---|---|---|---|
| Test 1 | Test 1 looks at individuals with trading profits in 2019 to 2020 >£0 and trading profits greater than non-trading income in 2019 to 2020 to isolate the £50,000 test | has 2019 to 2020 trading profits which are greater than or equal to £40,000 and less than or equal to £50,000 | has 2019 to 2020 trading profits which are greater than £50,000 and less than or equal to £60,000 |
| Test 2 | Test 2 looks at individuals with average trading profits >£0 and average trading profits greater than average non-trading income to isolate the average £50,000 test | has average trading profits which are greater than or equal to £40,000 and less than or equal to £50,000 | has average trading profits which are greater than £50,000 and less than or equal to £60,000 |
| Test 3 | Test 3 looks at individuals with trading profits in 2019 to 2020 >£0 and less than or equal to £50,000 to isolate the 50% test | has 2019 to 2020 trading profits which are at least equal to 50% and less than 60% of total income | has 2019 to 2020 trading profits which are at least equal to 40% and less than 50% of total income |
| Test 4 | Test 4 looks at individuals with average trading profits >£0 and less than or equal to £50,000 to isolate the 50% test | has average trading profits which are at least equal to 50% and less than 60% of total income | has average trading profits which are at least equal to 40% and less than 50% of total income |
To complete the analysis a ‘fuzzy’ RDD is used to compare outcomes above and below the cut-offs for both groups. A ‘fuzzy’ RDD means the eligibility criteria does not perfectly determine whether someone received the SEISS. Instead, some potentially eligible individuals will have chosen not to claim. A ‘fuzzy’ RDD model, as opposed to a sharp cut-off, accounts for the change in probability of claiming the SEISS on either side of the cut-off in order to estimate an impact. By conducting this test, robust estimates of the effect of the SEISS on trading profits, total income and business survivability can be obtained.
The accuracy of this method relies on 3 key assumptions. Firstly, identifying the impact of the SEISS depends on whether there is a discontinuity in the probability of exposure at the cut-off. This means that there must be a noticeable change in the probability of claiming the SEISS on either side of the cut-off. Secondly, individuals have not manipulated the variable used to assess eligibility, in this case trading profits or the proportion of total income from trading profits. Thirdly, that there are no discontinuities in characteristics at the cut-off, so it is only the policy exposure that is discontinuous. This ensures that the characteristics are similar between the treatment and control groups and that behaviour would have been similar in the absence of a policy intervention, in this case the introduction of the SEISS.
2.1 Discontinuity in the variables to determine eligibility
To see if there were any distortions around the SEISS cut-off points (£50,000 and 50%), histograms of the ‘running variables’ (the variable being used to determine eligibility) were produced to see if there were any large jumps around the thresholds in the time before SEISS was introduced.
Figure 2.1: Histograms of the running variables used for the counterfactual analysis
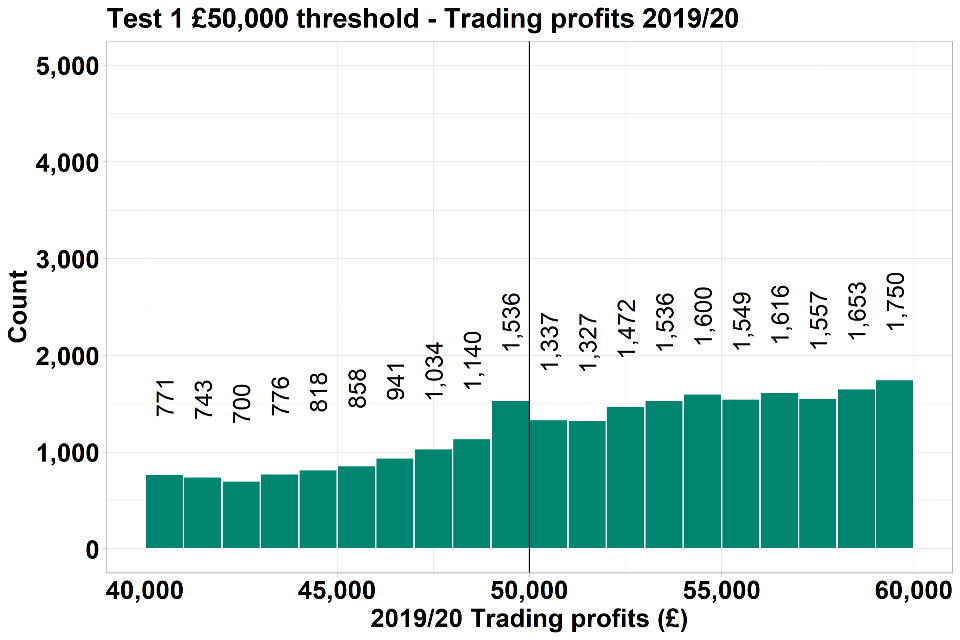
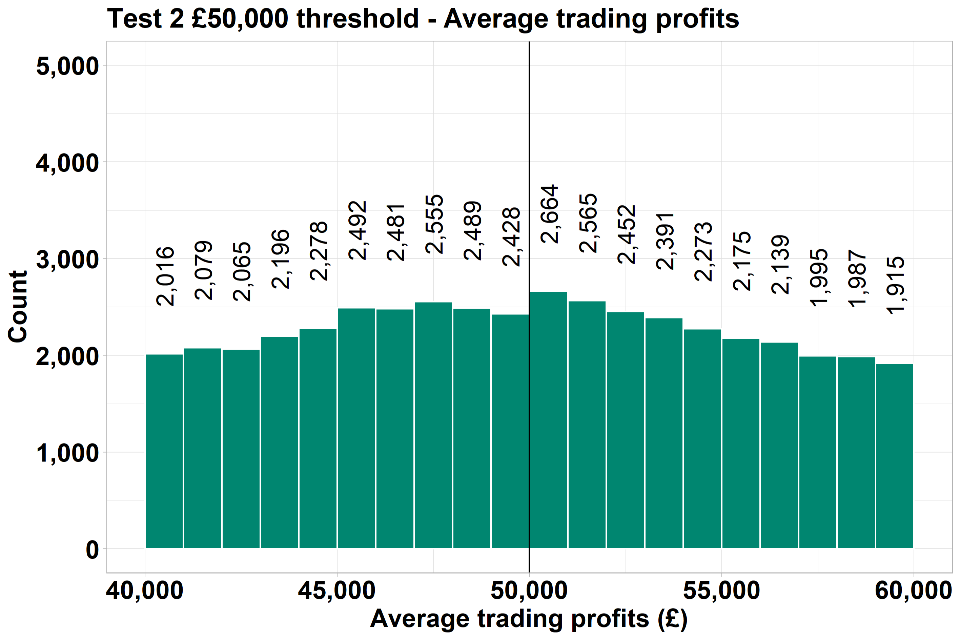


Source: HMRC SEISS data matched to Self Assessment taxpayer information
Notes: Only includes individuals if they filed at least one self-employed page on a Self Assessment return for 2019 to 2020, 2020 to 2021 and 2021 to 2022, and some outliers are removed.
Table 2.2: Histograms of running variables based on the £50,000 and 50% eligibility criteria
| Trading profits band | 2019/20 test count of individuals | Average test count of individuals |
|---|---|---|
| £40,000 to £41,000 | 771 | 2,016 |
| £41,000 to £42,000 | 743 | 2,079 |
| £42,000 to £43,000 | 700 | 2,065 |
| £43,000 to £44,000 | 776 | 2,196 |
| £44,000 to £45,000 | 818 | 2,278 |
| £45,000 to £46,000 | 858 | 2,492 |
| £46,000 to £47,000 | 941 | 2,481 |
| £47,000 to £48,000 | 1,034 | 2,555 |
| £48,000 to £49,000 | 1,140 | 2,489 |
| £49,000 to £50,000 | 1,536 | 2,428 |
| £50,000 to £51,000 | 1,337 | 2,664 |
| £51,000 to £52,000 | 1,327 | 2,565 |
| £52,000 to £53,000 | 1,472 | 2,452 |
| £53,000 to £54,000 | 1,536 | 2,391 |
| £54,000 to £55,000 | 1,600 | 2,273 |
| £55,000 to £56,000 | 1,549 | 2,175 |
| £56,000 to £57,000 | 1,616 | 2,139 |
| £57,000 to £58,000 | 1,557 | 1,995 |
| £58,000 to £59,000 | 1,653 | 1,987 |
| £59,000 to £60,000 | 1,750 | 1,915 |
| Trading profits as a proportion of total income band | 2019/20 test count of individuals | Average test count of individuals |
|---|---|---|
| 40% to 41% | 8,072 | 9,680 |
| 41% to 42% | 7,697 | 9,714 |
| 42% to 43% | 7,662 | 9,307 |
| 43% to 44% | 7,307 | 9,176 |
| 44% to 45% | 7,004 | 9,051 |
| 45% to 46% | 6,730 | 8,836 |
| 46% to 47% | 6,601 | 8,677 |
| 47% to 48% | 6,216 | 8,609 |
| 48% to 49% | 5,996 | 8,336 |
| 49% to 50% | 5,711 | 8,052 |
| 50% to 51% | 4,327 | 7,000 |
| 51% to 52% | 3,975 | 6,707 |
| 52% to 53% | 3,616 | 6,316 |
| 53% to 54% | 3,336 | 6,061 |
| 54% to 55% | 3,215 | 5,726 |
| 55% to 56% | 2,942 | 5,700 |
| 56% to 57% | 2,652 | 5,382 |
| 57% to 58% | 2,539 | 5,319 |
| 58% to 59% | 2,370 | 4,933 |
| 59% to 60% | 2,232 | 4,802 |
These charts show some differences between the height of the bars either side of both the £50,000 and 50% thresholds. If individuals adjust their trading profits or trading profits proportion of total income to become potentially eligible for the SEISS, then this could violate one of the assumptions of RDD, as it would mean access to the SEISS cannot be considered as good as random. If this is the case, bunching on the density of each of the running variables would be observed, meaning there would be lots of individuals just above or just below the threshold and the cut-off would be less clean.
Bunching and a pre-existing discontinuity may be expected around the £50,000 threshold, particularly in test 1. This may be due to other elements of the tax and benefit system such as the higher rate income tax threshold (£50,000 in 2019 to 2020), as well as the High Income Child Benefit Charge (HICBC) which applies over £50,000. It is also possible some individuals may have anticipated the eligibility criteria for SEISS remaining unchanged for the second year. As such some individuals may have targeted their trading profits or total income to be below these thresholds.
The McCrary density test[footnote 2] will show if there are any spikes around the cut-off and measures if these are statistically significant. These tests would be considered significant if the p value is less than 0.05. If this test is not significant and there is no bunching or peaks around the cut-off, then this is no strong evidence of distortions.
Table 2.3: McCrary test output
| Test | t-test statistic (p value) | Pass/Fail |
|---|---|---|
| Test 1 - £50,000 19/20 only | 0.0048 | Fail – Below 0.05 |
| Test 2 - £50,000 average only | 0.1253 | Pass – Above 0.05 |
| Test 3 – 50% 19/20 only | 0.0003 | Fail – Below 0.05 |
| Test 4 – 50% average only | 0.0000 | Fail – Below 0.05 |
The McCrary density tests ran using the ‘rddensity’ package in R show the t-test for the differences in the points on either side of the cut-off point in the plot. The value is significant (p<0.05) in tests 1, 3 and 4, and not significant in test 2. This indicates that there may be some bunching around the cut-off point when using 2019 to 2020 criteria only (tests 1 and 3). This may be because targeting only occurs close to thresholds, and so if income varies across the years that the average test is conducted over, this impact is smoothed out. This also indicates that test 4 does not meet the required assumptions to perform a valid RDD.
As a result of the McCrary test for tests 1, 3 and 4, the rest of the analysis in this report focuses on test 2, the average trading profits eligibility criteria, which appears to meet the criteria for RDD to be a valid analytical approach.
2.2 RDD methodology
Estimate selection
Throughout this report, nonparametric estimations of the impact of claiming the SEISS are presented and calculated using the ‘rdrobust’ package in R[footnote 3]. This views the estimation of treatment effects as local randomisation which means observations close to the cut-off point are considered to be as good as if they had been randomly assigned to the treatment or control group. This method uses local linear regression to search for the optimal data range within which a simple linear regression is run using only data points close to the cut-off. The following model is used to estimate the effect of claiming the SEISS on outcomes:
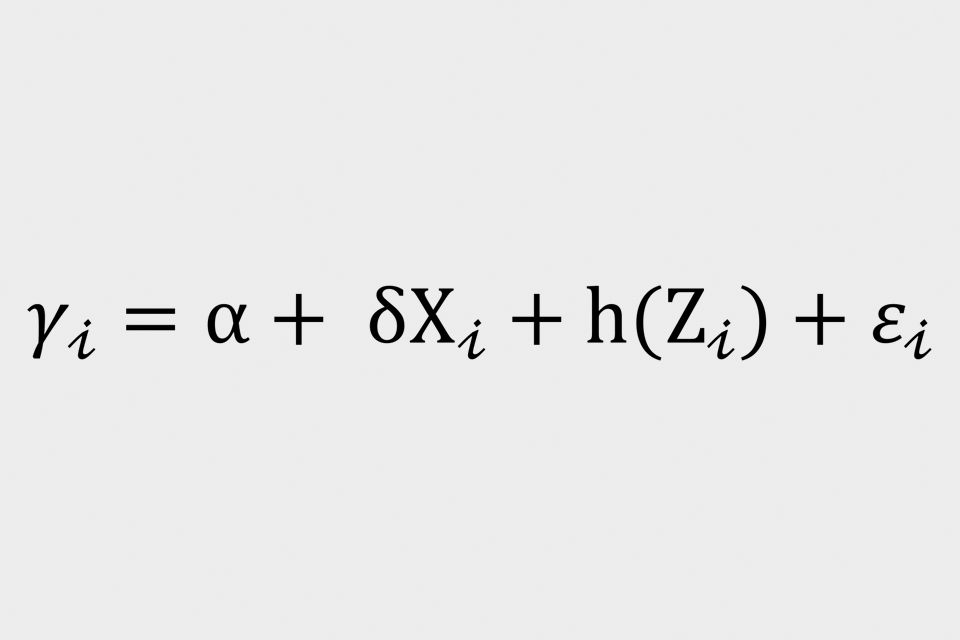
where ‘Yi’ is the outcome being measured (trading profits 2021 to 2022 or total income 2021 to 2022 or business survivability 2021 to 2022 based on declared cessations or business survivability 2020 to 2021 based on permanent cessations) for individual ‘i’. ‘Delta’ corresponds to the intent-to-treat effects, which represents the effect of eligibility on the outcomes. ‘Xi’ is an indicator function that takes the value 1 for those that claimed the SEISS and 0 for those who did not claim the SEISS. ‘Zi’ is the assignment variable that defines an observable clear cut off point. ‘h(Zi)’ is a flexible functional form. It is standard to centre the assignment variable at the cut-off point (at £50,000 threshold).
This method can produce a consistent estimate of the treatment effect in an RDD design[footnote 4] [footnote 5]. For example, in the case of our test, it may be argued that there is little difference in the characteristics of a trader with £49,000 and £51,000 of trading profits, but the difference gets larger further away from the threshold. The findings are therefore only applicable for a narrow band around the thresholds, where eligibility for the SEISS can be considered as good as random.
In a ‘fuzzy’ design, the LATE is estimated using the non-parametric Wald estimator, provided that the monotonicity assumption holds[footnote 6]. Monotonicity in this setting implies that the instrument (eligibility criteria) only affects the probability of receiving the SEISS in one direction for all individuals. In other words, a decrease in eligibility does not increase the probability of receiving SEISS grants, and vice versa. This means the probability of claiming the SEISS either side of the discontinuity is applied to the difference seen at the threshold in order to estimate the effect of receiving SEISS grants rather than simply the impact of being below or above the threshold.
Population groupings
To produce the RDD plots, the running variable (average trading profits) has been partitioned into ‘bins’ of 50 observations. The average within the bins is then plotted which makes it easier to observe if there is any discontinuity at the cut-off point. The bin sizes were picked informally by ensuring the bins were wide enough to reduce the impact of outliers but narrow enough to compare observations on either side of the cut-off by experimenting with different bandwidths for bins. Similarly, different functional forms were tested to see how sensitive results were to changes in the model. This analysis uses a simple local linear model. This model assumes that the relationship between the running variable and the outcome variable is a straight line.
2.3 Probability of claiming the SEISS
The following chart shows the probability of claiming the last 2 SEISS grants at different average trading profits amounts close to the eligibility threshold.
Figure 2.2: Probability of claiming the SEISS based on average trading profits (between 2016 to 2017 and 2019 to 2020) eligibility criteria

Source: HMRC SEISS data matched to Self Assessment taxpayer information
Sample size: Approximately 17,000 individuals
Notes: Only includes individuals if they filed at least one self-employed page on a Self Assessment return for 2019 to 2020, 2020 to 2021 and 2021 to 2022, and some outliers are removed. All individuals included were ineligible based on their 2019 to 2020 Self Assessment return alone.
Table 2.4: Probability of claiming SEISS based on average trading profits (between 2016 to 2017 and 2019 to 2020) eligibility criteria
| Running variable | Probability of claiming SEISS below discontinuity | Probability of claiming SEISS above discontinuity |
|---|---|---|
| Average trading profits (between years 2016 to 2017 and 2018 to 2019) eligibility criteria | 0.380 | 0.000 |
Figure 2.2 shows at the cut-off point of £50,000 the probability of claiming the SEISS drops from around 38% to zero. This demonstrates that the ‘fuzzy’ RDD approach is valid as the probability of claiming SEISS grants clearly changes at the cut-off point.
Chapter 3: Results
3.1 Impact on trading profits and total income
The charts below show the relationship between the running variable and the outcome for each of the tests both including and excluding SEISS grants. Key features of the chart are:
- the coloured dots which represent bins of 50 observations show the average outcome within each bin
- the coloured lines are linear regression lines
- the discontinuity is defined as the gap between the coloured lines right before and after the cut-off point
However, these charts only show the discontinuity of falling either side of the eligibility threshold and do not consider the probability of individuals either side of the threshold who actually claimed the SEISS. The estimates provided in table 3.2 account for the difference in the probability of claiming SEISS grants and therefore illustrate the true impact of the SEISS. These charts only show the ITT effect.
Figure 3.1a: RDD output for average trading profits (between 2016 to 2017 and 2019 to 2020) against trading profits in 2021 to 2022

Source: HMRC SEISS data matched to Self Assessment taxpayer information
Sample size: Approximately 17,000 individuals
Notes: Only includes individuals if they filed at least one self-employed page on a Self Assessment return for 2019 to 2020, 2020 to 2021 and 2021 to 2022, and some outliers are removed. All individuals included were ineligible based on their 2019 to 2020 Self Assessment return alone.
Table 3.1a RDD of average trading profits against trading profits in 2021 to 2022:
| Outcome variable | 2021 to 2022 trading profits with average trading profits under £50,000 - A | 2021 to 2022 trading profits with average trading profits over £50,000 - B | Difference A-B = C | Difference in probability of claiming SEISS either side of £50,000 discontinuity - D | Estimate = C/D |
|---|---|---|---|---|---|
| 21/22 trading profits including SEISS (£) | 58,472 | 56,428 | 2,044 | 0.380 | 5,379 |
| 21/22 trading profits excluding SEISS (£) | 54,605 | 56,428 | -1,823 | 0.380 | -4,797 |
Figure 3.1b: RDD output for average trading profits (between 2016 to 2017 and 2019 to 2020) against total income in 2021 to 2022

Source: HMRC SEISS data matched to Self Assessment taxpayer information
Sample size: Approximately 17,000 individuals
Notes: Only includes individuals if they filed at least one self-employed page on a Self Assessment return for 2019 to 2020, 2020 to 2021 and 2021 to 2022, and some outliers are removed. All individuals included were ineligible based on their 2019 to 2020 Self Assessment return alone.
Table 3.1b: RDD of average trading profits against total income in 2021 to 2022
| Outcome variable | 2021 to 2022 total income with average trading profits under £50,000 - A | 2021 to 2022 total income with average trading profits over £50,000 - B | Difference A-B = C | Difference in probability of claiming SEISS either side of £50,000 discontinuity - D | Estimate = C/D |
|---|---|---|---|---|---|
| 21/22 total income including SEISS (£) | 66,552 | 66,734 | -182 | 0.380 | -479 |
| 21/22 total income excluding SEISS (£) | 62,867 | 66,734 | -3,867 | 0.380 | -10,176 |
Figure 3.1a shows that excluding the SEISS grant (dark green), those assessed as potentially eligible based on average trading profits experienced 2021 to 2022 trading profits that were on average £1,823 (this is the gap at the £50,000 threshold in the top chart) lower than individuals who were assessed as ineligible on this threshold.
Figure 3.1b shows that excluding the SEISS grant (dark blue), those assessed as potentially eligible based on average trading profits experienced total incomes that were on average £3,867 lower in 2020 to 2021 than individuals who were assessed as ineligible on this threshold.
It can also be seen that around the £50,000 average trading profits threshold, 2021 to 2022 trading profits (excluding SEISS grants) were around £55,000. This compares to 2020 to 2021 average trading profits that were around £40,000 for individuals close to this threshold. This provides evidence that both those assessed as potentially eligible and those assessed as ineligible have started recovering to pre-pandemic levels of trading profits.
But these charts do not consider the probability of individuals either side of the threshold actually claiming the SEISS. To estimate the causal impact of claiming the SEISS, the difference in incomes for self-employed individuals who fall within the optimal bandwidth of the threshold is divided by the difference in the probability of claiming the SEISS around the threshold (38% at the threshold). Those assessed as potentially eligible would have had on average total incomes excluding the SEISS in 2021 to 2022 that were £9,860 lower (estimate shown in table 3.2 excluding SEISS grants) than individuals who were assessed as ineligible on this threshold.
Estimates are provided below in table 3.2 on the causal impact of claiming the SEISS on trading profits and total income in 2021 to 2022 both including and excluding the grants. It should be noted that the results presented below are only valid for self-employed individuals who fall within the optimal bandwidth either side of the £50,000 threshold. The test focuses in on a specific sub-section of the SEISS population and whilst the demographics of this group are broadly representative of the self-employed population there are some slight differences (see table B.1 in the annex) and as such these results may not be generalisable to the full self-employed population.
Table 3.2: Nonparametric estimation of the discontinuity for average trading profits on trading profits and total income in 2021 to 2022
| Estimate | 95% confidence interval (lower bound) | 95% confidence interval (upper bound) | Optimal bandwidth | Sample size | |
|---|---|---|---|---|---|
| Impact on 2021/22 trading profits | |||||
| Excluding SEISS | -£4,884 | -£11,427 | £1,659 | ± £3,457 | 17,329 |
| Including SEISS | £5,471 | -£1,054 | £11,996 | ± £3,457 | 17,329 |
| Impact on 2021/22 total income | |||||
| Excluding SEISS | -£9,860* | -£16,710 | -£3,010 | ± £3,331 | 16,667 |
| Including SEISS | £479 | -£6,350 | £7,308 | ± £3,331 | 16,675 |
*p<0.05
Table 3.2 shows that without the SEISS grants included, eligible claimants who just met the £50,000 threshold experienced trading profits that were on average £4,884 lower in 2021 to 2022 than individuals who were assessed as ineligible on this threshold and did not claim SEISS grants. However, this difference was not significant and therefore it cannot be ruled out that the difference between these groups is £0. In contrast, without the SEISS grants included, eligible claimants experienced total incomes that were on average £9,860 lower in 2021 to 2022 than individuals who were assessed as ineligible, with this finding being significant.
With the SEISS grants included, eligible claimants who just met the £50,000 threshold experienced trading profits that were on average £5,471 higher and total incomes that were on average £479 higher in 2021 to 2022 than individuals who were assessed as ineligible on this threshold and did not claim SEISS grants, however these findings were not significant.
These results indicate that receiving SEISS grants directly influenced total incomes in 2021 to 2022 for eligible claimants that just met the average years eligibility threshold compared to individuals who were assessed as ineligible on this threshold. However, it should be noted that these results are only valid for self-employed individuals who fall within the optimal bandwidth either side of the £50,000 threshold and may not be generalisable to the full self-employed population.
The finding that total incomes excluding SEISS grants was lower for those who claimed based on average trading profits than those who did not suggests a possible ‘income effect’. An income effect can occur when individuals reduce their working hours and substitute this for other activities as a result of having guaranteed income from another source, in this case from the SEISS grants.
However, this evidence is limited as results were not significant for trading profits excluding SEISS grants on the £50,000 test. Comparing the average values for trading profits and total income at the threshold suggests the majority of total income for individuals close to the threshold is sourced from trading profits. Furthermore, deeper analysis into the sources of other non-trading income has not shown any significant differences between individuals assessed as potentially eligible and those assessed as ineligible. This suggests self-employment income is driving much of the observed difference, however this is not translated into a statistically significant difference when isolating trading profits from total income.
Further analysis has indicated a difference in outcomes between self-employed individuals who are sole traders and those who are members of a partnership. Limiting the population to those with sole trader income has shown those assessed as potentially eligible based on average trading profits experienced trading profits excluding the SEISS grants that were on average around £2,000 lower in 2021 to 2022 than those assessed as ineligible as shown below in figure 3.2a, and this estimate increases to around £8,000 when adjusting for the proportion of the population claiming the SEISS. This difference is statistically significant at 10% level which suggests that income from the SEISS grants may have slightly disincentivised economic activity (an ‘income effect’) for sole traders, who have greater autonomy over their business, but there is less evidence of an impact for self-employed individuals who are members of a partnership.
Data is not available on hours worked by traders, so it cannot be identified for certain that an income effect has occurred. There is also no way to see what working hours may have been substituted for. It could be that individuals chose to take more leisure time, or they may have taken on socially beneficial activities such as caring or volunteering responsibilities.
Figure 3.2a: RDD output for average trading profits (between 2016 to 2017 and 2019 to 2020) against trading profits in 2021 to 2022, limited to those with sole trader income only and excludes members of a partnership

Source: HMRC SEISS data matched to Self Assessment taxpayer information
Sample size: Approximately 13,000 individuals
Notes: Limited to individuals with sole trader income and only includes individuals if they filed at least one self-employed page on a Self Assessment return for 2019 to 2020, 2020 to 2021 and 2021 to 2022, and some outliers are removed. All individuals included were ineligible based on their 2019 to 2020 Self Assessment return alone.
Table 3.3a: RDD of average trading profits against trading profits in 2021 to 2022
| Outcome variable | 2021 to 2022 trading profits with average trading profits under £50,000 - A | 2021 to 2022 trading profits with average trading profits over £50,000 - B | Difference A-B = C | Difference in probability of claiming SEISS either side of £50,000 discontinuity - D | Estimate = C/D |
|---|---|---|---|---|---|
| 21/22 trading profits including SEISS (£) | 57,288 | 55,234 | 2,054 | 0.380 | 5,405 |
| 21/22 trading profits excluding SEISS (£) | 53,077 | 55,234 | -2,157 | 0.380 | -5,676 |
Figure 3.2b: RDD output for average trading profits (between 2016 to 2017 and 2019 to 2020) against total income in 2021 to 2022, limited to those with sole trader income only and excludes members of a partnership

Source: HMRC SEISS data matched to Self Assessment taxpayer information
Sample size: Approximately 12,000 individuals
Notes: Limited to individuals with sole trader income and only includes individuals if they filed at least one self-employed page on a Self Assessment return for 2019 to 2020, 2020 to 2021 and 2021 to 2022, and some outliers are removed. All individuals included were ineligible based on their 2019 to 2020 Self Assessment return alone.
Table 3.3b: RDD of average trading profits against total income in 2021 to 2022
| Outcome variable | 2021 to 2022 total income with average trading profits under £50,000 - A | 2021 to 2022 total income with average trading profits over £50,000 - B | Difference A-B = C | Difference in probability of claiming SEISS either side of £50,000 discontinuity - D | Estimate = C/D |
|---|---|---|---|---|---|
| 21/22 total income including SEISS (£) | 64,916 | 64,053 | 863 | 0.380 | 2,271 |
| 21/22 total income excluding SEISS (£) | 60,701 | 64,053 | -3,352 | 0.380 | -8,821 |
3.2 Impact on business survivability
Figure 3.3: RDD output for average trading profits (between years 2016 to 2017 and 2019 to 2020) against probability of remaining self-employed in 2021 to 2022

Source: HMRC SEISS data matched to Self Assessment taxpayer information
Sample size: Approximately 17,000 individuals
Notes: Only includes individuals if they filed at least one self-employed page on a Self Assessment return for 2019 to 2020, 2020 to 2021 and 2021 to 2022, and some outliers are removed. All individuals included were ineligible based on their 2019 to 2020 Self Assessment return alone.
Table 3.4: RDD of average trading profits against probability of remaining self-employed in 2021 to 2022
| Outcome variable | 2021 to 2022 business survivability with average trading profits under £50,000 - A | 2021 to 2022 business survivability with average trading profits over £50,000 - B | Difference A-B = C | Difference in probability of claiming SEISS either side of £50,000 discontinuity - D | Estimate = C/D |
|---|---|---|---|---|---|
| 21/22 probability of remaining self-employed (%) | 0.959 | 0.955 | 0.004 | 0.380 | 0.01 |
Estimates are provided below in table 3.5 on the causal impact of claiming the SEISS on businesses continuing to trade in 2021 to 2022. For this analysis business survivability at an individual level is calculated by subtracting the count of declared business cessations from the count of declared total businesses reported in Self Assessment returns in 2021 to 2022.
Table 3.5: Nonparametric estimation of the discontinuity for average trading profits on business survivability in 2021 to 2022
| Estimate | 95% confidence interval (lower bound) | 95% confidence interval (upper bound) | Optimal bandwidth | Sample size | |
|---|---|---|---|---|---|
| Impact on 2021/22 remain self-employed probability | |||||
| Average trading profits | 0.01 | -0.025 | 0.044 | ± £3,366 | 16,859 |
Table 3.5 shows that eligible claimants who just met the £50,000 average trading profits eligibility threshold were 1 percentage point more likely to remain in self-employment in 2021 to 2022 than individuals who were assessed as ineligible on this threshold and did not claim the SEISS, but this result is small and not statistically significant.
3.3 Impact on business survivability using permanent cessations
Due to the lag in Self Assessment data, it is not straightforward to determine if a business has closed permanently. In the SEISS interim evaluation we used declared cessation rates to estimate business closures, but it was not possible to determine if declared cessation dates represented permanent or temporary closures, or whether an individual started an alternative business in the next tax year.
Following receipt of 2021 to 2022 Self Assessment returns it is now possible to use a more robust approach in identifying true business cessations that occurred during the first year of the pandemic For purposes of this analysis permanent cessations during 2020 to 2021 have been defined as individuals that had traded or attempted to trade during that year and then either not asked to file a tax return for 2021 to 2022 indicating they had informed HM Revenue and Customs (HMRC) they had stopped trading, or they had submitted a tax return for 2021 to 2022 for reasons other than trading.
Figure 3.4 shows the probability of claiming the first 3 SEISS grants at different average trading profits amounts close to the eligibility threshold.
Figure 3.4 Probability of claiming the SEISS based on average trading profits (between 2016 to 2017 and 2018 to 2019) eligibility criteria

Source: HMRC SEISS data matched to Self Assessment taxpayer information
Sample size: Approximately 12,000 individuals
Notes: Only includes potentially eligible non-claimants and or assessed as ineligible individuals if they filed at least one self-employed page on a Self Assessment return for both 2019 to 2020 and 2020 to 2021, and some outliers are removed. All individuals included were ineligible based on their 2018 to 2019 Self Assessment return alone.
Table 3.6: Probability of claiming SEISS based on average trading profits (between 2016 to 2017 and 2018 to 2019) eligibility criteria
| Running variable | Probability of claiming SEISS below discontinuity | Probability of claiming SEISS above discontinuity | |
|---|---|---|---|
| Average trading profits (between 2016 to 2017 and 2018 to 2019) eligibility criteria | 0.781 | 0.001 |
Figure 3.5 RDD output for average trading profits (between 2016 to 2017 and 2018 to 2019) against probability of remaining self-employed in 2020 to 2021 based on permanent cessations

Source: HMRC SEISS data matched to Self Assessment taxpayer information
Sample size: Approximately 12,000 individuals
Notes: Only includes potentially eligible non-claimants and or assessed as ineligible individuals if they filed at least one self-employed page on a Self Assessment return for both 2019 to 2020 and 2020 to 2021, and some outliers are removed. All individuals included were ineligible based on their 2018 to 2019 Self Assessment return alone.
Table 3.7: RDD of average trading profits against probability of remaining self-employed in 2020 to 2021 based on permanent cessations
| Outcome variable | 2020 to 2021 business survivability based on permanent cessations with average trading profits under £50,000 - A | 2020 to 2021 business survivability based on permanent cessations with average trading profits over £50,000 - B | Difference A-B = C | Difference in probability of claiming SEISS either side of £50,000 discontinuity - D | Estimate = C/D |
|---|---|---|---|---|---|
| 20/21 probability of remaining self-employed based on permanent cessations (%) | 0.950 | 0.930 | 0.020 | 0.750 | 0.027 |
Figure 3.5 shows those assessed as potentially eligible based on average trading profits were 2 percentage points (this is the gap at the £50,000 threshold) more likely to remain trading in 2020 to 2021 than individuals who were assessed as ineligible on this threshold. But these charts do not consider the probability of individuals either side of the threshold claiming the SEISS. To estimate the causal impact of claiming the SEISS, the business survivability rate for self-employed individuals who fall within the optimal bandwidth of the threshold (2 percentage points at the threshold) is divided by the difference in the probability of claiming the SEISS around the threshold (75% at the threshold). This shows that eligible claimants were 2.8 percentage points more likely to remain trading in 2020 to 2021 than those assessed as ineligible. This result is significant at the 5% level.
Estimates are provided below in table 3.8 on the causal impact of claiming the SEISS on businesses continuing to trade in 2020 to 2021 based on permanent cessations. Following receipt of 2021 to 2022 tax returns it is now possible to use a more robust approach in identifying actual business cessations that occurred during the first year of the pandemic than cessation dates as declared on 2020 to 2021 Self Assessment returns. This more robust approach shows that using declared cessations provides an underestimate of true business closures.
Table 3.8: Nonparametric estimation of the discontinuity on business survivability based on permanent cessations
| Estimate | 95% confidence interval (lower bound) | 95% confidence interval (upper bound) | Optimal bandwidth | Sample size | |
|---|---|---|---|---|---|
| Impact on 2020/21 remaining self-employed probability | |||||
| Average trading profits | 0.028* | 0.002 | 0.053 | ± £2,234 | 11,645 |
*p<0.05
Table 3.8 shows that eligible claimants who just met the £50,000 average trading profits eligibility threshold were 2.8 percentage points more likely to remain permanently trading in 2020 to 2021 than individuals who were assessed as ineligible on this threshold and did not claim the SEISS. This result is significant at 5% level.
But it should be noted that this analysis uses a specific sub-section of the SEISS population and therefore findings cannot be generalised to the entire population of SEISS recipients. However, given that this eligibility threshold was set at a relatively higher income within the self-employed population, and that results are significant at this point, it is likely that the impact of business survival on businesses with smaller profits was more pronounced. The average SEISS claim was less than £3,000 for each grant, whereas the population assessed here will have been eligible for the maximum amount of the first 3 grants (£7,500 for the first and third grants, £6,570 for the second grant). The RDD approach provides strong evidence that the differences in businesses continuing to trade in 2020 to 2021 (shown above) can be attributed to SEISS grants rather than other factors.
Chapter 4: Robustness analysis
This chapter discusses robustness checks conducted to support the estimates reported in this note.
4.1 Placebo effect and changing thresholds
The robustness of the empirical strategy was tested by falsifying underlying identifying assumptions, either using different thresholds, running variables or outcomes. This is because observing there is no discontinuity at a threshold with no relationship to the SEISS rules, supports the case for the impact at the £50,000 average trading profits threshold being a causal impact of the SEISS. For the same reason, tests are performed on other tax years which are not impacted by the SEISS. If no result is seen in these years, this increases confidence that any finding in the SEISS years can be attributed to the scheme.
The first set of placebo tests use the ‘across year’ average trading profits with incomplete data, including average trading profits of 2016 to 2017 through to 2018 to 2019, and analyses the impact on 2019 to 2020 trading profits and total incomes.
Figure 4.1a: RDD output for £50,000 placebo tests – average trading profits (between 2016 to 2017 and 2018 to 2019) against trading profits in 2019 to 2020

Source: HMRC SEISS data matched to Self Assessment taxpayer information
Sample size: Approximately 6,000 individuals
Notes: Only includes individuals if they filed at least one self-employed page on a Self Assessment return for 2019 to 2020, 2020 to 2021 and 2021 to 2022, and some outliers are removed. All individuals included were ineligible based on their 2018 to 2019 Self Assessment return alone.
Table 4.1a: RDD for £50,000 placebo tests - average trading profits (between 2016 to 2017 and 2018 to 2019) against trading profits in 2019 to 2020
| Outcome variable | Below £50,000 discontinuity | Above £50,000 discontinuity |
|---|---|---|
| 19/20 trading profits (£) | 45,145 | 42,829 |
Figure 4.1b: RDD output for £50,000 placebo tests – average trading profits (between 2016 to 2017 and 2018 to 2019) against total income in 2019 to 2020

Source: HMRC SEISS data matched to Self Assessment taxpayer information
Sample size: Approximately 5,000 individuals
Notes: Only includes individuals if they filed at least one self-employed page on a Self Assessment return for 2019 to 2020, 2020 to 2021 and 2021 to 2022, and some outliers are removed. All individuals included were ineligible based on their 2018 to 2019 Self Assessment return alone.
Table 4.1b: RDD for £50,000 placebo tests - average trading profits (between 2016 to 2017 and 2018 to 2019) against total income in 2019 to 2020
| Outcome variable | Below £50,000 discontinuity | Above £50,000 discontinuity |
|---|---|---|
| 19/20 total income (£) | 56,336 | 56,631 |
Figures 4.1a and 4.1b show that there are small but not statistically significant pre-existing discontinuities between individuals just below the £50,000 threshold with those just above the £50,000 threshold. These results improve the internal validity of the estimates by demonstrating that in the absence of treatment (the SEISS grant), there is no significant evidence of a discontinuity in the outcome trading profits variables.
The second set of placebo tests use a different threshold of average trading profits of £40,000. The expectation is to find that there are no sharp discontinuities around the cut-off when using a £40,000 threshold as this threshold does not have any impact on SEISS eligibility.
Figure 4.2a: RDD output for £40,000 placebo tests – average trading profits (between 2016 to 2017 and 2019 to 2020) against trading profits in 2021 to 2022

Source: HMRC SEISS data matched to Self Assessment taxpayer information
Sample size: Approximately 48,000 individuals
Notes: Only includes individuals if they filed at least one self-employed page on a Self Assessment return for 2019 to 2020, 2020 to 2021 and 2021 to 2022, and some outliers are removed. All individuals included were ineligible based on their 2019 to 2020 Self Assessment return alone.
Table 4.2a: RDD for £40,000 placebo tests - average trading profits against trading profits in 2021 to 2022
| Outcome variable | Below £40,000 discontinuity | Above £40,000 discontinuity |
|---|---|---|
| 21/22 trading profits including SEISS (£) | 46,306 | 46,856 |
| 21/22 trading profits excluding SEISS (£) | 41,369 | 40,881 |
Figure 4.2b: RDD output for £40,000 placebo tests – average trading profits (between 2016 to 2017 and 2019 to 2020) against total income in 2021 to 2022

Source: HMRC SEISS data matched to Self Assessment taxpayer information
Sample size: Approximately 42,000 individuals
Notes: Only includes individuals if they filed at least one self-employed page on a Self Assessment return for 2019 to 2020, 2020 to 2021 and 2021 to 2022, and some outliers are removed. All individuals included were ineligible based on their 2019 to 2020 Self Assessment return alone.
Table 4.2b: RDD for £40,000 placebo tests - average trading profits against total income in 2021 to 2022
| Outcome variable | Below £40,000 discontinuity | Above £40,000 discontinuity |
|---|---|---|
| 21/22 total income including SEISS (£) | 53,687 | 53,043 |
| 21/22 total income excluding SEISS (£) | 48,766 | 48,066 |
The result of the £40,000 placebo test increases the confidence in the validity of the research design and findings from £50,000 average trading profits test given that there are no significant discontinuities at this threshold.
The final placebo test uses the ‘across year’ average trading profits, including average trading profits of 2016 to 2017 and 2017 to 2018, and analyses the impact on 2019 to 2020 business survivability based on permanent cessations as the outcome variable.
Figure 4.3: RDD output for £50,000 placebo tests – average trading profits (between 2016 to 2017 and 2017 to 2018) against probability of business survivability in 2019 to 2020 based on permanent cessations

Source: HMRC SEISS data matched to Self Assessment taxpayer information
Sample size: Approximately 13,000 individuals
Notes: Only includes potentially eligible non-claimants and or assessed as ineligible individuals if they filed at least one self-employed page on a Self Assessment return for both 2019 to 2020 and 2020 to 2021, and some outliers are removed. All individuals included were ineligible based on their 2017 to 2018 Self Assessment return alone.
Table 4.3: RDD for £50,000 placebo tests - average trading profits (between 2016 to 2017 and 2017 to 2018) against probability of business survivability in 2019 to 2020 based on permanent cessations
| Outcome variable | Below £50,000 discontinuity | Above £50,000 discontinuity |
|---|---|---|
| 19/20 probability of remaining self-employed based on permanent cessations (%) | 0.986 | 0.990 |
Figure 4.3 shows that there is a small but not statistically significant pre-existing discontinuity between individuals just below the £50,000 threshold with those just above the £50,000 threshold. These results improve the internal validity of the estimate of business survivability based on permanent cessations by demonstrating that in the absence of the SEISS grant, there is no significant evidence of a discontinuity.
4.2 Density testing
Another robustness check is related to the discontinuity of the running variable in previous years. Histograms are used to see if there are any big changes in trend around the £50,000 threshold used for the RDD analysis and around the £40,000 threshold used in the placebo test.
Figure 4.4: Histograms for placebo tests of average trading profits up to 2017 to 2018, average trading profits up to 2018 to 2019 and average trading profits around £40,000


Source: HMRC SEISS data matched to Self Assessment taxpayer information
Notes: Only includes individuals if they filed at least one self-employed page on a Self Assessment return for 2019 to 2020, 2020 to 2021 and 2021 to 2022, and some outliers are removed.
Table 4.4: Histograms for placebo tests of average trading profits up to 2017 to 2018, average trading profits up to 2018 to 2019 and average trading profits around £40,000
| Trading profits band for placebo test on average trading profits between 2016 to 2017 and 2017 to 2018 | Count of individuals |
|---|---|
| £40,000 to £41,000 | 991 |
| £41,000 to £42,000 | 1,083 |
| £42,000 to £43,000 | 1,190 |
| £43,000 to £44,000 | 1,299 |
| £44,000 to £45,000 | 1,385 |
| £45,000 to £46,000 | 1,549 |
| £46,000 to £47,000 | 1,721 |
| £47,000 to £48,000 | 1,927 |
| £48,000 to £49,000 | 2,215 |
| £49,000 to £50,000 | 2,301 |
| £50,000 to £51,000 | 2,418 |
| £51,000 to £52,000 | 2,545 |
| £52,000 to £53,000 | 2,469 |
| £53,000 to £54,000 | 2,371 |
| £54,000 to £55,000 | 2,410 |
| £55,000 to £56,000 | 2,348 |
| £56,000 to £57,000 | 2,299 |
| £57,000 to £58,000 | 2,198 |
| £58,000 to £59,000 | 2,089 |
| £59,000 to £60,000 | 2,092 |
| Trading profits band for placebo test on average trading profits between 2016 to 2017 and 2018 to 2019 | Count of individuals |
|---|---|
| £40,000 to £41,000 | 860 |
| £41,000 to £42,000 | 746 |
| £42,000 to £43,000 | 738 |
| £43,000 to £44,000 | 735 |
| £44,000 to £45,000 | 783 |
| £45,000 to £46,000 | 752 |
| £46,000 to £47,000 | 756 |
| £47,000 to £48,000 | 740 |
| £48,000 to £49,000 | 751 |
| £49,000 to £50,000 | 795 |
| £50,000 to £51,000 | 776 |
| £51,000 to £52,000 | 802 |
| £52,000 to £53,000 | 841 |
| £53,000 to £54,000 | 812 |
| £54,000 to £55,000 | 833 |
| £55,000 to £56,000 | 899 |
| £56,000 to £57,000 | 878 |
| £57,000 to £58,000 | 892 |
| £58,000 to £59,000 | 967 |
| £59,000 to £60,000 | 1,009 |
| Trading profits band for £40,000 placebo test on average trading profits between 2016 to 2017 and 2019 to 2020 | Count of Individuals |
|---|---|
| £30,000 to £31,000 | 4,196 |
| £31,000 to £32,000 | 4,580 |
| £32,000 to £33,000 | 4,881 |
| £33,000 to £34,000 | 5,237 |
| £34,000 to £35,000 | 5,302 |
| £35,000 to £36,000 | 5,682 |
| £36,000 to £37,000 | 5,892 |
| £37,000 to £38,000 | 6,253 |
| £38,000 to £39,000 | 6,575 |
| £39,000 to £40,000 | 6,448 |
| £40,000 to £41,000 | 6,777 |
| £41,000 to £42,000 | 6,661 |
| £42,000 to £43,000 | 6,230 |
| £43,000 to £44,000 | 6,100 |
| £44,000 to £45,000 | 5,679 |
| £45,000 to £46,000 | 5,455 |
| £46,000 to £47,000 | 5,043 |
| £47,000 to £48,000 | 4,687 |
| £48,000 to £49,000 | 4,261 |
| £49,000 to £50,000 | 3,961 |
From these charts, there does not appear to be a significant change around the cut-off in any of the placebo tests, although there are some small visible differences between the height of the bars at the £50,000 and £40,000 thresholds.
To check if these differences are statistically significant a McCrary density test is used. The McCrary density tests show the t-test for the difference in the points on either side of the cut-off points. The value is not significant for any of the placebo tests at the different cut-off points indicating there is likely no pre-existing distortion around the cut-off point.
4.3 Additional robustness checks
Table B.1 in Annex B shows a slightly higher proportion of individuals in the construction sector in the treatment group compared to the control group which could indicate small levels of manipulation of trading profits by construction workers to become eligible claimants. As such the income analyses RDD’s were replicated excluding construction workers. With this sector excluded, similar estimates were obtained which increases the confidence in the overall findings.
The incomes analyses presented in Chapter 3.1 includes businesses that had stopped trading during 2021 to 2022 which may have resulted in an expected fall in profits both including and excluding the SEISS around the £50,000 threshold. As such the income analyses RDD’s were replicated excluding individuals that stated they had stopped trading in 2021 to 2022. With these individuals excluded, similar estimates were obtained which increases the confidence in the overall findings.
4.4 Other analytical methods considered
The following lists the other techniques that were considered for the counterfactual analysis, with reasons why these methods were not appropriate:
- Difference in difference – a key assumption for this method to be valid is the existence of parallel trends between the treatment and control (potentially eligible and assessed as ineligible) groups for the policy intervention. Due to the high churn of the self-employed population, this meant establishing a pre-pandemic common trend was challenging
- Propensity score matching – this is a complex technique which relies on being able to predict if an individual would claim the SEISS. Due to the various eligibility criteria, this meant matching scores were likely to be low and therefore this method was not appropriate
- Instrumental variables – there was no obvious instrument as potential instruments (profits and self-employment income as a share of total income) could both be associated with the outcome variables anyway
Annex A
The optimal bandwidths for each outcome variable are given in the tables below.
Table A.1: Optimal bandwidth selections for average trading profits eligibility criteria when assessing the impact of SEISS eligibility
| Test | Trading profits, excluding SEISS | Trading profits, including SEISS | Total income, excluding SEISS | Total income, including SEISS | Business survivability |
|---|---|---|---|---|---|
| £50,000 average only | £3,034 | £3,070 | £2,918 | £2,938 | £3,954 |
Table A.2: Optimal bandwidth selections for average trading profits eligibility criteria when assessing the impact of claiming the SEISS grants
| Test | Trading profits, excluding SEISS | Trading profits, including SEISS | Total income, excluding SEISS | Total income, including SEISS | Business survivability |
|---|---|---|---|---|---|
| £50,000 average only | £3,457 | £3,457 | £3,331 | £3,331 | £3,366 |
Taking into consideration the optimal bandwidths, the sample size for each group is presented in the tables below. Detailed characteristics of the samples are provided in Annex B.
Table A.3: Sample sizes for RDD test groups with trading profits in 2021 to 2022 as outcome variable
| Test | Excluding SEISS: assessed as potentially eligible | Excluding SEISS: assessed as ineligible | Including SEISS: assessed as potentially eligible | Including SEISS: assessed as ineligible |
|---|---|---|---|---|
| £50,000 average only | 8,533 | 8,796 | 8,533 | 8,796 |
Table A.4: Sample sizes for RDD test groups with total incomes in 2021 to 2022 as outcome variable
| Test | Excluding SEISS: assessed as potentially eligible | Excluding SEISS: assessed as ineligible | Including SEISS: assessed as potentially eligible | Including SEISS: assessed as ineligible |
|---|---|---|---|---|
| £50,000 average only | 22,777 | 22,558 | 8,213 | 8,462 |
Table A.5: Sample sizes for RDD test groups with business survivability in 2021 to 2022 as outcome variable
| Test | Assessed as potentially eligible | Assessed as ineligible |
|---|---|---|
| £50,000 average only | 8,308 | 8,551 |
Table A.6: Sample sizes for RDD test groups with business survivability in 2020 to 2021 based on permanent cessations as outcome variable
| Test | Assessed as potentially eligible | Assessed as ineligible |
|---|---|---|
| £50,000 average only | 5,705 | 5,940 |
Annex B
Outputs of the characteristics of the maximum sample size of the average trading profits test treatment and control group as proportion of the population compared to that of the full self-employed population.
Table B.1: Size of £50,000 average trading profits test compared to the full self-employed population in 2021 to 2022
| Population group | Treatment | Control | Self-employed population in 21/22 |
|---|---|---|---|
| Count of population | 17,388 | 12,928 | 5,155,528 |
Table B.2: Gender of £50,000 average trading profits test compared to the full self-employed population in 2021 to 2022
| Proportion of population by gender | Treatment | Control | Self-employed population in 21/22 |
|---|---|---|---|
| Male | 72% | 70% | 64% |
| Female | 28% | 30% | 36% |
Table B.3: Age range of £50,000 average trading profits test compared to the full self-employed population in 2021 to 2022
| Proportion of population by age range | Treatment | Control | Self-employed population in 21/22 |
|---|---|---|---|
| 16-24 | 0% | 0% | 3% |
| 25-34 | 11% | 10% | 17% |
| 35-44 | 23% | 22% | 22% |
| 45-54 | 27% | 27% | 22% |
| 55-64 | 24% | 24% | 22% |
| 65+ | 14% | 16% | 14% |
Table B.4: Region of £50,000 average trading profits test compared to the full self-employed population in 2021 to 2022
| Proportion of population by region | Treatment | Control | Self-employed population in 21/22 |
|---|---|---|---|
| East Midlands | 6% | 6% | 6% |
| East of England | 12% | 12% | 10% |
| London | 17% | 17% | 18% |
| North East | 2% | 3% | 3% |
| North West and Merseyside | 6% | 7% | 9% |
| Northern Ireland | 4% | 4% | 3% |
| Scotland | 7% | 8% | 6% |
| South East | 18% | 18% | 15% |
| South West | 10% | 10% | 10% |
| Unknown | 0% | 0% | 0% |
| Wales | 3% | 3% | 4% |
| West Midlands | 7% | 6% | 8% |
| Yorkshire and the Humber | 6% | 6% | 7% |
Table B.5: Sector of £50,000 average trading profits test compared to the full self-employed population in 2021 to 2022
| Proportion of population by sector | Treatment | Control | Self-employed population in 21/22 |
|---|---|---|---|
| Accommodation and food service activities | 2% | 2% | 2% |
| Administrative and support services | 2% | 2% | 8% |
| Agriculture, forestry and fishing | 7% | 7% | 4% |
| Arts, entertainment and recreation | 4% | 4% | 4% |
| Construction | 25% | 20% | 24% |
| Education | 2% | 2% | 4% |
| Financial and insurance activities | 3% | 3% | 1% |
| Human health and social work activities | 12% | 15% | 6% |
| Information and communication | 3% | 3% | 1% |
| Manufacturing | 3% | 3% | 2% |
| Other service activities | 2% | 2% | 6% |
| Professional, scientific and technology | 15% | 17% | 8% |
| Public administration and defence | 0% | 0% | 0% |
| Real estate activities | 1% | 1% | 1% |
| Transportation and storage | 2% | 2% | 7% |
| Wholesale and retail trade; repair of motor vehicles and motorcycles | 7% | 7% | 5% |
| Unknown and other | 10% | 10% | 17% |
-
Lee, Munk (2008) Using regression discontinuity design for program evaluation ↩
-
McCrary (2008) Manipulation of the running variable in the regression discontinuity design: A density test ↩
-
Calonico, Cattaneo and Titiunik (2015). Rdrobust: An R Package for Robust Nonparametric Inference in Regression-Discontinuity Designs ↩
-
Lee and Lemieux (2010) Regression Discontinuity Designs in Economics ↩
-
Hahn, Todd, Klaauw (2001) Identification and Estimation of Treatment Effects with a Regression-Discontinuity Design ↩
-
Angrist and Pischke (2008) Chapter 4. Instrumental Variables in Action: Sometimes You Get What You Need. Mostly Harmless Econometrics: An Empiricist’s Companion, Princeton: Princeton University Press ↩