Adult substance misuse treatment statistics 2019 to 2020: report
Published 26 November 2020
Applies to England

© Crown copyright 2020
This publication is licensed under the terms of the Open Government Licence v3.0 except where otherwise stated. To view this licence, visit nationalarchives.gov.uk/doc/open-government-licence/version/3 or write to the Information Policy Team, The National Archives, Kew, London TW9 4DU, or email: psi@nationalarchives.gov.uk.
Where we have identified any third party copyright information you will need to obtain permission from the copyright holders concerned.
This publication is available at https://www.gov.uk/government/statistics/substance-misuse-treatment-for-adults-statistics-2019-to-2020/adult-substance-misuse-treatment-statistics-2019-to-2020-report
1. Main findings
1.1 Trends in treatment numbers
There were 270,705 adults in contact with drug and alcohol services between April 2019 and March 2020. This is similar to the previous year (268,251).
The number of adults entering treatment in 2019 to 2020 was 132,124, which is also very similar to the previous year’s figure (132,210 in 2018 to 2019). The numbers of people entering treatment for the first time now seem to have stabilised after falling steadily since 2013 to 2014.
1.2 Trends in substance use
The number of people in treatment for opiate use was similar to the previous year (going up slightly from 139,845 to 140,599). Over half (52%) the adults in treatment were there for problems with opiates, and this remains the largest substance group. Section 2.1 has more information about what the different substance groups are.
People in treatment for alcohol alone make up the next largest group (28%) of all adults in treatment. The number of those fell by 1% since the previous year (from 75,555 to 74,618) and follows a large year-on-year decline from a peak of 91,651 in 2013 to 2014.
There were increases in the other 2 substance groups (a 4% increase in the non-opiate group and 6% in the non-opiate and alcohol group). This follows a similar small rise last year.
There has been a rise in the number of adults entering treatment for crack cocaine. This includes people who are using crack with opiates (24,363 to 25,043) and those who are using crack without opiates (4,535 to 4,651).
This is the fifth year in a row that the numbers of people entering treatment for crack have risen. The number is now 36% higher than in 2013 to 2014.
People starting treatment in 2019 to 2020 with powder cocaine problems increased by 7% (from 20,084 to 21,396). This continues a gradual rise over the last 9 years, with numbers of new treatment entries for powder cocaine now 52% higher than in 2011 to 2012.
The increases in people coming to treatment with crack and powder cocaine problems are likely to be related to a surge in global cocaine production. This surge has lowered prices and increased purity. There have also been changes in distribution and supply, such as ‘county lines’ drug dealing operations.
Although the numbers are relatively low, there was an increase in adults entering treatment in 2019 to 2020 with ketamine problems (from 960 in 2018 to 2019 to 1,140 this year). This is a 19% rise in one year and is part of a trend in rising numbers entering treatment over the last 6 years. The total is now more than two and a half times higher than it was in 2014 to 2015.
1.3 Housing and mental ill health
Nearly one fifth (19%, or 24,369) of adults entering treatment last year said they had a housing problem. This proportion varied by substance group, ranging from 1 in 10 (10%, or 4,942) of those starting treatment for alcohol problems alone, and almost a third (32%, or 13,315) of those starting treatment for problems with opiate use. People starting treatment for problems with new psychoactive substances (NPS) had the highest proportion of housing need of any substance group (45%).
For adults starting treatment, 59% said they had a mental health treatment need. This is an increase on the previous year (from 53% to 59%). Over half of new starters in all substance groups needed mental health treatment. This need ranged from 54% in the opiate group to nearly two-thirds (65%) of the non-opiates and alcohol group.
1.4 Treatment exits and deaths in treatment
There were 117,678 people who exited the drug and alcohol treatment system in 2019 to 2020. Just under half (47%) of those left having successfully completed their treatment, free from dependence. This is a small reduction in the proportion of people who successfully completed treatment since the previous year (from 48% to 47%).
The total number of people who died while in contact with treatment services in 2019 to 2020 was 2,929 (1.1% of all adults in treatment). This is a similar number to last year (2,889, or 1.1% of all adults in treatment).
There was a 6% increase in deaths of opiate users in treatment this year (from 1,897 to 2,010). All other substance groups saw a decrease in deaths compared to last year. The non-opiate and alcohol group had a 6.1% decrease, while the alcohol only group had a 7.3% decrease and the non-opiate only group had an 11.3% decrease.
Drug use is a significant cause of premature death in England, as the Office for National Statistics drug poisoning data has shown. In England, the number of deaths from drug misuse registered in 2019 was 2,685, which is the highest level since records began.
1.5 Smoking among people in treatment
Over 49,000 people (58%) said they had smoked tobacco in the 28 days before starting treatment. Across all substance groups, the level of smoking for males and females was substantially higher than the smoking rate of the general adult population, 15.9% for males and 12.5% for females.
Despite the high levels of smoking, only 3% of people were recorded as having been offered referrals for smoking cessation interventions.
2. People in treatment: substance, sex, age
2.1 Overview
The National Drug Treatment Monitoring System (NDTMS) statistics report presents information on adults (aged 18 and over) who were receiving help in England for problems with drugs and alcohol in the period 1 April 2019 to 31 March 2020.
Many people experience difficulties with and receive treatment for both substances. While they often share many similarities, they also have clear differences, so this report divides people in treatment into the 4 substance groups which are:
- opiate - people who are dependent on or have problems with opiates, mainly heroin
- non-opiate - people who have problems with non-opiate drugs only, such as cannabis, crack and ecstasy
- non-opiate and alcohol - people who have problems with both non-opiate drugs and alcohol
- alcohol only - people who have problems with alcohol but do not have problems with any other substances
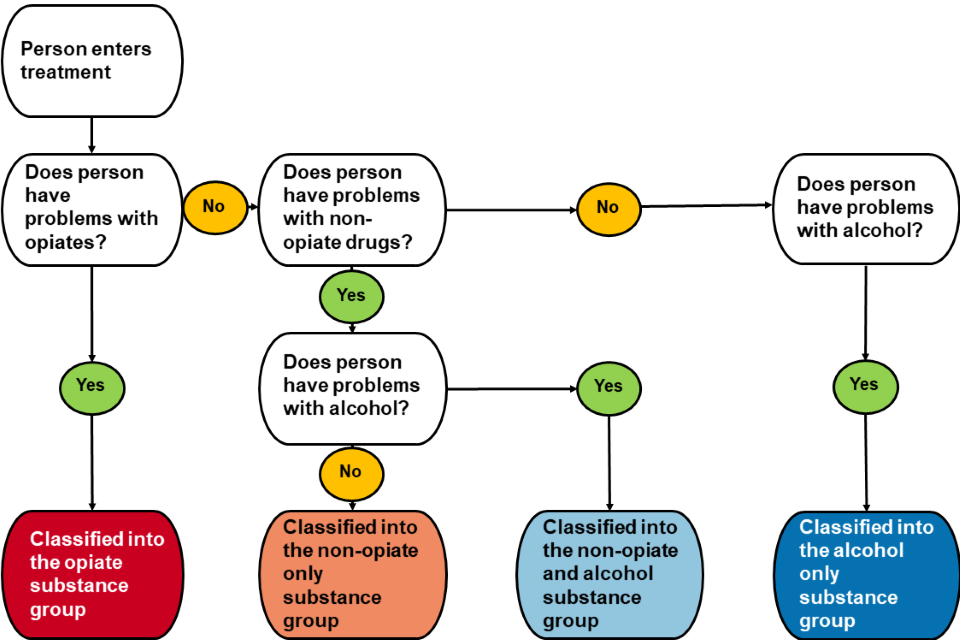
Flow chart shows how the report divides people into 4 groups depending on their problem substance
See below for a text description of the flowchart showing how people are classified into substance reporting group after entering treatment and undergoing initial assessment. People with an opiate problem are placed in the ‘opiate’ substance group regardless of whether other substances are also problematic. For all other individuals, they are categorised as ‘non-opiate only’, ‘non-opiate and alcohol’ or ‘alcohol only’.
Question 1: Does the person have problems with opiates?
- Yes: Person is classified into the opiate substance group.
- No: Go to question 2.
Question 2: Does the person have a problem with non-opiate drugs?
- Yes: Go to question 3.
- No: Go to question 4.
Question 3: Does the person have problems with alcohol?
- Yes: Person is classified into non-opiate and alcohol substance group.
- No: Person is classified into non-opiate only substance group.
Question 4: Does the person have problems with alcohol?
- Yes: Person is classified into alcohol only substance group.
2.2 Substance use, sex and age of people in treatment
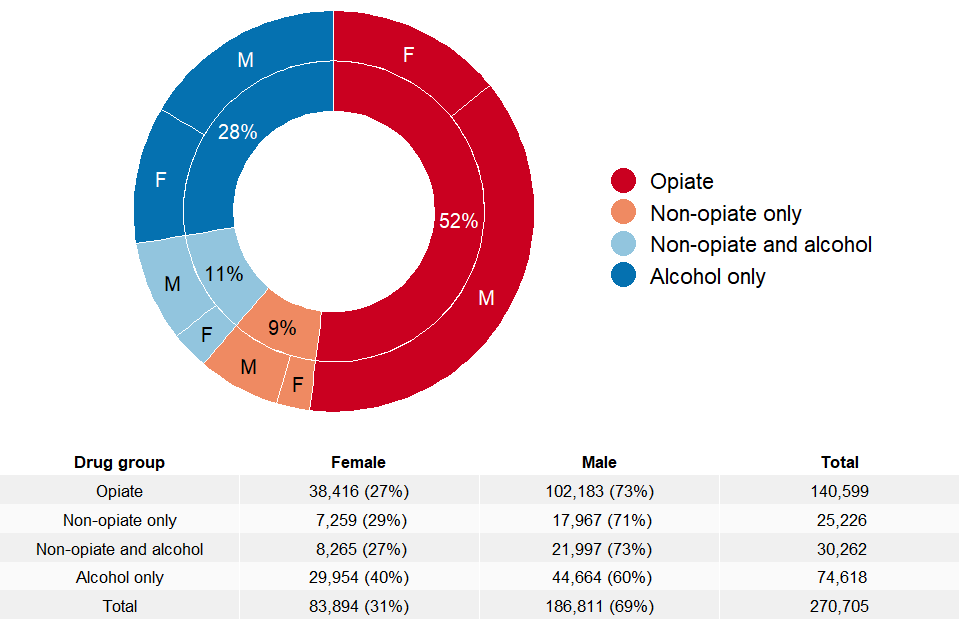
A circular chart showing the split of males and females in treatment along with a breakdown of the substance group.
There were 270,705 people in contact with drug and alcohol services between 1 April 2019 and 31 March 2020.
Over half of all adults (52%) received treatment for problems with opiates. A further 20% had problems with other drugs and over a quarter (28%) had problems with alcohol only. These proportions are similar to previous years and you can find more detailed information on trends in chapter 13
More than two-thirds of people in treatment were male and less than one-third female (69% male to 31% female). This proportion varies greatly by substance group. For the drug groupings, males make up just over two-thirds (opiate 73%, non-opiate only 71%, non-opiate and alcohol 73%). But in the alcohol only group, the divide is smaller with males making up 60% and females 40%.
2.3 Problem substances for people in treatment
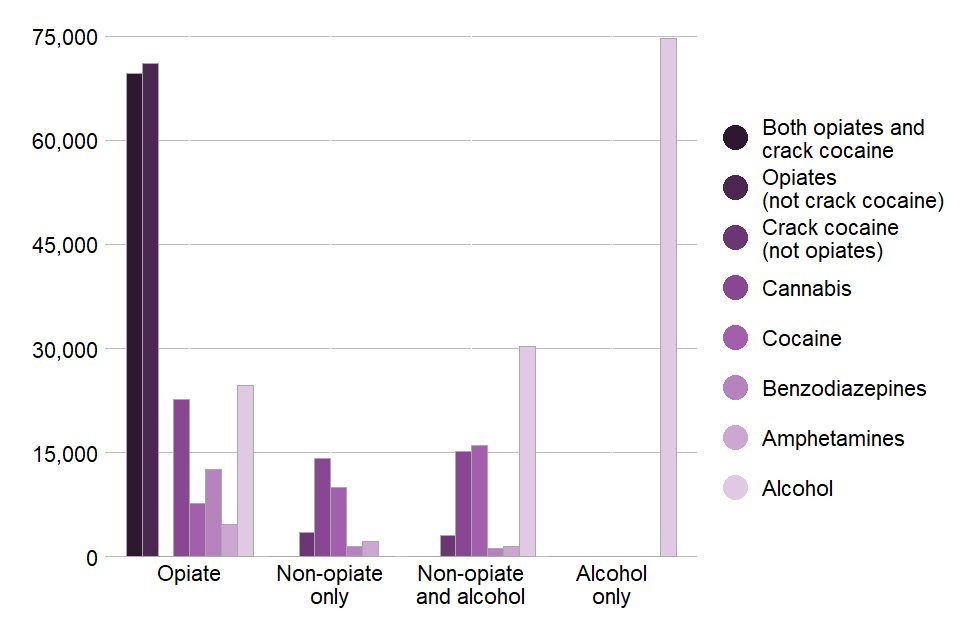
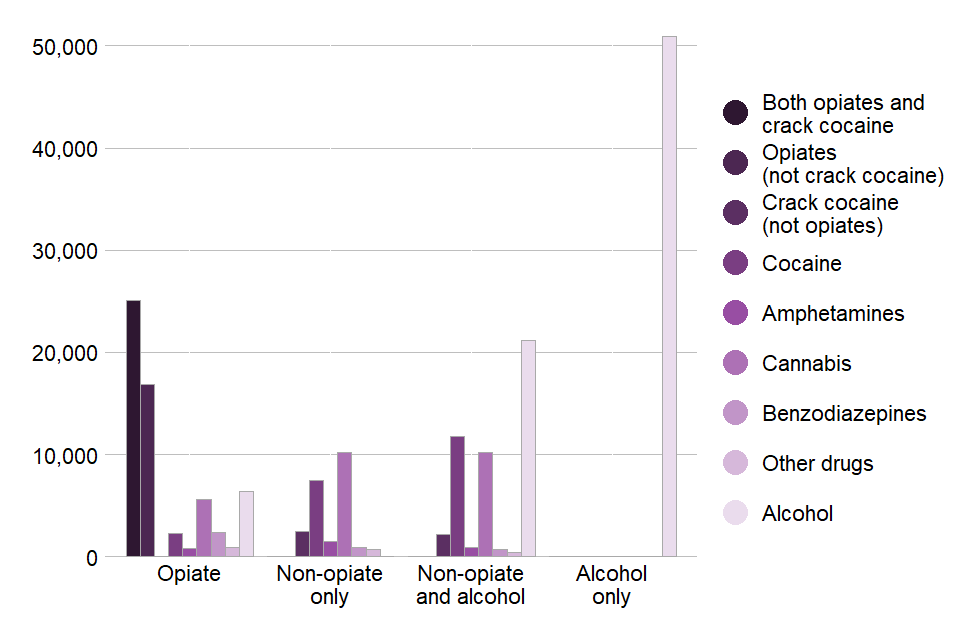
A bar chart showing the number of people in treatment in each of the 4 substance groups split by substances mentioned at the start of treatment.
Figure 3 shows a breakdown of the substances reported by people in treatment in 2019 to 2020, split into the 4 treatment groups. Up to 3 substances can be recorded at the start of treatment, so one person could be included in several substance groups.
The numbers show that opiates were the most frequently reported drug with slightly more people using opiates along with crack compared to opiates alone. Out of all people in treatment, 54% said they had a problem with opiates, crack or both. Almost half (48%) of people said they had problems with alcohol with most of these being in the alcohol only group. Almost one-fifth (19%) said they used cannabis, mostly in the opiate substance group. Cocaine was reported by 12% of people, the largest proportion of these being categorised into the non-opiate and alcohol substance group. The next most frequently reported substances were benzodiazepines with 6% and amphetamines (excluding ecstasy) with 3%. A more detailed breakdown of reported substances can be found in the data tables.
2.4 Age groups

Bar chart showing the number of people in treatment in each age group split by substance group.
The age of people in treatment has continued the trend from previous years showing an increase in older age groups. More than half of the people in treatment were over 40 years old (55%), while less than 10% of people in treatment for opiates or alcohol only were under 30 (8% for opiates and 9% for alcohol only).
The median age of people in treatment in the 4 substance groups ranged from 46 for the alcohol only group to 31 for non-opiates only. People in treatment for opiates had a median age of 41. A detailed breakdown of age statistics can be found in the accompanying data tables.
The distribution of ages of people in treatment (see figure 4) mirrors patterns in estimates of prevalence of drug and alcohol use. The latest estimates of prevalence for 2016 to 2017 show a significant increase in those aged 35 and over who use opiates (130,628 in 2010 to 2011 and 175,452 in 2016 to 2017), reflecting an ageing group
A large proportion of opiate users in treatment will have started using heroin in the epidemics of the 1980s and 1990s and are now over 40 years old. In 2017 to 2018, 69% said they first used heroin before 2001 and only 9% first used heroin since 2011.
People who reported using substances other than opiates or alcohol tended to be younger. You can find more information about this in the Home Office’s Crime Survey for England and Wales.
3. Meeting the needs of people who are dependent on alcohol and drugs
The NDTMS treatment figures only show us how many people dependent on alcohol and drugs are in treatment. We can compare this data to prevalence data to get an idea of how people’s needs are being met nationally and in each local area.
The main prevalence data we use in this context are:
- estimates of opiate and crack use, produced by Liverpool John Moores University for Public Health England (PHE)
- estimates of alcohol dependence produced by Sheffield University for PHE
3.1 Opiate and crack use
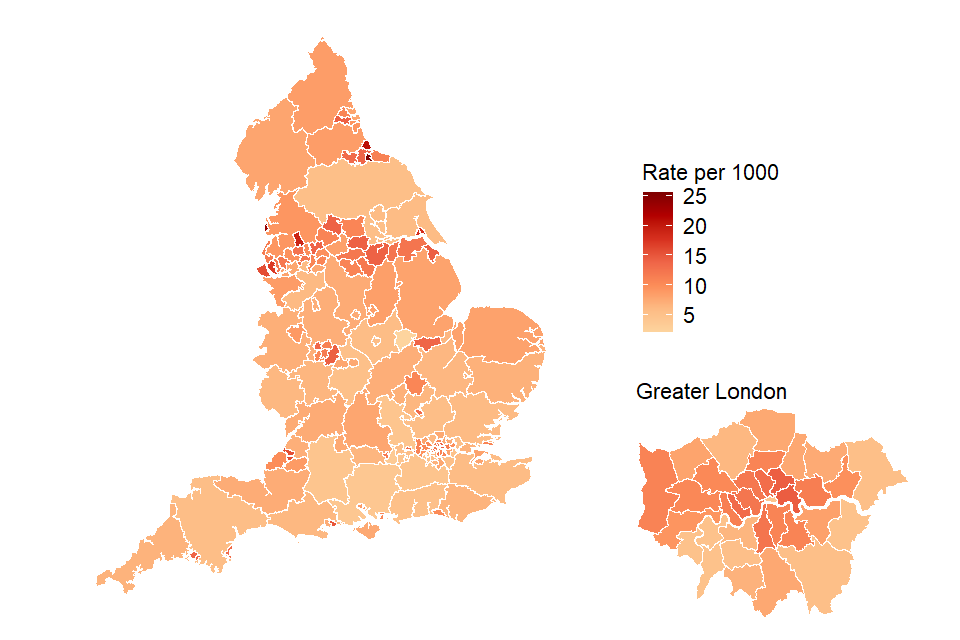
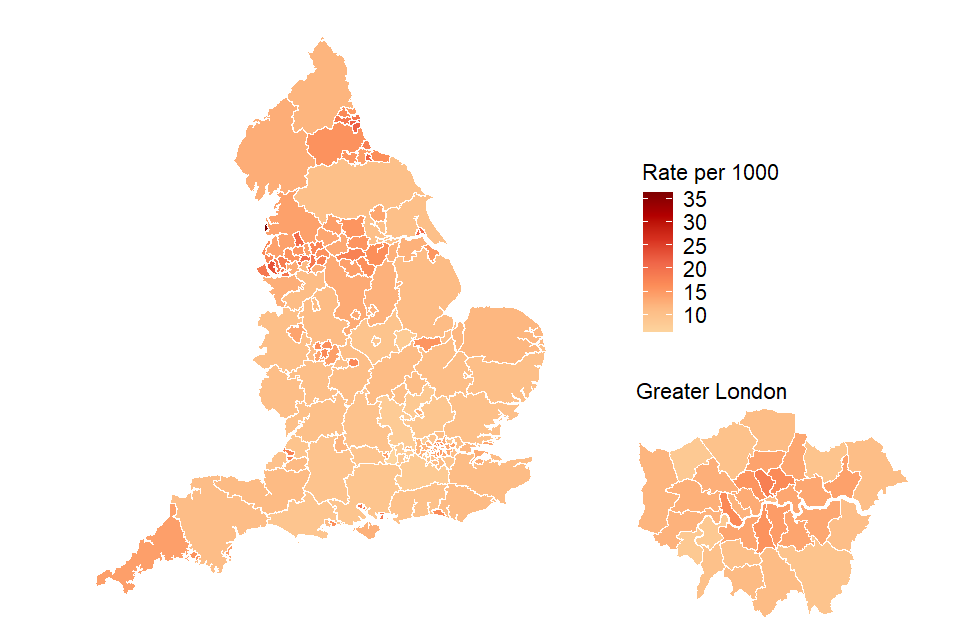
Map of England divided by each local authority's rate of opiate and crack use estimates in 2016 to 2017.
The opiate and crack use prevalence estimates show that in 2016 to 2017 (the most recent data available) there were 313,971 people in England aged 15 to 64 who use one or both drugs, made up of 261,294 opiate users and 180,748 crack cocaine users.
Nearly two-thirds of these people are between 35 and 64 years old. The proportion of opiate users who are not in treatment has continued to rise from 40.8% in 2014 to 2015 to 46.7% in 2019 to 2020. The proportion of crack users who are not in treatment is 58.0%.
Figure 5 shows how levels of opiate and crack use vary across England. Prevalence rates ranged from 2 people per thousand of the population in Rutland in the East Midlands to 26 people per thousand in Middlesbrough. Many of the highest prevalence rates are in the north of England. In London, figure 5 shows that the highest prevalence rates tend to be in the inner boroughs such as Tower Hamlets and Hackney, and the lowest rates are in the outer boroughs such as Bexley, Kingston upon Thames and Richmond upon Thames.
Opiate and crack use are also strongly linked to deprivation. We saw 56% of people in treatment for crack and/or opiates living in areas ranked in the 30% most deprived areas in England.
PHE has published the latest opiate and crack prevalence estimates for each local authority in England.
You can also see how local areas compare on the numbers of opiate users and dependent drinkers who are not in treatment in the Public Health Dashboard.
3.2 Alcohol dependence
Map of England divided by each local authority's rate of alcohol dependency estimates in 2017 to 2018.
There were an estimated 586,797 adults with alcohol dependency and in need of specialist treatment in 2017 to 2018 (the most recent figures available). These estimates have remained relatively stable over the last 5 years.
There were 104,880 individuals in treatment for alcohol in 2019 to 2020 (the total of alcohol only plus the non-opiate and alcohol groups), so there was an estimated 82% of adults in need of specialist treatment for alcohol who were not receiving it.
Figure 6 shows how levels of alcohol dependence vary across England. Like the opiate and crack prevalence rates, the higher prevalence rates are concentrated in the north of England. Rates ranged from 36 per thousand of the population in Blackpool to 6 per thousand in Wokingham in the South East. In London, alcohol dependence again followed the same pattern as opiate and crack prevalence. The highest rates tended to be in the inner boroughs such as Islington and Hammersmith and Fulham, and the lowest rates were in outer boroughs like Harrow and Richmond upon Thames.
Almost half the people in treatment for alcohol only (45%) were living in areas ranked in the 30% most deprived areas.
PHE has published the latest prevalence estimates for alcohol dependence for each local authority in England.
You can also see how local areas compare on the numbers of dependent drinkers who are not in treatment on the Public Health Dashboard.
4. People starting treatment: substances, age and referral source
4.1 Substances reported by people starting treatment
Bar chart showing the number of people starting treatment in each of the 4 substance groups split by substance mentioned.
In 2019 to 2020, 132,124 people started treatment for drug and alcohol problems. This is where a person started a new treatment journey and they may be returning to treatment having had a break of at least 21 days.
Of the people starting treatment:
- 59% said they had a problem with alcohol
- 32% said they had a problem with opiates
- 22% said they had a problem with crack cocaine
- 20% said they had a problem with cannabis
- 16% said they had a problem with cocaine
Also, of the people who said they had a problem with alcohol, 65% (50,957) said it was their only problem substance.
Figure 7 shows the number of people starting treatment who reported problems with each substance, split into the 4 substance groups. Most people with alcohol problems were in the alcohol only group. However, alcohol was the most frequently reported substance in the non-opiate and alcohol group, and the third most frequently reported substance in the opiate group.
In the non-opiate and alcohol group, cocaine was the second most frequently reported drug, followed closely by cannabis. Cannabis was the most frequently reported drug in the non-opiate substance group, followed by cocaine. The numbers show that most people in the opiate group used both opiates and crack. Opiates without crack was the second most commonly reported substance in this group.
There was a 5% reduction since the previous year in the number of people starting treatment saying they had a problem with NPS, from 1,363 to 1,291. Despite this overall reduction, there was a small rise in cases of people starting treatment for NPS and opiate use (from 751 to 763 people) which accounts for 2% of all those in treatment for opiate use. For more detail on the breakdown of NPS by substance group please see the accompanying data tables.
4.2 Age of people starting treatment
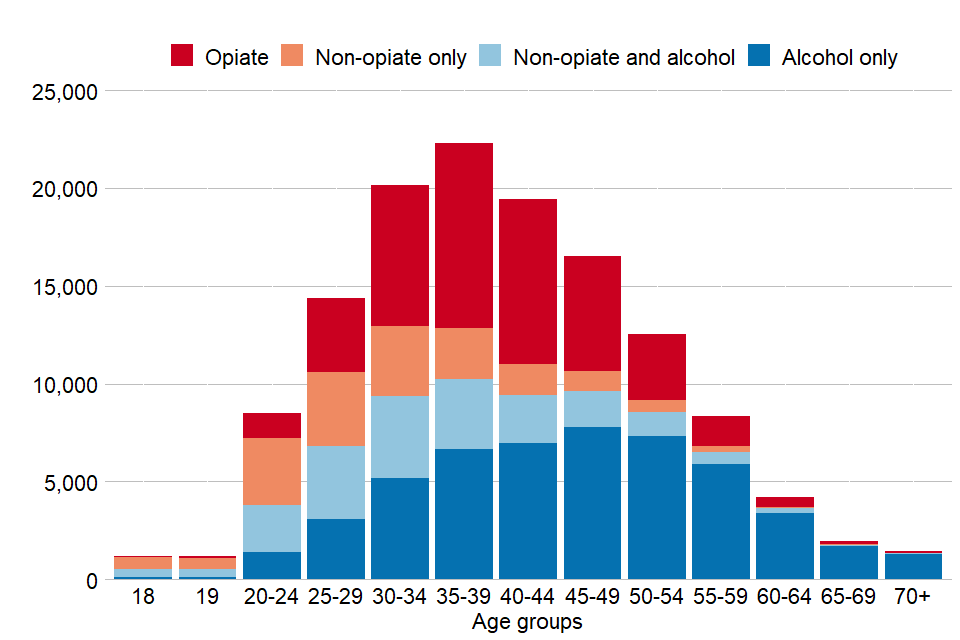
Bar chart showing the number of people starting treatment in each age group split by substance group.
Figure 8 shows the number of people starting treatment in each age group, further broken down into the 4 substance groups. The most common age group was 35 to 39, followed by 30 to 34, then 40 to 44. Within these 3 groups, the opiate substance group was the largest. Nearly half of people starting treatment (49%) were 40 years and over. Of those aged 55 years and over 77% said they had problems with alcohol only.
The non-opiate only and non-opiate and alcohol groups had the greatest proportion of people under 30 years old starting treatment, at 46% and 33%, respectively.
4.3 Referral sources
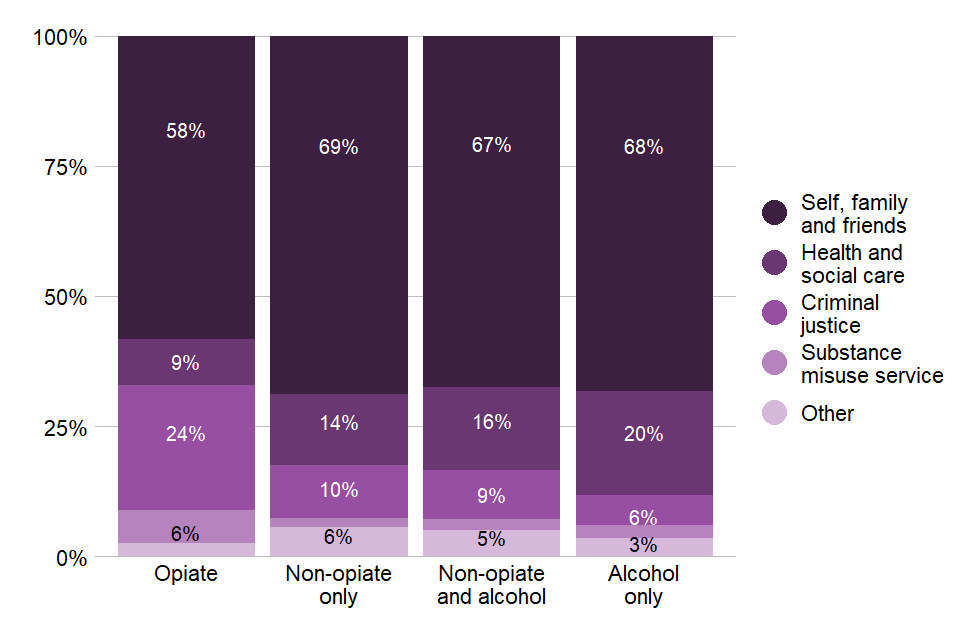
Bar chart of people starting treatment split by substance group and referral source.
Of the people starting treatment in 2019 to 2020, 65% self-referred (which may be following advice from a healthcare professional) or were referred by family and friends. This was the most common referral source in all 4 substance groups.
Referrals from healthcare were the second most common referral source and made up 15% overall. This includes referrals from GPs which accounted for 7%, though it was higher in the alcohol only group where GPs made up 10% of all referrals. Hospitals made up 3% of all referrals while only 1% of referrals came from social services. Referrals from healthcare varied between the individual substance groups. Only 9% of opiate referrals came from healthcare compared to 20% of alcohol only referrals.
Collectively, referrals from the criminal justice system made up 13%. But there was a big difference between substance groups, with 24% of opiate referrals coming from the criminal justice system compared to just 6% for those with only alcohol problems. Prison referrals accounted for 6% of all referrals. A further breakdown of these groups is available in the accompanying data tables.
5. Housing
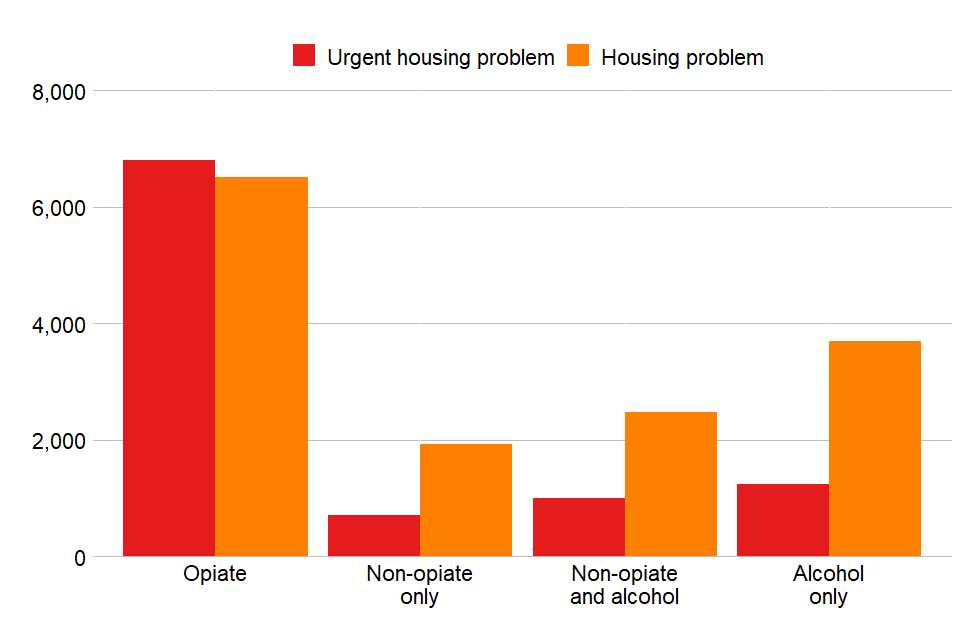
Bar chart showing the different housing needs of people in treatment broken down by their substance group.
Around one in ten people (11%) starting treatment said they had a housing problem and a further 7% had an urgent problem. For people with opiate problems, the proportion with an urgent housing problem was 16%.
Figure 10 shows the numbers of people starting treatment who had a housing problem or an urgent housing problem, split into the 4 substance groups. The opiate substance group had the highest number with 13,315 people saying they had a housing problem or an urgent housing problem. This was the only group where more people said they had an urgent housing problem than a non-urgent housing problem. The alcohol only group had the second highest numbers with 3,696 people saying they had a housing problem and 1,246 people saying they had an urgent housing problem.
The people in treatment with NPS problems had the highest proportion of housing need, with 45% saying they had a housing problem (urgent or otherwise) when starting treatment.
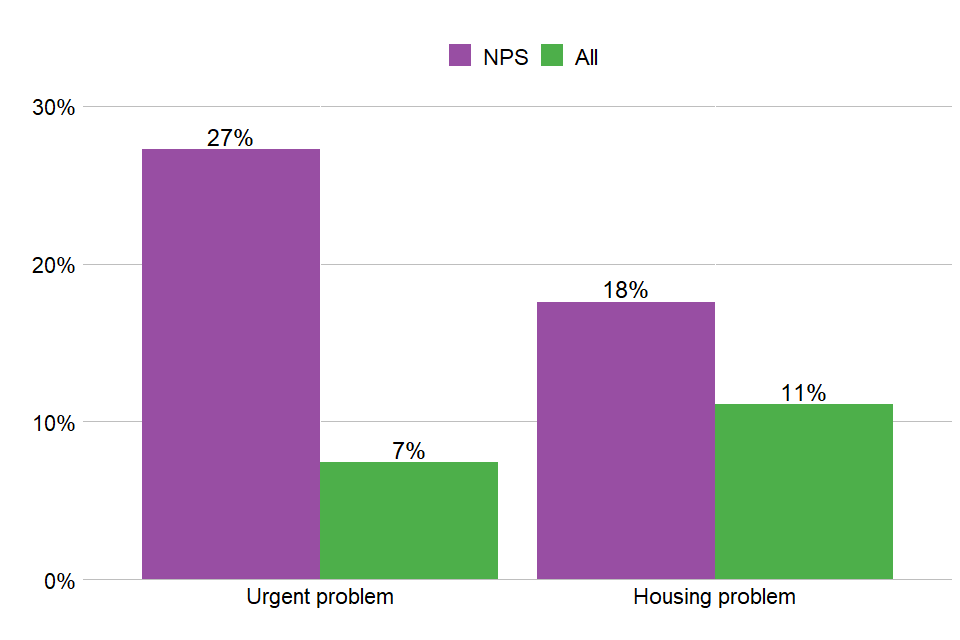
Figure 11: Housing need for people with problems with new psychoactive substances starting treatment in 2019 to 2020
Figure 11 shows the proportion of people with NPS problems who reported housing problems compared to the proportion of all people starting treatment. The numbers show that 27% of people with NPS problems said they had an urgent housing problem compared to 7% of all people starting treatment. For non-urgent housing problems, the proportions were 18% of people with NPS problems and 11% for all people starting treatment.
6. Mental health
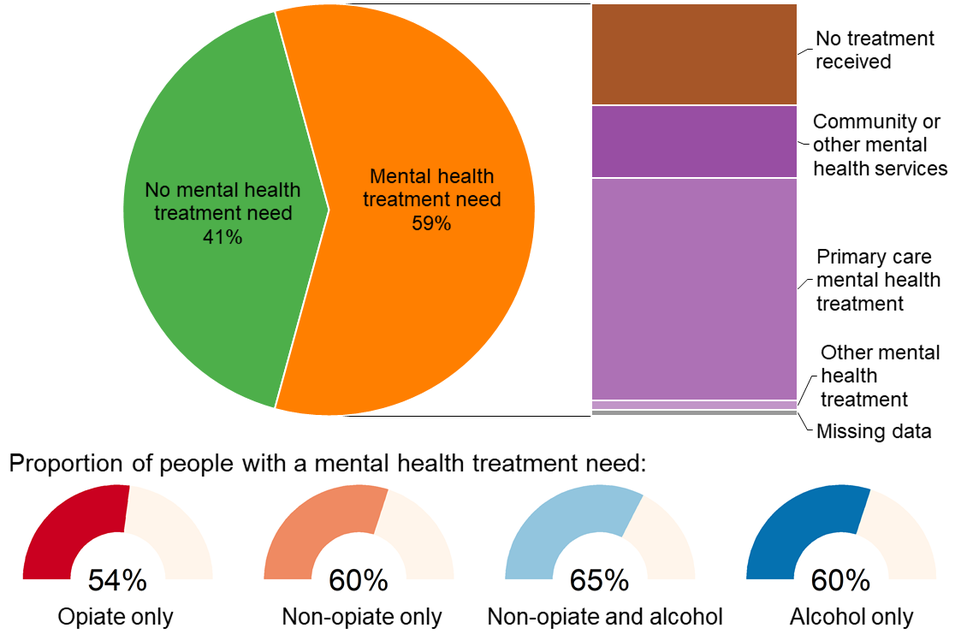
Pie chart showing the mental health need of people in treatment split by whether people were receiving treatment for this need and where.
More than half of people starting treatment said they had a mental health need (59%). This ranged from 54% for people in treatment for opiates to 65% for people with non-opiate and alcohol problems.
A quarter (25%) of people who had a mental health need were not receiving any treatment to meet this need. Of those receiving mental health treatment, over half (54%) received it in a primary care setting, such as a GP surgery.
7. Injecting status
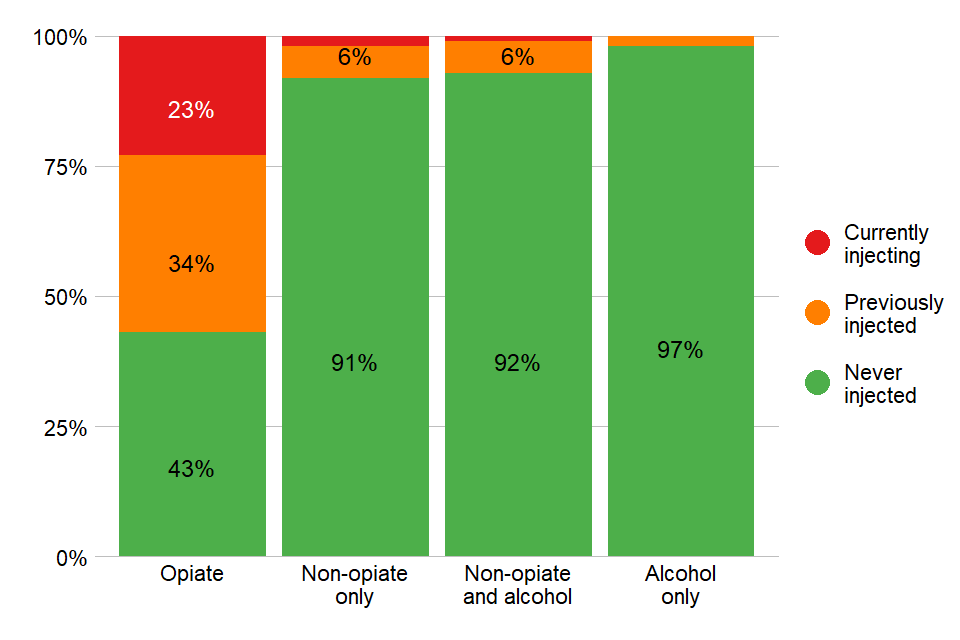
Bar chart of the current injecting status of people starting treatment split by substance group.
Twenty-one percent of all people starting treatment were currently injecting or had previously injected drugs. This is much higher for people with opiate problems, with 23% currently injecting and 34% having previously injected. In the 3 non-opiate substance groups, over 90% of people had never injected drugs. In the non-opiate only and non-opiate and alcohol groups, 6% said they had previously injected. Only very small numbers outside of the opiate substance group were currently injecting with just 2% of people in the non-opiate only group, and 1% of the non-opiate and alcohol group. Only 2% of people with alcohol only problems had previously injected drugs.
8. Parental status and safeguarding children
8.1 Parental status
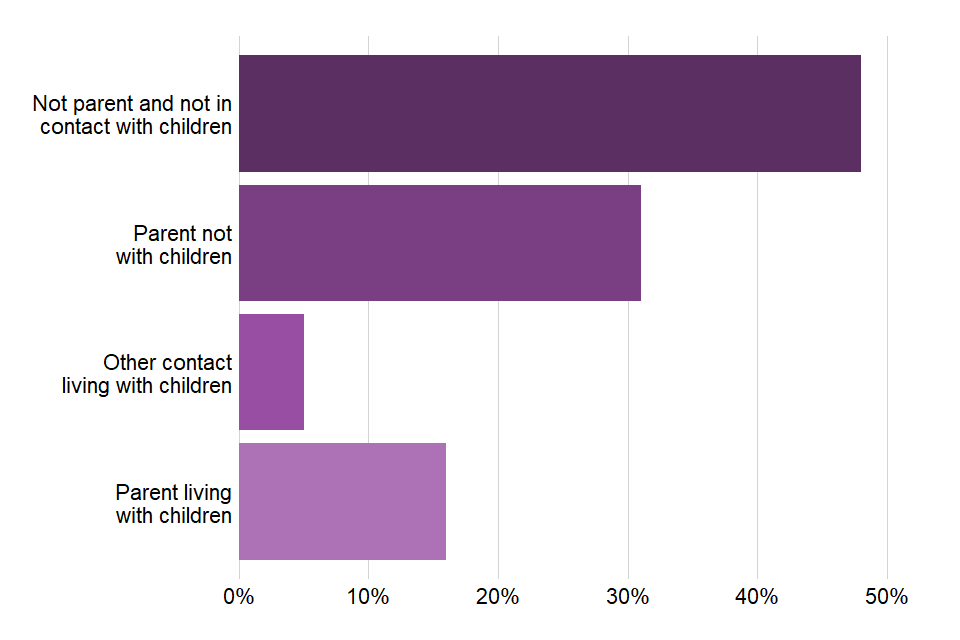
Bar chart showing the percentages of people's parental status when starting treatment in 2018 to 2019.
In 2019 to 2020, 21% of people starting treatment were living with children, either their own or someone else’s. A further 31% were parents who were not living with their children. This was highest among women in treatment for opiates, where 44% are parents who are not living with their children.
Fifty-eight percent of females reported either living with a child or being a parent when they started treatment, compared to 49% of males.
Eighty-one percent of the children of people starting treatment were receiving no early help. We also saw that 7% had a child protection plan, this figure was highest in the non-opiate group at 14%.
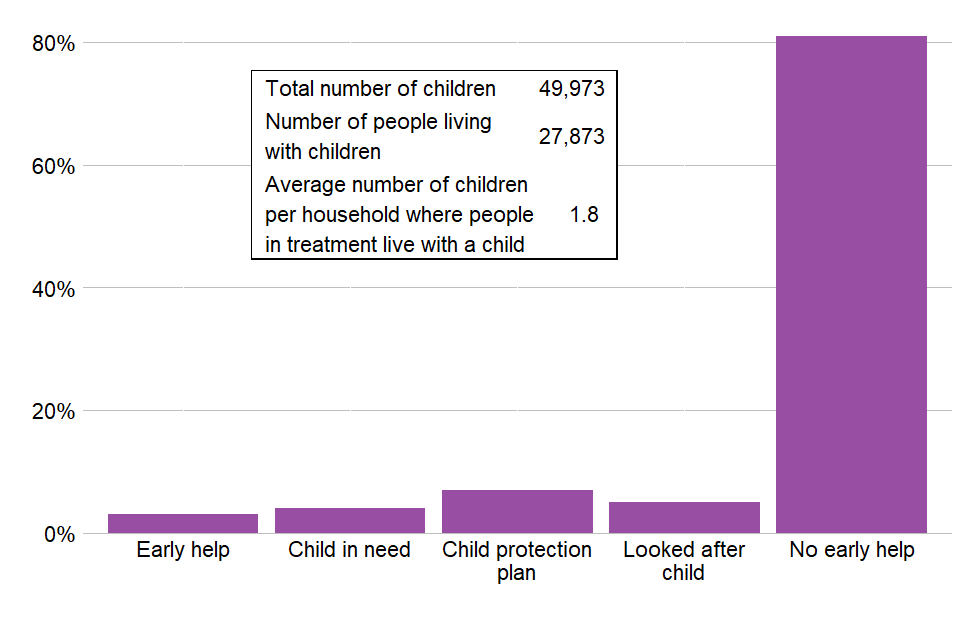
Bar chart showing the percentage of children living with people in treatment who are receiving early help or in contact with children's social care.
9. Smoking
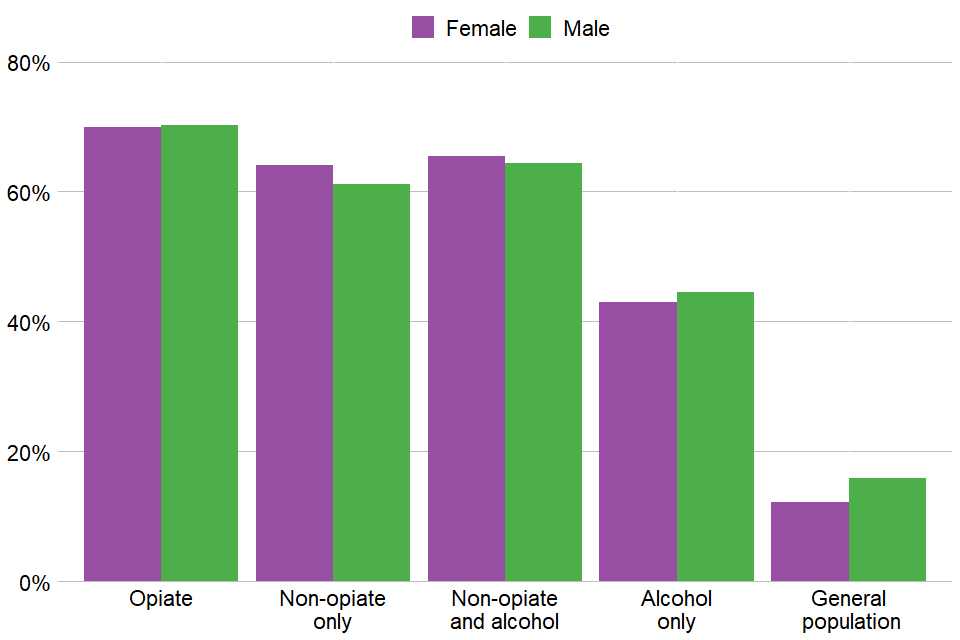
Bar chart showing the percentage of people in each substance group who were smoking when starting treatment split by sex and compared to the general population.
Over 49,000 people (58%) said they had smoked tobacco in the 28 days before starting treatment. This is based on information collected at the start of treatment and a 6-month review as part of PHE’s treatment outcomes profile (TOP).
Across all substance groups, males and females reported smoking at similar levels. And in all cases, the level of smoking was substantially higher than the smoking rate of the general adult population, 15.9% for males and 12.5% for females.
Despite the high levels of smoking, only 3% of people were recorded as having been offered referrals for smoking cessation interventions.
10. Treatment interventions
Bar chart showing the percentages of where people's treatment took place split by the type of intervention they received.
Almost all (99%) people in treatment received some form of structured treatment. You can find a definition of structured treatment in our community alcohol and drug treatment business definitions guidance.
Of the people that did receive structured treatment:
- 98% received a community-based treatment
- 8% received treatment in a primary care setting
- 3% received treatment in an inpatient setting
- 2% received treatment in a residential setting
The number of people receiving treatment in inpatient and residential settings has continued to fall. In 2019 to 2020 there were 15,161 people in those settings, down from 16,757 in the previous year, an 11% drop. This is now 41% lower than 2014 to 2015 (25,847 to 15,161).
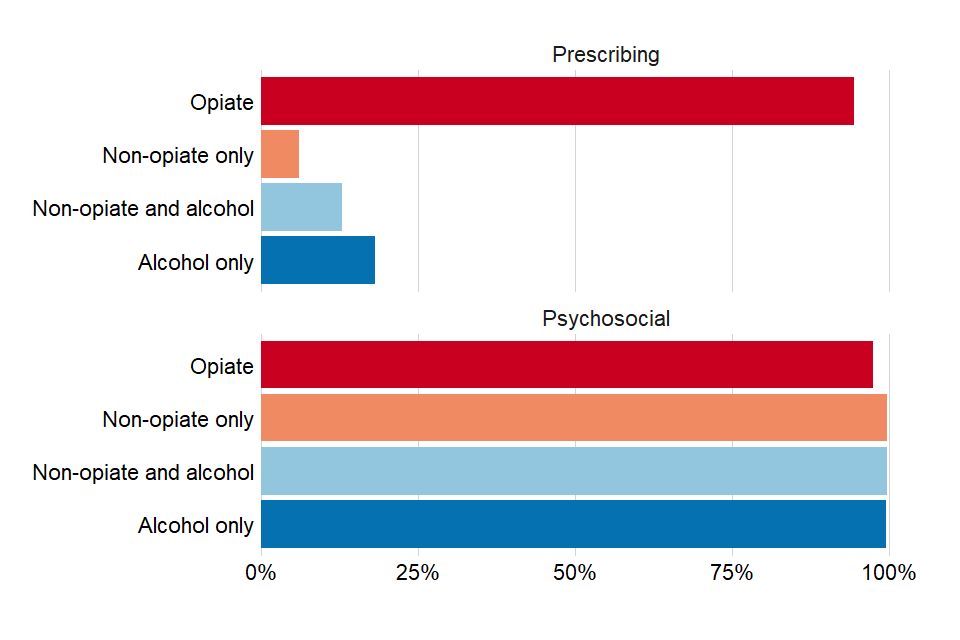
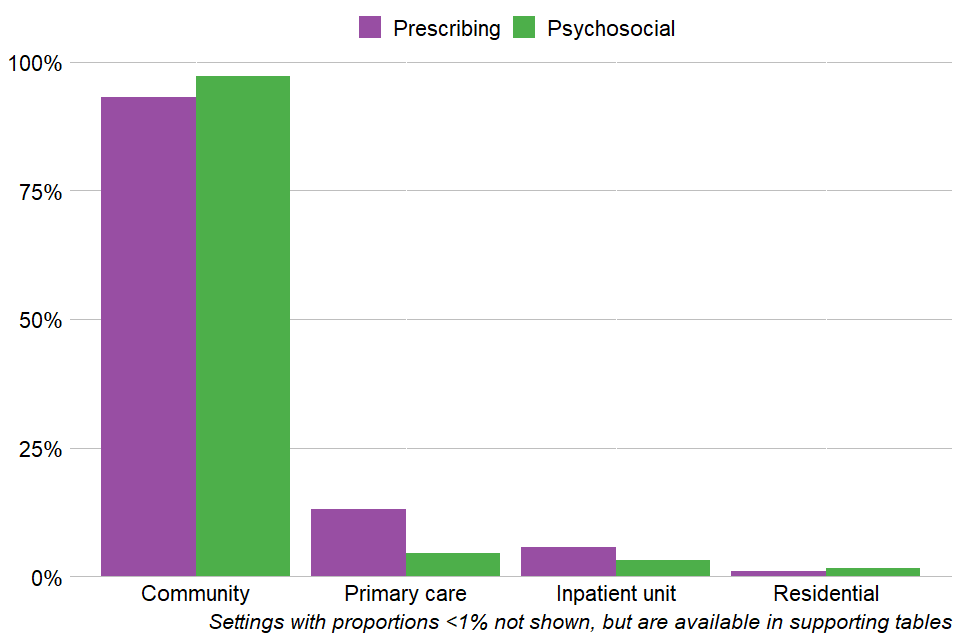
Two bar charts showing the percentages of the type of intervention people received split by substance group.
Ninety-eight percent of people received a psychosocial intervention while 56% received at least one pharmacological intervention. For people with opiate problems, 94% received a pharmacological intervention, while only 6% of the non-opiate only group received one.
Of the people starting treatment, 98% did so within 3 weeks of referral to treatment.
11. Treatment outcomes
11.1 Treatment exits and successful completion of treatment
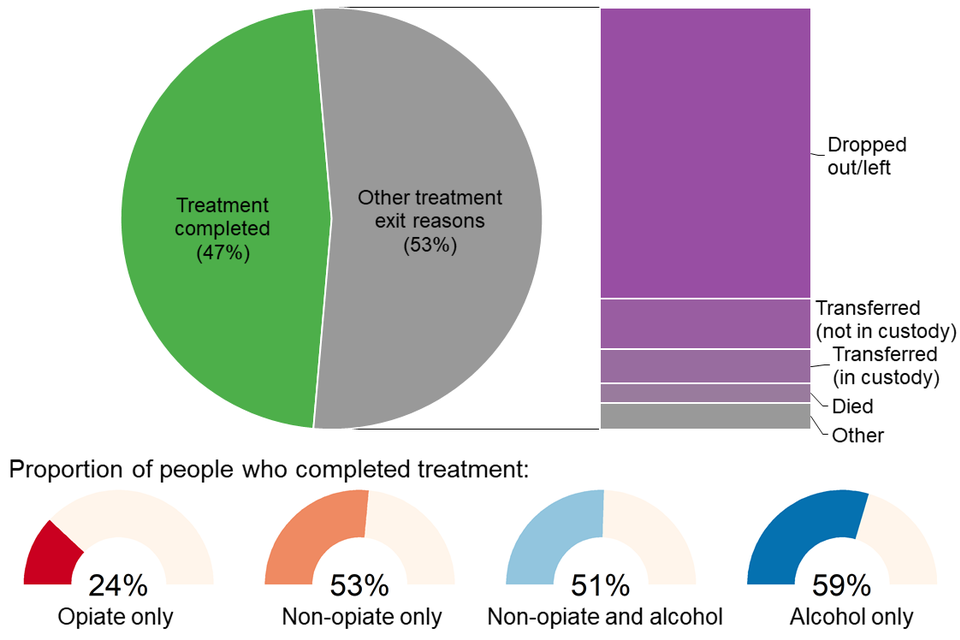
Pie chart showing the percentage breakdown of treatment exits split by the reason for their exit.
A total of 117,678 people left drug and alcohol treatment in 2019 to 2020.
On average (mean), people who completed treatment successfully did so within a year of starting treatment (307 days). The average time in treatment for people with opiate problems was nearly 3 years (1,056 days) and around 6 months for the other substance groups (157 days for non-opiates only, 183 days for non-opiate and alcohol and 187 days for alcohol only).
Almost half the people who left treatment (47%) successfully completed their treatment and were discharged as ‘treatment completed’. Opiate users had the lowest rate of being discharged as treatment completed (24%) and the alcohol only group had the highest rate (59%).
Around a third (36%) of people left treatment without completing it, while 13% left either due to unsuccessful transfers between services or the person declining further treatment.
11.2 Deaths in treatment
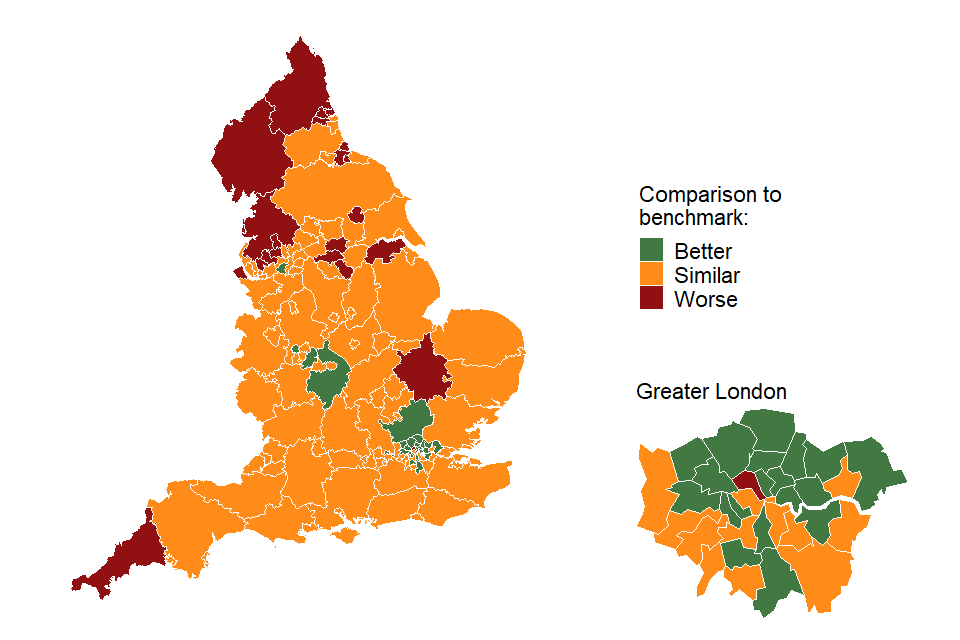
Map of England showing deaths in drug treatment split by local authority and their mortality ratio.
This map shows local authorities where deaths in drug treatment are higher or lower than expected. These figures are for people who die while they are in a treatment programme, not necessarily because their deaths are drug-related. It is calculated as an indirectly age-standardised ratio, and more detail can be found on the Public Health Dashboard.
There were 2,929 recorded deaths in treatment, which represented 1.1% of all people in treatment. People with opiate problems accounted for 69% of these deaths. A third (33%) of opiate deaths were people living in the most deprived 10% of areas in England. In these same most deprived areas, there was a similar proportion (31%) of deaths for people in the non-opiate treatment group. Around a quarter of the deaths were in the alcohol only and the alcohol and non-opiate groups (23% and 24% respectively).
Data from the Office for National Statistics shows that, over the last decade, rates of drug poisoning deaths are higher in the most deprived areas of England and Wales compared with the least. For people in their forties, the most deprived rate is more than 5 times higher than the least deprived rate. Deaths of homeless people among this population increased by 22% in 2018, driven by a 55% increase in drug poisonings among this population.
11.3 Self-reported outcomes: substance use
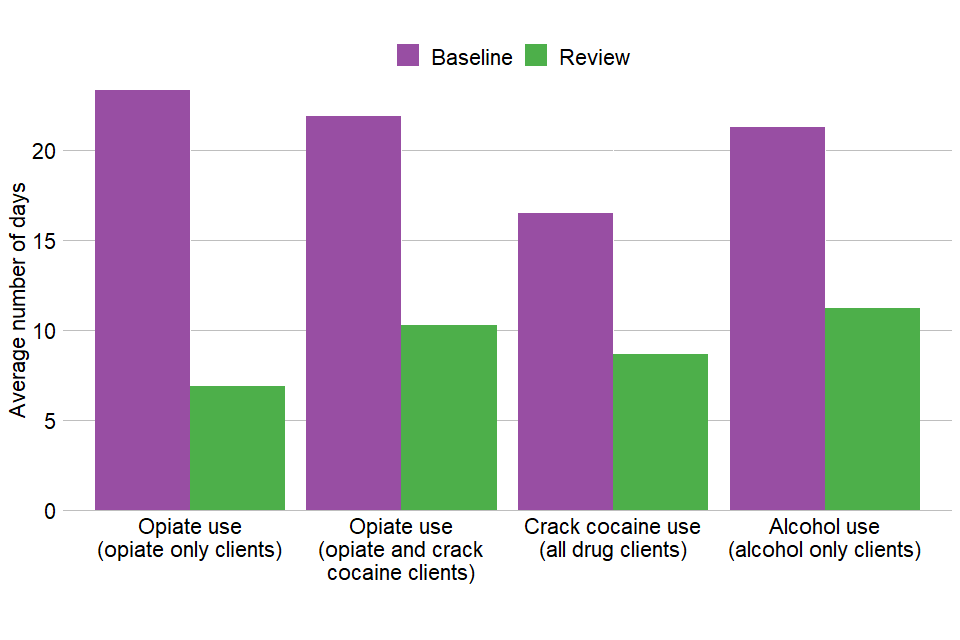
Bar chart showing the average number of days people used their problem substances at their baseline and at their 6-month review.
PHE collects information about the outcomes for users of drug and alcohol treatment services. This includes the TOP, which measures change and progress in important areas of their lives.
Altogether, people with opiate problems reported a fall in the average number of days they used opiates, from 22.4 days in the last 28 days at the start of treatment to 8.9 days after 6 months of treatment.
The alcohol only group reported a fall in the number of days that they used alcohol, from 21.3 days to 11.2 days in the last 28 days before their 6-month review.
12. Self-reported outcomes: education, employment and injecting
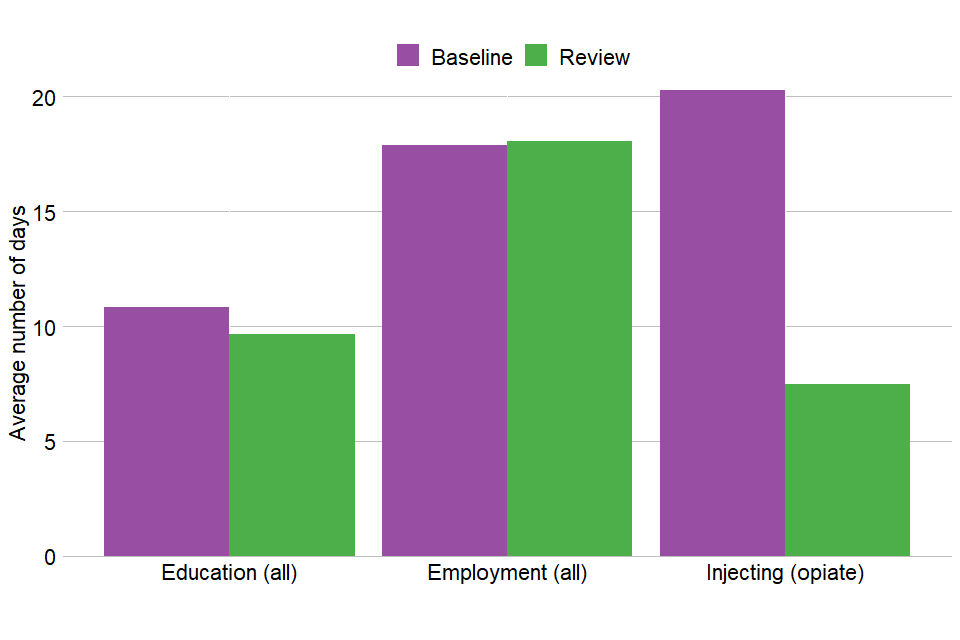
Bar chart showing the average number of days people in treatment reported injecting, in employment and in education at their baseline and after their 6-month review.
The average number of days that people reported being in education reduced from 10.5 at the start of treatment to 9.6 at their 6-month review.
People in treatment reported an increase in the average amount of days they were in employment in the last 28 days, from 17.7 days before starting treatment to 18 days at their 6-month review.
The number of days of injecting by people with opiate problems dropped from 20.3 days per month to 7.5 days per month.
13. Trends over time
13.1 Numbers in treatment
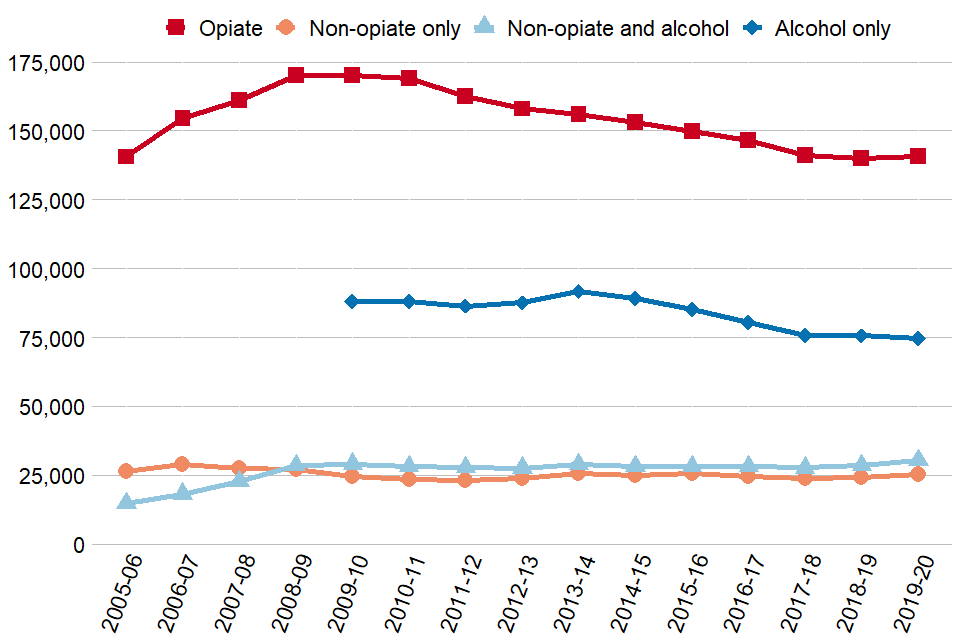
Figure 23: Trends in numbers in treatment by substance group between 2005 to 2006 and 2019 to 2020
The overall number of people in treatment has seen a small increase since last year, with 270,705 people in treatment compared to 268,251 in 2018 to 2019. This is the first year that numbers in treatment have increased since a decline starting in 2013 to 2014.
There have been slight increases in numbers in the non-opiate only (4% increase) and non-opiate and alcohol (6%) groups and a small increase in the opiate group (1%). The alcohol only group saw a small decrease of 1% (from 75,555 to 74,618).
Numbers for people in treatment who said they had a problem with alcohol only are only shown from 2009 to 2010 onwards as that is when we started collecting national alcohol treatment data.
These trends over time can be found on the NDTMS website using the ViewIt tool. You can choose to display either England or local authority level data, as well as split the data by substance, sex and age groups.
13.2 People leaving treatment
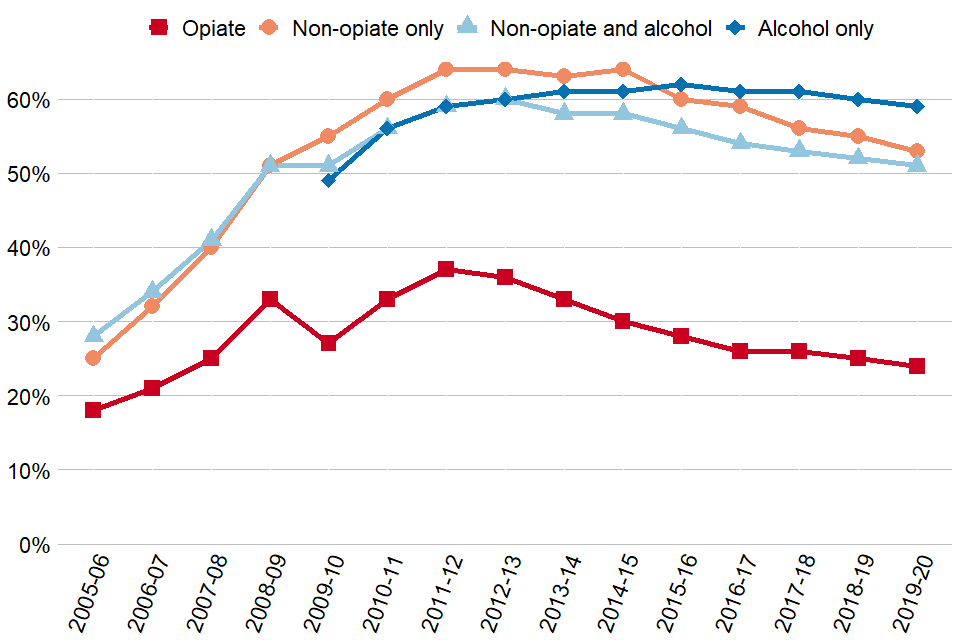
Figure 24: Trends in people successfully completing treatment as a proportion of exits in the year between 2005 to 2006 and 2019 to 2020
People leaving treatment free of dependence has continued to fall, making up 47% of all treatment exits in 2019 to 2020 compared to a high point of 53% in 2013 to 2014. The fall in successful completion rates has been more marked for people with opiate problems, now at 24%, down from a high of 37% in 2011 to 2012. There has been a gradual fall in the rate for people with alcohol only problems from a high of 62% in 2015 to 2016 to 59% this year.
13.3 Opiate and crack use
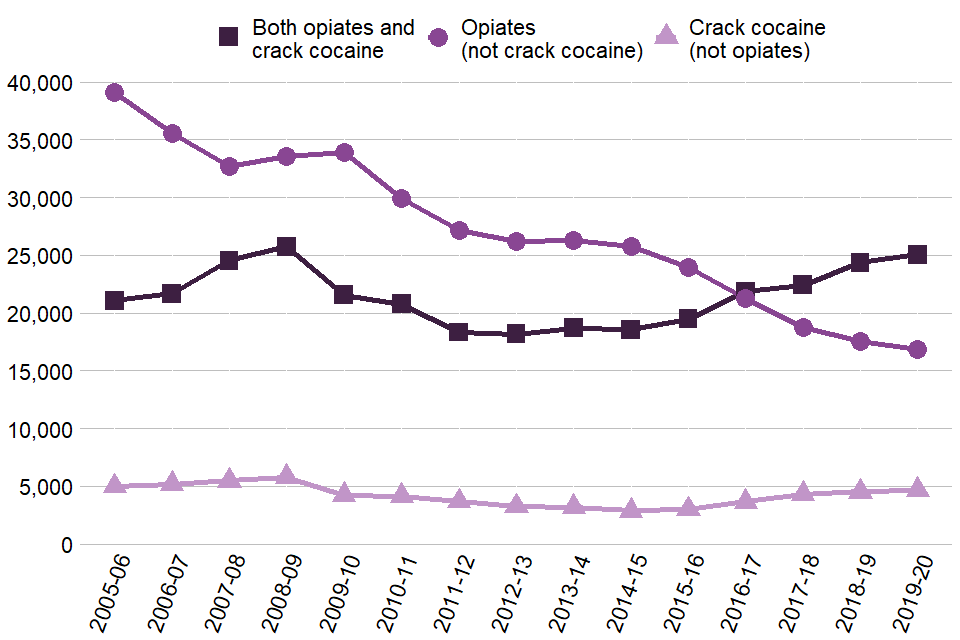
Line graph showing the numbers of people in treatment with opiate and crack problems, opiate problems only and crack problems only since 2005 to 2006.
The number of people entering treatment for problems with opiates but not crack continued on a downward trend which started in 2009 to 2010.
The number of people entering treatment for both crack and opiates continued to rise, and it is now above 25,000 for the first time (25,043) since 2008 to 2009. The number in treatment for crack without opiates (4,651) has remained stable compared with the previous year but is higher than in the previous 10 years.
Following a small rise last year, the number of people starting treatment for NPS use has fallen from the previous year, from 1,363 to 1,291.
The number of people who were using both NPS and opiates at the start of treatment remained similar to the previous year (from 751 to 763).
There were continued falls in the numbers of people with ecstasy problems, with 863 people starting treatment this year compared to a high of 2,399 in 2007 to 2008.
There was a continued rise in ketamine numbers, with 1,140 people coming to treatment, compared to 426 in 2014 to 2015. Numbers of people with methamphetamine problems also rose, reaching 467 compared to 131 in 2011 to 2012.
You can find more detailed data on the drugs people were having problems with, in the accompanying data tables.
13.4 Deaths in treatment
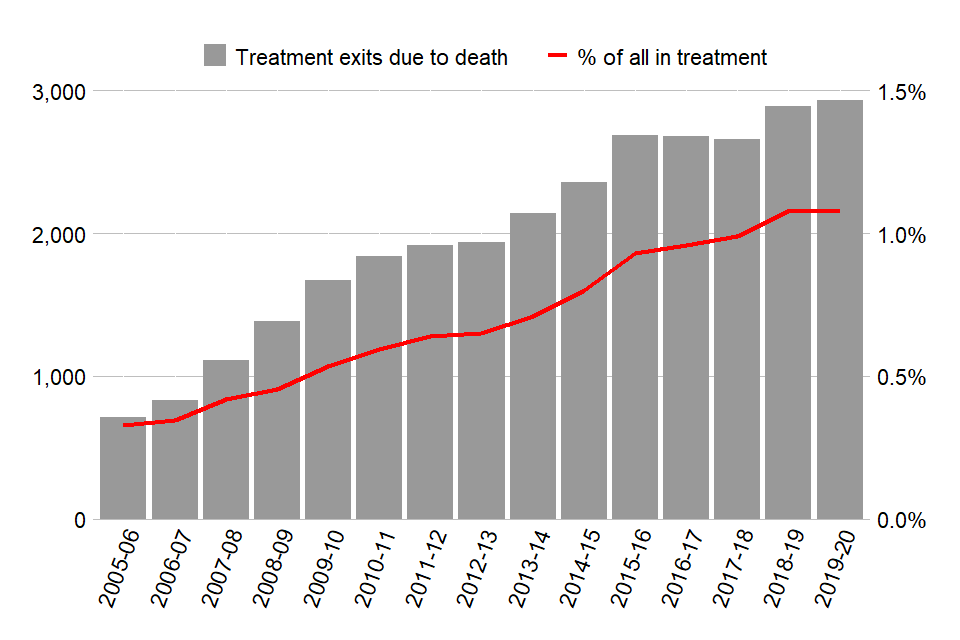
Bar chart showing the number of treatment exits due to death and a line showing the percentage of all in treatment since 2005 to 2006.
The number of deaths in treatment has continued to rise, increasing from 2,889 people in 2018 to 2019 to 2,929 this year. This was 1.1% of all people in treatment. This trend has increased from 712 deaths in 2005 to 2006 to 2,929 deaths in 2019 to 2020, which is more than a 4 times increase.
13.5 Deaths in treatment by substance
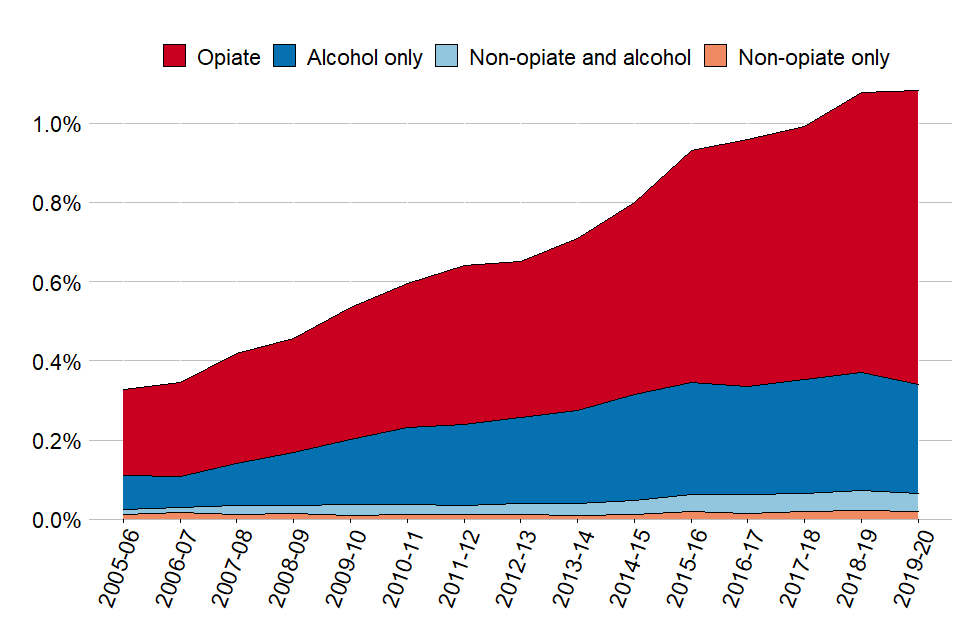
Stacked line graph showing the percentages of deaths in treatment since 2005 to 2006 split by substance group.
The number of deaths in treatment rose by 6% for people with opiate problems, compared with the previous year (from 1,897 to 2,010). This is a 17% increase when compared to 2017 to 2018. There was a decrease for all other substance groups, ranging from 11% for non-opiates only to 6% for non-opiates and alcohol.
Deaths in the opiate group as a proportion of everyone in treatment continued to rise and is now above 1.4% for the first time.
14. A 15-year analysis
14.1 People in treatment
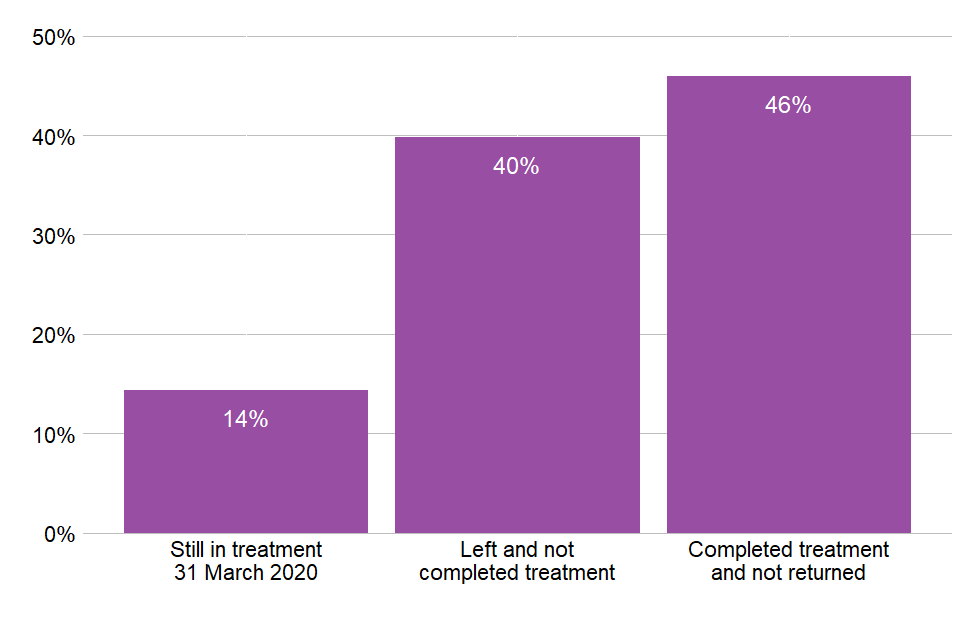
Bar chart of all people in treatment in the last 15 years split by their treatment status as of 31 March 2020.
In the 15 years of treatment data starting from 2005 to 2006, there has been a total of 1,011,762 different people in contact with drug and alcohol treatment services. By 31 March 2020:
- 144,805 (14%) were still engaged in treatment
- 402,518 (40%) had left before they completed their treatment and had not returned
- 464,439 (46%) had completed their treatment and not returned
14.2 Treatment journeys
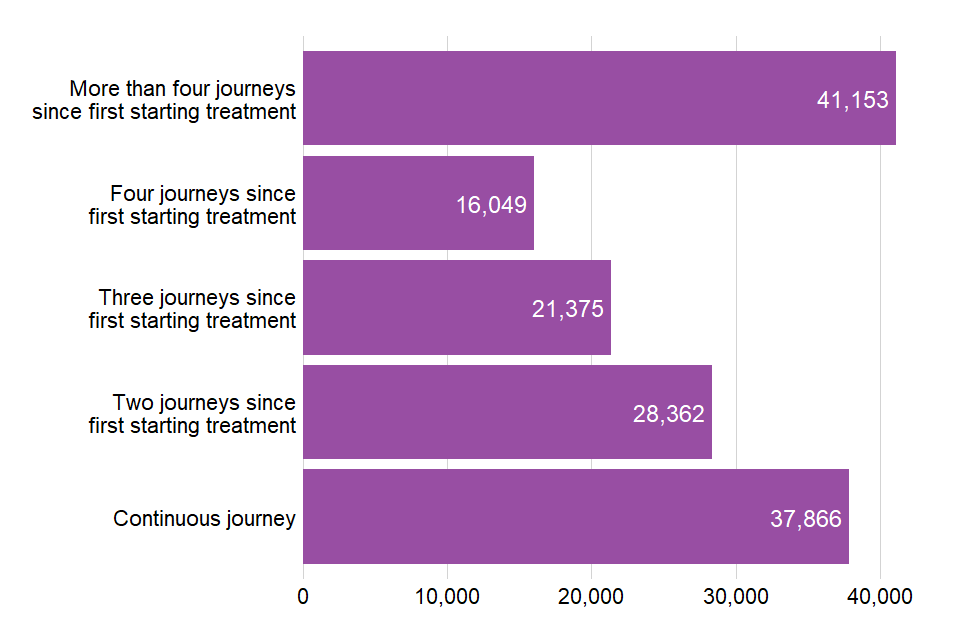
Bar chart of all people in treatment in the last 15 years split by number of treatment journeys as of 31 March 2020.
Of the people still in treatment at the end of March 2020, over a third (40%) have had 4 or more treatment journeys and over a quarter (26%) have been in treatment continuously.
You can find more information on the methodology of this analysis in the NDTMS annual statistics quality and methodology document.
15. Background and policy context
15.1 Background to the data
This report presents statistics on the availability and effectiveness of alcohol and drug treatment in England and the profile of people accessing this treatment.
The statistics in this publication come from analysis of the NDTMS. The NDTMS collects data from about 600 sites providing structured substance misuse interventions, covering every local authority in England. Treatment centres returning data include:
- community-based drug and alcohol services
- specialist outpatient services
- GP surgeries
- residential rehabilitation centres
- inpatient units
The data collected includes information on the demographics and personal circumstances of people receiving treatment, as well as details of the interventions delivered and their outcomes.
You can find more details on the methodology used in the report in the NDTMS annual statistics quality and methodology document.
Alcohol and drug treatment statistics reports for previous years can be found in PHE’s Alcohol and drug misuse and treatment statistics collection.
15.2 Policy context
Alcohol and drug treatment in England is commissioned by local authorities using the public health grant. They are responsible for assessing local need for treatment and commissioning a range of services and interventions to meet that need.
The public health grant conditions make it clear that:
“A local authority must, in using the grant: have regard to the need to improve the take up of, and outcomes from, its drug and alcohol misuse treatment services.”
PHE works with local authorities and provides them with bespoke data, guidance, tools and other support to help them commission services more effectively.
PHE guidance for alcohol and drug treatment is available in the Alcohol and drug misuse prevention and treatment guidance collection.
A wide range of NDTMS data is available at the NDTMS website, including some data reports that are only available to local authority commissioners (using login).
The government’s strategy for drug treatment is set out in the ‘building recovery’ section in the Drug Strategy 2017.
Professor Dame Carol Black is currently leading the second stage of her independent review into the misuse of drugs, looking at treatment and recovery services for drug users, as well how to prevent drug misuse. The review will make policy recommendations to government, including:
- funding
- how services are commissioned
- how local bodies are held accountable