Alcohol and drug treatment for adults: statistics summary 2017 to 2018
Published 1 November 2018

© Crown copyright 2018
This publication is licensed under the terms of the Open Government Licence v3.0 except where otherwise stated. To view this licence, visit nationalarchives.gov.uk/doc/open-government-licence/version/3 or write to the Information Policy Team, The National Archives, Kew, London TW9 4DU, or email: psi@nationalarchives.gov.uk.
Where we have identified any third party copyright information you will need to obtain permission from the copyright holders concerned.
This publication is available at https://www.gov.uk/government/statistics/substance-misuse-treatment-for-adults-statistics-2017-to-2018/alcohol-and-drug-treatment-for-adults-statistics-summary-2017-to-2018
1. Overview
The National Drug Treatment Monitoring System (NDTMS) statistics report presents information on adults (aged 18 and over) who were receiving help in England for problems with drugs and alcohol in the period 2017 to 2018.
Many people experience difficulties with and receive treatment for both substances. While they often share many similarities, they also have clear differences, so this report divides people in treatment into the 4 substance groups:
- opiate: people who are dependent on or have problems with opiates, mainly heroin
- non-opiate: people who have problems with non-opiate drugs, such as cannabis, crack and ecstasy
- non-opiate and alcohol: people who have problems with both non-opiate drugs and alcohol
- alcohol only: people who are dependent on alcohol but don’t have problems with any other substances
Figure 1: Numbers in treatment by main substance group: 2017 to 2018
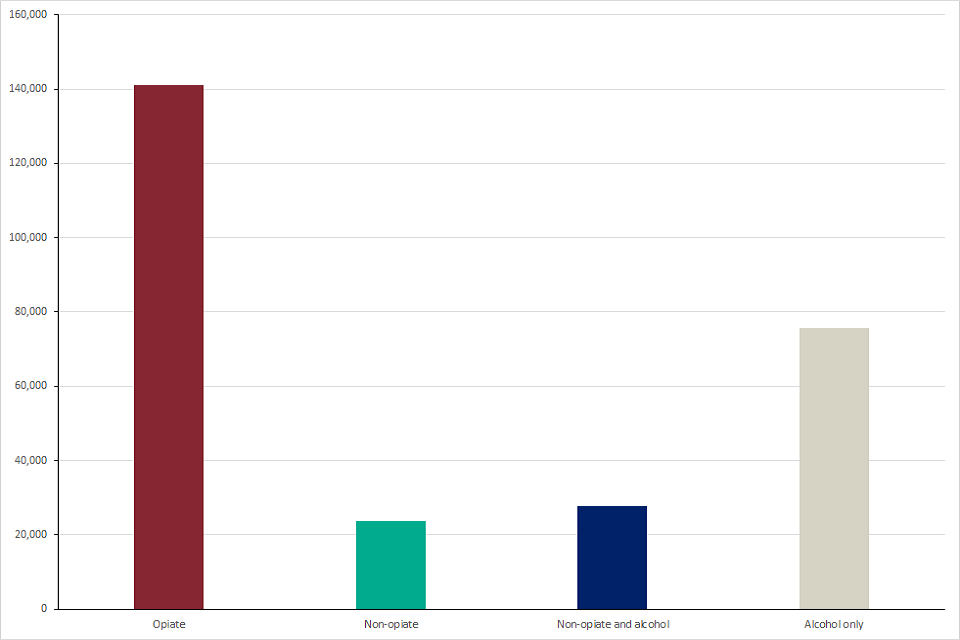
Graph showing the numbers of people in alcohol and drug treatment in 2017 to 2018 for the 4 main substance groups
Figure 2: Percentages in treatment by main substance group: 2017 to 2018
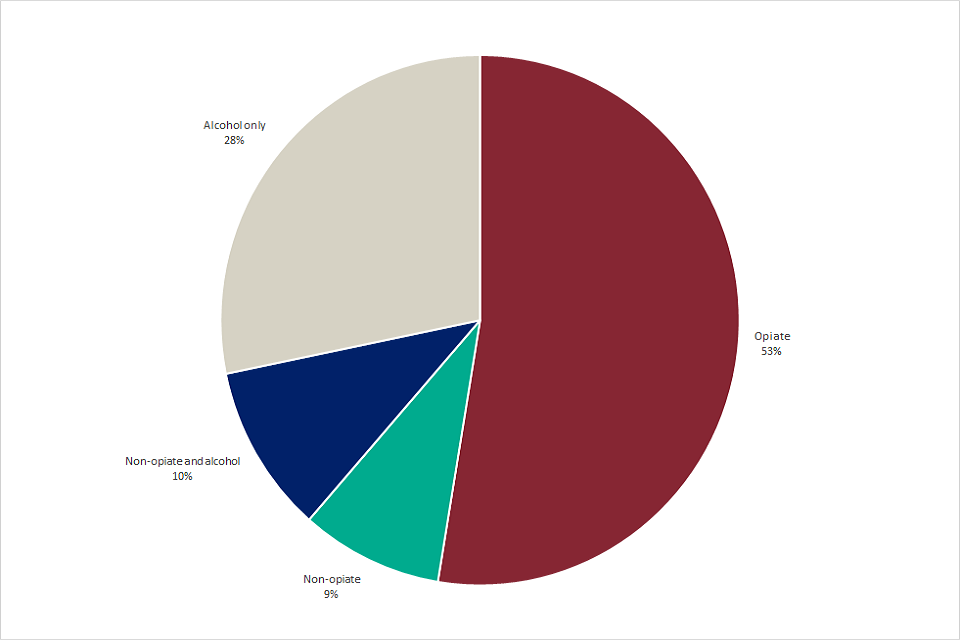
Chart showing the percentages of people in alcohol and drug treatment in 2017 to 2018 for the 4 main substance groups
2. Trends in treatment numbers and substance use
There were 268,390 adults in contact with drug and alcohol services in 2017 to 2018, which is a 4% reduction from the previous year (279,793).
The number of people receiving treatment for alcohol alone decreased the most since last year falling by 6%, (80,454 to 75,787) and by 17% from the peak of 91,651 in 2013 to 2014.
There were an estimated 589,101 adults with alcohol dependency in need of specialist treatment in 2016 to 2017. These alcohol dependency estimates have remained relatively stable over the last 5 years, which suggests that the falls in the numbers of alcohol-dependent people accessing treatment does not reflect a fall in prevalence, with only 1 in 5 of those in need of treatment currently receiving it.
People in treatment for opiate dependence made up the largest proportion of the total numbers in treatment (53% or 141,189). This is a fall of 4% since the previous year.
The number of people entering treatment who were in the non-opiate group and the non-opiate and alcohol group (35,473) was broadly the same as the previous year (35,491). However, the number of people being treated for crack cocaine problems – people using crack but not opiates – increased by 18% since last year (3,657 to 4,301) and 44% since the year before that (2,980 to 4,301).
The increase of numbers of people in treatment for crack but not opiates during 2017 to 2018 was seen in all age groups except 65 years and over.
There was also a 3% increase in people entering treatment for both crack cocaine and opiate problems (21,854 to 22,411), which was seen primarily in those aged 35 and over. This represents over half (54%) of people entering treatment for opiate problems in 2017 to 2018, compared to 35% in 2005 to 2006.
The latest published estimates of crack cocaine use in England (2014 to 2015) reported a 10% increase in the numbers of people estimated to be using the substance since 2010 to 2011 (166,640 to 182,828).
It is likely that the recent increase in the number of people entering treatment for crack problems reflects the rise in the prevalence of the drug’s use. The increase in the number of new users may be in part caused by changes in the purity and affordability of crack cocaine and patterns of distribution over the last few years. The latest report from the UK Focal Point on Drugs has information about increases in purity.
3. New psychoactive substances and club drugs
There were 1,223 people who had problems with new psychoactive substances (NPS) starting treatment in 2017 to 2018, which is a 16% decrease on the previous year (1,450) and a 40% decrease on the year before that (2,042). This fall was mainly driven by a 36% reduction in under 25-year-olds entering treatment for NPS problems (321 in 2016 to 2017 dropping to 206 in 2017 to 2018).
People who are in treatment for NPS problems were more likely to be homeless (25%), compared to those not using these substances at the start of treatment (8%). This has increased from 6% in 2013 to 2014.
There was a 7% fall in the number of people entering treatment for ecstasy problems in 2017 to 2018 (1,013 to 939), with a much larger decrease of 53% recorded in the number starting treatment for problematic mephedrone use.
4. Smoking
For all substance groups, the smoking rates at the start of treatment are substantially higher than the national rate of smoking among adults, reported by the Office for National Statistics (ONS) (14.9%).
People in treatment for opiates had the highest reported rates of smoking when starting treatment (68%). This was closely followed by people in treatment for non-opiates and alcohol, and non-opiates only (61% and 57% respectively). People in treatment for problematic alcohol use only had the lowest rates, with 42% smoking at the start of treatment.
5. Age groups
People in treatment for only alcohol and only opiate use tended to be older than those who have problems with other substances. The median age of the alcohol only group was 46 years, with 12% (8,945) aged 60 years and older. Opiate treatment clients had a median age of 40.
There were 10,666 people aged 18 to 24 who started treatment in 2017 to 2018. The majority of these had problems with cannabis (5,791 or 54%), alcohol (4,793 or 45%) or cocaine (3,131 or 29%). Overall, the number of under-25s accessing treatment has fallen by 50% since 2005 to 2006. This reflects changes in the patterns of drinking and drug use in this age group over the last 12 years, shown by Public Health England’s prevalence estimates and the Home Office’s Crime Survey for England and Wales.
However, while the number of young adults in treatment is relatively low, there was a 15% increase in under 25s entering treatment for crack cocaine problems, where the crack was not used alongside opiates, which is an increase from 364 to 417 people. This is the second year running that there has been a rise in people starting treatment for crack cocaine in this age group.
6. Gender
Males made up 69% of the entire treatment population in 2017 to 2018. The gender split varied depending on the substances people were in treatment for. For example, 73% of people with drug problems were male, compared to 60% in the alcohol only group.
7. Ethnicity
People recorded as white British made up the largest ethnic group in treatment, (84% or 222,775) with a further 5% from other white groups. No other ethnic group made up more than 1% of the total treatment population.
8. Parental status and safeguarding children
Information on the parental status of people starting treatment and on safeguarding children and young people has been introduced into the NDTMS annual statistics report for the first time this year. There were 25,593 people who started treatment in 2017 to 2018 (20%) who said they lived with a total of 46,109 children under 18. This figure includes parents living with their biological children and those living with children of a partner or another member of the household.
There were a further 38,852 (31% of the total) who said they were parents but did not currently live with their children. People in treatment for opiates had the highest rates of not living with their children (39%), compared to those in alcohol only treatment (26%).
The majority of parents or people living with children (44,647 or 69%) said that these children were not receiving early help services (as defined in Working Together to Safeguard Children 2018) or engaged with children’s social care services.
Eight percent (4,409) of parents or people living with children said that a child protection plan was in place. A further 5% (2,688) were looked after children and 3% (1,845) were engaged with child in need services and a further 3% (1,699) were receiving early help services.
9. Mental health
Information on whether a person starting treatment has a mental health need has also been introduced into this report for the first time this year. There were 52,397 people (41%) reporting their mental health status who said they had a mental health treatment need. People in the non-opiate and alcohol group had the highest levels of a mental health treatment need (47%) and opiate users had the lowest (39%). It is very common for people to experience problems with their mental health and alcohol or drug use at the same time and research published by the American Psychological Association shows that people with these co-occurring conditions have a greater risk of other health problems and early death.
Three-quarters of the people reporting a mental health treatment need (74% or 38,646) also said that they were currently receiving treatment for their mental health. Just under half of these (48% or 24,767) received treatment from their GP and a further 22% (11,542) were engaged with community mental health services.
10. Treatment exits and successful completions
There were 121,332 people who exited the drug and alcohol treatment system in 2017 to 2018, with 48% (58,718) having successfully completed their treatment, free from dependence. This compares to 49% the previous year.
Alcohol only treatment clients had the highest rates of successful treatment exits, with 61% completing treatment successfully, the same proportion as the previous year. Non-opiate only clients followed this, with 56% leaving successfully, a decrease from 59%.
Opiate treatment clients had the lowest rate of successful exits at 26%. This was the same as last year but down from a peak of 37% in 2011 to 2012. A large proportion of the opiate users in treatment have entrenched long-term drug use, are often in ill health and less likely to have access to the personal and social resources that can aid recovery, such as employment and stable housing. This often results in opiate users being less likely to complete treatment successfully or sustain their recovery, when compared to people who use other drugs, or only alcohol.
11. Deaths
The total number of people who died while in contact with treatment services in 2017 to 2018 was 2,660 (1% of all individuals in treatment). This is similar to the previous year when there were 2,680 deaths in treatment (1% of all individuals in treatment).
The number of people in the opiate group who died in treatment decreased very slightly since the previous year from 1,741 to 1,712. Deaths as a proportion of all opiate clients in treatment remained at 1.2%. The median age of opiate treatment clients recorded as having died in 2017 to 2018 was 45 and 77% were male.
The number of deaths for users of other drugs rose slightly from 172 in 2016 to 2017 to 174 in 2017 to 2018.
Drug use is a significant cause of premature mortality in the UK, as ONS statistics have shown. In England, the number of deaths from drug misuse registered in 2017 decreased by 3.2% to 2,310. This is the first decrease since 2012 and follows increases of 3.7% between 2015 and 2016, 8.5% between 2014 and 2015 and 17% between 2013 and 2014.
The number of registered heroin deaths decreased by 3.7% from 1,209, the highest number on record in 2016, to 1,164 in 2017. Treatment has been demonstrated to provide some protection against drug-related deaths, and these numbers would likely be even higher without the harm reduction safeguards it provides.
There were 774 deaths in 2017 to 2018 among people accessing treatment for alcohol problems only, which was a 1% increase on the previous year. Deaths as a proportion of all people in the alcohol only group were 1%. The median age of these deaths was 50 and 64% were male.