Severe mental illness (SMI): inequalities in cancer screening uptake report
Published 21 September 2021

© Crown copyright 2021
This publication is licensed under the terms of the Open Government Licence v3.0 except where otherwise stated. To view this licence, visit nationalarchives.gov.uk/doc/open-government-licence/version/3 or write to the Information Policy Team, The National Archives, Kew, London TW9 4DU, or email: psi@nationalarchives.gov.uk.
Where we have identified any third party copyright information you will need to obtain permission from the copyright holders concerned.
This publication is available at https://www.gov.uk/government/publications/severe-mental-illness-inequalities-in-cancer-screening-uptake/severe-mental-illness-smi-inequalities-in-cancer-screening-uptake-report
Purpose of this report
Public Health England’s (PHE) report on Severe mental illness (SMI) and physical health inequalities highlights that people with a recorded diagnosis of SMI are more likely than the general population to experience poor physical health and to die prematurely. People with SMI in England:
-
die on average 15 to 20 years younger than the general population
-
are 4.7 times more likely to die under the age of 75 than people without SMI
International research suggests that the incidence of most cancers is similar among people with and without SMI (Reference 4, 5). However, among people with a cancer diagnosis, those who also have SMI are more likely to die from the cancer (the case fatality is higher). (Reference 4 to 12)
Recently published PHE analysis suggests that between 2016 and 2018 adults with SMI were 2.1 times more likely to die from cancer under the age of 75 than people without SMI, and that cancer was the leading cause of premature mortality among people with SMI, above cardiovascular, respiratory and liver diseases. This is in line with previous data about the period between 2004 and 2013.
It has been suggested that this is contributed to by reduced uptake of cancer screening services, delayed cancer diagnosis, treatment choices and adherence to treatment plans. (Reference 7, 14 to 18)
For this reason, PHE analysed inequalities in the uptake of bowel, breast and cervical screening by people with and without SMI. These are the 3 national cancer screening programmes in England. This report presents the findings.
This report is part of a larger ongoing exploration into the causes of high premature mortality among adults with SMI. Cancer is one of the underlying causes of death, and screening just one component within that. There are other stages in the prevention, diagnosis and care pathway that also need to be considered to understand and address the complete inequality in mortality.
Main findings
Among people who were registered with a GP in England on 25 September 2018, people with SMI were more likely not to have participated in bowel, breast or cervical screening within the recommended time period than people without SMI.
This difference is here described as ‘more likely not to participate’ rather than ‘less likely to participate’ because it simplifies the subsequent quantification of the gap.
People with SMI were 18% more likely not to have participated in breast screening; 20% more likely not to have participated in cervical screening; and 31% more likely not to have participated in bowel screening, within the recommended time period than people without SMI. This is evidence of an inequality in the uptake of each of England’s national cancer screening programmes.
These findings are based on PHE’s analysis of a sample of primary health care data. The primary health care data used includes records of health screening, diagnoses of SMI and prescriptions of lithium, so did not need to be linked to other data sets for this analysis.
In addition to the headline findings outlined above, the following were also observed.
Cervical screening by age group
The inequality in the uptake of cervical screening was driven by differences in the 45 to 64 year age group. No evidence of an inequality was observed between people with and without SMI in the 25 to 44 year age group. Older women with SMI were more likely not to have participated in cervical screening within the recommended time period than older women without SMI.
Use of cervical cytology exception report codes
Women with SMI were almost 70% more likely to have a ‘cervical cytology exception report code’ on their record than women without SMI. These codes may be added to a patient’s record if the service is considered inappropriate for them, even though the patient meets the eligibility criteria for screening. This is a potentially concerning inequality that needs further analysis. The codes enable a person to be ‘exception reported’ and removed from the Quality Outcomes Framework (QOF) reporting. However, it should be noted that the person would remain on the cervical screening coverage standard for the programme.
As there is not a QOF business rule for breast or bowel screening, the use of exception report codes was not assessed for these programmes.
Bowel screening by gender
The size of the inequality in uptake of bowel screening was similar for women and men. However, overall, men were more likely not to have participated in bowel screening than women. This was true among people with and without SMI. Within the sample, men with SMI were the most likely not to have participated within the recommended time period (64%), followed by:
- women with SMI (56%)
- men without SMI (49%)
- women without SMI (42%)
Summary recommendations for future analysis
This report highlights inequalities in the uptake of bowel, breast and cervical screening between people with and without SMI.
The findings do not:
- reveal why these inequalities exist
- give much detail about where the inequalities are greatest
- test whether the inequalities are the reflection of a third variable (such as deprivation)
From an analytical perspective, future work should attempt to answer these questions.
These findings also highlight the need to examine whether there are inequalities in the uptake of other screening programmes such as diabetic eye screening and abdominal aortic aneurism screening.
Background
SMI
For the purposes of this analysis, all people with a record indicating a diagnosis of schizophrenia, bipolar affective disorder or other psychoses, as well as those on lithium therapy, were identified within the sample data’s active cohort as ‘with SMI’. This definition is aligned with the definition used to construct the Quality and Outcome Framework (QoF) SMI register.
SMI in the community
This report’s findings are limited to people who were registered with a GP on 25 September 2018. This means that some groups of people were excluded from the analysis. For example, people who were in long term inpatient care, homeless or in prison may have been removed from their GP’s register.
Screening
Screening aims to identify disease at an earlier stage than it would present symptomatically. This often means that treatment can be more effective. People for whom early stage cancer is detected by screening are usually asymptomatic. The NHS offers a range of screening tests to different sections of the population. Three of these tests aim to identify people with early stage bowel, breast and cervical cancer. They are the national cancer screening programmes, offered to people based on their age and gender.
This report uses ‘uptake of screening’ and ‘participation in screening’ interchangeably to describe the action of completing a screening test.
Bowel cancer and screening
Bowel cancer is a general term for cancer in the large bowel. It is sometimes called colon, rectal or colorectal cancer.
Bowel cancer is the fourth most common cancer in England. In 2017 it accounted for 10.3% of cancer cases in women and 12.4% of cancer cases in men.
The NHS bowel cancer screening programme was introduced in England in 2006 and is currently available to people aged 60 to 74. Its initial component is a home testing kit, sent to people who are registered with a GP every 2 years. In August 2018, ministers agreed that bowel screening should start at the age of 50. The programme is scheduled to expand to 56 year olds this year (2021).
People who are eligible for bowel screening get an invitation letter, along with an information leaflet explaining screening and its possible benefits and risks. About a week later they receive a test kit with instructions on how to use the kit at home. The individual then sends their completed kit to a laboratory for testing.
Individuals with a result that requires further investigation are offered an appointment to discuss their results with a specialist screening practitioner (SSP). At this appointment they also discuss the next steps in the care pathway, assessing the person’s fitness for colonoscopy and explaining the benefits and potential harms of undergoing a diagnostic test.
The data informing this briefing relates to the period between 2016 and 2018. In June 2019 a new test kit called the faecal immunochemical test (FIT) was introduced. This briefing measures the extent to which eligible people had participated using the previous screening test kit, which was called the guaiac faecal occult blood test (gFOBT).
The cancer services profile includes an indicator on bowel screening coverage. In April 2018, 5.3 million people in England had participated in bowel screening within the recommended time period (60.5% of the eligible population).
Breast cancer and screening
About 1 in 8 women in the UK are diagnosed with breast cancer during their lifetime. If it is detected early, treatment is more likely to be more successful and there is a better chance of recovery. Breast cancer is the most common cancer in England among women, accounting for 30.7% of cases in 2017. It accounted for 50% of cancer cases in women aged 45 to 54, and 37% in women aged 55 to 64.
The NHS breast cancer screening programme was introduced in England in 1988 and is available to women aged 50 to 70. The programme aims to find breast cancers early. It uses an X-ray test called a mammogram that can spot cancers when they are too small to see or feel.
All women aged between 50 and 70 who are registered with a GP are automatically invited for breast cancer screening every 3 years.
The cancer services profile includes an indicator on breast screening coverage. In April 2018, 5.2 million people in England had participated in screening within the recommended time period (71.6% of the eligible population).
Cervical cancer and screening
Cervical cancer is the second most common cancer among women aged 15 to 44 in England. In 2017 it accounted for 11% of cancer cases among this group.
The NHS cervical screening programme was introduced in England in 1988 and is available to women and people with a cervix aged 25 to 64. All eligible people who are registered with a GP (as female) automatically receive an invitation by mail. Trans men (assigned female at birth) do not receive invitations if registered as male with their GP but are still entitled to screening if they have a cervix.
Cervical screening detects the human papillomavirus (HPV). HPV can cause abnormal cells on the cervix. If HPV is found a cytology test is used as a triage, to check for any abnormal cells.
If no abnormal cells are found during the cytology test, a follow-up screen is arranged for 12 months’ time. This will check to see if the immune system has cleared the virus.
Most HPV infections are transient, and slightly abnormal cells often revert to normal when the virus clears. If HPV persists, abnormal cells can, if left untreated, turn into cancer over time.
If abnormal cells are found, the individual will be referred to colposcopy.
The first cervical screening invitation is sent to eligible people at the age of 24.5 years. People aged 24.5 to 49 receive invitations every 3 years. People aged 50 to 64 receive invitations every 5 years. The cancer services profile includes an indicator on overall cervical screening coverage. In April 2018, 10.9 million people in England had participated in cervical screening within the recommended time period (72.6% of the eligible population).
Methodology
This report is based on a retrospective matched cohort study using a sample of primary health care data.
Sample primary care data (THIN1909) was used to analyse a snapshot of people with and without previous SMI on 25 September 2018. All people with an SMI diagnosis (using QOF definitions) or a prescription of lithium medication were identified within the snapshot’s active cohort as ‘with SMI’.
The sample of data included 831,380 active patients from 108 General Practices in England. Of this, 10,507 people were identified as having SMI. The remaining 820,873 people did not have any record to indicate previous SMI.
Of people with SMI, 3 sub-cohorts were created composed of those eligible for bowel, breast and cervical screening. Eligibility was based on age and gender. Adults aged between:
- 25 and 64 (and female) were identified for the cervical screening cohort
- 50 and 70 (and female) were identified for the breast screening cohort
- 60 and 74 were identified for the bowel screening cohort
It is possible for individuals to be in more than one cohort.
A matched cohort of people with no record of SMI was created for each of these 3 sub-cohorts. Each eligible person with SMI (separately for each screening programme) was randomly matched with 6 eligible people of the same 5 year age group, gender and GP, but without SMI.
The number of people who had participated in screening within the recommended time period in each cohort was compared. A chi square test was calculated to detect a difference in uptake of screening between those with SMI and those without. The relative prevalence of not participating in screening within the recommended period and the absolute difference in uptake proportions were calculated as complementary quantifications of the inequalities.
Analysis of the cervical screening programme was further broken down into 2 age bands. These age bands were chosen to split the total cohort age range in half. Future analysis should compare the programme age groups instead (25 to 49 and 50 to 64, rather than 25 to 44 and 45 to 64).
The use of cervical cytology exception reporting codes in each cohort was also compared using the same set of descriptive statistical tools. This was not done for the bowel and breast screening programmes, because there was not a corresponding QOF business rule for them.
Analysis of the bowel screening programme was further broken down by sex.
These descriptive statistics tell us whether there is evidence of a difference in underlying likelihood of not taking up each screening programme between people with and without SMI, and how big that difference may be.
This methodology identifies differences between particular groups, but not causation between exposures and outcomes. It is possible that the likelihood of not participating in any of the screening programmes within the recommended time period is greater among people with SMI, but that this difference is not caused by the SMI itself. Age, gender and GP are controlled for, but other factors such as employment status, neighbourhood deprivation, physical disability, ethnicity and level of education are not. This report does not comment on causation. It only describes difference between 2 groups.
An extra 6 months is added to each recommended time period between screens to allow for repeated invitations and appointment bookings. The final recommended time periods between screenings used in this analysis are:
- 2.5 years for bowel screening
- 3.5 years for breast screening and cervical screening (where the individual is aged 25 to 49 years old)
- 5.5 years for cervical screening (where the individual is aged 50 to 64 years old)
Read codes were used to identify people with an SMI diagnosis and uptake of screening. Code lists were compiled using QOF business rules, the Clinical Terminology Browser and expert consultation. Drug codes were used to identify people with a prescription of lithium medication. Tables listing the relevant Read and Drug codes used in this analysis are available on request.
Results
Cohort sizes
The final cohort sizes are presented in Table 1.
Table 1: Cohort sizes for each cancer screening programme.
| Screening programme | Eligible cohort with SMI | Matched cohort without SMI |
|---|---|---|
| Bowel screening | 2,372 | 14,232 |
| Breast screening | 2,447 | 14,682 |
| Cervical screening | 3,552 | 21,312 |
Source: The Health Improvement Network (THIN), Active patients in England, data extracted September 2019.
People in England can move between GPs at their own discretion. When this happens, sometimes records are transferred from one GP to the next, but sometimes they are not. This will vary from patient to patient. Because of this, in the data set used for this analysis, people who moved between GPs within the relevant time period prior to September 2018 cannot be classified as not having participated in screening within the recommended time period.
This problem does not apply to operational analysis conducted by screening services, where the screening record is linked to the individual irrespective of the GP practice they are registered with. This is a separate data set to the one used in this analysis. However, in that data set it is not possible to identify people with SMI, which is why this analysis cannot currently be conducted on that data set.
Because of this, each cohort was further split into 2 groups, those who:
-
had been at their current GP for at least as long as the relevant time period (the recommended period between screenings)
-
registered with their current GP more recently
The headline estimates of inequality presented in this report are based on the people in the first group only (those who had been registered at their GPs for at least as long as the relevant time period). The number of people from each cohort who had been registered at their current GP for long enough is presented in Table 2. Supplementary analysis was also done on the second group (those who registered with their current GP more recently). This is presented separately as the results cannot be conclusive.
Table 2: People within each cohort who had been registered with their current GP for longer than relevant time period (number and % of total).
| Cohort with SMI | Cohort without SMI | |
|---|---|---|
| Bowel screening | 2,181 (92%) | 13,046 (92%) |
| Breast screening | 2,161 (88%) | 12,840 (87%) |
| Cervical screening | 2,781 (78%) | 16,322 (77%) |
Source: THIN, Active patients in England; data extracted September 2019.
Inequalities in the uptake of bowel screening
Among those who had been registered at their current GP for at least 2.5 years, 41% of eligible people with SMI participated in bowel screening within the recommended time period, compared to 55% of people without SMI (Table 3). This is marginally less than the proportion reported in the cancer services profile.
Table 3: People who had participated in bowel screening within the recommended time period.
| No SMI | SMI | |
|---|---|---|
| Participated within the recommended period | 7,181 | 892 |
| Had not participated within the recommended period | 5,865 | 1,289 |
| Chi square test statistic | 150.1 |
| Significance level (p value) | <0.001 |
| Proportion | No SMI | SMI |
|---|---|---|
| Proportion of eligible people who participated within the recommended period | 55% | 41% |
| Proportion of eligible people who had not participated within the recommended period | 45% | 59% |
Source: THIN, Active patients in England; data extracted September 2019.
Evidence that there is an inequality between people with and without SMI
The chi square test statistic is significant at the 95% confidence level. This is evidence that there is an underlying inequality in the uptake of bowel screening between people with and without SMI. People with SMI are less likely to participate in bowel screening than people without.
Absolute difference in participation in bowel screening within the recommended period
The ‘absolute difference’ is one way of quantifying the inequality between people with and without SMI.
The absolute difference in proportions was 14 percentage points. This means that, for every 100 people with and without SMI, 14 fewer people with SMI than without participated in bowel screening (see Figure 1).
Relative prevalence of not participating in bowel screening within the recommended period
The ‘relative prevalence of non-participation’ is another way of quantifying this inequality (see Figure 2 for inequalities observed in each of the 3 national cancer screening programmes).
The relative prevalence for bowel screening was 1.31. This means that people with SMI were 31% more likely not to have participated in bowel screening within the recommended period than people without. This difference is statistically significant. There is a 95% chance that people with SMI are between 26% and 37% more likely not to have participated in bowel screening within the recommended period.
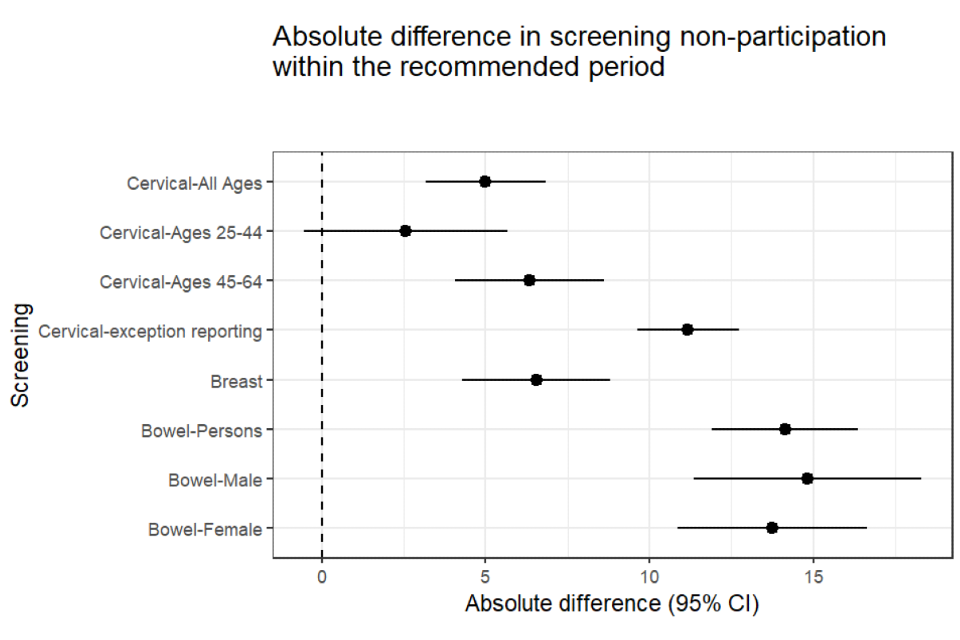
Figure 1: absolute difference with confidence intervals - people with SMI compared to people without (25 September 2018)
Source: THIN, Active patients in England, data extracted September 2018
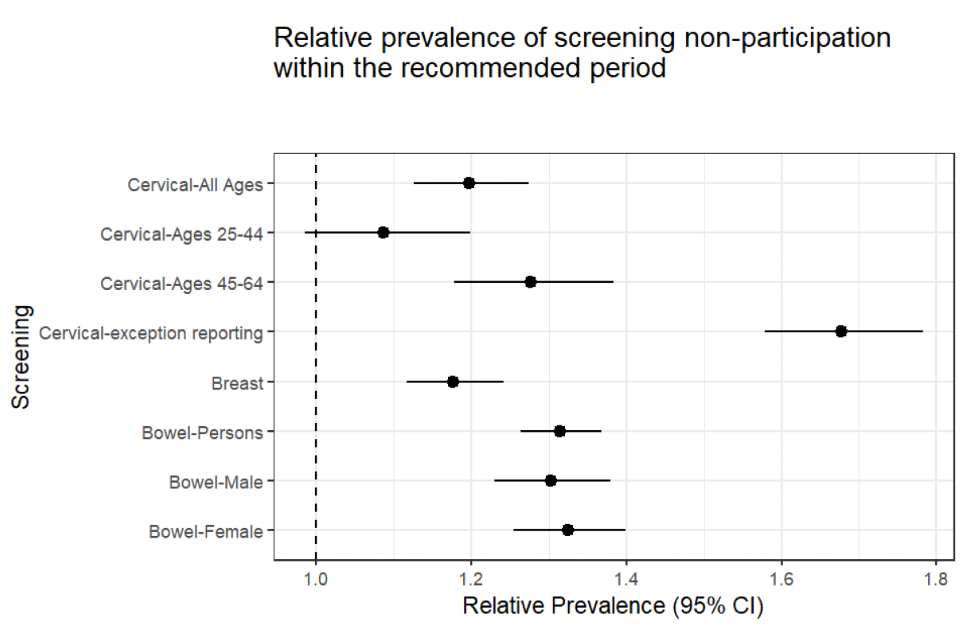
Figure 2: relative prevalence with confidence intervals - people with SMI compared to people without (25 September 2018)
Source: THIN, Active patients in England, data extracted September 2019
Inequality by gender in bowel screening
The overall levels of participation were higher among women than men - this was true for people with and without SMI. Men with SMI were the most likely not to have participated (64%), followed by:
- women with SMI (56%)
- men without SMI (49%)
- women without SMI (42%) (Table 4)
However, there was no evidence of a difference in inequality by gender. Women with SMI were 33% more likely not to have participated in bowel screening than women without SMI. Men with SMI were 31% more likely not to have participated than men without SMI.
Table 4: Chi square tests for a difference between people with and without SMI, prevalence and relative prevalence of not participating in bowel screening
| Registered before recommended bowel screening time period | Chi square test p-value (SMI compared to non SMI) | Relative prevalence of not participating in screening (SMI vs no SMI) (95% CI) |
|---|---|---|
| No record of participating in bowel screening within the recommended period | <0.05 | 1.31 (1.26 - 1.37) |
| No record of participating in bowel screening within the recommended period (Female) | <0.05 | 1.33 (1.26 - 1.4) |
| No record of participating in bowel screening within the recommended period (Male) | <0.05 | 1.30 (1.23 - 1.38) |
| Registered before recommended bowel screening time period | People with SMI | People without SMI |
|---|---|---|
| No record of participating in bowel screening within the recommended period | 59% | 45% |
| No record of participating in bowel screening within the recommended period (Female) | 56% | 42% |
| No record of participating in bowel screening within the recommended period (Male) | 64% | 49% |
Inequalities in the uptake of breast screening
Among eligible people who had been registered at their current GP for at least 3.5 years, 56.5% of the cohort with SMI had participated in breast screening within the recommended time period, compared to 63% of people without (Table 5). As with the bowel screening estimates, this is marginally less than the proportion reported in the cancer services profile.
Table 5: People who had attended breast screening within the recommended time period.
| No SMI | SMI | |
|---|---|---|
| Attended within the recommended period | 8,095 | 1,221 |
| Had not attended within the recommended period | 4,745 | 940 |
| Chi square test statistic | 33.65 |
| Significance level (p value) | <0.001 |
| Proportion | No SMI | SMI |
|---|---|---|
| Proportion of eligible people who attended within the recommended period | 63% | 57% |
| Proportion of eligible people who had not attended within the recommended period | 37% | 43% |
Source: The Health Improvement Network (THIN), Active patients in England; data extracted September 2019
Evidence that there is an inequality between people with and without SMI
The chi square test statistic is significant at the 95% confidence level. This is evidence that there is an underlying difference in the uptake of breast screening between people with and without SMI. People with SMI are less likely to participate in breast screening.
Absolute difference in participation in breast screening within the recommended period
For every 100 people with and without SMI, 6.5 fewer people with SMI than without participated in breast screening (Figure 1).
Relative prevalence of not participating in breast screening within the recommended period
The relative prevalence for breast screening was 1.18 (Figure 2). This means that people with SMI were 18% more likely not to have participated in breast screening within the previous 3.5 years than people without SMI. This difference is statistically significant. There is a 95% chance that people with SMI are between 12% and 24% more likely not to have attended cervical screening within the recommended period (Table 6).
Table 6: Chi square tests for a difference between people with and without SMI, prevalence and relative prevalence of not participating in breast screening
| Registered before recommended breast screening time period | Chi square test p-value (SMI compared to non SMI) | Relative prevalence of not participating in screening (SMI vs no SMI) (95% CI) |
|---|---|---|
| No record of attending breast screening within the recommended period | <0.05 | 1.18 (1.12 - 1.24) |
| Registered before recommended breast screening time period | People with SMI | People without SMI |
|---|---|---|
| No record of attending breast screening within the recommended period | 43% | 37% |
Inequalities in the uptake of cervical screening
Among eligible people who had been registered at their current GP for at least 3.5 years (and aged 25 to 49) or 5.5 years (and aged 50 to 64), 70% of the cohort with SMI had participated in cervical screening within the recommended time period, compared to 75% of people without SMI (Table 7). This estimate is close to the proportion reported in the cancer services profile.
Table 7: People who had participated in cervical screening within the recommended time period.
| No SMI | SMI | |
|---|---|---|
| Participated within the recommended period | 12,195 | 1,939 |
| Had not participated within the recommended period | 4,127 | 842 |
| Chi square test statistic | 30.7 |
| Significance level (p value) | <0.001 |
| Proportion | No SMI | SMI |
|---|---|---|
| Proportion of eligible people who participated within the recommended period | 75% | 70% |
| Proportion of eligible people who had not participated within the recommended period | 25% | 30% |
Source: The Health Improvement Network (THIN), Active patients in England; data extracted September 2019
Evidence that there is an inequality between people with and without SMI
The chi square test statistic is significant at the 95% confidence level. This is evidence that there is an underlying difference in the uptake of cervical screening between people with and without SMI. People with SMI are less likely to participate in cervical screening.
Absolute difference in participation in cervical screening within the recommended period
For every 100 people with and without SMI, 5 fewer people with SMI than without participated in cervical screening (Figure 1).
Relative prevalence of not participating in cervical screening within the recommended period
The relative prevalence for cervical screening was 1.2 (Figure 2). This means that people with SMI were 20% more likely not to have participated in cervical screening within the recommended period than people without SMI. This difference is statistically significant. There is a 95% chance that people with SMI are between 13% and 27% more likely not to have participated in cervical screening within the recommended period (Table 8).
Inequality by age category
The overall inequality in uptake of cervical screening was driven by an inequality among older women. Among younger women, evidence of a difference between people with and without SMI and uptake of cervical screening was not statistically significant (Table 8).
Among women aged 25 to 44 the chi square test p-value was not significant at the 95% confidence level, and the confidence interval around the relative prevalence estimate ranged from 0.98 to 1.2.
However, among women aged 45 to 64 the chi square test p-value was significant at the 95% confidence level, and the confidence interval around the relative prevalence estimate ranged from 1.18 to 1.38. There is a 95% chance that people aged 45 to 64 with SMI are between 18% and 38% more likely not to have participated in cervical screening within the recommended period (Figure 2).
These age categories were chosen to split the programme’s age range (25 to 64) in half. This was to maximise opportunity of identifying inequalities within the two cohorts. However, future analysis should use the programme’s age categories (25 to 49 and 50 to 64).
Table 8: Chi square tests for a difference between people with and without SMI, prevalence and relative prevalence of not participating in cervical screening
| Registered before recommended cervical screening time period | Chi square test p-value (SMI compared to non SMI) | Relative prevalence of not participating in screening (SMI vs no SMI) (95% CI) |
|---|---|---|
| No record of attending cervical screening within the recommended period (all ages) | <0.001 | 1.2 (1.13 - 1.27) |
| No record of attending cervical screening within the recommended period (aged 25 to 44 years) | 0.1 | 1.09 (0.98 - 1.2) |
| No record of attending cervical screening within the recommended period (aged 45 to 64 years) | <0.001 | 1.28 (1.18 - 1.38) |
| Registered before recommended cervical screening time period | People with SMI | People without SMI |
|---|---|---|
| No record of attending cervical screening within the recommended period (all ages) | 30% | 25% |
| No record of attending cervical screening within the recommended period (aged 25 to 44 years) | 32% | 30% |
| No record of attending cervical screening within the recommended period (aged 45 to 64 years) | 29% | 23% |
Cervical cytology exception report codes
Exception reporting removes a patient from an indicator denominator if the Quality and Outcomes Framework defined intervention has not been delivered. Patients on a specific clinical register can be removed from individual QOF indicators if a patient is unsuitable for treatment, is newly registered with the practice, is newly diagnosed with a condition, or in the event of informed dissent. There are 4 specific cervical cytology exception report codes:
-
ca cervix screen - not wanted
-
cerv.smear disclaimer received
-
cervical smear not indicated
-
cervical smear refused
The codes indicate that, while an individual is eligible for the service, they have chosen not to use it. The codes enable the GP to remove that patient from their QOF measure, so that they will not be financially penalised for the individual not using the service.
In this study, 28% of eligible women with SMI had at least one record of a cervical cytology exception report code in their notes, compared to 16% those without SMI. The chi square test result is significant far beyond the 0.95 confidence level.
For every 100 people with and without SMI, 12 more people with SMI than without will have a cervical cytology exception report code in their notes.
The relative prevalence of having an exception report code against your record for patients with SMI compared to patients without was 1.68. This means that people with SMI were 68% more likely than people without to have a cervical cytology exception report code on their record. The 95% confidence interval ranged between 1.58 and 1.78 (Table 9, Figure 2). These results indicate significant confidence that there is a large relative difference in the use of these codes between patients with and without SMI.
This may be a contributory factor to the unequal uptake of cervical screening. However, further analysis is needed to confirm this.
Table 9: Chi square tests for a difference between people with and without SMI, prevalence and relative prevalence of exception reporting
| Chi square test p-value (SMI compared to non SMI) | Relative prevalence (SMI vs no SMI) (95% CI) | |
|---|---|---|
| Cervical cytology exception report code on individual’s record | <0.001 | 1.68 (1.58 - 1.78) |
| Proportions | People with SMI | People without SMI |
|---|---|---|
| Cervical cytology exception report code on individual’s record | 28% | 17% |
The use of exception reporting codes was analysed for cervical screening but not bowel or breast screening because the 4 codes were identified in version 37 of the QOF business rules for indicator MH008. There was not an equivalent indicator or corresponding business rule for breast or bowel screening.
Potential impact of excluding people who registered with their GP recently
To assess the potential impact of excluding people who registered with their GP within the recommended time period for each screening programme, the 4 groups (those with and without SMI, those who registered more recently, and those who registered longer ago) were compared to each other.
For bowel screening, there was no evidence that the cohort with SMI were more or less likely than the cohort without to have registered with their current GP within the 2.5 years running up to 25 September 2018. However, among people who had registered more recently, the cohort with SMI were less likely to have a record indicating participation in bowel screening.
For breast screening, there was no evidence of a difference between people in either cohort, either with respect to having registered at their current GP within the previous 3.5 years or uptake of breast screening among those who registered recently.
For cervical screening, people with SMI were marginally more likely to have registered with their current GP longer than 3.5 or 5.5 years ago (depending on their age) than people without SMI. However, among people who had registered more recently, there was no evidence of a difference in uptake of cervical screening between either cohort.
Because we do not know for sure if patients who have registered recently have not participated in screening within the relevant period, we cannot draw firm conclusions from this. But, as this only applies to a minority of people in each cohort (see Table 2), and there is not clear evidence of strong associations between having SMI and recent registration (see Table 10), it is unlikely to significantly change the overall reported inequalities in the uptake of cancer screening.
Table 10: Chi square tests for a difference between people with and without SMI, depending on registration date
| Chi square test p-value (SMI compared to non SMI) | Relative prevalence (SMI vs no SMI) (95% CI) | |
|---|---|---|
| Registered at GP within recommended bowel screening time period | 0.21 | 0.97 (0.83 - 1.12) |
| No record indicating individual has participated in bowel screening given individual registered within recommended bowel screening time period | <0.01 | 1.18 (1.07 - 1.3) |
| Registered at GP within recommended breast screening time period | 0.23 | 0.93 (0.83 - 1.05) |
| No record indicating individual has attended screening given individual registered within recommended breast screening time period | 0.36 | 1.05 (0.95 - 1.15) |
| Registered at GP within recommended cervical screening time period | <0.05 | 0.93 (0.87 - 0.99) |
| No record indicating individual has participated in screening and individual registered within recommended cervical screening time period | 0.21 | 1.07 (0.97 - 1.18) |
| Proportions | People with SMI | People without SMI |
|---|---|---|
| Registered at GP within recommended bowel screening time period | 8% | 8% |
| No record indicating individual has participated in bowel screening given individual registered within recommended bowel screening time period | 73% | 62% |
| Registered at GP within recommended breast screening time period | 11.7% | 12.5% |
| No record indicating individual has attended screening given individual registered within recommended breast screening time period | 62.9% | 60.1% |
| Registered at GP within recommended cervical screening time period | 22% | 23% |
| No record indicating individual has participated in screening and individual registered within recommended cervical screening time period | 36% | 34% |
Discussion
There has been a long-term ambition to increase the provision of community-based care for people with SMI, and to support people to live well in their communities rather than in inpatient settings. Building the capacity for community mental health services is a crucial feature of the NHS Long Term Plan and the NHS Mental Health Implementation Plan 2019/20 - 2023/24. At the end of September 2019, only 2% of patients in receipt of secondary mental health care were in an open hospital spell - with the remaining 98% out of hospital, generally living in their communities and receiving care through community and outpatient contacts. A hospital spell is a continuous stay of a patient using a hospital bed.
Screening services are an important part of the routine care available to people in their communities. This analysis shows evidence that bowel, breast and cervical screening services are not currently used by people with SMI to the same extent that they are used by people without SMI.
This is an inequality in service use (in this case uptake of screening) and does not necessarily reflect an inequality in access or need. However, existing legal, contractual and policy infrastructure does mandate increased effort to encourage use of services by vulnerable groups.
A mental health condition is considered a disability if it has a long term effect on a person’s normal day-to-day activity. Under the Equality Act 2010, public sector organisations must make changes in their approach or provision to ensure that services are accessible to disabled people as well as everybody else. These changes are referred to as ‘reasonable adjustments’ and can range from building alterations to changes to policies, procedures and staff training.
The Health and Social Care Act 2012 introduced specific legal duties on health inequalities for the Secretary of State for Health (which PHE and other responsible organisations must meet on the Secretary of State’s behalf). The duty requires public authorities to have due regard to the need to reduce inequalities between the people of England with respect to the benefits that they can obtain from the health service.
The service specifications for the bowel, breast and cervical screening programmes govern the provision and monitoring of the services in England. They outline the service and quality indicators expected by NHS England and aim to ensure a consistent and equitable approach throughout the country. Many sections of the service specifications refer to inequalities, but 2 in the breast and cervical specifications are explicitly relevant to this report. Firstly, section 1.20 of both specifications states the requirement to make reasonable adjustments to ensure services are accessible to people with a disability as well as those without. Secondly, section 1.31 states that service providers: “will have procedures in place to identify and support persons who are considered vulnerable or hard to reach”, including people with mental health problems.
While the bowel screening specification does not have the same clauses, it does cite the requirement from the 2010 Equality Act to make reasonable adjustments to ensure services are accessible to people with a disability as well as people without. It also states that:
Safeguarding vulnerable people is at the heart of all health service delivery. NHS England and the Providers are required to ensure that services adhere to local multi agency safeguarding policies and procedures, have appropriate training in place and arrangements to work with local authorities and partner agencies through safeguarding boards and other relevant bodies.
Finally, the 2019 population screening guidance for improving access for people experiencing SMI states that services should:
help reduce health inequalities…, tailoring and targeting interventions when necessary.
A PHE Screening Inequalities Strategy was also published in 2019, looking at a wider range of inequalities across all screening programmes.
There is significant legal, policy and contractual infrastructure already in place to help respond to the inequalities highlighted in this report.
This report fits into a larger ongoing exploration into the causes of high premature mortality among adults with SMI. Cancer is just one of those causes, and screening just one component within that. However, this analysis provides useful information that can be viewed alongside other research when considering the complete prevention, diagnosis and care pathway. It is one step towards understanding and addressing the inequality in mortality.
Limitations
This report has several important limitations.
The sample of primary care data used was not large enough to explore the relationship between the observed inequalities and other characteristics such as ethnicity, deprivation or region. This information is important because it may offer a better understanding of where the inequalities are largest or reveal whether they are actually a reflection of a third variable that is associated with SMI.
It is noteworthy that the proportions of people found to have participated in breast and bowel screening within the recommended time period were marginally lower than those reported in the cancer services profile. On the other hand, the proportion of people found to have participated in cervical screening was slightly larger. It may be that the recording of cervical screening in primary care data sets is more complete than the recording of bowel or breast screening, because the cervical screening takes place within the primary care setting. Nonetheless, there is no obvious reason to suggest that any potential underreporting is different for people with and without SMI, so it is unlikely to significantly change the estimates of inequality. It is also possible that diagnoses of SMI could be underreported, incorrect or biased. For example, staff inputting the data might get into the habit of using more common codes and terms.
The relative prevalence estimates may exaggerate inequalities, especially where the absolute differences or the proportions are small. For example, the relative prevalence of having a cervical cytology report code is nearly 70% for people with SMI, whereas the absolute difference is 12 percentage points. This is compared to a relative prevalence of 31% for non-participation in bowel screening among people with SMI, but an absolute difference of 14 percentage points. It is possible to have a larger relative prevalence but a smaller absolute difference and vice versa. Neither is wrong, but it is important to view both within the context of the proportions being compared.
It is possible that the study design could introduce a survivorship bias to the results. Survivorship bias is a risk for studies that only observe people who are alive at a particular point in time. Anyone who has died before the study period will be excluded from the analysis. As the study is a retrospective comparison of active patients, those who had died before the 25 September 2018 (whether screened or not) were not included. This means that the study population could be biased towards ‘healthier’ or less-diseased people. This may not be an issue if the effect is balanced between the 2 cohorts. However, as the case fatality from cancer, and overall mortality in general, is higher among people with SMI than that among people without, some degree of survivorship bias is plausible. It would particularly bias the results if the sickest SMI patients (with shortest survival) had different screening behaviours. For example, if those patients had poor screening uptake, but are excluded due to early mortality. This bias would mean the estimates presented underestimate the true inequalities.
The data set used does not follow individuals as they move between GPs. This means it is not possible to know whether someone who recently registered with their current GP has not participated in screening. This issue is assessed in the results section of the report and is unlikely to significantly impact on the results.
Finally, it is possible that the practices contributing to the THIN database are not generalisable to England, either because of their coding behaviour or patient mix. A study published in 2011 found that THIN was broadly generalisable in terms of demographics, major condition prevalence and mortality rates (once adjusted for demographics). However, a higher proportion of THIN patients lived in the most affluent areas and a lower proportion were aged under 25 than in the general population.
Recommendations
This report highlights inequalities in the uptake of bowel, breast and cervical screening between people with and without SMI. It has also highlighted inequalities by gender and age for bowel and cervical screening respectively.
The findings do not reveal why these inequalities exist, give much detail about where the inequalities are greatest or test whether the inequalities are the reflection of a third variable (such as deprivation). The following recommendations are about improving understanding of the inequalities. They are about more nuanced future analysis.
Similar analysis should be conducted on a larger dataset such as the Clinical Practice Research Datalink (CPRD). This may allow for a more detailed understanding of the inequalities. With a larger dataset it may be possible to build a logistic regression model to explore the relationship between these inequalities and other characteristics, such as ethnicity, deprivation, type of SMI, other clinical factors or region of the country.
The possibility of expanding the Health and Care of People with Learning Disabilities data collection should be considered. The population with SMI are currently flagged as a comparator group in this publication. It should be possible to extract the same data for people with SMI as that which is already collected for people with learning disabilities, including information about the use of cancer screening services. This large dataset can used to inform analysis disaggregated by Clinical Commissioning Group.
Similar analysis should be conducted on data from prison and mental health inpatient service settings. This report only covers people who were registered with a GP. The inequalities may not be the same among people in prison or mental health inpatient care for long periods of time.
Similar analysis should be conducted with a focus on diabetic eye screening and abdominal aortic aneurism screening, as well as any changes in the uptake of bowel screening following the introduction of FIT. It may be possible to calculate the relative prevalence of non-participation and absolute difference between cohorts for other programmes using data from CPRD.
If the analysis in this report is repeated, any age breakdown for the cervical screening analysis should be consistent with the programme design (25 to 49 and 50 to 64) rather than the age divide used in this report (25 to 44 and 45 to 64).
As of 1 April 2019, exception reporting was replaced with personalised care adjustments (PCAs). This will allow practices to adjust care and remove a patient from the QOF indicator denominator under certain circumstances. Further work should explore whether PCAs are used consistently between people with and without SMI, including a breakdown of the different categories of PCAs, and whether this corresponds with a difference in quality of services received - preventative or otherwise. This should be explored for all screening programmes where possible, not just cervical screening.
Authors and acknowledgements
Authors
This report was produced and authored by the National Mental Health Intelligence Network. There was particular input from Alex Jones, Marta Szczepaniak and Gabi Price, with support from Sulia Celebi, Sue Foster, Chloe Snowdon, Jianhe Peng, Cam Lugton and Julia Verne.
Acknowledgements
A wide range of colleagues from both within and outside PHE contributed to these reports. Our thanks go to:
Colleagues from the following PHE teams: National Screening Programmes, Breast (Jacqui Jenkins), Bowel (Karen Emery-Downing) and Cervical (Ruth Stubbs), the Screening Inequalities team (Jo Taylor) and the Health Equity team (Hashun Mahmood and Judith Kurth).
Colleagues from other government bodies, academia and the third sector organisations: NHS England (Beth McGeever and Matt Wickenden, Nick Wood, Dan Cariad, Phoebe Robinson, Misha Imtiaz, Ali Brabban and Emma Tiffin), University of Southampton (Tony Kendrick), Cancer Research UK (Jodie Moffat), Bowel Cancer UK (Lisa Wilde), Breast Cancer Now (Melanie Sturtevant) and Jo’s Trust (Kate Sanger). Expert advice was provided by Alan Cohen and David Kingdon.
This report was part-commissioned by NHS England.
References
-
Severe Mental Illness - PHE [Internet]. 2021 [cited 2021 May 18]
-
Mitchell A, Nanni MG, Grassi L. Elevated cancer mortality in severe mental illness and schizophrenia: A meta-analysis of 65 population studies. Psycho-Oncology. 2016;25(Supplement 3):116
-
Bowel cancer screening: programme overview [Internet]. GOV.UK. 2015 [cited 2021 May 18]
-
Cancer Services Bowel - PHE [Internet]. 2021 [cited 2021 May 18]
-
Breast cancer screening [Internet]. nhs.uk. 2017 [cited 2021 May 18]
-
Cancer Services Breast - PHE [Internet]. 2021 [cited 2021 May 18]
-
Cervical screening: programme overview [Internet]. GOV.UK. [cited 2021 May 18]
-
Cancer Services Cervical - PHE [Internet]. [cited 2021 May 18]
-
NHS commissioning » Public health commissioning [Internet]. 2021 [cited 2021 May 18]
-
UK National Screening Committee [Internet]. GOV.UK. 2020 [cited 2021 May 18]
-
QOF Frequently asked questions [Internet]. NHS Digital. 2019 [cited 2021 May 18]
-
NHS England » Community mental health services [Internet]. [cited 2021 May 18]
-
Plan NLT. The NHS Long Term Plan [Internet]. NHS Long Term Plan. [cited 2021 May 18]
-
Severe Mental Illness Inpatient Spells - PHE [Internet]. 2021 [cited 2021 May 18]
-
When a mental health condition becomes a disability [Internet]. GOV.UK. [cited 2021 May 18]
-
Equality Act 2010: guidance [Internet]. GOV.UK. [cited 2021 May 18]
-
Reasonable adjustments: a legal duty [Internet]. GOV.UK. [cited 2021 May 18]
-
Health and Social Care Act 2012: fact sheets [Internet]. GOV.UK. [cited 2021 May 18]
-
NHS England » Public health national service specifications 2019/20 [Internet]. [cited 2021 May 18]
-
PHE Screening inequalities strategy [Internet]. GOV.UK. [cited 2021 May 18]