Severe mental illness (SMI) and physical health inequalities: briefing
Published 27 September 2018

© Crown copyright 2018
This publication is licensed under the terms of the Open Government Licence v3.0 except where otherwise stated. To view this licence, visit nationalarchives.gov.uk/doc/open-government-licence/version/3 or write to the Information Policy Team, The National Archives, Kew, London TW9 4DU, or email: psi@nationalarchives.gov.uk.
Where we have identified any third party copyright information you will need to obtain permission from the copyright holders concerned.
This publication is available at https://www.gov.uk/government/publications/severe-mental-illness-smi-physical-health-inequalities/severe-mental-illness-and-physical-health-inequalities-briefing
Purpose
The phrase severe mental illness (SMI) refers to people with psychological problems that are often so debilitating that their ability to engage in functional and occupational activities is severely impaired. Schizophrenia and bipolar disorder are often referred to as an SMI [footnote 1].
Poor physical health is common in people with SMI [footnote 2] with:
- many people experiencing at least one physical health condition at the same time as their mental illness [footnote 2] – this is known as co-morbidity
- frequent diagnoses of more than one physical health condition at the same time as their mental illness [footnote 2] – this is described as multi-morbidity
A few large studies compare the prevalence (the proportion of people with a particular health condition) of physical health conditions in people with SMI with the general population in GP care in England [footnote 3]. Current studies look at London, a small number of specific physical health conditions or overall patterns of inequality with only socio-economic deprivation (lack of material benefits considered to be basic necessities in a society) considered [footnote 3].
Using a large sample of general practice records, the purpose of this report is to:
- increase the understanding of physical health conditions in people with SMI
- add to the intelligence on the health inequality experienced by people with SMI
- provide intelligence that allows the health and care system to focus on key areas for intervention to reduce premature mortality among people with SMI
This report is written for:
- national organisations that lead and develop strategy, policy and guidance on people with SMI
- local organisations that plan, manage and deliver different stages of clinical and preventive care for people with SMI
- local organisations that, along with mental health, manage and treat physical health conditions in people with SMI
This report is part of Public Health England’s (PHE) wider programme of work to reduce the mortality gap and health inequalities in people with mental health problems.
Background and method
People with SMI are at a greater risk of poor physical health and have a higher premature mortality than the general population [footnote 2]. People with SMI in England:
- die on average 15 to 20 years earlier than the general population [footnote 4]
- have 3.7 times higher death rate for ages under 75 than the general population [footnote 5]
- experience a widening gap in death rates over time [footnote 6]
It is estimated that for people with SMI, 2 in 3 deaths are from physical illnesses that can be prevented [footnote 7]. Major causes of death in people with SMI include chronic physical medical conditions such as cardiovascular disease, respiratory disease, diabetes and hypertension [footnote 8].
Compared to the general population, people aged under-75 in contact with mental health services in England have death rates that are [footnote 5] [footnote 9]:
- 5 times higher for liver disease
- 4.7 times higher for respiratory disease
- 3.3 times higher for cardiovascular disease
- 2 times higher for cancer
At the same time, the difference between the death rate in people under 75 years of age in contact with mental health services and the general population is [footnote 5]:
- 84 more deaths per 100,000 population in adults with SMI for liver disease
- 147 more deaths per 100,000 population in adults with SMI for respiratory disease
- 198 more deaths per 100,000 population in adults with SMI for cardiovascular disease
- 142 more deaths per 100,000 population in adults with SMI for cancer
Reducing the difference in the premature death rate from each of the conditions will address health inequality experienced by the population with SMI. However, action to address cardiovascular disease mortality has the potential to impact on most people.
In addition to chronic physical health conditions, suicide is also an important cause of death in the SMI population. Suicide risk in people with SMI is high following acute psychotic episodes and psychiatric hospitalisation. It peaks during psychiatric hospital admission and shortly after discharge [footnote 10]. Other causes of death include substance abuse, Parkinson’s disease, accidents, dementia (including Alzheimer’s disease), and infections and respiratory acute conditions (particularly pneumonia) [footnote 8].
Organisations such as Disability Rights Commission have called upon the government to address this serious inequality of health outcomes [footnote 11]. The NHS Five Year Forward View for Mental Health highlighted the need for action to address the physical health needs of people with SMI in order to reduce this inequality [footnote 7]. A joint report between the Academy of Medical Royal Colleges, the Royal Colleges of GPs, Nursing, Pathologists, Psychiatrists and Physicians, the Royal Pharmaceutical Society, and Public Health England, sets out the essential actions to improve the physical health of adults with SMI across the NHS [footnote 12]. A better understanding of physical health needs in people with SMI under GP care in England will help to identify, design and plan interventions to address this health inequality and to reduce the number of premature deaths.
Using a general practice database, the Health Improvement Network (THIN) [footnote 13] (May 2018), this report examines:
- the recorded prevalence of SMI in England by age, sex and deprivation
- the proportion of people with recorded SMI in England experiencing co-morbidities and multi-morbidities
- inequalities in the co-morbidities and multi-morbidities between SMI and all patients in England by age, sex and deprivation
Analysis is at national (England) level only. Sub-national geographical breakdown is not available as this is not accessible in THIN.
SMI and physical conditions are defined using Quality and Outcomes Framework (QOF) rules [footnote 14] using diagnostic criteria. To make repeating of the data extraction and analysis easier, use of medication prescribing as criteria is not included. Physical conditions included in this analysis are:
- asthma
- atrial fibrillation (AF)
- cancer
- coronary heart disease (CHD)
- chronic obstructive pulmonary disease (COPD)
- diabetes
- heart failure (HF)
- hypertension
- obesity
- stroke
Liver disease is not included in this analysis as the condition is not part of QOF recording.
This analysis uses 95% confidence intervals (CIs) to determine statistical significance and to demonstrate that findings are not due to chance. Differences in the prevalence are considered as statistically significant if the 95% CIs do not overlap. All patient prevalence is used as a reference (point) value and therefore does not include CIs. Rate ratios (calculated by dividing the prevalence in SMI patient by the prevalence in all patients) are used to compare the prevalence in the SMI patients and all patients to indicate the level of health inequality. A rate ratio higher than one indicates higher prevalence in SMI patients.
When presenting findings from the analysis this report uses:
- the same condition order in all charts presenting the prevalence by physical health conditions, with the highest prevalence in the THIN patients first (left of chart) and the lowest prevalence last in the chart (right of chart)
- 3 age groups (15 to 34, 35 to 54 and 55 to 74) in charts presenting the prevalence by age
- deprivation quintiles (5 equal groups into which the population was divided) in charts presenting the prevalence by deprivation
- the same y-axes scale in charts presenting prevalence of physical health conditions and where clear presentation of charts is possible
- different y-axes scale in charts presenting prevalence of physical health conditions only when required to allow a clear presentation of data - this is clearly indicated on the chart
- 95% CI - represented visually in the charts, please see the chart key for details
- rate ratios of prevalence that are shown on the chart above the bars, where bold indicates significantly higher prevalence in SMI patients
When summarising findings from the analysis this report uses:
- ‘all patients’ when referring to all patients (including patients with SMI) aged 15 to 74 in THIN
- ‘SMI patients’ when referring to patients with an SMI diagnosis aged 15 to 74 in THIN
- the same condition order as used in the charts to allow easy cross-referencing
- ‘higher’ or ‘lower’ when describing differences that are statistically significant
This report generally uses the term ‘people with SMI’ when it refers to previous studies and current evidence base.
Full details of the methods used in this report, including strengths and limitations, are available in PHE’s ‘Technical supplement: severe mental illness and physical health inequalities’. Comprehensive data tables are also available in the technical supplement.
Main findings
Results from this analysis confirm findings from previous studies and demonstrate new evidence on inequalities in physical health of people with SMI compared to the general population. The main findings from this analysis:
- confirm that compared to all patients, SMI patients have a higher prevalence of obesity, asthma, diabetes, COPD, CHD, stroke and HF and similar prevalence for hypertension, cancer and AF
- demonstrate that the differences are more pronounced for younger age groups with the highest health inequality in ages 15 to 34 for asthma, diabetes, hypertension and obesity
- demonstrate that SMI patients are more likely (1.3 for female and 1.2 for male) to have one or more of the physical health conditions examined in this analysis than all patients
- demonstrate the health inequality between the SMI and all patients is almost double for multi-morbid (2 or more) of the physical health conditions
- demonstrate that SMI patients aged 15 to 34 are 5 times more likely to have 3 or more physical health conditions and this health inequality reduces with age
- demonstrate that patients living in more deprived areas have a higher prevalence of SMI
- confirm that SMI patients living in more deprived areas have a higher prevalence of physical health conditions
- demonstrate that SMI patients experience inequalities in physical health for obesity, asthma, diabetes, COPD, CHD and stroke after standardising for deprivation as well as age and sex
SMI prevalence
Demographics refer to the number and characteristics of a particular group of people in a specific area, especially in relation to their age, sex, ethnicity, occupation and income. The demographic structure of SMI patients in THIN differs from all patients (Figure 1) and there are:
- fewer patients with SMI in the youngest age groups (0 to 14)
- higher proportions of males with SMI between the ages of 30 and 74
- higher proportions of females with SMI from age 35 years upwards
These demographic differences show that to allow for a comparison between all and SMI patients it is important to account for the age differences. This is known as standardisation. It is often used to summarise disease or death rates in different populations, taking account of differences in age structure, sex or other potential measures, such that comparisons between populations remain meaningful [footnote 15].
Figure 1: Age (years) and sex distribution of patients with a diagnosis of severe mental illness (SMI) compared with all THIN patients
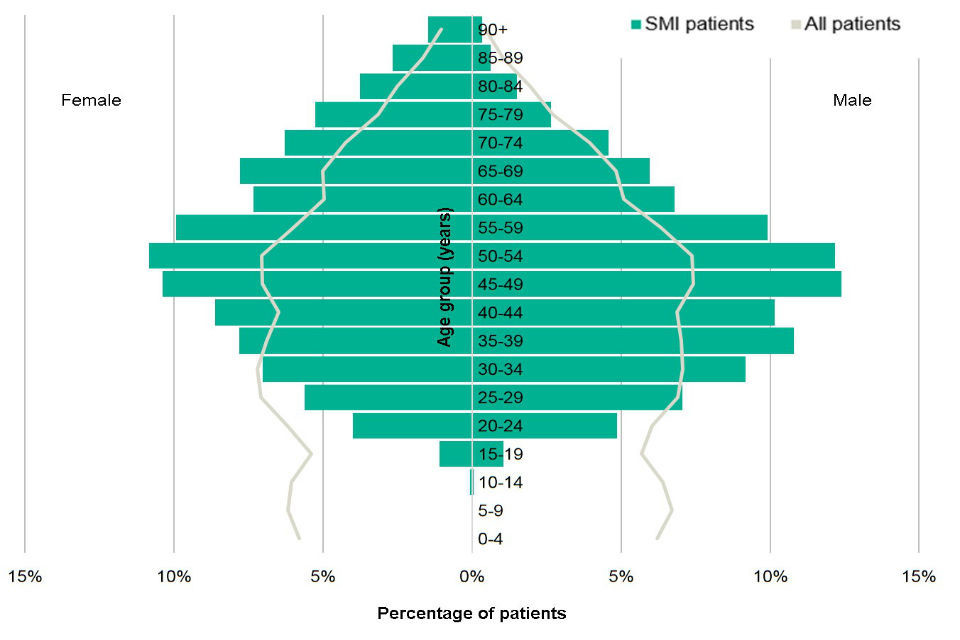
Figure 1 compares the demographic structure (age and sex distribution) of SMI patients with all THIN patients [Source: The Health Improvement Network (THIN), Active patients in England; data extracted May 2018]
Of the 1,051,127 patients aged 15 to 74 in THIN, 9,357 (0.9%) have a SMI diagnosis. The QOF SMI register covers all ages and reports a prevalence of 0.9% for the period April 2016 to March 2017 [footnote 16]. The SMI prevalence for all age in THIN (0.7%) is lower than in QOF. The QOF data includes patients who have had a prescription for lithium (a medication used to treat SMI and most commonly bipolar disorder) in the preceding 6 months. The difference in prevalence rates is partially due to lithium prescribing not being included in the THIN analysis, but possibly also due to differences in the age structures of the THIN and QOF populations. More detail is available from PHE’s ‘Technical supplement: severe mental illness and physical health inequalities’.
Figure 2: Prevalence of severe mental illness (SMI) in patients aged 15 to 74 by sex, age group and deprivation
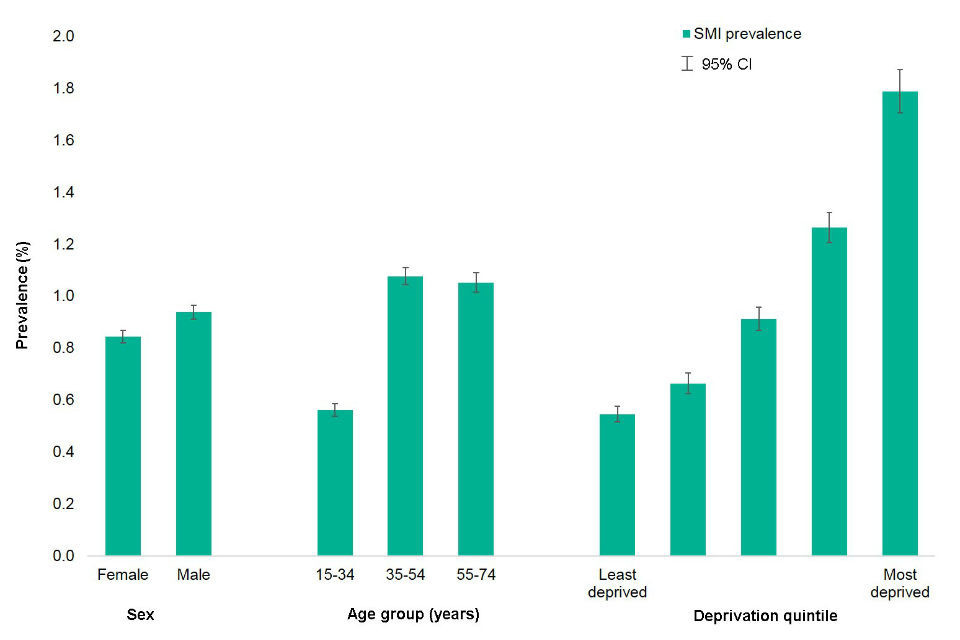
Figure 2 shows the prevalence of SMI by sex, age group and deprivation quintile for those aged 15 to 74 years [Source: The Health Improvement Network (THIN), Active patients in England; data extracted May 2018]
This analysis shows that there are differences in the prevalence within SMI patients (Figure 2) with higher proportions in:
- males (0.9%) than females (0.8%)
- people aged 35 to 74 (1.1%) than 15 to 34 (0.6%)
- patients living in the most deprived areas (1.8%) than in the least deprived areas (0.5%)
It is possible that there are further differences between males and females in the diagnosis of SMI by condition type and age in the THIN patients. Previous research looking at the first recording of SMI diagnosis in primary care in the UK [footnote 17] shows that:
- schizophrenia recording is more common in men than women
- schizophrenia recording in men is more common between the ages 16 and 24, whereas in women it is similar across all ages
- bipolar disorder recording is more common in women than men
- bipolar disorder recording in men is more common between the ages 35 to 44, whereas in women the most common ages of first recording are between 25 and 34
- other psychosis recording is more common in men than women
- other psychosis recording in men is most common between the ages 16 and 24, whereas in women the most common ages of first recording are over 75 years old
Findings from this analysis are consistent with previous research showing higher prevalence of SMI in more deprived areas [footnote 17]. The contribution of factors related to socioeconomic deprivation – such as social stress and poverty – is well documented as both the cause and consequence of SMI [footnote 18]. Social mobility describes the ability of individuals or groups to move upward or downward in status based on wealth, occupation, education, socioeconomic deprivation or some other social variables. It is recognised that individuals with SMI tend to experience a greater downward trend in socioeconomic status over time compared to the general population [footnote 19]. Previous research reports a constant downward social-economic drift among people with SMI, which commonly results in unemployment [footnote 20]. This risk is reported to be higher among men than women. In the youngest age group a marked decline from the parents’ social status is reported [footnote 19]. Therefore, people with SMI have a high risk of social drop-out, including withdraws from competition, education, employment, daily tasks and activities, and established society [footnote 19].
SMI and physical health conditions
The prevalence of physical health conditions in the SMI population in THIN is comparable with the England QOF prevalence for the period April 2016 to March 2017. Prevalence figures from this analysis are:
- within 0.5 percentage points of the QOF values for diabetes, COPD, CHD, AF, cancer, stroke and HF
- 1.4 percentage points higher than QOF for hypertension
- 2.2 percentage points higher than QOF for obesity
- 3 percentage points higher than QOF for asthma
More details on those differences are available from PHE’s ‘Technical supplement: severe mental illness and physical health inequalities’.
This analysis shows that patients with SMI experience poorer physical health compared to all patients (Figure 3). Rate ratios of prevalence between SMI and all patients are indicated above the bars of the charts, where bold indicates significantly higher prevalence for SMI patients.
Figure 3: Prevalence (age and sex standardised) of physical health conditions for severe mental illness (SMI) and all patients aged 15 to 74
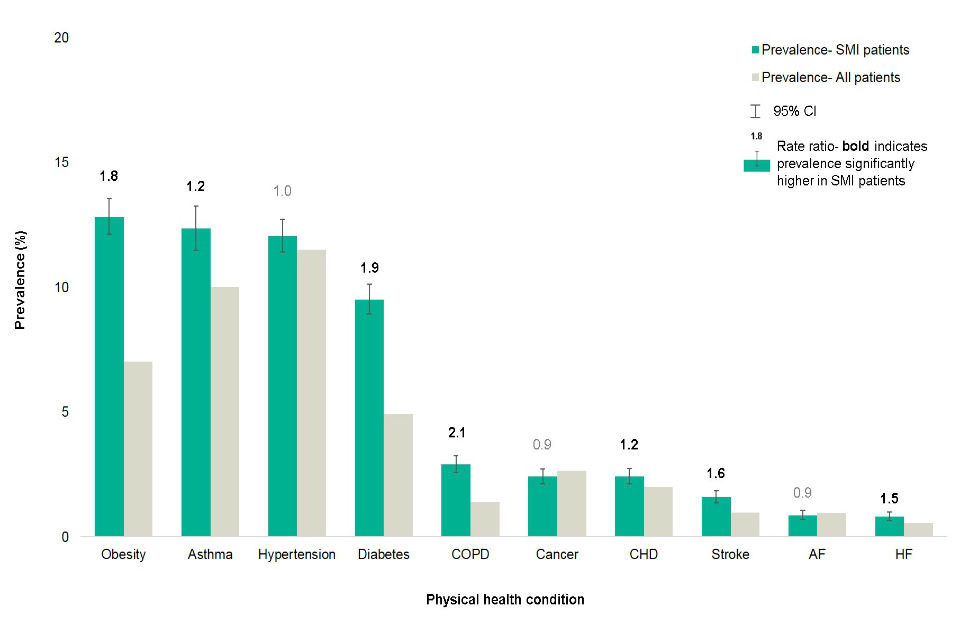
Figure 3 shows the prevalence of the 10 physical health conditions in the patient population aged 15 to 74 years with each, comparing SMI patients with all patients [Source: The Health Improvement Network (THIN), Active patients in England; data extracted May 2018
Key: atrial fibrillation (AF), coronary heart disease (CHD), chronic obstructive pulmonary disease (COPD), heart failure (HF)]
Patients with SMI have a higher prevalence for 7 out of the 10 physical health conditions examined. The level of the health inequality between the SMI and all patients varies between the different conditions analysed (Figure 3). The rate ratio between the prevalence in the SMI and all patients are highest for:
- obesity (1.8 higher for SMI)
- asthma (1.2 higher for SMI)
- diabetes (1.9 higher for SMI)
- COPD (2.1 higher for SMI)
- CHD (1.2 higher for SMI)
- stroke (1.6 higher for SMI)
- HF (1.5 higher for SMI)
Tobacco use is a common risk factor for CHD, COPD, HF and stroke, and high smoking rates in the population with SMI may partially explain higher rates of these conditions [footnote 9]. At the same time, it is also a risk factor for hypertension and cancer, and the prevalence of these is not notably higher for people with SMI.
Findings from this analysis are consistent with other research that document higher prevalence of poor physical health among people with SMI [footnote 2] [footnote 21]. These studies highlight a higher risk of diabetes, cardiovascular conditions, and respiratory illness in people with SMI and findings from this analysis are in agreement with this research. These conditions are known to be affected by health behaviours, such as smoking, poor diet, and drugs and alcohol misuse.
This analysis reports that the level of hypertension in SMI patients is similar to all patients. Although there is no overall health inequality, as the recorded prevalence of hypertension is one of the highest across the examined physical health conditions, it is, therefore, an important co-morbidity for people with SMI. This analysis also shows that there is a clear difference by age with younger patients with SMI having a much higher prevalence of hypertension than their all-patient comparison group (Figure 4). High blood pressure is an important cardiovascular risk factor, and this analysis highlights the importance of early intervention for people with SMI.
This analysis shows that overall cancer prevalence is similar in SMI and all patients. Evidence on the relationship between SMI and cancer prevalence is mixed and some papers report higher prevalence among people with SMI while others suggest no significant difference [footnote 21]. People with SMI on average die earlier than the general population, so it is possible that they die from cardiovascular or other reasons before reaching the expected age of death from cancer [footnote 2]. It is also important to recognise that considering all cancers together will miss the impact of specific cancers and associated risks (such as lung cancer and smoking).
Looking at cancer prevalence alone may not present the whole picture in terms of health inequality. Case fatality is often used as a measure of the severity of a disease and is defined as the proportion of people reported with a specified disease or condition who die within a specified time. People with SMI are reported to have a higher cancer case fatality [footnote 22] and lower cancer survival [footnote 23], which contributes to excess premature mortality. Cancer treatment differs by socio-demographic characteristics [footnote 24]. Patient choice plays an important role in cancer treatment and therefore outcomes [footnote 24]. Factors associated with diagnosis, progression and treatment of disease are likely to play a role in the inequality experienced by people with both SMI and cancer [footnote 24].
Physical health conditions by age
Out of the 10 physical conditions included in this report, robust analysis by age can be only carried out for asthma, diabetes, hypertension and obesity. These conditions have sufficient numbers of patients with SMI in each age group (10 patients or more) to carry out a reliable analysis by age.
Compared to all patients, SMI patients (Figure 4) in this analysis show a higher prevalence of:
- obesity and diabetes across all age groups
- asthma and hypertension for ages 15 to 34 and 35 to 54
Although this study shows that the recorded prevalence of obesity in the SMI patients is higher than for all patients, it is notable that THIN based proportions are lower than 26% of adults (defined as age 16 and over) reported as obese in Health Survey for England (2016) [footnote 25]. Therefore, as both THIN and QOF may be underestimating the prevalence of obesity, it is possible that the level of health inequality between SMI patients and all patients is greater than demonstrated in this analysis.
Figure 4: Age-specific prevalence of physical health conditions for severe mental illness (SMI) patients and all patients aged 15 to 74
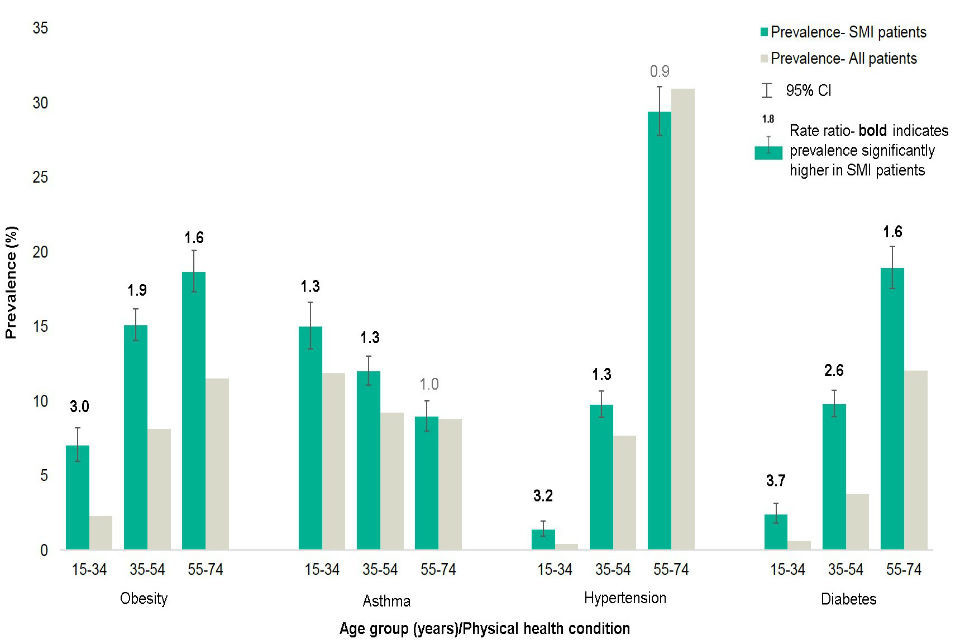
Figure 4 shows the breakdown of physical health conditions in SMI compared to general population by sex [Source: The Health Improvement Network (THIN), Active patients in England; data extracted May 2018
Note: change in y-axis scale to allow clear presentation; COPD, cancer, CHD, stroke, AF and HF were not included in the analysis due an insufficient number of patients in each age group to carry out a robust analysis]
For both SMI and all patients the recorded prevalence of obesity, diabetes and hypertension increases with age (Figure 4). The prevalence of asthma decreases with age. However, for all 4 conditions, the level of health inequalities between the SMI and all patients is higher for younger ages. This analysis shows that compared to all patients SMI patients are:
- 3.0 times more likely to be classified as obese for ages 15 to 34 but only 1.6 time more likely for ages 55 to 74
- 1.3 times more likely to have asthma for ages 15 to 34 and 35 to 54 but for ages 55 to 74 the difference is not significant
- 3.2 times more likely to have hypertension for ages 15 to 34 but only 1.3 times more likely for ages 35 to 54
- 3.7 times more likely to have diabetes for ages 15 to 34 but only 1.6 times more likely for ages 55 to 74
Findings from this analysis showing higher level of inequality for physical health conditions in younger patients with SMI are consistent with other research. For example, a study in London documented a higher risk of type 2 diabetes in younger populations with SMI, which could not be fully accounted for through antipsychotic prescribing, and had diminished by age 55 [footnote 26]. The use of antipsychotic medication is linked to metabolic side effects [footnote 27] and therefore may be a contributory factor to the higher prevalence of obesity, diabetes, CHD and HF in patients with SMI. Metabolic refers to the range of biochemical processes that occur within us (or any living organism). The term metabolic is often used to refer specifically to the breakdown of food and its transformation into energy. Metabolic side effects of antipsychotic medication can include [footnote 27]:
- weight gain
- high blood sugar
- high blood pressure
- high cholesterol levels
- high triglyceride levels
Inequality in death rates for people under 75 with SMI are highest in those aged 30 to 44 who have death rates around 5 times the general population [footnote 8]. As people with SMI die younger than the general population, a decrease in the health inequality for older age groups can be partially explained by shorter life expectancy. This report highlights the need for people with SMI to have:
- physical health assessment early in life
- early intervention to reduce the impact of already existing poor physical health
- early care pathway planning that promotes improvement in physical health for people with SMI
Physical health conditions by sex
After standardising for age, the notable differences in the prevalence of physical health conditions by sex (Figure 5) in SMI patients are:
- obesity in females (13.9%) is higher than in males (11.7%)
- asthma in females (13.9%) is higher than in males (10.8%)
- cancer in females (2.9%) is higher than in men (1.9%)
- CHD in males (3.5%) is higher than in females (1.4%)
- AF in males (1.2%) is higher than in females (0.5%)
For the remaining physical health conditions, the prevalence is similar in males and females.
Figure 5: Prevalence (age standardised) of physical health conditions by sex for severe mental illness (SMI) and all patients aged 15 to 74
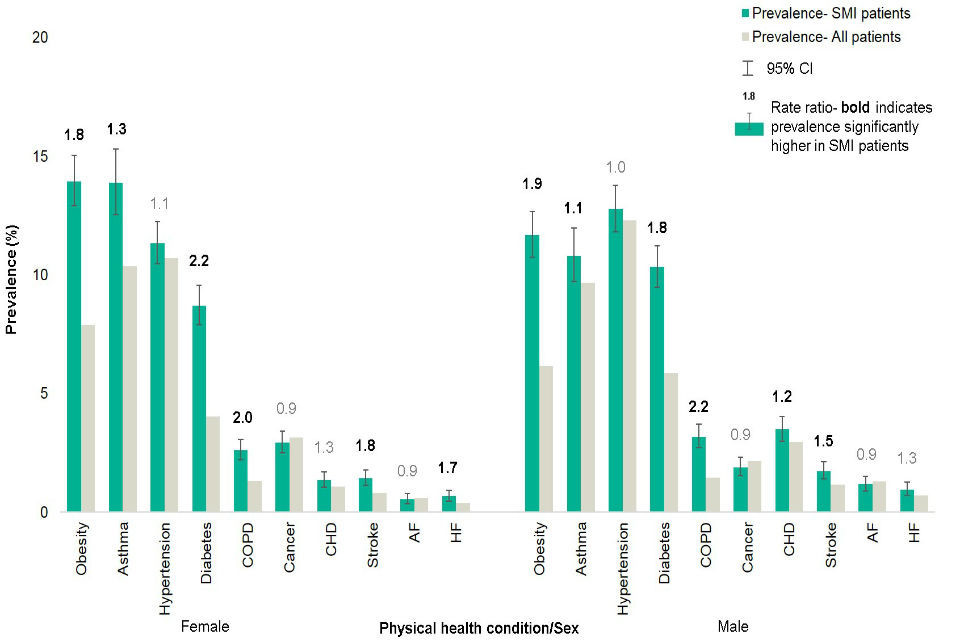
Figure 5 shows the prevalence of asthma, diabetes, hypertension and obesity by age group for SMI patients aged 15 to 74 compared with all patients [Source: The Health Improvement Network (THIN), Active patients in England; data extracted May 2018
Key: atrial fibrillation (AF), coronary heart disease (CHD), chronic obstructive pulmonary disease (COPD), heart failure (HF)]
The rate ratio between the prevalence of physical health conditions in SMI patients and all patients are similar across both sexes (Figure 5). This is consistent with the data on excess mortality which show that both males and females with SMI have premature mortality rates around 3.7 times higher than the general population.
Physical health conditions by deprivation
Out of the 10 physical conditions included in this report, robust analysis by deprivation quintile can be carried out for obesity, asthma, hypertension, diabetes, COPD, CHD, cancer and stroke. These conditions have a sufficient number of patients with SMI (100 cases or more) to carry out a reliable analysis by deprivation quintile. Townsend deprivation scores [footnote 28] are used as this is the deprivation measure available in THIN. To ensure sufficient numbers and robustness of standardisation in relation to deprivation, wider age groups (15 to 34, 35 to 54 and 55 to 74) are used rather than 5-year age groups used for the remaining analysis in this report.
Figure 6 shows findings from the analysis for obesity, asthma, hypertension and diabetes. Figure 7 presents results for COPD, cancer, CHD and stroke. The prevalence of physical conditions by deprivation quintile is based on a smaller number of patients in each group compared to the breakdown by age and sex. Therefore, there is a large variation in the prevalence as represented by the wide confidence intervals. Some apparent differences are more likely to be due to chance rather than being statistically significant and these findings should be considered with a degree of caution.
After standardising for age and sex differences, the prevalence of physical health conditions (Figure 6 and 7) is higher in SMI patients compared to all patients for:
- asthma in most deprived areas (14.2%) than in least deprived (9.6%)
- diabetes in most deprived areas (12.2%) than in least deprived (8.0%)
- COPD in most deprived areas (3.1%) than in least deprived (1.3%)
- cancer in least deprived areas (3.7%) than in most deprived (1.9%)
Only cancer prevalence shows a rising gradient with reducing deprivation. Although cancer incidence is higher in most deprived areas, the number of people living with cancer (prevalence) is often higher in less deprived groups. This is because cancers that are more common in less deprived groups, for example, skin and breast cancers, have a better rate of survival [footnote 21]. This analysis uses a comparison between least and most deprived areas to determine the inequality gap within SMI patients by deprivation. This method (although widely used) does not account for the remaining deprivation quintiles. The use of regression analysis that would include all SMI patients would be a possible alternative to assess the inequality gap.
Figure 6: Prevalence (age and sex standardised) of physical health conditions (obesity, asthma, hypertension and diabetes) by deprivation quintile for SMI and all patients aged 15 to 74
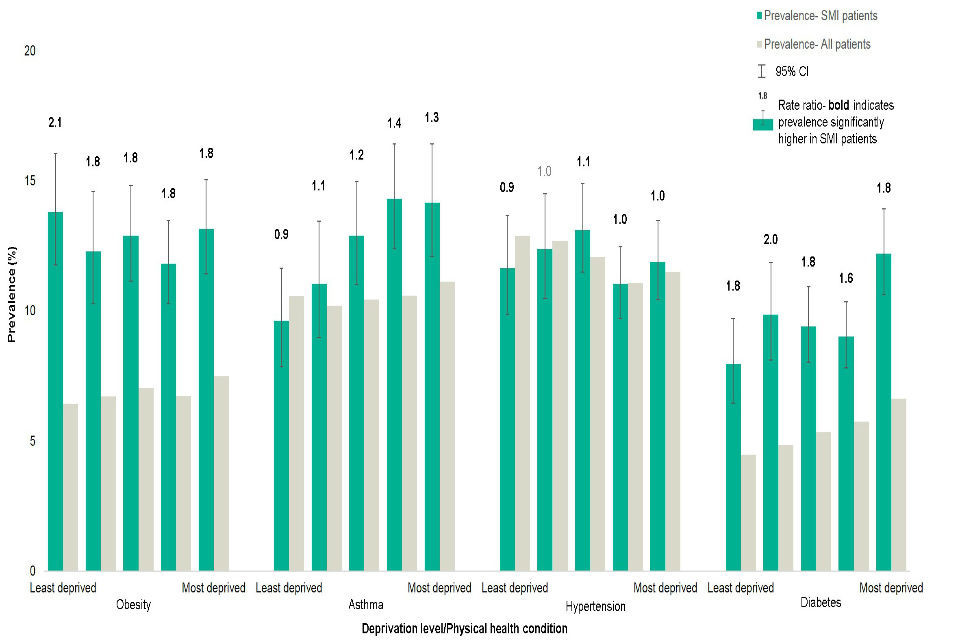
Figure 6 shows the prevalence for obesity, asthma, hypertension and diabetes by deprivation quintile for SMI patients aged 15 to 74 compared to all patients [Source: The Health Improvement Network (THIN), Active patients in England; data extracted May 2018]
Figure 7: Prevalence (age and sex standardised) of physical health conditions (COPD, cancer, CHD and stroke) by deprivation quintile for SMI and all patients aged 15 to 74
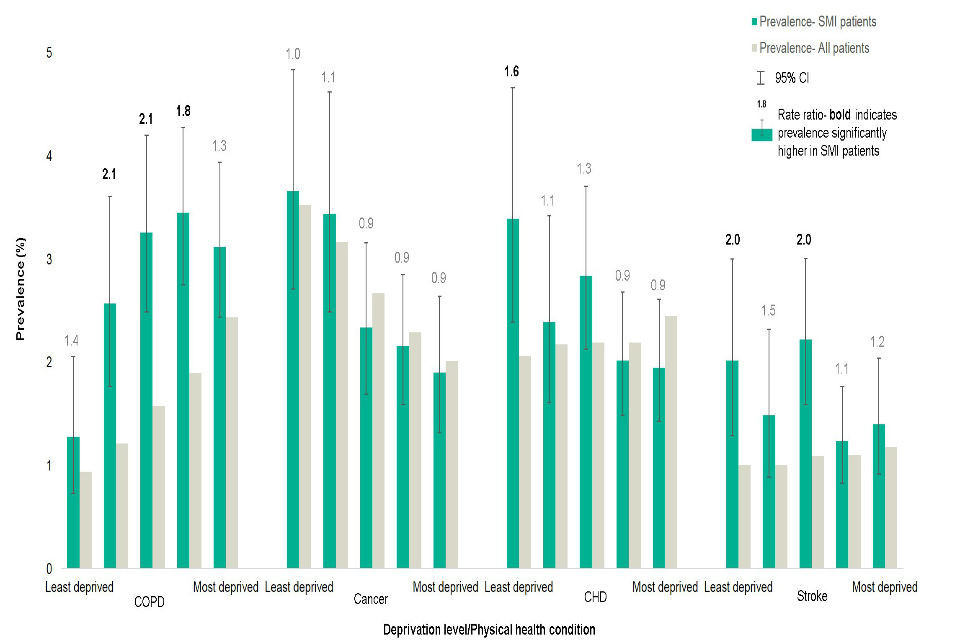
Figure 7 shows the prevalence for COPD, cancer, CHD and stroke by deprivation quintile for SMI patients aged 15 to 74 compared to all patients. Smaller numbers with these conditions mean that differences are more likely to be due to chance [Source: The Health Improvement Network (THIN), Active patients in England; data extracted May 2018
Note: change in y-axis scale to allow clear presentation
Key: atrial fibrillation (AF), coronary heart disease (CHD), chronic obstructive pulmonary disease (COPD), heart failure (HF)]
Although this analysis shows that there is no clear increasing or decreasing trend for most of the physical health conditions in patients with SMI across deprivation, for all quintiles the prevalence of obesity and diabetes is significantly higher for the SMI patients than all patients (Figure 6). Patients with SMI experience around double the prevalence of obesity and diabetes compared to all patients. This health inequality is likely to be higher for younger age groups as this analysis shows highest inequality in obesity and diabetes for patients aged 15 to 34 (Figure 4). Asthma shows an increase in the health inequality with increasing deprivation, although for less deprived quintiles the difference between SMI and all patients is not statistically significant (Figure 6).
The rate ratio in the prevalence of some physical health conditions in the SMI and all patients is higher in less deprived areas (Figures 6 and 7). This suggests that deprivation accounts for some of the inequalities in poor health in patients with SMI but not all. These findings are in line with previous research using data from UK Clinical Practice Research Datalink, which documents higher prevalence for diabetes mellitus, asthma, CHD, and COPD in people with SMI in the most deprived quintile, and higher prevalence in the least deprived quintile for cancer and stroke [footnote 29].
This analysis shows that a higher proportion of patients with SMI live in more deprived areas (Figure 2) and the prevalence of SMI shows a clear increase in trend with increasing socioeconomic deprivation. The findings also demonstrate that after standardising the prevalence of physical health conditions for the differences in age and sex characteristics of the SMI and all patients, health inequalities are still present (Figure 3). Therefore, to aid the understanding of the effect of demographic and socioeconomic factors, this analysis uses direct standardisation to adjust the overall prevalence of physical health conditions for age, sex and deprivation simultaneously (Figure 8).
Figure 8: Prevalence (age, sex and deprivation standardised) of physical health conditions for severe mental illness (SMI) and all patients aged 15 to 74
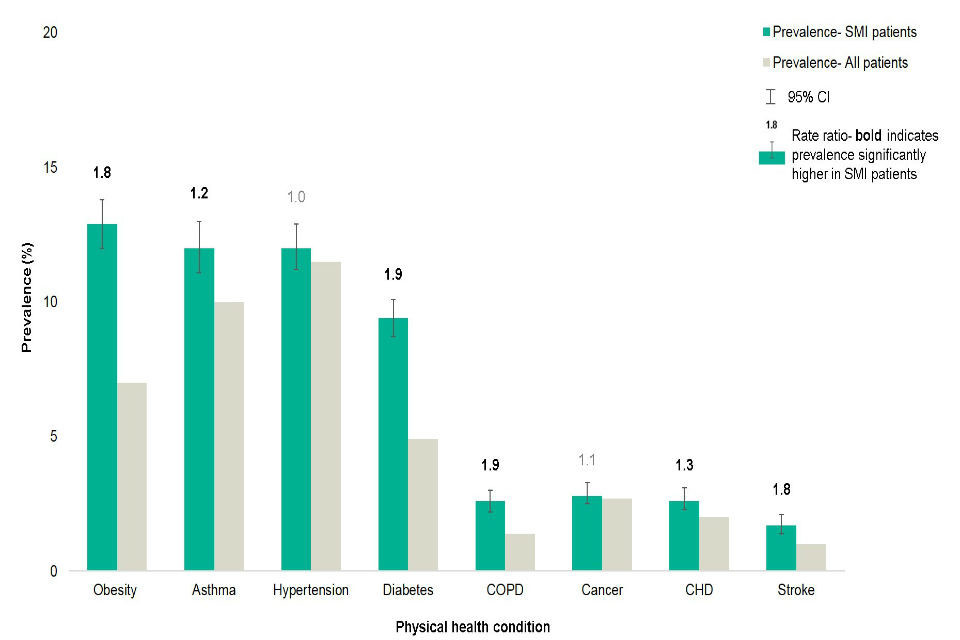
Figure 8 shows the prevalence of physical health conditions standardised for sex, age and deprivation using direct standardisation. Atrial fibrillation and heart failure due to small numbers in SMI patents and are not presented [Source: The Health Improvement Network (THIN), Active patients in England; data extracted May 2018
Key: coronary heart disease (CHD), chronic obstructive pulmonary disease (COPD); AF and HF were not included in the analysis due to insufficient number of patients in each quintile to carry out robust analysis]
After standardising for age, sex and deprivation, the prevalence among SMI patients in this analysis remain higher (Figure 8) for:
- obesity
- asthma
- diabetes
- COPD
- CHD
- stroke
The prevalence of physical health conditions remains relatively unchanged after standardising for deprivation in addition to age and sex (Figure 3), further suggesting that deprivation only partially plays a role in the health inequalities between the SMI and all patients. Findings on the prevalence of physical health conditions standardised for age, sex and deprivation demonstrate that patients with SMI are almost twice as likely to have a diagnosis of obesity, diabetes, COPD and stroke compared to all patients (Figure 8).
Findings from this analysis demonstrate that factors other than demographic characteristics and deprivation play a role in poor physical health in SMI patients. The results suggest that the greater burden of physical health conditions among people with SMI cannot be explained solely by higher prevalence of SMI among people experiencing social disadvantage, which is a major determinant of poor physical health [footnote 19].
The relationship between physical health, mental health and social determinants is complex. The Kings Fund suggests that the interaction between co-morbidities and deprivation makes a large contribution to generating and maintaining health inequalities [footnote 30]. This is of a great importance together with other factors for people with SMI in deprived areas who experience multiple disadvantage and have one of the highest burden of poor physical health [footnote 19].
SMI and multiple physical health conditions
Findings from this analysis show that 41.4% of patients with SMI have one or more of the 10 physical health conditions examined. This is higher than the proportion recorded for all patients (29.5%). The proportion of SMI patients with one or more physical health conditions is higher than in all patients (Figure 9) for:
- males and females
- all age groups
- all deprivation quintiles
Figure 9: Prevalence (age and sex standardised) of any physical health condition by sex, age and deprivation quintile for severe mental illness (SMI) and all patients aged 15 to 74
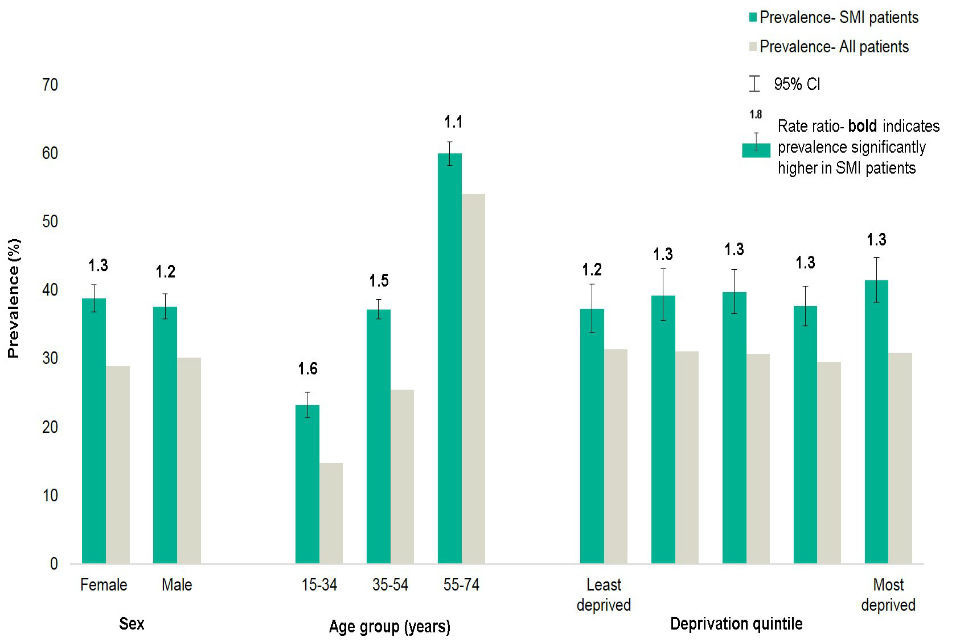
Figure 9 shows the prevalence of one or more of the 10 physical health conditions in the SMI patients aged 15 to 74 compared to all patients [Source: The Health Improvement Network (THIN), Active patients in England; data extracted May 2018
Note: change in y-axis scale to allow clear presentation]
The level of health inequality in the prevalence of one or more physical health conditions is higher in younger SMI patients than older (Figure 9). SMI patients are 1.6 more likely to have one or more physical health condition for ages 15 to 34 whereas for ages 55 to 74 the rate ratio is 1.1.
The health inequality in the prevalence of physical health conditions between the SMI and all patients is around double for multi-morbidities (Figure 10), for example:
- the prevalence of 2 or more physical health conditions in SMI patients is 1.8 times higher than in all patients
- the prevalence of 4 or more physical health conditions in SMI patients is 2 times higher than in all patients
Figure 10: Prevalence of physical health multi-morbidities for severe mental illness (SMI) and patients aged 15 to 74
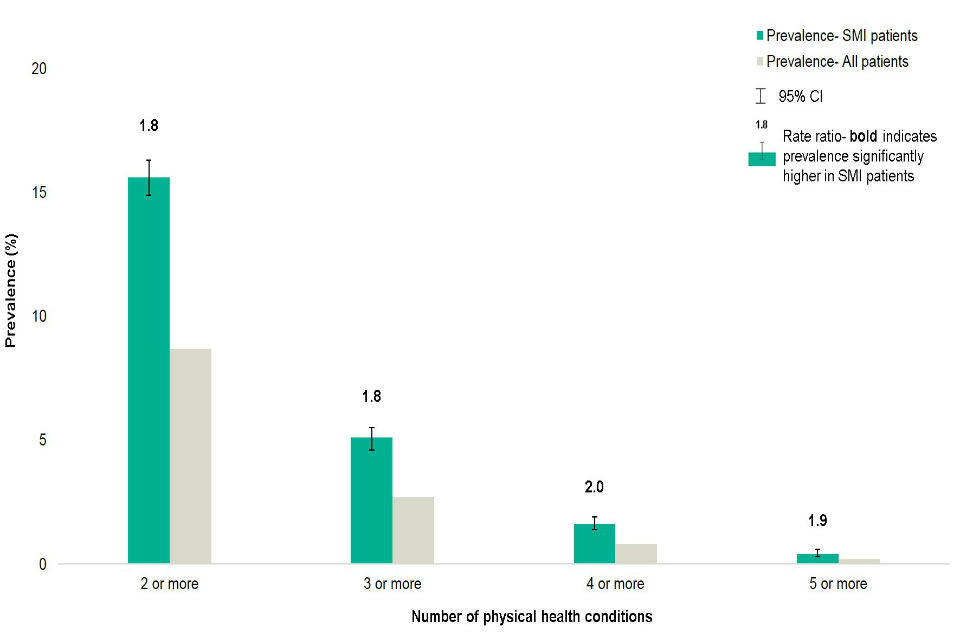
Figure 10 shows the prevalence of physical health co-morbidities (two or more concurrent physical health conditions) in the SMI patients aged 15 to 74 compared to all patients [Source: The Health Improvement Network (THIN), Active patients in England; data extracted May 2018
Note: the percentages are not age and sex standardised.]
The patterns of multi-morbidity in the SMI population repeat across sex, age and deprivation. The percentage of SMI patients with 3 or more physical health conditions (Figure 11) is higher than all patients for:
- males and females
- all age groups
- 3 of 5 deprivation quintiles
Figure 11: Prevalence (age and sex standardised) of 3 and more physical health co-morbidities for severe mental illness (SMI) and all patients aged 15 to 74

Figure 11 shows the age and sex-standardised prevalence of three or more recorded physical health conditions in the SMI patients compared with all patients [Source: The Health Improvement Network (THIN), Active patients in England; data extracted May 2018]
Whilst there is a gradient of increasing multi-morbidity with increasing deprivation for all patients (3.7% in the most deprived quintile compared to 2.5% in the least), this is not evident for SMI patients. All deprivation quintiles show higher rate ratios of prevalence of 3 or more physical health conditions between the SMI patients and all patients, but for 2 quintiles this difference is not significant and the gradient does not rise from the least to most deprived quintile.
Compared to all patients, younger patients with SMI diagnosed with 3 or more physical health conditions show the highest level of inequality. Patients with SMI are 5 times more likely to have 3 or more physical health conditions whereas for ages 55 to 74 this is 1.4 higher. Although rate ratio in the prevalence of multi-morbidities patients aged 15 to 34 is great it must be remembered that overall the prevalence is low.
People with multi-morbidities, including SMI, require a more holistic approach to health, care and support that puts their needs and experience at the centre of how services are organised and delivered [footnote 31]. Integrated care systems bring together NHS commissioners, providers and local authorities to plan how to improve health and care for the populations they serve. A recent study suggests that in an integrated health care system, where there may be fewer barriers to care, people with SMI are more likely to present for treatment with a range of medical co-morbidities, including chronic and severe conditions [footnote 32].
SMI and interventions to improve physical health
There is a large body of research documenting poor physical health among people with SMI. However, the underlying reasons for poorer health are not yet fully understood. Improvements in physical health of people with SMI can be achieved by addressing and reducing the impact of [footnote 32] [footnote 2] [footnote 21] [footnote 33] [footnote 34]:
- health behaviours, such as smoking, poor diet, lack of exercise, and substance misuse
- multiple risk behaviours rather than one health risk factor at a time
- side effects of antipsychotic medication, including weight gain, glucose intolerance and cardiovascular effects
- difficulties in accessing treatment; for example, lack of intervention following conditions diagnoses
- disconnected and irregular approach to health and care provisions, and other support
- non-compliance with care process, for example for Type 2 diabetes and mental health care providers should work with people who have SMI
- the effect of SMI on poor self-management of conditions, including seeking and adherence to treatment
- socio-economic determinants and consequences of suffering from a mental health conditions, such as poverty, poor housing, reduced social networks, lack of employment and social stigma
As highlighted by the NHS England Five Year Forward View [footnote 7], health services can help improve the physical health of people with SMI by bringing together mental and physical healthcare. Mental and physical health conditions are often connected. Delivering holistic and integrated services for patients requires changes in how all healthcare services are delivered [footnote 35]. The Commissioning for Quality and Innovation (CQUIN) framework supports improvements in the quality of services and the creation of new, improved patterns of care [footnote 36]. Improving physical healthcare to reduce premature mortality in people with SMI continues to be one of the CQUIN goals and services are required to:
- demonstrate cardiometabolic assessment and treatment for people with psychoses
- demonstrate positive outcomes in relation to BMI and smoking cessation for patients in early intervention in psychosis (EIP) services
- collaborate with primary care clinicians
Resources
The following sources can help providers and commissioners improve physical healthcare of people with SMI, and better understand their health needs.
Improving physical healthcare for people living with SMI in primary care: NHS guidance outlining action to improve access to physical health checks and follow up care. This guidance states that all adults on the SMI register should receive the full list of recommended physical health assessments as part of a routine check at least annually. Assessments should be undertaken more frequently for the purposes of monitoring specific antipsychotic or other medications, or where a significant physical illness or risk of a physical illness has already been identified. The assessment should form the basis for care and intervention planning. [footnote 37]
Practical toolkit for mental health trusts and commissioners: NHS toolkit to help improve the physical health care in hospital settings. Uses screening tools to help identify people at risk of cardiovascular disease, and recommends the best option for intervention or treatment. [footnote 38]
Bipolar disorder assessment and management: NICE guideline that covers recognising, assessing and treating bipolar disorder (formerly known as manic depression) in children, young people and adults, including monitoring and managing physical health. [footnote 39]
Coexisting SMI and substance misuse in community health and social care services: NICE guideline that covers how to improve services for people aged 14 and above who have been diagnosed as having coexisting SMI and substance misuse. [footnote 40]
Prevention and management of psychosis and schizophrenia in adults: NICE guideline that covers recognising and managing psychosis and schizophrenia in adults. It aims to improve care through early recognition and treatment, and by focusing on long-term recovery. It also recommends checking for coexisting health problems and providing support for family members and carers. [footnote 41]
Mental health core skills education and training framework: the framework aims to improve the way the health and social care workforce care for people with mental health issues by outlining the core skills and knowledge they need to provide high-quality services. It classifies key skills and knowledge into 3 tiers, ranging from general mental health awareness to the skills needed to care for people with complex mental health needs. It is also in accordance with the Health Education England Mandate that supports the commitment to achieving parity of esteem between mental and physical health. [footnote 42]
Improving the physical health of adults with SMI: this report makes practical recommendations for changes that will help adults with SMI to receive the same standards of physical healthcare as the general population and reduce the risk of premature death. [footnote 12]
NHS RightCare ‘CVD prevention pathway for people with SMI’ (to be published).
Conclusions
This analysis shows that:
- patients with SMI in GP care experience poor physical health
- there are physical health inequalities among patients with SMI compared to all patients in THIN
The NICE clinical guideline on psychosis and schizophrenia in adults recommends:
- primary care to use QOF registers to monitor the physical health of patients with SMI [footnote 41]
- patients with SMI have at least one physical health review annually that includes checks on weight or BMI, metabolic status, pulse and blood pressure monitoring
That some of these checks are taking place could partially explain some of the findings in this analysis - for example, higher prevalence of obesity in patients in SMI. However, as the level of health inequality for patients with SMI in this analysis is high, and it includes a number of physical health disorders, being on the QOF register alone in unlikely to explain all the observed findings.
Furthermore, evidence suggests [footnote 43] that primary care incentives promoting physical health reviews in people with SMI have improved identification but not treatment of cardiovascular risk factors. Other research indicates that physical health screening for people on the SMI QOF register is of lower quality than for people on physical health registers, such as diabetes [footnote 44] [footnote 45].
Findings from this analysis support the currently available guidance and recommendations on improving and managing physical health of people with SMI. This includes:
- SMI patients experience a higher prevalence of physical co-morbidities and multi-morbidities and therefore there is a need for integrated and holistic care delivery which considers their mental and physical health needs [footnote 32],[footnote 33]
- the burden of poor physical health in SMI patients occurs earlier in life and therefore SMI patients may need outreach strategies focused on disease prevention, screening and early diagnosis, and treatment to address medical co-morbidities and associated poor health outcomes [footnote 32]
- the level of health inequality in physical health conditions of SMI patients is often highest for ages 15 to 34 and therefore the new ambition for 60% of people on the SMI QOF register to receive annual health assessments in primary care should include people with SMI of all ages, not just over 40, as they are for the general population [footnote 37]
- the level of health inequality in diabetes for SMI patients is again highest for ages 15 to 34 and also for females, therefore SMI care providers should be aware of the higher risks of Type 2 diabetes at younger age onset and in females [footnote 33]
This analysis only provides findings at national level and an understanding of sub-national health inequalities for people with SMI is required to support local planners, commissioners and providers. Findings in this report can be applied to local populations. However, where local GP data is available for analysis, similar work should be carried out to understand the prevalence of co-morbidities and health inequalities in local SMI populations. PHE’s ‘Technical supplement: severe mental illness and physical health inequalities’ provides details of the methodology to support this work.
Poor physical health in people with SMI is not limited to the conditions examined in this report. Findings from this analysis highlight that future research is required to identify further health inequalities in people in SMI and to gain a better understanding of the possible causes. THIN or other primary care research databases offer a good basis to support this research, including:
- an analysis of access to and uptake of cancer-screening programmes within the SMI population and compared to the general population; this work will add to the understanding of cancer prevalence in the SMI population and how cancer-screening programmes relate to the diagnosis of cancer
- an analysis of access to physical health checks and NHS Health Checks, including uptake of post-check interventions and their outcomes; an examination of the effect of periods leading up to physical health checks on monitoring status of weight and smoking status in SMI patients would add further to this work
- an exploration of THIN linkage to secondary care activity data to provide a better understanding of secondary care pathways for people with SMI and how those compare with the general population; this work should have a focus on both planned and unplanned secondary care attendance and hospitalisation
- risk stratification of primary care activity for patients with SMI (alone and linked to secondary care) to identify segments of the SMI population for focused early intervention and to provide insight to support better self and primary care management to improve health outcomes
- an exploration of potential causes for the recorded inequality in physical health in people with SMI: this work should focus on further demographic and socio-economic factors, wider social determinants, risk factors (such as smoking and alcohol consumption), biological markers (such as hyperlipidaemia) and the use of antipsychotic medication - access to treatment should be also included in the analysis
- an expansion of the analysis of inequalities in physical health in the SMI population with a focus on conditions that can be prevented or a cause of high excess premature mortality among people with SMI, for example liver disease; an analysis of mental health multi-morbidities, such as depression would add to further to the understanding in this area
Authors and acknowledgements
Authors
This report has been produced and authored by the National Mental Health Intelligence Network with particular input from Kate Lachowycz, Sulia Celebi, Gabriele Price, Cam Lugton and Rachel Roche.
Acknowledgements
We are particularly thankful for the contributions from: Simran Sandhu, Sue Foster, Russell Plunkett, Arvinder Duggal, Julia Verne, Sarah Holloway, Amy Clark, Rosie Frankenberg, Gyles Glover, Rita Ranmal, Anna Gavin, Katherine Henson, David Osborn and Melissa Darwent. This report has been co-funded by NHS England.
References
-
Heller T and others ‘Benefits of support groups for families of adults with severe mental illness’ American Journal of Orthopsychiatry 1997: volume 67, issue 2, pages 187 to 198 (viewed on 31 July 2018) ↩
-
DE Hert M and others. ‘Physical illness in patients with severe mental disorders’ World Psychiatry 2011: volume 10, issue 1, pages 52 to 77 (viewed on 2 July 2018) ↩ ↩2 ↩3 ↩4 ↩5 ↩6 ↩7
-
Reilly S and others. ‘Inequalities in physical comorbidity: a longitudinal comparative cohort study of people with severe mental illness in the UK’ British Medical Journal 2015: volume 5, issue 12 (viewed on 2 July 2018) ↩ ↩2
-
Chesney E and others. ‘Risks of all-cause and suicide mortality in mental disorders: a meta-review’ World Psychiatry 2014: volume 13, issue 2, pages 153 to 160 (viewed on 2 July 2018) ↩
-
NHS Digital. ‘NHS Outcomes Framework Indicators: Excess under 75 mortality rate in adults with serious mental illness’ 2016 (viewed on 2 July 2018) ↩ ↩2 ↩3
-
Hayes JF and others. ‘Mortality gap for people with bipolar disorder and schizophrenia: UK-based cohort study 2000-2014’ The British Journal of Psychiatry 2017: volume 211, pages 175 to 181 (viewed on 2 July 2018) ↩
-
The Mental Health Taskforce, NHS England. ‘Five Year Forward View for Mental Health’ 2016 (viewed on 2 July 2018) ↩ ↩2 ↩3
-
John A and others. ‘Premature mortality among people with severe mental illness’ Schizophrenia Research 2018 (available online only) (viewed on 2 July 2018) ↩ ↩2 ↩3
-
Public Health England. ‘Psychosis Data Report: describing variation in numbers of people with psychosis and their access to care in England’ 2016 (viewed on 2 July 2018) ↩ ↩2
-
Appleby L and others. ‘Safety First: Five-year report of the National Confidential Inquiry into Suicide and Homicide by People with Mental Illness’ 2001 (viewed on 2 July 2018) ↩
-
Merrick J and others. ‘Equal Treatment: Closing the Gap’ Disability Rights Commission 2007 (viewed on 2 July 2018) ↩
-
Royal College of Psychiatrists. ‘Improving the physical health of adults with severe mental illness: essential actions’ 2016 (viewed on 2 July 2018) ↩ ↩2
-
IQVIA. ‘The Heath Improvement Network (THIN)’ (viewed on 2 July 2018) ↩
-
NHS Digital. ‘Quality and Outcome Framework (QOF) business rules’ (viewed on 2 July 2018) ↩
-
Eastern Region Public Health Observatory. ‘Information on Public Health Observatory recommended methods’ 2005: issue 6 (viewed on 2 July 2018) ↩
-
NHS Digital. ‘QOF 2016/17 results’ 2018 (viewed on 2 July 2018) ↩
-
Hardoon S and others. ‘Recording of Severe Mental Illness in United Kingdom Primary Care, 2000–2010’ PLOS One 2013: volume 8, issue 12 (viewed on 2 July 2018) ↩ ↩2
-
Mental Health Foundation ‘Poverty and mental health’ 2016 (viewed 1 August 2018) ↩
-
Langan Martin J and others ‘Impact of socioeconomic deprivation on rate and cause of death in severe mental illness’ BMC Psychiatry 2014: volume 14, issue 261 (viewed on 1 August 2018) ↩ ↩2 ↩3 ↩4 ↩5
-
Aro S and others ‘Socio-economic Mobility among Patients with Schizophrenia or Major Affective Disorder a 17-Year Retrospective Follow-Up’ The British Journal of Psychiatry 1995: volume 166, issue 6, pages 759 to 767 (viewed 13 July 2018) ↩
-
Robson D and others. ‘Serious mental illness and physical health problems: A discussion paper’ International Journal of Nursing Studies 2006: volume 44, pages 457 to 466 (viewed on 2 July 2018) ↩ ↩2 ↩3 ↩4
-
Sukanta S and others. ‘A Systematic Review of Mortality in Schizophrenia. Is the Differential Mortality Gap Worsening Over Time?’ 2007: volume 64, pages 1123 to 113 (viewed on 2 July 2018) ↩
-
Chang C-K and others. ‘A cohort study on mental disorders, stage of cancer at diagnosis and subsequent survival’ British Medical Journal 2014: volume 4, issue 1, (viewed on 2 July 2018) ↩
-
Public Health England, National Cancer Registry and Analysis Service, Transforming Cancer Services Team for London. ‘Cancer Prevalence in England: 21-year prevalence by demographic and geographic measures’ 2017 (viewed on 2 July 2018) ↩ ↩2 ↩3
-
NHS Digital. ‘Health Survey for England 2016. Summary of key findings’ 2017 (viewed on 30 July 2018) ↩
-
Das‐Munshi J and others. ‘Type 2 diabetes mellitus in people with severe mental illness: inequalities by ethnicity and age. Cross‐sectional analysis of 588 408 records from the UK’ Diabetic Medicine 2017: volume 34, issue 7, pages 916 to 924 (viewed on 2 July 2018) ↩
-
Cetin M. ‘A Serious Risk: Excessive and Inappropriate Antipsychotic Prescribing’ Klinik Psikofarmakoloji Bülteni-Bulletin of Clinical Psychopharmacology 2014: volume 24, issue 1, pages 1 to 4 (viewed on 2 July 2018) ↩ ↩2
-
Morgan O and others. ‘Measuring deprivation in England and Wales using 2001 Carstairs scores’ Health Statistics Quarterly 2006 (viewed on 2 July 2018) ↩
-
Reilly S and others. ‘Inequalities in physical comorbidity: a longitudinal comparative cohort study of people with severe mental illness in the UK’ British Medical Journal 2015: volume 5, issue 12 (viewed on 2 July 2018) ↩
-
Naylor C and others. ‘Mental health and long-term conditions: the cost of co-morbidity’ The King’s Fund 2012 (viewed on 2 July 2018) ↩
-
NHS England. ‘Integrated care and support’ (viewed on 2 July 2018) ↩
-
Bahorik AL and others. ‘Serious mental illness and medical comorbidities: Findings from an integrated healthcare system’ Journal of Psychosomatic Research 2017: volume 100, pages 25 to 45 (viewed on 2 July 2018) ↩ ↩2 ↩3 ↩4
-
NHS Digital. ‘National Diabetes Audit, 2016 to 17 Report 1: Care Processes and Treatment Targets (Severe Mental Illness - Supplementary Information)’ 2018 (viewed on 2 July 2018) ↩ ↩2 ↩3
-
Naylor C and others. ‘Bringing together physical and mental health. A new frontier for integrated care’ The King’s Fund 2016 (viewed on 2 July 2018) ↩
-
King’s Health Partners ‘The Mind & Body Programme at King’s Health Partners’ (viewed on 2 July 2018) ↩
-
NHS England ‘CQUIN Indicator Specification Information on CQUIN 2017/18 - 2018/19’ (viewed on 2 July 2018) ↩
-
NHS England. ‘Improving physical healthcare for people living with severe mental illness (SMI) in primary care: Guidance for CCGs’ 2018 (viewed on 2 July 2018) ↩ ↩2
-
NHS England. ‘Improving the Physical Health of People with Serious Mental Illness: A Practical Toolkit’ 2016 (viewed on 2 July 2018) ↩
-
The National Institute for Health and Care Excellence. ‘Bipolar disorder: assessment and management’ 2014 (viewed on 2 July 2018) ↩
-
The National Institute for Health and Care Excellence. ‘Coexisting severe mental illness and substance misuse: community health and social care services’ 2016 (viewed on 2 July 2018) ↩
-
The National Institute for Health and Care Excellence. ‘Psychosis and schizophrenia in adults: prevention and management’ 2014 (viewed on 2 July 2018) ↩ ↩2
-
Health Education England ‘Mental Health Core Skills Education and Training Framework’ 2016 (viewed on 2 July 2018) ↩
-
Wilson C and others. ‘Financial incentives improve recognition but not treatment of cardiovascular risk factors in severe mental illness’ Plos One 2017: volume 12 (viewed on 2 July 2018) ↩
-
Martin JL and others ‘Physical health indicators in major mental illness: analysis of QOF data across UK general practice’ British Journal of General Practice 2014: volume 64, pages 649 to 656 (viewed on 2 July 2018) ↩
-
Mitchell A and Hardy S ‘Screening for Metabolic Risk Among Patients With Severe Mental Illness and Diabetes: A National Comparison’ Psychiatric Services 2013: volume 64, pages 1060 to 1063 (viewed on 2 July 2018) ↩