Regulating for people, the environment and growth, 2019
Updated 22 February 2021
Applies to England

© Crown copyright 2021
This publication is licensed under the terms of the Open Government Licence v3.0 except where otherwise stated. To view this licence, visit nationalarchives.gov.uk/doc/open-government-licence/version/3 or write to the Information Policy Team, The National Archives, Kew, London TW9 4DU, or email: psi@nationalarchives.gov.uk.
Where we have identified any third party copyright information you will need to obtain permission from the copyright holders concerned.
This publication is available at https://www.gov.uk/government/publications/regulating-for-people-the-environment-and-growth/regulating-for-people-the-environment-and-growth-2019
This report is for England. Most of the data presented are for the calendar year 2019. Where information is only available by financial year, it is for April 2019 to March 2020.
1. Chief executive’s foreword
Regulation works. Since the Environment Agency was established in 1996 our regulation of polluting industries has helped clean up the air we breathe, the rivers and coastal waters we cherish, and the land we live on. This report sets out how we took that work forward in 2019 and the results we secured. There is and always will be more to do on all counts, but it is a record that we and the country can be proud of.
We are publishing this report as many factors are coming together which will shape the future of our regulation. The economic damage done by coronavirus (COVID-19) means we need rapid recovery and the kind of regulation to facilitate that. The UK’s departure from the EU means we are now free to set our own environmental rules. The government has set high environmental ambitions, including that we will be the first generation to enhance nature rather than degrade it. There is popular pressure for a greener world. And at COP26 in Glasgow later this year the international community has an opportunity to tackle the climate emergency – the biggest of all threats to our environment, our economy and our planet.
The right response to these challenges is to:
-
Reject false choices. We do not have to choose between regulation or sustainable growth. With the right approach we can have both.
-
Regulate right. Good regulation is not about a process – what some call red tape – but an outcome: a cleaner, greener world. Good regulation is not about eliminating risk but about managing and reducing it. Good regulation is proportionate, focusing on what will make the most difference and calibrating the costs of the regulation to the benefits we achieve. Good regulation is business friendly, with simple processes, clear goals that make it easy for operators to do the right thing, rewards for those who do and painful consequences for those who do not.
-
Invest in the environment. The polluters should pay for the regulation necessary to prevent harm from their activities. And it is right that the government should fund those things – monitoring the environment, enforcing the rules, responding to incidents – that individual operators do not. The Environment Agency’s resources come from both these sources, but long term success in enhancing nature will require more investment. Ultimately we will get the environment we are prepared to pay for.
-
Seize the opportunities of EU Exit. The UK can now determine the environmental levels of protection it deems appropriate and is committed to increasing that protection. We should now have a debate about which parts of EU environmental law repatriated into UK legislation we should keep, reform or repeal. The test for any change should be simple: will it deliver better environmental outcomes?
-
Ensure our future regulation focuses on the main thing: the climate emergency. The Environment Agency already plays a critical role in mitigating climate change through our regulation of the industries that emit most of the UK’s greenhouse gases, and we now have an important new role in administering the UK’s new Emissions Trading System. Meanwhile many of the Environment Agency’s other activities, like building flood defences and shaping planning decisions, are helping make the country more resilient to the effects of climate change.
Regulators are people. The people in the Environment Agency who regulate our industries, our farmers, and our water, waste and energy companies are hugely professional, highly committed and extremely hard-working. They do vital things, mostly unseen, often in difficult, unpleasant or downright dangerous circumstances. What they do really does create a better place, and the country can and should be proud of them. I am.

Sir James Bevan, Chief Executive of the Environment Agency
2. Main facts 2019
A nation resilient to climate change
-
Since 2010 emissions of greenhouse gases from the sites we regulate under the Environmental Permitting Regulations (EPR) have decreased by 43%.
-
We delivered over 98% compliance in the 5 major energy efficiency and emissions trading schemes we administer. They cover over 40% of the UK’s carbon emission from industry, business and the public sector.
Healthy air, land and water
-
There were 467 serious pollution incidents, 12% fewer than in 2018. Of the 400 incidents where we identified the source, 57% were caused by activities without permits.
-
86% of river water bodies had not reached good ecological status. This is due mainly to environmental impacts caused by agriculture and rural land management, the water industry, and urban and transport pressures.
-
Agricultural and rural land management practices are responsible for about 40% of water body failures. The vast majority of agricultural premises are largely unregulated.
-
Bathing water standards remained high, with 98% passing quality standards for the fourth year in a row.
-
Emissions of NOx, SOx and PM10 from the sites we regulate under the EPR decreased from 2018 levels, after plateauing since 2016. Since 2010 emissions from these sites of NOx have decreased by 63%, SOx have decreased by 81%, and PM10 have decreased by 34%.
A green growth and a sustainable future
-
Waste recovery at permitted industrial sites improved to a record 74%.
-
We stopped illegal waste activity at 940 sites, 3% more than the previous year. We found 775 new illegal waste sites, 14% less than we found the previous year.
-
We continued to close down illegal waste sites. At the end of March 2020, 544 known illegal waste sites were still active, 21% less than at the end of March 2019 and the lowest number on our records.
-
We inspected 1,889 containers, helping us prevent the illegal export of more than 22,600 tonnes of unsuitable waste.
Our approach to regulation
-
We processed around 320,000 transactions for businesses and individuals (exemptions registrations, standard rules permits and bespoke permits). The majority of these (around 306,000) were exemptions registered online through our digital services.
-
The majority of the sites we regulate were well run. 91% of operators were in our highest compliance bands A and B.
-
The number of persistently poorly managed sites increased to 150 from 140 in 2018. 87% of these sites were in the waste sector.
-
Businesses and individuals were fined almost £4.4 million for environmental offences, as a result of our prosecutions, an increase on the £2.8 million in 2018.
-
48 enforcement undertakings were completed by businesses. Environmental groups or projects received a record £4.8 million as a result of our regulatory interventions, more than twice that received in 2018 (£2.1 million).
3. Introduction
This report focusses on the environmental performance of our regulated customers in 2019, covering compliance, pollution incidents, crime and emissions. It also covers our regulatory role, what actions we took to support business, and to protect people and the environment from harm. Although the COVID-19 pandemic affected the timing of the production of our report in 2020, it did not affect the data nor our findings from 2019.
This last year was a challenging year with the COVID-19 pandemic affecting businesses, people, the environment and the work of the Environment Agency. Like many organisations we had to adjust to a new normal, adapting our ways of working to protect our staff and those we regulate. In responding to the challenge we:
- produced regulatory position statements, allowing some businesses temporary flexibilities to ensure they could continue to operate, whilst ensuring environmental protections remained
- transferred our staff and operations to remote working
- prioritised the regulation of high risk activities
- brought our permitting activities back to pre-COVID-19 levels after an initial delay in processing
What the pandemic has done is bring a renewed focus on the benefits of a healthy environment for recreation, health and wellbeing. There is wider public recognition about the value of their green spaces and the countryside. The World Health Organisation estimates that environmental factors contribute about 14% of the total burden of disease in the United Kingdom.[footnote 1] Public Health England estimates that poor air quality results in 28,000 to 36,000 equivalent deaths each year[footnote 2] and could cost £5.3 billion by 2035[footnote 3] if no action is taken. Our regulatory work supports reductions in emissions to air, land and water as part of the solution needed to make significant, cost effective progress on addressing health challenges.
A healthy environment is essential for providing the food we eat. Natural ecosystems help:
- tackle climate change by absorbing carbon dioxide produced from burning fossil fuels
- provide cooling
- provide clean air by removing pollutants
The UK natural capital accounts 2019[footnote 4] estimated the partial asset value of UK natural capital to be nearly £1 trillion.
COVID-19 is also having a significant impact on the economy and people’s livelihoods. Our regulatory work supports the government’s economic growth, green recovery and net zero agenda. For example, supporting the construction of new nuclear power stations, the development of advanced nuclear technologies, and carbon capture and storage technology.
As a regulator we implement legislation and standards set by government to protect and enhance the environment, also taking into account the impact we have on businesses. Good regulation, which regulates the right things in the right way to produce the right outcomes, not only protects the environment – it supports green growth and innovation.
Good regulation is risk-based, proportionate and business friendly. It supports the creation of a level playing field for business, allowing well run companies to thrive and stopping those who do not want to play by the rules from undercutting them. Businesses are providing the jobs, growth, and goods and services we all need. It is our duty as regulators to help them do that whilst delivering a better environment and improved public health.
Regulation has delivered significant improvements since 2000. However, in more recent years the rate of change has slowed. In the last 20 years there have been improvements to our understanding and knowledge about the impacts of human activities on the environment, and the resulting impacts on human health. This knowledge shows us there is much to do.
We need to tackle the challenges of:
- the climate emergency and net zero
- sustainability and the circular economy
- cleaner air, land and water
- plastics and chemicals in the environment
These are in addition to our compliance work with industry against existing regulations and standards.
Where there is not a good regulatory framework or the resources to enforce it, things have got worse. Farming, particularly the dairy sector, continues to cause serious pollution incidents, as well as being a major emitter of greenhouse gases such as methane. But we lack the powers and resources to tackle this effectively. Cuts to our budget since 2010 have meant hard decisions, cutting or stopping some of our activities whilst taking on additional duties given to us. There is a high level of ambition from government on the environment, but to be successful this level of ambition needs to be matched by the resources to deliver it.
Public expectations have also changed. People are demanding higher standards and better environmental protection. For example, there is public interest in designating sections of our rivers as bathing waters and the environmental improvements needed to achieve this. Concern about the effects of plastics in the environment has also risen in the public consciousness.
An important part of our regulatory role is to work with government departments, giving expert advice, supporting customer engagement and consultations, to help their policy development balance environmental and business needs. In 2019[footnote 5] these actions helped us contribute to mitigating risks as the UK planned to leave the EU, and ensuring we could continue to regulate effectively to protect people and the environment. We are applying these actions to the climate emergency, supporting government to adapt their legislation to tackle the changes needed.
For example, our work on the new Agriculture Act and its associated environmental land management schemes, and the new opportunities it provides to improve farming related regulation all supports better environmental protection and a thriving farm industry.
Engaging with government, businesses and other regulators and organisations is a vital element of creating the changes needed, supporting the new technologies and approaches needed to tackle the climate emergency, a sustainable circular economy, and ensuring our regulation remains fit for purpose.
During 2019 we continued to contribute to government efforts to prepare to leave the EU and support our regulated customers for the upcoming changes. The legal framework has now changed. Most EU laws have now become UK law and will continue to apply unless and until they are amended or revoked. Our preparations means we were ready from the 1 January 2021 to take on new duties for repatriated environmental regimes including on chemicals, waste shipments, fluorinated gasses, and emissions trading. We will provide advice and guidance to our customers as they get used to the new normal. However, one thing has not changed – the businesses we regulate must continue to comply with environmental law and their permit conditions.
Improvements in environmental quality are associated with the implementation of standards and laws made to protect people and nature. Our role includes giving practical advice and ensuring industry meets the required standards. To do this, we review and change permits, check compliance and take enforcement action where necessary – all with the aim of reducing operators’ negative effects on the environment.[footnote 6] In turn this can reduce negative effects on human health.
The following data and activities show what we, and those we regulate, achieved in 2019.
4. Supporting growth and innovation
It is important we support businesses giving them the confidence to invest, innovate and grow, with the amount and nature of regulation being proportionate to the risk of the activity being regulated.
We want regulated customers to approach us. Early conversations can prevent costly issues arising that could stop or hold up projects, including loss of investors or rejections of permit applications. Within regulatory frameworks, we focus on the outcome required (reduced emissions, noise reductions). Talking with businesses allows us to agree the best option for a site, which can save businesses money.
Pre-application discussions with our regulated customers provide them with permit application advice. This facilitates discussions between applicants, local teams and specialist colleagues. We want customers to get their permit application right first time and understand what regulations may apply to their activities.
Our Definition of Waste Service received 30 submissions in 2019. The Definition of Waste Service and free to use ‘Is it Waste?’ e-tool support businesses to create new products from waste, giving an opinion about whether materials are waste or not, and if waste controls may no longer apply. This contributes to resource efficiency and delivery of the circular economy. It also can help secure investment as well as can support creation of markets for a business’s material, passing along confidence to potential customers.
4.1 Engagement
Being informed and having good evidence supports fair and proportionate decision making. We listen to our stakeholders and gather evidence in a number of ways. We interact with businesses at a variety of levels including via local officers, national services, and trade and sector meetings.
We also run public consultations. We carried out 22 national external consultations with stakeholders in 2019.
As a regulator we have a process that enables operators to ask for an internal review of a regulatory decision we’ve taken, independently to any statutory appeal right. We received 15 such appeals from business against our regulatory decisions in 2019. After investigation 3 appeals were upheld.
4.2 Innovative regulation
We cannot just react to issues raised by new technologies, chemicals or processes. We need to actively anticipate the need for new forms of regulation, or improve or amend current regulatory processes, so we do not hinder innovation and economic growth. The climate emergency, drive to net zero and the circular economy require step changes in human activities. This is bringing new technologies or industries, such as small nuclear reactors and the hydrogen economy, to the fore.
We strive to be an agile regulator, but the speed of technological development or new evidence of environmental harm sometimes means legislation can be slow to catch up. We can take measures to allow businesses to operate whilst we support government to make legislative changes. We do this by taking a risk based approach and, ensuring environmental protections remain in place whilst not stifling business and innovation. We can:
- allow time limited trails and pilots for some research activities
- grant some derogations from normal standards where specific criteria are met
- adopt regulatory position statements – 9 new ones were published in 2019
- create low risk waste positions (LRWP) – in 2019 we reassessed our LRWP portfolio, making sure it still reflected business and environmental needs
4.3 Supporting business
We work to streamline and improve our services and processes, to save businesses time and money and provide good customer service.
In 2019, we saved business £98.3 million as measured by the government’s Business Impact Target. This was through creating a temporary regulatory position statement allowing the incinerator bottom ash aggregate industry to continue to operate whilst we work with them to change regulatory requirements. This work gives continued environmental protection and allows the industry to operate.
4.4 Permitting
Our permitting and licensing activities enable businesses to carry out their operations, while robust regulation provides the level playing field legitimate businesses need to prevent being undercut by irresponsible or illegal operators. In return, we expect businesses to take responsibility for their operations.
We take a risk based approach to permitting. Lower hazard, simple activities are either exempt from regulation or require a business to register with us. Higher hazard, complex industrial processes require more detailed analysis of permit applications and issuing of bespoke permits.
We processed around 320,000 transactions for businesses and individuals (exemptions registrations, standard rules permits and bespoke permits). The majority of these (around 306,000) were exemptions registered online through our digital services.
We also issued around 900,000 rod licences and 30,000 navigation licences.
Our National Permitting Service issues and deals with permits for waste, water quality, water resources and industrial activities. In 2019, we:
- processed 3,040 new permit applications
- issued 5,013 permit variations
- dealt with 1,096 permit surrenders
- dealt with 678 permit transfers
- registered 2,130 mobile plant deployments
- registered 304,672 waste exemptions
In the financial year 2019 to 2020 we also:
- made 1,869 flood risk activity permit decisions
- registered 1,414 flood risk activity exemptions
The climate change emissions trading and energy efficiency schemes that we manage collectively delivered:
- 96 new agreements
- 830 variations
- 149 voluntary and administrator initiated terminations
- 19 transfers
- 4,536 performance reports
4.5 Digital services
We are continuing to make our permitting activities as digital as possible. In 2019 our Regulatory Services Programme, leading on this digital reform, continued.
We finished mapping all activities we give permits, licences, registrations, derogations, consents, binding measures and exemptions.
Water resources digital returns rose from 50% to 90%.
Digital application rates for waste standard rules permits were up to 90%.
Completion of the Tactical Charging Module in relevant digital services enabled about 71,000 transactions, totalling around £121 million, to be processed digitally.
5. Supporting healthier and safer communities
As a regulator, our work directly supports healthier, safer, more equitable communities. People in the most affluent areas enjoy as much as 19 years more in good health than those in the most deprived.[footnote 7]
We work to ensure:
- emissions from industries to the environment are reduced so that improved air quality means people can live longer healthier lives
- waste is seen as a resource and it is managed in the right place, in the right way by the right people to minimise risk
- people continue to access and enjoy the water environment, maximising health and wellbeing benefits
- communities are safe from industrial accidents, protected and resilient to environmental hazards, pollution and natural threats
- people and the environment are protected from exposure to radiation that may result from the disposal of radioactive waste by permitted users of radioactive substances
5.1 Operator permit compliance
Most of the sites we regulate continue to be well run. 91% of 13,600 permits were rated in our highest compliance bands A and B in 2019. 3.1% of permits were in the lowest bands D, E or F, a slight improvement on 3.2% in 2018. There were 23 fewer D, E or F rated permits in 2019 than in 2018. 85.6% of all D, E or F rated permits in 2019 were in the waste sector – one of the largest sectors, with proportionally more permits.
Poor performance in operator permit compliance, 2007 to 2019

Bar chart of percentage of permits in the lowest bands D, E and F.
Waste sector
Compliance in the waste sector needs significant improvement. In 2019 3.4% of all waste sector permits were rated D, E or F. This is an improvement on 3.6% in 2018 but compares to an average of 1.9% of permits rated D, E or F in non-waste sectors. Only the metals recycling subsector had proportionally more permits rated D, E or F in 2019 than in 2018 (3.7% compared with 3.3%). All other waste subsectors were the same or had improved.
There were 150 persistently poorly managed sites (those having permits in D, E or F bands for 2 or more consecutive years) in 2019 – 87% in the waste sector. The number of persistently poorly managed sites increased from 140 in 2018.
Food and drink
The food and drink sector had a notable increase in the percentage of its permits rated D, E or F between 2018 and 2019, from 4.6% to 6.5% (an increase of 8 permits).
Persistent poor performers: permits in compliance bands D, E or F for 2 consecutive years

Line graph of permits in compliance bands D, E or F for 2 consecutive years, showing 150 persistent poor performers in 2019.
5.2 Radioactive substances
Radioactive substances and radiation have many beneficial uses including their use in medicine, diagnostics and in low carbon power generation. Government has set out the importance of nuclear power in helping the UK meet its net zero ambitions. Our regulation plays an important part in protecting people and the environment, and ensures safe delivery of these benefits.
At the request of the UK government, an international team of senior safety experts conducted a peer review in October 2019 to evaluate the UK’s regulatory framework for nuclear and radiation safety against the International Atomic Energy Agency (IAEA) safety standards.[footnote 8] The peer review noted areas of good practice and some areas for improvement.
Each year the UK environment and food safety agencies collaborate carrying out independent monitoring and assessment of radioactivity in food and the environment and publish the results in the Radioactivity in Food and the Environment report.
In 2019 levels of radioactivity in food and the environment were safe and the radiation exposure of the public resulting from the permitted uses of radioactive substances continued to be below the statutory limits.
The report also shows that our regulation has helped reduce discharges of radioactivity to the environment. The long term trend in seawater concentrations of caesium-137 in UK waters is one of the best indicators of the long term decline in environmental levels of a key radionuclide. This decline is due to process changes, better abatement and stringent regulation over the past few decades.
Concentration of caesium-137 in the Irish Sea

Line graph of the concentration of caesium-137 in the Irish Sea.
In the chart the increased discharges in the 1970s were as a result of increased Magnox spent fuel arising and storage.
5.3 Serious pollution incidents
Serious pollution incidents harm the environment and can have significant financial and reputational effects on a business.
We categorise incidents from 1 to 4, according to their effects on air, land and water. Category 1 is the most serious and 4 the least.
Category 3 and 4 incidents pose a much lower risk of harm to the environment than category 1 or 2. We take a risk based approach and direct our limited resources to where they are needed most and where our work can bring the most important outcomes. We do not have the resources to physically attend all category 3 and 4 incidents. We do assess their causes and potential impacts, and follow up our findings proportionately.
In 2019 there were:
- 45 category 1 incidents (most serious)
- 422 category 2 incidents
- 11,804 category 3 incidents
- 4,851 category 4 incidents
There were 467 serious pollution incidents (category 1 and 2) in 2019, 12% less than in 2018. Of the 400 incidents where we identified the source, 57% were caused by activities without permits. To reduce serious pollution incidents, there has to be vigilance and action from all businesses, not just those we permit.
Of the 467 serious incidents in 2019:
- 17% were attributed to illegal waste activities
- 15% were caused by waste management activities
- 11% were caused by water and sewerage companies[footnote 9]
- 9% were caused by farming activities
All serious pollution incidents (caused by activities we permit and those we do not) by sector

Bar chart of all serious pollution incidents in 2019 by sector where types of 'other' pollution incidents in 2019 are shown in a pie chart.
In the chart:
- from 2015 waste management activities (collectively) are split into the waste treatment sector and other waste activities (the latter including the biowaste, landfill, incineration with energy recovery sectors and exempt activities)
- illegal waste activities are split from the ‘other’ category from 2016
Serious pollution incidents decreased in most sectors in 2019 compared with 2018. Incidents from non-permitted and permitted activities decreased by 21% and 12% respectively.
Illegal waste activities
Illegal waste activities were the single biggest source of incidents again in 2019. There were 79 serious incidents, a slight decrease on the 81 incidents in 2018. Just over half were attributed to illegal waste sites. Illegal waste sites and fly-tipping cause pollution, attract vermin and can be costly for landowners to clear up.
Waste management
70 serious pollution incidents were caused by waste management activities in 2019, 11% less than in 2018.[footnote 10]
There was a 33% reduction in serious incidents caused by the waste treatment sector. This reduction was largely due to incidents from non-hazardous waste management almost halving, from 30 in 2018 to 18 in 2019.
Serious pollution incidents caused by waste management activities, 2015 to 2019

Line graph of serious pollution incidents caused by waste management activities.
Water and sewerage companies
In 2019, serious pollution incidents caused by water and sewerage companies continued to plateau. There were 52 in 2019, compared to 56 in 2018 and 52 in 2017.
More information can be found in our report Water and sewerage companies in England: environmental performance for 2019.
Farming activities
In 2019, farming activities caused 42 serious pollution incidents, 45% less than in 2018 (77 incidents). Most (83%) were caused by containment and control failures.
Intensive pig and poultry farming, the only farming subsector we regulate under the EPR, caused 4 serious incidents, an 85% drop from the 26 incidents in 2018.
This follows robust enforcement action at 3 intensive poultry sites, which together caused 22 serious odour pollution incidents in 2018.
The dairy sector caused 22 serious pollution incidents in 2019, just over half of all farming incidents. They all involved slurry or silage, with containment and control failures accounting for 19 of them. The dairy industry is changing, with fewer registered dairy farms that each have bigger herds. Increased slurry storage capacity is a legal requirement set out in the Water Resources (Control of Pollution) (Silage, Slurry and Agricultural Fuel Oil) (England) Regulations.
A 2019 study of the River Axe found 95% of the 86 dairy farms visited by the Environment Agency were non-compliant with agricultural regulations. Of these, 49% were causing pollution at the time of the visit, and 33 new slurry stores were required to be built or substantially altered to meet legislative requirements. This demonstrates what we can do when we have the dedicated resources to look at farming incidents. Our resource in this area has been shrinking since 2015.
Agricultural incidents fluctuate year on year largely due to the weather. Looking at 5-year averages helps to smooth out variations in the weather over the years and the effect that has on the number of incidents in wet or dry years.
Serious pollution incidents caused by farming activities, 2012 to 2019

Line graph of serious pollution incidents caused by farming activities.
Serious pollution incidents caused by dairy farming, 2012 to 2019

Bar chart of serious pollution incidents caused by dairy farming, also showing the 5-year average of serious incidents.
For the dairy sector, both the 5-year average of incidents and the 5-year average of incidents per 100 dairy farms, increased over the period 2012 to 2017. The trend dips in 2018 and again in 2019, but this alone is not a sufficient signal of change to provide confidence of sustained improvement in the sector.
Odour
In 2019 there were 50 serious pollution incidents involving odour caused by industrial activities with permits, the same as in 2018.
The food and drink sector caused 18 of these, up from 5 in 2018. These 18 incidents were caused by just 3 individual sites, with one site responsible for 11 incidents.
Odour is a significant environmental cause of public complaints, and has a negative effect on the quality of life in affected communities.[footnote 11] People in affected communities often report higher levels of other health issues, particularly anxiety and stress-related illness.[footnote 12]
Serious pollution incidents affecting air and involving odour as a pollutant caused by industrial activities with permits

Bar chart of serious pollution incidents affecting air and involving odour as a pollutant caused by industrial activities with permits.
5.4 Nuclear incident management and resilience
We work with other government departments, UK regulators, international experts and the nuclear industry to help maintain UK nuclear safety.
Nuclear and Radiological Emergencies: Recovery Working Group
We began work on a significant programme of work in partnership with Department for Environment, Food & Rural Affairs (Defra) and others to enhance the UK’s preparedness to recover from the accidental or hostile release of radioactive material. This is in response to Public Health England’s Review of national nuclear emergency recovery capability (2016) which made 26 recommendations to improve the UK’s preparedness and capability. It led to Defra ministers recommending to the National Security Council that the Nuclear and Radiological Emergencies: Recovery Working Group (NRE-RWG) be re-established to deliver against these recommendations. We are making a significant contribution to a number of the projects set up under the programme including leading on the project to improve waste management arrangements following clean-up.
Nuclear Energy Agency: Expert Group for Recovery Management
This group is developing international guidance on how to prepare for the recovery phase of a radiological emergency. We joined and hosted an international meeting of the group in October 2019. We also presented the NRE-RWG programme with Defra at an international conference in Japan in early 2020. We proposed that the Environment Agency-led project to review UK arrangements for managing wastes in emergencies be a pilot to inform the Nuclear Energy Agency’s recovery framework. Further work is planned to deliver a recovery framework to coincide with the 10th anniversary of the Fukushima accident in 2021.
5.5 Waste crime
In the financial year 2019 to 2020 we brought prosecutions against 27 companies and 69 individuals for waste crime offences. This resulted in total fines exceeding £900,000, 28 custodial sentences, and confiscation orders totalling more than £1 million.
Serious and organised waste crime is estimated to cost the UK economy at least £600 million a year.[footnote 13] Rogue operators illegally dumping or exporting waste, or deliberate mis-description of wastes undermines legitimate businesses by disposing of waste cheaply and recklessly. This harms the environment and local communities, and deprives the government of tax income. Tackling this type of illegal activity is complex but very important, and understanding the full scale of waste crime is an ongoing challenge to which we are very committed.
Illegal waste sites are one of our largest causes of serious pollution incidents, and blight neighbourhoods not only here but also across the globe. Our work in tackling waste crime is funded by government rather than our charge payers. We continue to work with government to emphasise the importance of tackling waste crime and in securing the resource needed.
Illegal waste sites
We find about the same number of new illegal waste sites as the number we close. In the financial year 2019 to 2020, we stopped illegal waste activity at 940 sites, 3% more than the previous year. We did, however, find slightly fewer new illegal waste sites (775), 14% less than the previous year.
At the end of March 2020, 544 known illegal waste sites were still active, 21% less than at the end of March 2019 and the lowest number on our records. 235 of these sites were classified as high-risk sites, 7% less than at the end of 2019. Of the 940 illegal waste sites where we stopped activity, 42 sites brought their activities into regulation.
Illegal waste sites, 2009/10 to 2019/20

Bar chart of number of illegal waste sites, also showing the trend of sites active at the end of the financial year.
The average cost of closing an illegal waste site more than doubled between 2014 and 2018, from £3,700 to £8,300 per site. This is the result of the increasingly complex nature of waste crime.
The top 3 types of waste found at illegal sites in the financial year 2019 to 2020 were:
- household and commercial waste
- waste residues from processing household waste and shredded vehicles
- construction and demolition waste
Large-scale dumping
We dealt with 230 incidents of illegal large-scale dumping in the financial year 2019 to 2020, the highest number on our records. The trend in the number of dumping incidents has fluctuated over recent years: 218 in 2016, 226 in 2017, and 204 in 2018.
We classified the majority of these incidents as category 3, having a minor impact on the environment, people and property. However, these incidents can still have a pronounced detrimental effect on legitimate businesses and the welfare of the community, and deter re-development and economic growth.
Illegal waste exports
Businesses involved in the shipment of wastes must ensure that the waste they handle is managed in an environmentally sound manner throughout its shipment and recycling. These are often deliberately mis-described as recyclable materials.
We inspected 1,889 containers in the financial year 2019 to 2020, twice the number we inspected the previous year. 430 containers were returned to their site of loading, and in doing so we prevented the illegal export of more than 22,600 tonnes of unsuitable waste.
5.6 Enforcement action
We support businesses trying to do the right thing, only issuing enforcement notices, and penalising businesses as a last resort. In 2019, we[footnote 14]:
- brought 125 prosecution cases (38 for registered companies) resulting in fines totalling almost £4.4 million (£4.3 million for registered companies)
- issued 9 formal cautions (4 for registered companies)
- issued 247 enforcement notices (121 for registered companies)
- accepted 48 enforcement undertakings totalling a record £4.8 million in donations to environmental groups
The single biggest fine in 2019 was £1.8 million. This was issued to a water company for a water pollution incident following failure of a pump at a sewage pumping station.
The number of cautions we issue have reduced significantly. This is because we have found them to be less effective than other mechanisms we can use.
The amount received by environmental groups as a result of enforcement undertakings has been increasing and more than doubled between 2018 and 2019. In 2019, rivers trusts received over £1,600,000 from 17 enforcement undertakings. County wildlife trusts received over £800,000 from 15 undertakings. This approach is used for some offences, where operators recognise they have breached the rules, there is less harm done, and the damage can be remedied often by local partners.
Enforcement actions used for environmental offences by businesses in England, 2010 to 2019

Bar chart of enforcement actions used for environmental offences by businesses in England, also showing an increase in total financial contributions from enforcement.
Environmental offences for the purpose of this analysis are waste, water quality and emissions offences.
5.7 Reservoir regulation
Reservoirs in England are regulated by the Reservoirs Act 1975. This sets stringent conditions for their operation to ensure high levels of safety. They are designed and operated to ensure the likelihood of failure is incredibly low.
Responsibility for ensuring the safety of reservoirs lies with their operators. Our job, as the regulator, is to ensure they comply with the legal safety requirements. We monitor compliance at all 2,072 large raised reservoirs in England and use a range of enforcement options to address non-compliance.
Between January 2017 and December 2018[footnote 15] we:
- recorded 385 certificates after satisfactory completion of an inspection
- recorded 124 certificates which contained measures to be taken in the interests of safety
- recorded 148 certificates showing that measures to be taken in the interests of safety had been satisfactorily completed
- served 24 enforcement notices at 22 reservoirs
- issued 12 formal warnings to reservoir undertakers[footnote 16]
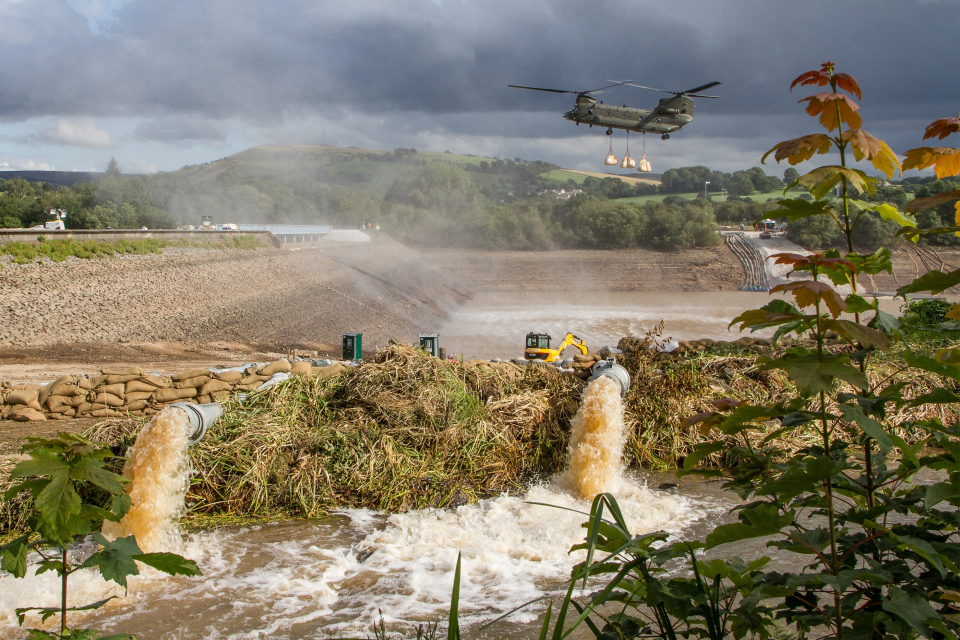
Toddbrook reservoir incident
Toddbrook reservoir came close to failing on 1 August 2019, when the spillway was badly damaged by flood water. 1,500 people were evacuated from Whaley Bridge, downstream of the dam. We worked with the Canal & River Trust, which owns the reservoir, specialist reservoir engineers, the local resilience forum and the RAF to shore up the dam and to pump the reservoir out. Disaster was narrowly averted and after 6 days, residents were allowed to return to their homes.
Stage 1 of the independent review, published in September 2019, made 22 initial recommendations to improve reservoir safety. The recommendations apply to all those individuals and organisations involved in reservoir safety management. We are working with Defra to implement the recommendations that apply to us and to support the second part of the review, which will report on the effectiveness of the existing reservoir safety legislation and regulations and whether changes are needed.
6. Protecting and improving the environment
Our aim is to protect and improve the environment for people and wildlife. We work with Defra and others to achieve the government’s ambitions as set out in the 25 Year Environment Plan, leaving the environment in a better state than we find it. We want future generations to inherit a healthy, biodiverse natural environment that promotes their health and wellbeing.
6.1 Cleaner air
Air quality in England has improved. Changes made at the sites we regulate have achieved significant reductions of sulphur oxides (SOx), nitrogen oxides (NOx) and small particulates (PM10[footnote 17]). However, air pollution continues to affect the environment and impact on people.
Air pollution is caused by natural sources and by people’s activities. This includes the combustion of fuels for heat and power, industrial processes and manufacturing, agriculture and transport. Air pollution is the single greatest environmental threat to health in the UK.[footnote 18][footnote 19] It can have short term, immediate effects on health, such as wheezing and coughing, and can exacerbate pre-existing conditions. Long term exposure to air pollutants in the UK shortens tens of thousands of lives every year and reduces average life expectancy by several months.[footnote 20]
Air pollution has negative effects on habitats, ecosystems, plants and animals. Of England’s nitrogen-sensitive habitats, 95% are at risk from potential harmful effects of nitrogen deposition. Of England’s acid-sensitive habitats, 58% are at risk from acid deposition.[footnote 21]
Reducing emissions improves people’s health and protects sensitive species and sites such as upland moorlands. Some of the positive public health effects of access to the natural environment may be increased when there are higher levels of species or ecosystem diversity. It helps the economy by reducing healthcare costs by lowering the risk of respiratory illnesses. Particulate matter and nitrogen dioxide alone have been estimated to have health costs of around £22.6 billion every year.[footnote 22]
There are legally-binding international targets to reduce emissions of 5 damaging air pollutants by 2020 and 2030. They apply to nitrogen oxides, sulphur dioxide, fine particles, ammonia, and non-methane volatile organic compounds. The Clean Air Strategy[footnote 23] sets further goals and targets to reduce emissions from transport, the home, farming and industry, making air healthier to breathe, protecting nature and boosting the economy.
It is anticipated that the value of measures introduced in the Clean Air Strategy will cut the annual cost of air pollution to society by £1.7 billion by 2020 and by £5.3 billion by 2030.
Industrial emissions
The businesses we regulate under the EPR contribute 17% of all NOx emissions, 47% of SOx, 9% of PM10 in England, 7% of ammonia and 6% of non-methane volatile organic compounds.
We are working with government and the industries we regulate to implement the Clean Air Strategy and further reduce emissions to air. In particular, we are looking for ways to address diffuse emissions of ammonia and small particles from our regulated sectors.
Our permit review work is fundamental to improving the environmental performance for many of the sites we regulate. This is a sector by sector approach whereby new standards are reviewed, amended and then introduced through permit variations.
Emissions to air from sites with permits, 2000 to 2019

Bar charts showing emissions to air from sites with permits for NOx, SOx, PM10, Ammonia and NMVOCs.
In the chart ‘All other industry’ includes emissions from sectors that contribute less than 5% towards the total release of each pollutant in 2019.
Emissions from the intensive farming sector were reported from 2007.
Nitrogen and sulphur oxides (NOx and SOx) and small particles (PM10)
Significant reductions in emissions of NOx, SOx and PM10 have been achieved since 2000. Since 2010 emissions of NOx have decreased by 63%, SOx have decreased by 81% and PM10 have decreased by 34%. Emissions decreased again between 2018 and 2019 following relatively minor improvements since 2016.
Significant contributions to the reductions achieved so far include:
- coal and oil fired combustion plants closing as they are unable to meet the tighter emissions standards set in the Industrial Emissions Directive, enacted through the EPR
- more energy being generated from renewable sources, reducing the amount needed from fossil fuels
- application of best available techniques to improve process efficiency and remove pollutants from flue gases
Small particulate matter is not a single pollutant. It is made up of a wide variety of chemical compounds and materials, and classified according to size. The Clean Air Strategy proposes an ambitious, long term target to reduce people’s exposure to PM2.5[footnote 24] as well as PM10. An estimated 5% of total mortality in England can be attributed to small particulate matter (PM2.5).[footnote 25]
Ammonia
The farming sector as a whole is the biggest contributor to this country’s total ammonia emissions. In 2017, 84% of all ammonia emissions in England were from farming (half of which came from dairy and beef). 78% of this came from farms that do not hold a permit under the EPR.[footnote 26]
There was a 7% reduction in ammonia emissions from intensive farming permitted under the EPR between 2018 and 2019, from 11,700 tonnes to 10,900 tonnes. This sector contributes just 6% of all ammonia emissions in England. Most of the ammonia emissions from the sites we regulate under EPR, comes from this sector.
Ammonia combines with other pollutants in the atmosphere to form secondary particulate matter. This particulate matter can be transported across large distances, with associated health effects on a wide population.[footnote 27]
Non-methane volatile organic compounds (NMVOCs)
Emissions of NMVOCs from the sites we regulate under the EPR have decreased by 28% since 2010. NMVOC emissions decreased by 4% between 2018 and 2019, continuing the downward trend. The refineries we regulate contributed 4% of the total NMVOC emissions in England[footnote 28] with other sites we regulate contributing a further 2%.
Sources of NMVOCs include the burning of fossil fuels, transport, solvents, paints and aerosols. Smaller amounts are also released from dry cleaning, production of alcoholic drinks and from arable farming.
Medium combustion plants and specified generators
New regulations to control emissions to air from smaller combustion plants came into effect in England in 2018. The Medium Combustion Plant Directive (MCPD) and the Specified Generator Regulations (SGR) bring under regulatory control sites that have been operating for years having an unknown impact on the environment.
They cover plants that are used for a wide variety of purposes, including electricity generation, domestic or residential heating and cooling, and providing heat or steam for industrial processes. They are an important source of emissions of sulphur dioxide, nitrogen oxides and small particles.
We have used in-house methodology to estimate that across England the controls now in place will have prevented up to 36,000 potentially vulnerable people from being exposed to poor air quality and the resultant risks that brings to human health.
6.2 Climate change
Climate change is one of the greatest threats to people and the environment. It will have far-reaching effects on economies and societies, and major impacts on habitats and species. The health impacts of a changing climate will mainly be felt through changes in temperature, disease and pollution.
Adaptation
In December 2019 the requirement for climate change risk assessments for customers applying for new, bespoke waste or installations permits was introduced. This gives a structure for the formal consideration of current and future climate change risks, such as increased risk of flooding or reduced water availability. It is a 2-step process, with a series of screening questions, followed by a climate risk assessment, which forms part of their environmental management plan. Those deemed at highest risk can have additional permit conditions added to their permit to require a 4-yearly review of their adaptation assessment, or other bespoke requirements.
Greenhouse gas emissions
Emissions of greenhouse gases, from the businesses we regulate under the EPR and the Industrial Emission Directive decreased by 8% between 2018 and 2019. These emissions have reduced 43% since 2010. The emissions from those sites contribute 34% of greenhouse gases in England.
The decrease in these emissions has been driven by the continuing downward trend in emissions from power stations. This is mainly as a result of changes in the fuel mix used for electricity generation, away from coal and towards renewables. Renewable energy sources provided more electricity to UK homes and businesses than fossil fuels for the first time ever during July, August and September 2019.[footnote 29]
Greenhouse gas emissions (as global warming potential) to air from sites with permits, 2000 to 2019

Bar chart of serious pollution incidents affecting air and involving odour as a pollutant caused by industrial activities with permits.
In the chart ‘All other industry’ includes emissions from sectors that contribute less than 5% towards the total release of greenhouse gases in 2019.
The incineration and energy recovery sector accounts for 12% of greenhouse gas emissions from sites we regulate. As this sector has expanded, its total greenhouse gas emissions have also been steadily rising.
Methane emissions
In 2019, the landfill sites we permit released 143,000 tonnes of methane to air. This accounts for 88% of all methane emissions reported from the sites we permit, and about 11% of total methane emissions in England.[footnote 30] Methane emissions from the landfill sector have decreased by 39% since 2010 and by 5% between 2018 and 2019. This reduction in emissions is due to a combination of a drop in landfill gas production and improvements in landfill gas collection.
The drop in landfill gas production is largely due to the implementation of the Landfill Directive.[footnote 31] This diverted biodegradable waste away from landfill and led to a reduction in the number of operational sites. As these sites are closed and capped, collection of landfill gas improves. Since 2008 we have also focussed our regulatory effort on improving landfill gas collection and minimising emissions at operational landfill sites.
Methane emissions to air from sites with permits in England, 2002 to 2019

Bar chart of methane emissions to air from sites with permits in England, showing that the majority of emissions continue to come from landfill.
In the chart ‘All other industry’ includes emissions from sectors that contribute less than 5% towards the total release of methane in 2019.
The farming sector as a whole[footnote 32] contributes 41%[footnote 33] of methane emissions in England. The majority of this comes from livestock. Emissions from the intensive farming sites we regulate contributes less than 1% of all methane emissions in England. Anaerobic digestion plants in the biowaste sector also release methane. We have built requirements into our permits for this sector to ensure that methane releases are minimised.
The global warming potential of methane is estimated to be around 25 times greater than carbon dioxide. Even small decreases in methane can have significant benefits in terms of its contribution to climate change.
Energy efficiency and emissions trading schemes
There are a number of energy efficiency and emissions trading schemes that we administer for the UK and regulate in England. At the heart of all of these schemes is the goal of reducing greenhouse gas emissions with a particular focus on carbon emissions. These schemes cover the emission of over 200 million tonnes of carbon dioxide equivalent from industry, businesses and the public sector. This is over 40% of the UK’s carbon emissions.
We regulate more than 10,000 organisations in the UK and have successfully delivered compliance rates above 98% for each of the 5 schemes:
- EU Emissions Trading Scheme for installations
- EU Emissions Trading Scheme for aviation
- Energy Saving Opportunity Scheme
- Climate Change Agreements
- Fluorinated Greenhouse Gases (F gas) and Ozone Depleting Substances
When necessary, we take enforcement action and issue civil penalties for a range of breaches covered by these schemes. In 2019 we issued 70 civil penalties totalling over £5.5 million.
These regimes are important market instruments. Our robust regulation and shaping of future direction with government provides a platform for industry confidence and investment. The implementation of the regimes has been totally digital to reduce the administrative burden on our customers and to make it easier to comply with obligations.
6.3 New nuclear power
Nuclear power stations are an important source of electricity, typically providing about 40% of our low carbon electricity. Almost half of this capacity is due to be retired by 2025. The construction of new nuclear power stations and development of new nuclear technologies form an important part of the government’s plans to tackle carbon emissions.
In 2019 we:
- continued our regulation of the construction of the new nuclear power station at Hinkley Point C (capable of meeting 7% of the UK’s future electricity needs)
- provided pre-application advice on environmental permitting and planning matters on proposals for the Sizewell C power station
- continued our Generic Design Assessment of the reactor that is proposed to be deployed at a station at Bradwell B in Essex. This helps avoid delay and cost risks arising from modifications during construction
- began engagement with the Bradwell B Power Company, the proposed operator of Bradwell B, to help it develop proposals that should properly protect the environment
- worked with the Department of Business, Energy and Industrial Strategy (BEIS) to build our capability and enable the future development and potential deployment of advanced nuclear technologies. These include small modular reactors as well as other novel technologies
- worked closely with government, and other stakeholders, to review the regulatory framework for nuclear fusion power. Fusion is potentially a significant future contributor to low carbon energy production in the future. We engaged with the United Kingdom Atomic Energy Agency as it designed its fusion demonstrator plant which was awarded £220 million funding from the government in 2019
6.4 Cleaner, plentiful water
Water provides people and wildlife with a wide range of services. Having good water quality, managed in a way that makes sure the country is more resilient to flood and drought, is essential. We ensure good water quality standards for all, working in conjunction with the other water regulators, namely Ofwat and the Drinking Water Inspectorate.
Freshwaters
Freshwaters, which include surface waters and groundwaters, are worth at least £40 billion to the economy.[footnote 34] Water quality in rivers, assessed as biological and chemical quality, improved over the period 1990 to 2008, but these improvements have not continued as quickly in more recent years.[footnote 35] In 2009, the assessment changed to the Water Framework Directive’s ecological status, a broader definition of health and quality.
In 2019, 86% of river water bodies had not reached good ecological status. The main reasons for this are environmental impacts caused by agriculture and rural land management, the water industry, and urban and transport pressures. Diffuse pollution from and the impacts of agricultural activities not covered under permitting, where we lack the powers and resources to tackle this effectively, are an ongoing challenge. In 2019 agriculture and rural land management continued to account for around 40% of water bodies not reaching good ecological status.[footnote 36]
Only 45% of groundwater bodies achieved good chemical status in 2019. Groundwater is a vital part of England’s drinking water resources. They supply around a third of the country’s drinking water.[footnote 37] Nitrates are a major issue and can cause exceedance of drinking water quality standards. Nitrate enters groundwater from diffuse pollution on land (mainly water run-off from agricultural land) or is deposited onto land from the air. The government’s 25 Year Environment Plan’s ambition is for three quarters of waters to be close to their natural state.[footnote 38]
Drinking water protected areas
Drinking water protected areas are water bodies where water is, or can be, abstracted for people to drink. This could be from reservoirs, rivers, lakes or groundwater. The Water Framework Directive requires drinking water sources to be protected and pollution controlled, to prevent deterioration in water quality, and over time to improve it.
Abstracted, or raw, water is treated before we drink it, and the treated water must meet the Drinking Water Directive standards.[footnote 39] Reducing pollution in drinking water protected areas is important because it ensures water remains fit to drink, and good water quality reduces the amount of treatment needed before it can go into the public supply system.
In England:
- 239 of the 485 surface water Drinking Water Protected Areas (49%) are ‘at risk’ of deterioration[footnote 40]
- 127 of the 271 groundwater Drinking Water Protected Areas (47%) are ‘at risk’ of deterioration and 71 are not meeting good chemical status[footnote 41]
The top pollutants are pesticides and nitrates from fertilisers. Through runoff into water, they are a risk to sources for abstraction, have wider environmental impacts, and their removal increases costs at water treatment works. Nitrate and pesticides not taken up by crops also have economic costs for farmers.
Working with water companies we identify Safeguard Zones around these protected areas. These are areas where land use practices are causing, or have caused, water quality to deteriorate.
In the next water company investment period 2020 to 2025, water companies will complete:
- 29 measures to improve the water they abstract from the environment
- 236 measures to prevent deterioration
- 77 investigations into why water quality is deteriorating
Many of these actions are targeted at nitrates and pesticides and will help provide recommendations for further actions.
Water and sewerage companies
We have published a report on the Water and sewerage companies in England: environmental performance for 2019. This shows that some companies need to make significant improvements to reduce pollution incidents and comply with their discharge permits. Sector performance in 2019 deteriorated for the second year in a row, with 4 out of the 9 companies rated as poor or requiring improvement, the highest number since 2011.
The report also outlines the actions we are taking to address areas where water and sewerage companies are failing, or not meeting, our performance expectations.
Water and sewerage company discharges of sewage effluent to rivers are much cleaner now than in 1995. Environmental improvements have reduced phosphorus, ammonia and biochemical oxygen demand (BOD) in sewage treatment works discharges.
Loads discharged to rivers from water company sewage treatment works in England and Wales

Bar chart of loads discharged to rivers from water company sewage treatment works in England and Wales, showing reductions in the annual load of BOD, ammonia and phosphorus.
Ensuring plentiful water
The Security of Supply Index (SoSI) compares forecasted water available for supply with actual customer demand. Companies are expected to have a balance or a small surplus of water available when compared with demand, scoring an SoSI of 100.
For the financial year 2019 to 2020, 8 of the 9 companies reported a score of 100, and 1 company reported a score of 99. For the same period total leakage for all water companies was 2.3 million cubic meters per day, reduced from 2.4 million cubic metres per day the previous year and well below the forecast for the year.
Sustainable abstraction
The Water Resources Act protects the quantity of water available for legitimate abstractors, and the environment. We undertake regular checks of abstractors and follow up reports of water theft. If we find there is illegal activity, then operators will face enforcement action that could result in a significant fine and a criminal record.
During 2019, we checked over 3,600 abstraction licences and found just over 85% were compliant. The reasons for non-compliance were varied. Most breaches were because licence holders did not keep accurate records of how much water they took, or they did not submit their record of abstracted quantities to us as required (303 licence breaches). Some abstractors exceeded their licence volume limits (94 licence breaches), or abstracted water despite river levels falling below critical trigger thresholds (33 licence breaches). Advice, guidance or warning letters were given for less significant breaches, with further investigations resulting in civil sanctions and prosecution for the more significant non-compliances.
Currently too much water is being abstracted, and this is damaging the environment. Environment Agency modelling suggests that around 700 million litres of water per day comes from unsustainable abstractions, and that these will need replacing by other means between 2025 and 2050.[footnote 42]
Of the water taken from freshwater sources, 51% is abstracted by water companies for public water supply and 38% is used by other industries. Current levels of abstraction are unsustainable in more than a quarter of groundwater bodies and up to one-fifth of surface waters, reducing water levels and damaging wildlife.[footnote 43]
In 2019, the Restoring Sustainable Abstraction programme changed 23 abstraction licences, removing the risk of 22 billion litres of water being abstracted each year.
In addition, through reviewing and revoking unused and underused licences in 2019, we revoked or reduced 115 licences where the risk of abstracting about 146 billion litres of water has been removed.
We are also working collaboratively with abstractor groups and stakeholders in 10 initial priority catchments to develop and trial new solutions, such as rapid water trading and enabling high flow abstraction.
Bathing waters
Maintaining a high quality of bathing water benefits health and wellbeing as well as boosting local economies. There were 135 million day visits taken to the seaside in England in 2019, worth £4.4 billion to the economy.[footnote 44]
Bathing water quality has remained high following the record results in 2016, which showed bathing waters were the cleanest since records began. In 2019, bathing water quality was tested at 420 beaches and lakes.[footnote 45] Compliance with bathing water standards was 98.3%, with only 7 waters receiving the lowest classification of ‘poor’. 300 bathing waters (71.4%) met the highest ‘excellent’ standard of the Bathing Water Directive. Bathing waters meeting at least the minimum standard has been largely stable over the last few years at 98.5% in 2016, 98.3% in 2017, and 97.9% in 2018.[footnote 46]
Bathing water quality, 1995 to 2019

Bar chart of the percentage of bathing waters rated excellent, good, sufficient and poor.
Bathing water quality is affected by a range of sources of faecal organisms. The most important are sewage related pollution, diffuse pollution from agriculture and urban diffuse pollution (including contamination from dogs and birds). The relative contribution from these sources will vary between sites depending on the nature of the catchment and its land use. Most sites are affected by more than one source. Heavy rainfall has a significant short term impact on water quality.
Improvements in bathing water quality have been largely due to improvements in the sewerage infrastructure at, or near, a number of bathing waters. Between 1990 and 2020, the water industry will have invested over £2.5 billion in bathing waters improvement work. Local action plans are in place for the waters that need improvement, involving a range of partner organisations.
6.5 Reduced waste
The amount of waste going to landfill in England decreased by 43% between the financial year 2000 to 2001 and the calendar year 2019.
Waste reuse and recovery helps protect natural resources and reduce the need to dispose of material. In recent years, more waste has been reused and recycled, and less landfilled. 20 years ago nearly all waste went to landfill. Most waste is now reused or used for energy generation. But this has led to a large increase in the number of sites storing and treating wastes, often in close proximity to communities. In turn this has also increased the risks of fires and odours.
Waste management, 2000/01 to 2019

Bar chart of management of waste to landfill, transfer and treatment.
Waste from regulated industry
In 2019, the sites we permit produced 15.1 million tonnes of waste, a small increase on the 14.8 million tonnes in 2018. A record 74% of this waste was recovered or reused, compared with 66% in 2010.
The sectors that produced the most waste in 2019 were:
- biowaste treatment, 22% of the total produced (79% recovered) – the amount of waste produced by this sector decreased by 12% between 2018 and 2019
- incineration with energy recovery, 22% of the total (82% recovered) – the amount of waste produced by this sector increased by 8% between 2018 and 2019
- food and drink,17% of the total (94% recovered) – the amount of waste produced by this sector increased by 22% between 2018 and 2019
The biowaste treatment and incineration with energy recovery are sectors that take in waste materials from other sectors.
Waste produced and recovered by sites with permits, 2000 to 2019

Bar chart of waste produced and recovered by sites with permits, showing the overall percentage of waste recovered for all sectors is 74%.
In the chart ‘All other industry’ includes waste from sectors that contribute less than 5% towards the total amount in 2019.
Waste spread to land
Almost 4.6 million tonnes of waste was spread to land in 2019, about 17% less than the previous year, but still 53% more than the 3 million tonnes spread in 2011. The majority of waste spread to land is from the farming sector, construction industry and water treatment facilities, representing 42%, 24% and 23% of waste spread to land respectively.
Treated sewage sludge can be spread to agricultural land under the Sludge (Use in Agriculture) Regulations with over 700,000 tonnes of dry solids spread in 2019.
Waste exports
Any wastes other than clean, separated material sent for recycling, must be notified to us. Exports of notified waste are predominantly refuse derived fuels sent to European countries for energy recovery. In 2019, 3.3 million tonnes of notified waste was exported from England.
Green list wastes are considered low risk to the environment and subject to lower regulatory controls. Unless specific restrictions are set by the receiving country, sorted, uncontaminated waste sent for recycling overseas can be exported as green list waste.
In 2019, we received 457 export notifications and 168 import notifications.
We have strengthened our assessment of exporters of producer responsibility packaging waste. This applies where the waste is being exported for the purpose of contributing to the UK packaging recycling rates. Exporters are required to demonstrate that exported waste is high quality with minimal contamination, destination sites are appropriately licensed to receive and treat the waste, and waste is correctly processed once received. In 2019, almost 4 million tonnes of producer responsibility packaging waste was exported by accredited exporters. We approved applications for 4,812 overseas sites to receive packaging waste for recycling. We rejected 294 sites.
6.6 Nuclear decommissioning and radioactive waste management
In partnership with the other UK environment agencies we published guidance for nuclear site operators on our requirements for release from radioactive substances regulation. This provides guidance on our expectations for the decommissioning of permitted sites in order to release them from the permitting regime. 2019 saw the continuation of its implementation with regulators working with operators. This was an important step in our significant role in support of the decommissioning and clean-up of the UK’s nuclear energy legacy.
Since the launch of the government policy paper, Implementing Geological Disposal: Working with Communities: An updated framework for the long term management of higher activity radioactive waste in 2018, we provide pre-application advice and scrutiny of radioactive waste management (RWM). We have been preparing to support discussions with communities, local authorities and others considering hosting a geological disposal facility.
6.7 Plastics
It is clear that plastic litter causes harm through entanglement of wildlife and that many creatures are ingesting plastic. In 2019 to help understand the risks posed by plastics entering the environment and what this means for our regulatory control, we:
- collated evidence on sources, pathways and receptors and used this to identify knowledge gaps, setting out the questions that we believe further research could help answer
- shared our evidence gaps with researchers, research councils, the 5 agencies ShARE programme, Innovate UK and helped to join up research needs across the Defra group
- worked with Defra, water companies and academia to progress more immediate harmonisation of definitions and techniques
Reducing plastics entering the environment
We began reviewing the effectiveness of the quality protocols (these set out end of waste criteria for the production and use of a product from a specific waste type) for compost and digestate materials.
We engaged with the 6 water companies using plastic ‘bio-beads’ in some wastewater treatment processes resulting in them installing containment measures to prevent their loss.
We worked in partnership with the biowaste industry on regulatory and other voluntary changes, and various campaigns to reduce plastics contamination in green waste and food waste.
Reducing plastics across our supply chains
We reduced our own plastics waste by 31% (equal to 5.5 tonnes carbon or 30 tonnes of avoided carbon). Successes included encouraging our staff to use plastic free hotels and venues and influencing businesses to not only become plastic free at their venues but to develop wider plans across their organisations.
7. References
-
World Health Organization (2009). Country profiles of environmental burden of disease by WHO regions. ↩
-
Public Health England (2019). Review of interventions to improve outdoor air quality and public health. ↩
-
Public Health England (2018). New tool calculates NHS and social care costs of air pollution. ↩
-
Office for National Statistics (2019). UK natural capital accounts: 2019. Estimates of the financial and societal value of natural resources to people in the UK. ↩
-
2019 was the last year the UK was a Member of the European Union (EU). Many of the environmental laws and standards we implement stem from Europe, some of which are referenced in this report. The government enacted legislation to retain these laws and standards as a baseline from 1 January 2021. ↩
-
Environment Agency (2017). Regulated industry sector strategies. ↩
-
Marmot M and others (2020). Health equity in England: The Marmot Review 10 years on. ↩
-
BEIS (2020) Nuclear and radiological safety: review of the UK framework 2019. ↩
-
This figure is for the 9 main water and sewerage companies in England, and for incidents affecting the water environment (not land or air) under their Water Industry Act responsibilities. This is the same as in our report Water and sewerage companies in England: environmental performance for 2019. ↩
-
Waste management activities include: the permitted sectors waste treatment, landfill, biowaste and incineration with energy recovery (energy from waste) and waste activities exempt from permitting. ↩
-
DNOSES-EU. (2018). Policy Brief. Zaragoza: Distributed network for odour sensing, empowerment and sustainability. ↩
-
Hayes, J. E. and others. (2014). The impact of malodour on communities: A review of assessment techniques. Science of the Total Environment. ↩
-
Defra (2020). Clock is ticking for waste criminals as new taskforce launched. ↩
-
This covers enforcement actions used for waste, water quality and emissions offences by businesses and individuals. Previous Regulating for people, the environment and growth reports have quoted statistics for registered companies only. ‘Businesses’ includes registered companies, but is not limited to them. The data come from a live database and are subject to adjustment over time. ↩
-
We report every 2 years on the actions we’ve taken to ensure compliance with the Reservoirs Act. This information is taken from our most recent report published in 2019. Reservoir safety biennial report. ↩
-
The reservoir undertaker is the person responsible for the day to day monitoring of the reservoir in line with recommendations made by the supervising or inspecting engineer. ↩
-
PM10 is small particulate matter less than 10 micrometres in size, such as dusts, smoke particles and pollens, which can be breathed deeply into the lungs. ↩
-
Public Health England (2019). Public Health England publishes air pollution evidence review. ↩
-
Environment Agency (2020). State of the environment: health, people and the environment. ↩
-
Public Health England (2018). Health matters: air pollution. ↩
-
Rowe E and others (2019). Trends report 2019: Trends in critical load and critical level exceedances in the UK. ↩
-
Royal College of Physicians (2016). Every breath we take: the lifelong impact of air pollution. ↩
-
Defra (2019). The Clean Air Strategy 2019. ↩
-
PM2.5 is small particulate matter less than 2.5 micrometres in size – smaller than PM10. It is highly respirable – able to get very deeply into the lungs when breathed in. ↩
-
Public Health England (2017). Public health profiles. ↩
-
Based on National Atmospheric Emissions Inventory data 2017. ↩
-
Environment Agency. (2018). State of the Environment: Air quality. ↩
-
Based on National Atmospheric Emissions Inventory data 2017. ↩
-
Carbon Brief 2019. Analysis: UK renewables generate more electricity than fossil fuels for first time. ↩
-
Based on National Atmospheric Emissions Inventory data 2017. ↩
-
Environment Agency (2011). Understanding the Landfill Directive. ↩
-
Including intensive pig and poultry farms regulated under the Environmental Permitting Regulations (EPR) and non-EPR regulated farms. ↩
-
Based on National Atmospheric Emissions Inventory data 2018. ↩
-
Office for National Statistics (2015). Natural capital accounting 2020 roadmap: Interim review and forward look. ↩
-
Environment Agency (2018). The state of the environment: water quality. ↩
-
Environment Agency (2019) River basin management plans 2021: agriculture and rural land management. ↩
-
Environment Agency (2019) Groundwater source protection zones (SPZs). ↩
-
Defra (2018). A green future: our 25 year plan to improve the environment. ↩
-
Drinking water standards are regulated by the Drinking Water Inspectorate. ↩
-
Most up to date data available (2019). ↩
-
Most up to date data available (2018). ↩
-
Environment Agency (2020). Meeting our future water needs: a national framework for water resources. ↩
-
Environment Agency (2018). The state of the environment: water resources. ↩
-
Visit Britain (2020). The Great Britain day visitor 2019 annual report. ↩
-
Defra (2020). Bathing water quality statistics. ↩
-
The bathing water standards changed in 2015 to become more stringent. The chart shows the classifications of bathing waters as they would have been if the 2015 standard had been applied to all the years prior to 2015 on the chart. ↩