The Annual Report of His Majesty’s Chief Inspector of Education, Children’s Services and Skills 2022/23
Published 23 November 2023
Applies to England

© Crown copyright 2023
This publication is licensed under the terms of the Open Government Licence v3.0 except where otherwise stated. To view this licence, visit nationalarchives.gov.uk/doc/open-government-licence/version/3 or write to the Information Policy Team, The National Archives, Kew, London TW9 4DU, or email: psi@nationalarchives.gov.uk.
Where we have identified any third party copyright information you will need to obtain permission from the copyright holders concerned.
This publication is available at https://www.gov.uk/government/publications/ofsted-annual-report-202223-education-childrens-services-and-skills/the-annual-report-of-his-majestys-chief-inspector-of-education-childrens-services-and-skills-202223
The Annual Report of His Majesty’s Chief Inspector of Education, Children’s Services and Skills 2022/23
Presented to Parliament pursuant to section 121 of the Education and Inspections Act 2006.
Ordered by the House of Commons to be printed on 23 November 2023.
© Crown copyright 2023

Clive House
70 Petty France,
London
SW1H 9EX
23 November 2023
The Rt Hon. Gillian Keegan MP
Secretary of State for Education
Department for Education
Sanctuary Buildings
Great Smith Street
London
SW1P 3BT
Dear Secretary of State
The Annual Report of His Majesty’s Chief Inspector 2022/23
This is my seventh and last Annual Report as Chief Inspector: I am the longest-serving since Ofsted was established, and the only one to have served through system disruption of the kinds experienced since 2020. I am pleased that I can report on much progress in my time, as well as having to record the current challenges. I would like to record my thanks to you, your predecessors and your officials for all the constructive work between our departments.
Looking back at what I set out to do when I took up this role, I believe Ofsted has substantially achieved it.
In social care, we have launched and embedded two strong inspection frameworks, and continue to evolve and strengthen our work in the context of many strands of government reform.
In education, we have:
- built a new evidence-based inspection framework with wide sector support – the conception of quality it embodies is respected and valued
- within the limits of government policy, which gives Ofsted only a diagnostic role, reframed the inspection process with professional dialogue at its centre, to make it valuable and valued at the receiving end
- improved and extended inspector training to build a common platform of up-to-date knowledge of education and understanding of the framework and also recognition of the importance of consistent application of the framework
- reinforced the other quality assurance mechanisms that help bring a high level of consistency to a human judgement process.
We have good evidence of all of these: in all the sectors where we work, post-inspection surveys over time show a strongly positive picture overall. With results once again available to us, the relationship between school inspection outcomes and published results is as strong as it was under the previous framework. At the same time, we are routinely told that inspection now feels collaborative and supportive.
Yet for schools (although not for our other remits), we are also seeing a wave of publicly expressed discontent about issues that Ofsted alone cannot resolve.
Much of this links to how school inspection judgements are used in the government’s regulatory system. Government interventions are of course aimed at school improvement, but their linkage to inspection judgements understandably increases sector anxiety about what actions may follow a disappointing inspection outcome. Extending these powers to second requires improvement (RI) judgements has intensified anxiety, increasing worry ahead of inspections and making inspections themselves more pressured.
Ofsted’s role is also poorly understood. Many people do not recognise that as a matter of government policy, Ofsted’s schools work (and funding) has long been limited to the diagnostic function of inspection. Ofsted is not a policy-making department and cannot decide to divert its resources to support work, any more than the driving test agency can decide to switch to giving driving lessons. Yet it is being argued that Ofsted is acting punitively or in bad faith by not doing so. Clarification is needed.
There is also limited school sector understanding of the wider framework of public accountability for public services, where health, adult social care, police forces, fire services and prisons are all inspected with the same or a very similar grading system. The judgement model Ofsted uses in early years, schools, colleges, other post-16 education and children’s social care is in fact entirely in line with other inspectorates.
Finally, I have been chief inspector through seven years of intense pressure on public finances, during which our already reduced budget has had to absorb the entire impact of inflation. Relative to school budgets, the current government allocation to school inspection is about a quarter of what it was 20 years ago. To illustrate this, the entirety of our work on state secondary schools (including all training and overheads) now has to be done with the budget of one moderately large secondary school. This means that school inspections are necessarily shorter and more intense; reports are necessarily briefer; and many strands of our work that help build school sector goodwill and reinforce our value to the sector, government and others are having to be progressively curtailed.
Despite all this, Ofsted continues to perform its role fairly, professionally, thoroughly and constructively. We aim to raise standards and improve lives, and I am confident we do that. I firmly believe that our independent scrutiny is of huge benefit to the education and care sectors and to the children and learners we all serve.
As this report shows, much good has been achieved in recent years. The regulatory system, of which inspection is an integral part, plays a vital role. Compromising the regulatory system could undermine progress. My parting hope is therefore that government will recognise and find ways to address the pressures and imbalances described in this letter in its future policy and funding decisions.
Yours sincerely
Amanda Spielman
His Majesty’s Chief Inspector
HMCI commentary
Introduction
This report reviews education and children’s social care over the last academic year. But there is also value in considering the changes and challenges of the last seven years, through which I have had the privilege to be His Majesty’s Chief Inspector.
The pandemic with all its disruptions has of course overshadowed this period. So it is all the more important to draw out the positive changes that have happened, both in spite of and because of it.
Because while the pandemic caused many problems, exacerbated others and continues to limit progress in various ways, there are still reasons to be optimistic. Recovery is continuing and happening faster than we might have expected. We are seeing real and lasting strength in education: curriculum has improved in nearly all the subjects on which we have reported; the teaching of reading in primary schools is significantly better; well-structured teacher training is yielding results; and some local authorities are making substantial improvements in social care.
This progress should not be underestimated, and the remarkable efforts that have made it possible should be recognised. It’s also important that children look forward to the future with confidence. Imbuing children with optimism – that they are prepared for and can rise to the challenges of the future – is a worthwhile end in itself.
But of course, optimism must be tempered by realism. Current realities in education and social care include stubborn gaps in children’s learning, recruitment and retention issues, and increasing demands for additional services that are already overstretched. High demand for special educational needs and/or disabilities (SEND) and mental health services is particularly straining limited resources.
And in education we have seen a troubling shift in attitudes since the pandemic. The social contract that has long bound parents and schools together has been damaged. This unwritten agreement sees parents get their children to school every day and respect the school’s policies and approach. In return, schools give children a good education and help prepare them for their next steps in life. It took years to build and consolidate, from when schooling first became compulsory.
Unfortunately, there is ample evidence that this contract has been fractured, both in absenteeism and in behaviour. Restoring this contract is vital to sustaining post-pandemic progress, but is likely to take years to rebuild fully.
Reasons for optimism
Nevertheless, thanks to the incredible work of everyone in education and children’s social care, we are seeing more reasons to be optimistic.
During my time as HMCI, I have seen sustainable improvements in education. The effort going into making and teaching better curriculums in schools, colleges and even nurseries is very encouraging. Results are of course extremely important, and it is good that there is now much more attention being paid to how those results are being achieved: are children and learners truly building and sustaining the knowledge and skills that will take them forward in life? This was a deliberate aim when we developed and introduced the education inspection framework (EIF), which has translated effectively into practice.
The subject reports in our current series show how curriculum thinking has advanced. This is particularly evident when compared to comparable reports from the early 2010s:
- The maths report that we published in 2012 noted that ‘very few schools provided curricular guidance for staff’, while this year’s report found that ‘leaders prioritise creating or adopting a high-quality mathematics curriculum’.
- 2011’s geography report found that ‘many of the teaching units did not provide a clear and sequential structure which would enable pupils to develop and improve their geographical knowledge.’ This year’s report found that ‘in most schools, leaders have identified what should be taught and when it should be taught, and they are increasingly considering the best way to teach it.’
- And our new history subject report found that ‘the position of history in schools is much more secure now than it was 12 years ago’ and ‘there has been significant work done in the large majority of primary and secondary schools to develop a broad and ambitious curriculum.’
There is a similar picture in our subject reports on music, PE, and science, though a rather less positive picture in RE. The English report to be published very shortly will show strong progress in early reading and some other aspects but also room for improvement elsewhere. Nevertheless, the overall picture across national curriculum subjects is strongly positive.
This deeper thinking about curriculum undoubtedly helped when the pandemic hit. Schools were able to adapt quickly and bridge their curriculums where required. Along with the other adjustments during and since the pandemic, this has helped to minimise its impact on children’s progress. In the immediate wake of lockdown, there was significant debate about catch-up. My view was that for most children, most catch-up would happen in their normal classrooms, with their normal teachers – and that seems to have been the case.
Giving proper time and thought to curriculum has also helped in the early years. This has been particularly important to a generation born into a socially distanced world, who have missed out on some socialisation as well as some early education. There is real value in what children learn in nurseries and with childminders about social interaction: how to relate to adults outside their family, play with other children, take turns, behave in a group. All this has underlined the importance of education in the early years.
With our framework, we have rebalanced early years inspection to give as much weight to early education as to childcare. Our ‘Best start in life’ research reviews are designed to contribute to the continued development of curriculum understanding for the youngest children.

Reading is another area where there are many positives. In primary schools, the teaching of reading has significantly improved. The quality of the reading curriculum and training for staff are better – though more is needed at secondary level for the weakest readers.
Over the past seven years, there has definitely been a marked increase in interest and policy development around further education. T levels were one innovation and while our review highlighted the teething problems, the ambition to re-shape further education is clearly there. The skills agenda has re-energised the conversation about post-16 education.
The most recent announcement of a new Advanced British Standard curriculum model and qualification shows that policy thinking continues to develop. The announcement also clearly recognised that funding will be needed to bring the amount of teaching our post-16 learners receive up to internationally competitive levels. That would make a real difference and be a welcome development at a time when workforce skills are a national priority.
Improvements in education have been supported and reinforced by the progress in teacher training. The golden thread from initial teacher training, through the early career framework and on to national professional qualifications (NPQs), creates a path for a high-skilled teacher workforce, with high-quality professional development available through their careers.
In social care, we are also seeing incremental improvements. Having introduced our current inspection of local authority children’s services (ILACS) framework in 2018, we have now started returning to local authorities for their second ILACS inspection. Services have continued to improve (from a relatively low base) in difficult conditions, with 60% of all local authorities now rated good or outstanding and many sustaining their progress.
This year, we added a new and distinct judgement into our ILACS looking at the experience and progress of care leavers. Getting the support right for young people as they leave care is of critical importance to their future lives. So far (and with only 26 authorities inspected), the experience of care leavers is lagging slightly behind that of children in care. I hope the additional scrutiny leads to rapid improvements.
In our joint targeted area inspections (JTAIs), which look at the multi-agency response to children and families who need help, we are seeing some excellent work at both a strategic and practice level, but it’s clear there are significant variations between areas and between partners. And agencies must be able to work with families as soon as they need help, before problems escalate.
All of these elements contribute to a steadily improving picture.
The social contract
In education in particular, improvements are faster and more sustainable when providers (an ugly word, but otherwise I must laboriously repeat a list each time) work in concert with parents. This year, there is evidence to suggest that the attitudes of some parents are falling out of alignment with those of schools in particular. The social contract between parents and schools has been coming under pressure on a number of fronts.
School absence has been a stubborn problem since the pandemic. As so often, it is the children who most need the full benefit of education who are missing the most. Absence is particularly noticeable in secondary schools, but it is a problem for all year groups, all ages, in all demographics and for children with and without special needs. Across society, there is less respect for the principle of a full-time education.
The correlation between levels of absence and educational attainment is well known. Frequent absence also limits the wider benefits of school. There’s a great deal that children learn in schools outside classroom lessons. We are also concerned about the increase in pupils on part-time timetables, which can help children adjust to school in the short-term but need to be part of a plan to begin or return to full-time schooling. Left too long, they can compound problems and result in children coming further adrift.
The remarkable flexibility many schools showed during the pandemic, and the adoption of remote education, may have had unintended consequences. The idea that school can be a pick-and-choose exercise needs to be debunked. The benefits of school go well beyond specific lessons and exam results. Only through full participation can children get all the benefits – of social skills, confidence and resilience as well as academic achievement. School is a package deal that cannot be entirely personalised to every child or parent’s preferences.
Of course, turning up is only part of the contract. Pupils also need to meet the reasonable expectations of a school and parents need to accept and support the school’s policies and culture. Some parents are increasingly willing to challenge, whether by undermining discipline codes or ignoring uniform requirements or other rules.
We have also seen a greater tendency for parents to complain to us. The number of complaints rose in 2022–23, but we aren’t seeing an increase in the number that warrant action on our part. We take all complaints seriously, but we must also be proportionate in our response. Most complaints can and should be handled at the school, or local authority or trust, level.
Schools and colleges are in an increasingly tricky position, where a routine decision can lead to prolonged public debate. More school issues – from seemingly straightforward uniform policies to the delicate choices around curriculum for relationships and sex education or the handling of transgender and other identity issues – are left in large part to headteachers, in a historic context that has made headteacher autonomy the general default position. When heads must exercise that autonomy in contentious areas, they can feel isolated and unsupported, and their decisions can be inconsistent.
There needs to be greater central guidance, for several reasons: for more consistent treatment of children and young people in different contexts; to support schools and others under pressure; and to make sure that what is and isn’t accepted in schools isn’t simply driven by the loudest voices at the expense of quieter ones.
Linked to this is the role schools play in building community cohesion, to use a term that has fallen out of fashion but seems particularly relevant as I write. Schools rightly want to bring context into their curriculum, and to encourage pupils into active civic engagement. But it is important that this does not accidentally bring division and antagonism into classrooms and playgrounds. No child should be afraid to go to school or to express a view in the classroom for fear of what their classmates may say to them or do to them, let alone their teacher. It is worth re-reading the Department for Education’s (DfE) impartiality guidance for schools in this context.
Out of sight
At the most serious end of absenteeism are the children who drop completely from sight of the system. There are thousands of these children. This remains one of our biggest concerns and one that I have raised in every one of my annual reports.
This includes children in illegal unregistered schools. It often astonishes people to learn that illegal schools exist. They do – and we have been working to uncover them and prosecute their managers for a number of years. We have frequently found them operating in unsafe premises, led by unsuitable people, and teaching a very limited curriculum without even basic skills. We are still waiting for new legislation that will close loopholes and give us additional powers to close these places down.
As well as illegal schools, there are children in unregistered alternative provision (AP). AP is where children go when they cannot cope in school, or when their behaviour is too disruptive for them to stay in a mainstream school. Currently, not all AP needs to be registered or inspected. This leads to a wide disparity of provision – from excellent, through to places delivering substandard education, with very few safeguards, to some of the most vulnerable children.
Even when AP is registered, the quality of some is concerning. Graded inspection outcomes this year are worse for state-funded AP than for other schools. Tackling substandard unregistered AP and improving registered provision must be priorities.
The continued rise in the numbers of children needing SEND support and education, health and care (EHC) plans is a linked issue. Many local authorities are struggling to meet demands. Many pupils who are awaiting specialist placements are being referred to AP indefinitely or their parents see no option other than home-schooling, which suppresses the real scale of the issue.
Social care – demand and supply
Problems of increasing demand and limited supply are a chronic challenge in the provision of social care – where we continue to see struggles with sufficiency. This is another theme that I have returned to year after year. There does now seem to be greater recognition of the problem, but that needs to turn into action.
There are shortages in children’s home places, foster care availability and resources for SEND and mental illness. Frequently, children do not have the right provision available locally, so an increasing number are ending up in unregistered placements, often deprived of liberty or living too far from home. Unregistered homes represent a significant issue. Last year, we identified 370 such premises that were operating illegally. Most closed when they were challenged.
The response of local authorities to homeless children aged 16 and 17 is also very mixed in quality.
And we need to see a better range of options for children currently on deprivation of liberty orders so they experience safe care with no more restrictions on their lives than are properly needed.
We are acutely aware of the challenging position we are in as the regulator of homes, in a market where demand far outstrips supply. Whenever we restrict or close poor provision, we are reducing the supply still further – and perhaps requiring children to uproot and move home, sometimes many miles away. It is right that we act in the interests of children’s safety and security, but it’s an invidious position to be in and we balance our decision-making very carefully.
This year, concerns have continued about unaccompanied asylum-seeking children placed in inappropriate settings, including hotels. The recent high court rulings have provided some welcome legal clarity around local authority responsibilities and Home Office’s powers – but they don’t provide a solution to the problem. We are part of a cross-government taskforce and we have accompanied the Independent Chief Inspector of Borders and Immigration (ICIBI) to advise on the inspections of the hotels still being used to house these children.
Workforce
A consistent issue in recent years – and one felt sharply at the moment in both education and social care – is retention and recruitment of staff.
In the early years, providers are being forced to use agency staff and apprentices to maintain the required staff–child ratios. If the staff aren’t available, providers are forced to scale down provision, further contributing to a squeeze on places.
In schools, staff shortages are reducing expert teaching, increasing stress, limiting intervention when children struggle, and creating a barrier to teachers accessing training and development.
Social care providers are competing against roles in sectors like hospitality which offer comparable pay but with fewer responsibilities and expectations. And in social work there is an overreliance on agency social workers which undermines the consistency of the support that children experience.
In further education and skills, shortages in key industries are tempting tutors back into the workplace because their skills command a premium.
And staff shortages also affect the professions that support children and families – with a knock-on effect for schools and social care providers. These include speech and language specialists, educational psychologists and health visitors.
Easing staffing pressures, improving funding models and providing more clarity and guidance for providers will all help sustain the positive trends that are beginning to emerge. But the national workforce is clearly constrained. Looking in the round at the workforce requirements of all the different public and voluntary services for children, especially those with SEND and those in care, might help to make sure that finite capacity is directed where it will have most value for children.
Ofsted’s work
We are one part of a large and complex accountability system that oversees education and social care. We have limited resources, especially for our work in the school sector. And yet, through our work, we exert real influence on the sectors we inspect and regulate.
As the regulator of social care and early years providers, we have direct powers of intervention. Then there is the influence that comes from the act of inspecting providers. Inspections are not just about judgements but also about professional dialogue with staff and leaders in nurseries, schools, colleges, children’s homes, apprenticeship providers, local authorities, prisons and the rest.
Much of our influence arises from our frameworks and the research reviews and reports that sit underneath them. They lay out a well-evidenced conception of quality, around which we have built consensus. We know that these and our handbooks are well-used long before an inspector visits.
Influence also comes from the work we do to aggregate and supplement the insights from inspection, directed at the issues that matter to the sectors we work with, and to publish and communicate them in ways that are useful to practitioners and also to policy makers.
It’s important that we use all these levers responsibly and carefully, and that we listen to the people we inspect and regulate as well as drawing on relevant research. This year, there has been a great deal of discussion around our work – in particular our work with schools. Throughout the year, we have listened to all the voices in the debate.
We made some changes in response to what we heard. We are returning more quickly to schools graded inadequate overall only because of ineffective safeguarding, we have already given more information to school leaders about aspects of the inspection process and likely timings of inspections, and we are making some changes to our complaints system.
We believe that these changes are proportionate and will be effective, but of course we will always consider further ways to improve. Most importantly, we will continue to listen to parents and learners, the education and social care sectors, and to a wide range of interested parties, through our full programme of engagement with representative groups and other stakeholders.
Inspection, like any form of scrutiny, may never be entirely comfortable for the recipient. But we try to make it as positive and valuable an experience as it can be – and make sure it is always grounded in the best interests of children and learners. The inspection feedback that we collect regularly and publish in our annual reports consistently shows that in a very high proportion of our work, it lands as it should. It is Ofsted that has to make the tough calls when provision of any kind is not good enough for children, and some contention will always flow from that.
This year, we have also been carrying out an implementation review of the EIF. This review evaluated whether we are carrying out inspection as intended, and the challenges in doing so. It found that the EIF is being implemented largely as intended, and that the framework is flexible across a range of provision types. We have identified some areas where implementation is challenging. For example, although we have sufficient time to come to valid judgements, inspectors recognise that in ungraded school inspections in particular, the limited time they have can restrict the professional dialogue with leaders and others more than is desirable.
As part of our commitment to transparency and accountability, we will shortly publish the main findings of the review. Next year, we will begin an impact evaluation that will give a further opportunity for the sector to feed back views on the EIF.
The results from re-inspections of schools previously graded outstanding and exempted from inspection for many years has already shown what can happen in the absence of regular external inspection. As in so many areas of public service, regular scrutiny of schools helps maintain a focus on standards. When scrutiny is removed, standards can slip simply because there is no perceived need to notice and keep up with what is happening elsewhere.
In social care, there has been a series of reports of troubling cases where cruel and unfit adults have killed or harmed children. The removal of vulnerable children from the sight of so many adult eyes and the absence of some routine services and controls through the pandemic both contributed to some of these. Nevertheless, there have been lessons for us and for others, especially about what is needed to protect children with the most severe special needs, such as those who are non-verbal.
Our inspections are not investigations – we will always rely to some degree on providers being open and honest with us. But we are looking at how we can more quickly identify where this is not happening. In a regulatory system that places significant weight on provider notifications, it is important to make full use of and connect the pieces of information that can signal problems directly or flag a possible loss of integrity. We have improved our inspector training, systems and analysis. And we are deploying more inspectors with specialist knowledge of complex disabilities, as well as discussing with the Care Quality Commission how they can support and assist our teams.
We are also working with DfE to explore new powers that would strengthen regulatory oversight of children’s homes. Currently, we can take regulatory action only against individual settings, not at ownership level. This does not reflect the way the children’s home market operates today.
Conclusion
The evidence of this report shows that we can be optimistic about education and care in England. The pandemic has a long tail; significant challenges remain, but they are not intractable.
And optimism is a positive message to give to children at a time when they are assailed on all sides – sometimes prematurely – by the worries and concerns of the adult world. It is vital that children do not see their future as a tarnished inheritance. Children need optimism. They need space to grow and develop; to enjoy childhood; to relish their education; to build resilience and to become confident that they have a part to play as adults in making good lives and contributing to moving the world forward. This is needed before they are loaded with the heavier burdens of adult life.
For that to happen, we need vibrant, successful and positive education and social care sectors, able to attract new talent and continuously improve. The people working in education and care deserve recognition and support, not a narrative of decline. It’s not a fair reflection of their work and it’s not fair on the children whose lives they help to shape.
This generation of children has lived through difficult and destabilising times. We must make sure they grow up with the curiosity, confidence and passion to pursue their goals – and the education, skills and security to achieve them.
Early years and childcare
The quality of a child’s experiences in their first five years has a lasting impact on their educational attainment as well as their future health and happiness. This is why our strategic priorities include ‘the best start in life’. We want to make sure we have good evidence for and raise awareness of what constitutes a high-quality early education. One of the greatest challenges to high-quality early education is the growing number of unqualified staff working in nurseries and pre-schools.[footnote 1] In 2023, one in five staff is unqualified compared with one in seven staff in 2018.[footnote 2]
Ofsted inspects and regulates 62,300 early years and childcare providers.[footnote 3] These offer 1.26 million Early Years Register (EYR) places. Most providers looking after under-fives must register on the EYR. This includes nurseries, pre-schools, holiday clubs, childminders and other private childcare. Those who care for children aged five to eight are registered on the compulsory part of the Childcare Register (CR). Providers caring for children over eight, nannies and before- and after-school childcare can register on the voluntary part of the CR.
Early years inspection and regulation
What we did this year
This year, we carried out 12,300 full EYR inspections (see annex for data definitions). Eighty-five per cent resulted in a judgement of good or outstanding for overall effectiveness. All of these inspections are good or outstanding for quality of education and behaviour and attitudes. Across all judgements, childminders are more likely to be good or outstanding than nurseries and pre-schools.

View data in an accessible data format.
Of the inspections carried out this year, 40% previously judged outstanding and 79% previously judged good kept the same grade. However, 8% that were previously judged outstanding declined to requires improvement or inadequate.
Table 1: Overall effectiveness of early years providers this year, by previous overall effectiveness
| Previous overall effectiveness | Total number of inspections | % Outstanding | % Good | % Requires improvement | % Inadequate |
|---|---|---|---|---|---|
| Outstanding | 1,250 | 40 | 51 | 4 | 4 |
| Good | 6,930 | 6 | 79 | 6 | 8 |
| Requires improvement | 720 | 2 | 79 | 8 | 11 |
| Inadequate | 850 | 1 | 68 | 19 | 12 |
| Not previously inspected | 2,520 | 10 | 76 | 7 | 8 |
| Total | 12,300 | 10 | 75 | 7 | 8 |
Registering and regulating childcare providers are important parts of our work, as well as inspecting. We assess anyone who applies to join the EYR or CR to check whether they are suitable to care for or be in regular contact with children, before granting or refusing registration.
We carried out 2,610 registration visits this year. These were to childminder, nursery and pre-school applicants to the EYR, or to CR applicants where we had concerns about suitability.
We also do regulatory visits and telephone calls to make sure that anyone we register continues to be suitable to provide childcare. We carried out 7,230 regulatory events this year. Ninety-four per cent of these were to childminders or nurseries and pre-schools on the EYR.
State of the nation
At year end, we had given 38,000 providers on the EYR (79%) a full inspection. The proportion of providers judged good or outstanding is the same as last year (96%).
Since the introduction of the education inspection framework (EIF) in 2019, the proportion of early years providers judged outstanding has decreased from 20% to 14%. In the same period, the proportion of providers judged good has increased from 76% to 83%.
Table 2: Overall effectiveness of early years providers, over time
| At year end | Total number inspected | % Outstanding | % Good | % Requires improvement | % Inadequate |
|---|---|---|---|---|---|
| 2023 | 38,000 | 14 | 83 | 2 | 1 |
| 2022 | 39,900 | 15 | 82 | 2 | 1 |
| 2021 | 40,900 | 17 | 80 | 2 | 1 |
| 2020 | 43,700 | 17 | 79 | 3 | 1 |
| 2019 | 49,800 | 20 | 76 | 3 | 1 |
Ninety-seven per cent of childminders are good or outstanding compared with 96% of nurseries and pre-schools. However, 16% of nurseries and pre-schools and 18% of childcare on domestic premises are outstanding compared with 12% of childminders.

View data in an accessible data format.
Childcare providers and places
The number of providers on our registers has been falling steadily since 2016.

View data in an accessible data format.
At year end, 1.26 million childcare places were being offered by providers registered on the EYR, down from 1.31 million places in 2019. This decline in places is mostly due to a fall in the number of childminders. On average, childminders offer fewer childcare places than nurseries and pre-schools. This is partly why the number of places has not fallen at the same rate as the number of providers. Alongside this, some nurseries and pre-schools have increased the number of places they offer.
Despite a falling birth rate, there is a shortage of childcare places in many areas, leaving some parents with limited or no childcare.[footnote 4] Local authorities say that the reasons for nursery closures include difficulty recruiting and retaining qualified staff, and rising costs.[footnote 5] Parents also increasingly want weekend, evening and overnight childcare, as well as longer days and greater flexibility. This puts further pressure on places.
The number of local authorities that say that they do not have enough childcare places has increased since 2022. The decline in places has affected sufficiency in different ways. The largest drop in sufficiency was for full-time childcare places. Fewer than half of local authorities say they have enough places for full-time working parents wanting childcare. The number of local authorities with enough places for three- and four-year-olds has also declined significantly for the first time in recent years. The situation for disabled children is even worse, because only 18% of local authorities say they have enough places for disabled children.[footnote 6]
In 2023, the estimated take-up rate of the 15-hour entitlement for two-year-olds increased to 74%, from 72% last year. This is the highest take-up rate since the scheme was introduced in 2015. The take-up rate of 15 hours for three- and four-year olds has also increased to 94%, from 92% last year.[footnote 7]
Childminders
Childminder registration
Childminders offer parents increased choice and flexibility alongside nurseries and pre-schools. We have reviewed the registration process for new childminders and found ways to make it easier and quicker, while still making sure that new childminders are suitable to care for young children. We now pre-book visits with applicants rather than waiting for suitability checks to be complete. Applicants can verify their identity online when doing a Disclosure and Barring Services (DBS) check and we have simplified the health report provided by GPs. We have also reduced the number of personal references that prospective childminders have to provide. An early review of this streamlined process shows that we have reduced the average time it takes to register.
In some cases, the new registration process may not be any quicker than before. This is usually because of delays in receiving external checks or because information in external checks needs further checking before the registration visit. We are pleased to see that the government understands the need to recruit more childminders and that it is also taking steps to make registration easier.[footnote 8]
Childminder agencies
Childminders can register with Ofsted or with a childminder agency (CMA). CMAs help childminders with training, business support, safeguarding and finding new clients. They set their own registration fees and support for their registered childminders. CMAs must make an annual unannounced quality assurance visit to each childminder.[footnote 9]
We register all CMAs. We inspect CMAs that have childminders on roll. There are two possible inspection outcomes: effective and ineffective. At year end, there were seven CMAs and, based on the information they provide, a total of 1,650 childminders registered with them. By year end, we had inspected five CMAs. Four were judged effective. One CMA was judged ineffective due to not meeting its statutory duties.
Childminder characteristics
Childminder numbers have halved in the past 10 years, from 55,300 in 2013 to 27,000 at year end. The number of places offered by childminders has declined, from 238,000 in August 2019 to 166,000 at year end.
For the last decade, the number of childminders registering has been falling and is consistently lower than the number leaving. In 2022–23, 1,700 childminders registered but 5,190 left the profession. The average age of a childminder registering has remained broadly the same across the past five years, at 37 years old. The average age of active childminders has increased, from 46 years old in 2018–19 to 48 years old this year. Childminders who resigned in 2022–23 were registered with Ofsted for an average of 11 years. Of those resigning, 18% left the profession within three years of registration; the majority (58%) were aged under 40.[footnote 10]
The ageing cohort of childminders and a falling number of providers registering with Ofsted mean that the childminding profession is not being replenished at a sufficient rate to sustain itself. Childminders are only one part of the sector, but they give parents choice and flexibility. Any solution to falling childminder numbers will need to increase the number of childminders registering and increase the time they stay in the profession.
There may be barriers to younger childminders joining the profession. We know that childminders are more likely to operate from owner-occupied housing than rented housing. Some prospective childminders who rent may have trouble registering if landlords impose restrictions on how they can use their homes.
Oversight of multiple providers
We define a ‘multiple provider’ as an Ofsted-registered person who owns two or more settings. These settings will also have the same nominated individual. While the number of standalone providers has fallen over time, the number of nurseries and pre-schools that are part of a multiple provider is growing. At year end, 48% of nurseries and pre-schools were owned by a multiple provider.
We inspect and regulate the individual settings multiple providers manage. However, we know that multiple providers strongly influence the education and care in their nurseries and in many cases direct and manage it. Inspection and regulation are most effective and efficient when they take into account how providers operate. This means considering how we might be able to inspect and regulate the structures, systems and processes multiple providers use across their nurseries. This would allow us to hold them to account for the quality of provision across all their settings. This is particularly important when multiple providers acquire new nurseries or pre-schools where there is poor practice. We need to be sure that they have the capacity to maintain quality in their existing settings and to raise the standard of education and care in their new settings.
Safeguarding
Keeping children safe is a vital part of our early years regulation and inspection. This year, 8% of full EYR inspections found safeguarding to be ineffective, compared with 9% last year. Providers judged inadequate or ineffective for safeguarding will be re-inspected within the same year. At year end, there were 24,900 EYR providers that had received a full inspection under the EIF. Of these, 1% were judged ineffective for safeguarding, which is the same proportion of providers judged inadequate overall. The most common reason for an ineffective safeguarding judgement is because staff lack knowledge and understanding of safeguarding policy or procedures, particularly those for reporting and responding to concerns about children.
Building evidence for ‘the best start in life’
We are seeing an impact of the EIF on early years provision, particularly around curriculum intent. Providers are increasingly able to talk confidently about what they want children to know and be able to do. To build on this important progress, and to develop practitioners and leaders’ knowledge and confidence around curriculum even further, we are focused on building evidence for ‘the best start in life’.
This year, we have published two reports that highlight what children need for the best start in life. Our international perspectives on early years report reflects on where England sits in an international early years context.[footnote 11] Approaches to early education and care, and the age at which children start compulsory school, vary but the report shows there are common challenges and policies that shape the education and care of pre-school children in England and other European nations.
Part two of our early education research review describes what a high-quality early education curriculum looks like.[footnote 12] It covers the three early years foundation stage (EYFS) prime areas of learning:
- communication and language
- physical development
- personal, social and emotional development.
These areas are crucial to children’s early learning and their later success in education and life. They underpin learning in other areas of the early years curriculum and prepare children for the curriculum in primary and secondary schools.
The review highlights the importance of a well-planned and structured curriculum, so that practitioners understand what they want children to know and be able to do. It also emphasises the importance of high-quality interactions between practitioners and children. These are more likely to happen when practitioners recognise what young children know and can do and understand what they want them to learn.
Part three, which we plan to publish later this year, will look at the four specific areas of learning:
- literacy
- mathematics
- understanding the world
- expressive arts and design.
Workforce challenges
Last year, we described the recruitment and retention challenges facing providers, and we are still seeing a growing shortage of qualified and experienced early years staff. In nurseries and pre-schools, one in five staff has no relevant Early Years (EY) qualification, and the proportion of unqualified staff has increased from 16% in 2020 to 21% this year. This is largely due to a decline in the proportion of staff with relevant EY level 3 qualifications, from 65% in 2021 to 61% in 2023. The proportion with a graduate-level qualification or a relevant EY level 2 has remained stable over the same period.[footnote 13]
Our international perspectives report shows that many European nations are facing similar workforce problems.[footnote 14] The challenges of recruiting qualified staff before COVID-19 were exacerbated by the pandemic and continue to get worse. There are many reasons why the sector continues to lose experienced staff, including low wages, perceived low status, poor working conditions and limited opportunities for professional development. The early years sector is competing with, and losing out to, higher paid or more flexible employment.
The shortage of experienced and qualified staff can affect the quality of children’s learning and the training and support that settings can give to less experienced practitioners. On inspection, we found that providers often have to use agency staff to maintain required ratios. This means that children may not have a consistent key person who knows them and understands their needs. Some providers have scaled down their provision, reducing the number of children they can care for.
The proportion of inspections that resulted in good or outstanding judgements this year shows that many providers are doing a good job of managing the workforce challenges. However, if experienced and qualified staff continue to leave, this may have a detrimental effect on quality in the future.
Early years apprenticeships
Good apprenticeships may be part of the solution to sector recruitment problems. However, this will depend on the number of apprentices and the quality of their training. The quality of training and support for apprentices is not consistent between providers. Apprentices can work in any nursery or pre-school regardless of its quality or inspection grade. This means that they may not always see and learn from good practice.
There are good and outstanding nurseries and pre-schools that value apprentices and support and nurture them. We have seen how good leadership ensures high-quality training and supervision for apprentices. In these providers, apprentices see and learn from good practice. However, in some providers, workforce challenges and financial pressures lead to apprentices being used as key staff to make up ratios, replacing roles previously filled by skilled, experienced staff. We have seen how some settings are employing several apprentices to fill staffing gaps. A high proportion of inexperienced and unqualified staff can have a big impact on the quality of provision.
Apprentices are entitled to 20% off-the-job training, provided by employers or in college. However, many settings are so reliant on apprentices that they do not always release them for college. This can delay or disrupt apprentice training. Using apprentices to fill staffing gaps or make up ratios may seem like a short-term fix, but it cannot be a long-term solution. It is not fair to children or to apprentices. Using apprentices in this way is also against funding rules.
We are pleased to see that revisions to the Early Years Educator (EYE) level 3 assessment criteria include a focus on the importance of the curriculum. The criteria set out the minimum a qualified EYE should know, understand and be able to do. This is the first update to the level 3 criteria since 2013. The revised criteria make sure that practitioners can:
- plan and provide effective early years education that enables children to progress
- support children with SEND
- keep children safe and healthy
- work closely with colleagues and other professionals.
We hope these revisions will help those entering the profession to understand the importance of all children getting the best start. They will be used from September 2024.
SEND in the early years
The number of children under five given a new education, health and care (EHC) plan in 2022 was 16,500, an increase of 15% compared with 2021, on top of an increase of 8% the previous year.[footnote 15] Nearly a quarter of all new EHC plans in 2022 were for children under five. On inspection this year, we also saw an increase in demand for special educational needs and/or disabilities (SEND) provision. Settings are adapting their curriculum and providing additional support for more children than in the past. However, staffing issues mean that many settings have practitioners with limited SEND experience or training.
Last year, providers told us about the impact of the pandemic on children’s language and communication development. This is a continuing concern – children are still starting in settings behind in this area. Practitioners have noticed that some children know fewer words or lack the confidence to speak.
Children have had to wait longer than pre-pandemic for help from external services such as speech and language therapists and educational psychologists. However, additional early support can help children keep up with their peers rather than fall further behind. Providers are increasingly having to find ways to provide the additional help children need themselves while they wait for external services. This can mean adapting the curriculum to focus more explicitly on communication and language.
Some of the best settings and local authorities are training staff in how to support children who need extra help. Many are introducing additional small group and one-to-one interventions and have a strong curriculum focus on communication. Other providers have recruited SEND practitioners or additional staff to support children with high needs.
However, these types of actions are often only possible for nurseries with big enough budgets and enough staff. We know that many settings are finding it difficult to meet children’s needs because of staff shortages, particularly a lack of qualified and experienced staff. Local authorities are also struggling to meet increased demand for support from settings.
Children in the early years learn the social and emotional behaviours that will help them in primary school and beyond. Practitioners tell us they still see the impact of the pandemic on children’s behaviour and social skills. We see how some children are still having a real problem with a lack of vocabulary. This can mean they find it hard to express their feelings and needs, which can in turn lead to behaviour issues. It is becoming more common for EY staff to systematically teach children how to share and take turns for example. In settings with a well-structured curriculum for behaviour, carefully planned activities and explicit teaching make sure that children learn how to manage their own behaviour.
Schools
In 2019, the EIF refocused inspection on a new evidence-based conception of high-quality education. We communicate this through our published research and inspection handbooks. We created a new quality of education judgement that has curriculum at the centre. This included looking at what children have learned and how performance outcomes are being achieved. The EIF also brought in separate judgements for behaviour and attitudes and personal development.
This change of focus is encouraging schools to develop and prioritise their curriculum.
Our research visits this year suggest a broadly improving picture across many subjects. Most schools offer a broad and ambitious curriculum. Foundation subjects, which have previously been given limited attention, are increasingly valued by schools – leaders are giving subjects such as geography, history, art and design more curriculum time. In many schools, the curriculum is building pupils’ knowledge and skills carefully over time. The teaching of reading is generally strong.
We remain concerned, however, about behavioural issues. Our research suggests that pupil behaviour has worsened in many schools since the pandemic. Persistent disruptive behaviour can harm learning and the wider school experience for many pupils. In the latest statistics, it accounted for nearly half the reasons recorded for suspensions.
Children’s experience of school and their potential future outcomes are also being limited by too many pupils not attending school often enough. Overall absence and persistent and severe absences are all too high. The reasons are complex, and schools are working hard with children and families to overcome the obstacles. Some schools are struggling to cope with these challenges.
State-funded schools
What we did this year
This year, we carried out 7,240 inspections of state-funded schools (see annex for data definitions). This is a substantial increase from 4,670 in 2021/22 and is the highest number of inspections we have completed in the last five years. This is largely because, this year, the DfE gave Ofsted additional funding to catch up on the inspections we missed during the COVID-19 pandemic, and to inspect all schools at least once between April 2021 and August 2025. This year, we carried out 3,720 graded inspections, 3,260 ungraded inspections of good and outstanding schools and 260 urgent or monitoring inspections.[footnote 16]
Of the graded and ungraded inspections, 88% of schools were judged good or outstanding for overall effectiveness. Ninety per cent of previously good schools remained good or improved to outstanding, 75% of schools that previously required improvement improved to good or outstanding and 97% of previously inadequate schools improved.
Table 3: Overall effectiveness of state-funded schools this year, by previous overall effectiveness
| Previous overall effectiveness | Total number of inspections | % Outstanding or remains outstanding at an ungraded inspection | % Good or remains good at an ungraded inspection | % Requires improvement | % Inadequate |
|---|---|---|---|---|---|
| Outstanding | 930 | 51 | 41 | 7 | 1 |
| Good | 4,890 | 2 | 88 | 8 | 2 |
| Requires improvement | 760 | 1 | 74 | 22 | 4 |
| Inadequate | 270 | 1 | 66 | 30 | 3 |
| Not previously inspected | 120 | 19 | 71 | 9 | 1 |
| Total | 6,980 | 9 | 79 | 10 | 2 |
The DfE can intervene in underperforming schools, for example by placing them in a strong multi-academy trust. Since September 2022, this policy applies to all inadequate schools and to schools that require improvement and after having required improvement or been judged inadequate at their previous inspection. The number of schools eligible for intervention has decreased to 1,340 (6% of all schools) at year end from 1,610 at the end of last year.
In graded inspections, we make four key judgements, along with the overall effectiveness judgement. We also judge early years and sixth-form provision where relevant. This year, outcomes for quality of education in these inspections were very similar to those for overall effectiveness. Outcomes for behaviour and attitudes were noticeably more positive. The behaviour and attitudes judgement evaluates a school’s work to teach and improve behaviour, and takes into consideration the context and challenges that schools have as well as the strategic plan of action, or track record of improvement that demonstrates leaders’ capacity to improve behaviour. However, we recognise post-Covid concerns about pupil behaviour and are carrying out research in this area. This is discussed in more detail in the behaviour section. Outcomes for personal development were also more positive than other judgements this year.

View data in an accessible data format.
As in previous years, primary schools achieved higher grades than secondary schools for all key judgements.[footnote 17] The biggest difference between primary and secondary continues to be for behaviour and attitudes (93% good or outstanding in primary, 76% in secondary).
This year, we have continued our analysis of the relationship between school performance data at key stage 2 and key stage 4, and their inspection outcomes.[footnote 18] Exam and test results from 2020 and 2021 were withheld by the DfE and so could not be used on inspection, but since October 2022, inspectors have once again had access to the latest performance data in primary schools, and since November 2022 for secondary schools. There continues to be good alignment between the data and the inspection grades.[footnote 19]
State of the nation
Overall, 89% of schools were judged good or outstanding at their most recent graded inspection. This is a slight increase from 88% last year. Within this, the proportion of schools judged outstanding has decreased from 18% to 16%, whereas the percentage judged good has increased from 70% to 73%. This shift is due to many formerly outstanding schools not retaining that grade when reinspected (see Figure 6).
There have been slight increases in the proportion of good or outstanding in both primary and secondary schools: now 90% and 82%, respectively.

View data in an accessible data format.
Looking back over a longer period, the proportion of schools that are good or outstanding now (89%) is slightly higher than before the pandemic and the start of EIF (86% in August 2019).
Inspections of previously exempt outstanding schools
From 2012 to 2020, primary and secondary schools graded outstanding were exempted by law from routine inspection. When the exemption ended, most outstanding schools had not been inspected under either our current framework (with its new key judgements and more emphasis on the curriculum) or our previous inspection framework. This made it difficult to know how much schools changed during the time they were exempt, and when any decline may have happened.
Following the lifting of the exemption, we began re-inspecting these schools in 2021, normally with graded inspections for those last inspected before September 2015 and ungraded inspections for the remainder. Over a third of the schools that were outstanding when the exemption ended have now been inspected.
Thirty-eight per cent of previously outstanding schools retained their outstanding grade at their subsequent graded or an ungraded inspection since September 2021.[footnote 20] Nineteen per cent of those that had a graded inspection remained outstanding. Twenty-eight per cent of secondary schools remained outstanding, and 15% of primary schools remained outstanding.
This year, the proportion of previously exempt primary schools remaining outstanding at a graded inspection has increased to 16% compared with 14% last year, whereas the proportion of secondary schools remaining outstanding has increased from 24% to 31%.

View data in an accessible data format.
Ungraded inspections do not change an overall effectiveness grade, but the inspection can conclude that the school might no longer be outstanding if a graded inspection took place (in which case one will follow around a year later).
Since September 2021, we have carried out 290 ungraded inspections of previously exempt schools and concluded that 51% of them may no longer be outstanding (40% of secondary schools, and 54% of primary schools).
Re-inspection of previously exempt schools has led to a net reduction in the overall proportion of outstanding schools, which has fallen from 19% in 2021 to 16%.
Overall, around 760 previously exempt schools are no longer outstanding since the exemption was lifted. On the other hand, in the same period, over 160 schools that were not outstanding when the exemption was lifted have been graded outstanding.
Curriculum
After a gap of some years, we have revived our thematic reports on school curriculum. Along with the curriculum research reviews, these are helping to inform inspector training and supporting school curriculum, teaching and assessment. They are also providing clarity for policymakers about system strengths and weaknesses and informing wider debate.
The breadth of the curriculum
Most schools offer a broad and ambitious curriculum. The research informing the EIF, including findings from our previous subject reports under earlier frameworks, raised concerns about the narrowing of the curriculum.[footnote 21] Our new subject reports this year show a broadly improving picture in most, but not all, subjects:
- schools place a higher value on the subjects in the curriculum beyond English, mathematics and science than was the case at the time of our previous subject reports. The status of many foundation subjects has improved since our previous subject reports. In many cases, leaders ensure more time for teaching subjects such as geography, history and art and design. At the same time, they improve planning for these subjects. They identify what knowledge and skills pupils need and design their curriculums to build these over time. The quality of subject teaching is improving because schools think carefully about what to include in their curriculum
- in most schools, pupils study a wide range of subjects for as long as possible.
However, some subjects still do not receive the attention they deserve:
- in many secondary schools, pupils do not benefit from a broad and ambitious music curriculum. In physical education (PE), pupils typically experience a broad range of activities. However, schools do not always ensure that these contribute enough to developing pupils’ knowledge and skills
- in too many primary and secondary schools, the religious education (RE) that pupils receive is of a poor quality and not fit for purpose, leaving pupils ill-equipped for some of the complexities of contemporary society.
Curriculum quality
In most schools, the curriculum is effective in developing pupils’ knowledge and skills over time. We found that:
- most schools clearly specify the knowledge and skills that pupils need at each stage of their education
- schools are increasingly aware of the importance of pupils’ prior knowledge in deciding what pupils should be able to learn and do
- many schools make sure that pupils’ knowledge of important content, concepts and skills is secure so that they can access increasingly complex learning.
In some schools, pupils develop detailed knowledge of the topics studied. They remember this content in the long-term, and this knowledge allows them to learn increasingly complex content. However, the depth and security of pupils’ knowledge varies between schools. In some schools, pupils’ knowledge is less detailed, less securely remembered or more disconnected.
Typically, pupils’ knowledge is weaker in schools where:
- curriculum planning is superficial and does not identify how teaching can build pupils’ knowledge and skills sequentially
- teaching does not focus enough on securing the most important knowledge and skills for all pupils
- pupils are asked to complete tasks or answer questions without having secured the knowledge they needed to do this meaningfully
- assessment does not identify important gaps or misconceptions in pupils’ knowledge
- schools do not have an accurate understanding of the impact of the curriculum. In too many schools, quality assurance is focused on surface features of curriculum, teaching or assessment. Too often, it does not evaluate how well pupils are learning the curriculum.
Our subject reports identify some weaknesses in areas of the curriculum and in different phases of education. We found that:
- curriculum planning and teaching at key stage 1 does not always lay the foundations for future study as well as it could. Beyond reading and mathematics, schools do not always plan content with a view to how it might be used in future phases of education
- in some schools, external testing continues to drive curriculum decisions in unhelpful ways. For example, at key stage 2, reading comprehension in some schools is narrowly focused on SATS-style questions. Similarly, in some secondary schools, key stage 3 content directly duplicates exam specifications and teaching focuses excessively or prematurely on exam-specific techniques. This is an example of exams influencing curriculum decisions too early
- in all phases of education, support for pupils with SEND is too variable. In some schools, teachers focus too heavily on adapting activities so that pupils can complete the immediate task, for example by providing sentence starters. However, they do not consider how they could address gaps in those pupils’ knowledge or skills to enable them to learn increasingly complex content.
Subject education
Our subject reports highlight general improvements in most subjects. Some of our findings are summarised below. Across subjects, we found greater weaknesses in English, music and PE, and extensive weaknesses in RE.
In the coming months, we plan to publish subject reports in English, personal development, RE, art and design, computing and languages.
English
In English, the teaching of reading has improved markedly, but teaching in other areas, such as writing and spoken language, is less effective. We found that:
- schools give pupils a broad reading curriculum that includes a range of genres and styles
- most schools have not developed a well-sequenced curriculum for spoken language and writing
- particularly in writing, pupils are often not given enough time to practise to the point that they are fluent
- schools move too early to complex tasks before teaching pupils the underlying knowledge needed for those tasks and making sure that this knowledge is secure
- assessment is too focused on complex, final tasks and does not identify specific gaps in pupils’ knowledge.
To achieve a similar standard to reading, schools would benefit from further guidance and training about how to plan curriculum and teach writing, speaking and listening effectively.
Reading
The teaching of reading is strong. We found that in most schools, pupils learn to read fluently. Reasons for this include that:
- leaders prioritise reading in the curriculum and plan how to develop pupils’ love of reading
- schools invest in training staff, so that teaching is high quality
- schools have well-designed curriculums in place to develop pupils’ reading.
Successful approaches to teaching reading are particularly well-embedded in primary schools but are also developing in secondary schools. However, in some secondary schools, not enough is done to help weaker readers catch up with their peers:
- not all secondary schools address gaps for the weakest readers. In some cases, schools are too slow to identify these gaps or do not identify them at all
- some secondary schools do not take into account how weaknesses in reading, such as a lack of vocabulary, prevent pupils from accessing the breadth of the school curriculum.
Geography
Geography education has improved, but pupils’ knowledge does not connect across topics as much as it should.[footnote 22] We found that:
- at key stages 1 and 2, schools have not always considered how pupils’ knowledge would build between units
- at key stage 3, most schools have carefully selected and sequenced content within, but not between, sections of the curriculum
- in some schools at key stage 4, the breadth of the curriculum is limited to a narrow interpretation of examination specifications
- some schools carefully designed the curriculum so that pupils learn about particular places in different contexts, helping them to develop a rich knowledge of place
- not enough thought has been given to how pupils would be taught explicitly to develop their knowledge of fieldwork.
To improve geography education further, schools should ensure that the curriculum and teaching build pupils’ knowledge over time, so that pupils can learn the connections that exist between different parts of the geography curriculum.
History
History education has improved significantly over the past 10 years, particularly in primary schools.[footnote 23] We found the following strengths:
- schools have given careful thought to the breadth of the curriculum
- teaching is often effective, especially where teachers use stories and examples skilfully to help pupils make sense of content about the past.
We also found some specific areas of weaknesses in history education:
- the quality of assessment varies significantly between schools
- the teaching of disciplinary knowledge is typically weak, and often leaves pupils with misconceptions about the work of historians.
To improve history education further, schools need to make sure that assessment allows teachers to make accurate judgements about the quality of pupils’ historical knowledge and to identify and address any gaps. Schools also need further guidance and training, for example from subject associations, on how to develop pupils’ disciplinary knowledge in history.
Mathematics
Most schools build pupils’ mathematical knowledge effectively over time.[footnote 24] We found an encouraging picture of mathematics when we visited schools:
- pupils in most schools experience a carefully designed curriculum where learning is broken down into small steps
- teachers generally explain new content clearly and check pupils’ understanding regularly, addressing any gaps
- teachers benefit from high-quality support and guidance through professional associations.
Our visits also highlighted two areas in which mathematics needs to improve:
- in some schools, teachers do not give pupils adequate opportunities to practise fluency in their mathematical knowledge
- secondary schools do not always teach problem-solving effectively enough so that pupils’ knowledge is secure.
Schools would benefit from further guidance and training in these areas.

Music
Music teaching in primary schools has improved.[footnote 25] Many pupils now have regular opportunities to learn music. However, in many secondary schools, leaders do not ensure enough time for the teaching of high-quality music. We found that:
- in almost all schools, teaching in Reception prepares children well to learn music in key stage 1
- the teaching of singing in primary schools is strong.
However, weaknesses include the following:
- teaching at key stages 1, 2 and 3 often focuses on covering activities, rather than on making sure that pupils have learned content to a high standard
- key stage 3 music is mostly taught in isolated blocks of time and the amount of time allocated to it varies considerably
- the development of pupils’ singing and vocal work in secondary schools is far rarer than in primary schools
- the weakest aspect is the development of pupils’ composition. Very few schools think about how to build the knowledge that pupils need to learn in order to construct and deconstruct music.
In schools, music often enriches pupils’ education beyond timetabled lessons. Many schools reported that COVID-19 and budgetary pressures have had a significant impact on extracurricular music. We found that:
- many schools have a strong extracurricular offer, including instrumental groups and choirs
- the divide between the opportunities for children and young people whose families can afford to pay for music tuition and those who cannot still exists. Many school leaders say that the pressures on school budgets means that they will no longer subsidise instrumental lessons for pupils.
Personal development, including personal, social, health and economic education and citizenship
Schools are doing a lot of effective work in the area of personal development, but it is, too often, not as coherent as it could be.
We found that schools place a high value on pupils’ personal development and have ensured sufficient provision for each of the wide-ranging elements of personal development. In particular, the work to develop pupils’ self-esteem, confidence and independence in primary schools is high quality. However:
- in many schools, different parts of the curriculum are too isolated and not as well-connected to other content as they should be. For this reason, pupils’ knowledge does not build over time
- in personal, social, health and economic (PSHE) education and citizenship, some schools do not identify what pupils need to know and be able to do
- in secondary schools, pupils have limited opportunities to take on additional responsibilities, such as pupil leadership roles on the school council
- the curriculum offer in citizenship in secondary schools does not typically match the scope and ambition of the national curriculum
- across primary and secondary schools, assessment practices are not fit for purpose
- too many schools do not prioritise this curriculum area enough and give leaders time to fulfil the demands of their roles
- teachers do not receive enough professional development to give them sufficient expertise to teach subjects such as PSHE and citizenship well.
Physical education
The PE curriculum is, too often, a ‘buffet’ of activities that do not build pupils’ knowledge and skills over time.[footnote 26] We found that:
- most schools make enough time for a broad and ambitious curriculum to be taught
- in some cases, schools carefully consider the knowledge and skills which pupils needed to develop, and prioritise appropriate activities
- in some schools, children in Reception benefit from high-quality support to develop safe, efficient and effective movement.
However, the curriculum in many schools lacks coherence. This is because schools often provide a wide range of activities without considering carefully enough what pupils should learn through them. Too many schools do not make good enough use of the time they have, both outside and inside the classroom, to ensure that pupils develop their expertise in PE, not simply experience an assortment of activities.
In many schools, the curriculum for PE does not match the breadth and ambition of the national curriculum. In a majority of schools, the teaching of dance and adventurous outdoor activity was very limited or ineffective.
Religious education
RE in schools is generally of poor quality. Although it is a statutory subject, schools often consider RE as an afterthought. As a subject on the curriculum, it is under-valued. RE is a complex subject, and the lack of clarity and support from government makes schools’ job harder.
Some schools steer through these challenges well, but most do not. We found that:
- many schools do not meet the statutory requirement to teach RE at all stages
- pupils are rarely taught enough substance to prepare them to engage in a complex, multi-religious and multi-secular society (where religion and non-religion play different parts in different people’s lives)
- too often, schools do not teach topics in the RE curriculum deeply enough for pupils to develop a substantial understanding of the subject matter
- non-examined RE is typically not high quality.
All pupils should develop a broad and secure knowledge of the complexity of religious and non-religious traditions. It will take coordinated effort by stakeholders to improve the quality of RE in schools:
- schools need high-quality professional development to teach RE well
- curriculum publishers need to identify clearly what pupils will learn and when, building on knowledge over time, so that pupils develop a deep knowledge of the chosen religious and non-religious traditions
- the government should provide clear expectations about RE provision in schools. Schools should follow these. Current non-statutory guidance for RE should be updated and include clear information for schools about the breadth and depth of the syllabus they are expected to teach.
Science
Science education in schools is typically high-quality, although there is more to do to build pupils’ knowledge of ‘working scientifically’.[footnote 27] Through our visits to schools, we found that:
- most pupils experience a broad and ambitious curriculum
- most pupils are taught by teachers with secure knowledge of scientific content
- in some schools, teachers identify and address common misconceptions, although this is not done consistently across schools
- some schools do not think about how pupils’ knowledge connects between different phases of their education well enough
- the teaching of knowledge relating to working scientifically is generally weak in both primary and secondary schools.
Tutoring
This year, the DfE made changes to simplify the national tutoring programme (NTP). It also commissioned Ofsted research on the quality of tutoring in schools, and on how well schools have integrated tutoring into curriculum planning and delivery.[footnote 28]
Effective tutoring reflects the available research evidence: for example, it has small group sizes and is delivered frequently and consistently. It also links closely with the school curriculum and supports pupils from the earliest stages of education to address learning gaps. However, in most schools, tutoring is used mainly for external tests and exams, for example Year 11 GCSE intervention.
In some schools, there is a fundamental misunderstanding of what tutoring is. Tutors are essentially teaching class content with smaller groups, rather than taking approaches that identify pupils’ knowledge gaps.
Tutor quality was an important success factor: schools prefer tutors with qualified teacher status (QTS) over other tutors, and generally tutoring sessions were of higher quality when delivered by tutors with QTS.
Careers
Schools are expected to provide effective careers education, information, advice and guidance. This year, we reviewed careers education to explore how schools are doing this.[footnote 29]
In most schools, careers guidance is a strategic priority. In half of the schools visited, pupils are receiving unbiased guidance from their school, with pupils encouraged to find the most suitable route and provider that is genuinely good for them. However, in schools where practice is weak, this is most often due to a lack of strategic planning.
We found that the main barriers to high-quality careers provision are time and resources. In some schools, there are gaps in teachers’ knowledge of apprenticeships and T-levels. Pupils’ awareness and understanding of technical and vocational pathways is also generally variable. Staff teaching careers often do not have any specific training in careers education or guidance.
In schools where careers education works well, schools have built the careers programme into curriculum plans and joined up the work of all staff including leaders, careers specialists, PSHE teachers and special educational needs and disabilities coordinators (SENDCos). The careers programmes also builds pupils’ knowledge of the world of work and future career options over time.
Attendance
Far too many children are missing school far too often and schools are struggling to reverse this trend. This is likely to have a significant effect on children’s progress and outcomes.
The main reason recorded for pupil absences is illness. In autumn 2022, 24% of pupils were persistently absent and missed 10% of sessions. This is a huge increase from 13% in autumn 2019.[footnote 30] Children whose attendance was worst before the pandemic are most affected, such as those with SEND. Persistent absence is even higher for children with special needs (33% for those with SEN support and 38% for pupils with EHC plans). The proportion of pupils classed as severely absent (missing 50% of sessions) was 1.7%, rising to 3.2% for pupils with SEN support and 5.4% for pupils with EHC plans. Pupil anxiety and other mental health problems have increased. Separately, secondary schools are noticing more absences than normal on Mondays and Fridays.
In some cases, the pandemic has led to understandable heightened parental anxiety about whether children should attend school when mildly unwell. We welcome the recent guidance from the Chief Medical Officer as to when children should and should not be in school, in his recent letter to schools:[footnote 31]
It is usually appropriate for parents and carers to send their children to school with…general cold symptoms: a minor cough, runny nose or sore throat. However, children should not be sent to school if they have a temperature of 38°C or above.
Schools should use this guidance as a basis to continue to have strong communication and collaboration with parents and with pupils about the importance of attendance. This includes:
- honest and supportive conversations with families
- helping pupils overcome obstacles that prevent their attendance, such as anxieties
- repeating positively framed messages in assemblies and newsletters.[footnote 32]
Schools operate in different contexts, and we always take account of that. Reversing some of the impact that the pandemic has had on attendance will take time. Inspectors are therefore focusing on what it is that schools are doing, not just the levels of attendance they are achieving. Where attendance is a high priority and improvements are being secured and sustained, inspectors are recognising the effective work of schools.
Part-time timetables
Inspections are showing more and more pupils spending part of their week outside education, and the list of reasons for part-time timetables is lengthening. Schools are using part-time timetables for medical reasons while waiting for child and adolescent mental health service (CAMHS) assessments due to ‘school refusal’ or ‘emotionally based school avoidance’ or due to a pupil’s SEND.
Some of this practice is contrary to DfE attendance guidance, which states that part-time timetables should only be used in exceptional circumstances. They should never as a sanction for poor behaviour, and only ever on a strictly temporary basis. The more education a child misses, the harder it is for them to catch up. For this reason, we are concerned about the increase in part-time timetables.
Pupil movement
One function of inspection is to highlight when schools are making decisions that are not in the best interest of pupils. Since 2018, we expressed concern about exceptional levels of pupil movement. This may be an indication that the school is ‘off-rolling’ pupils, which we investigate on inspection.[footnote 33] While this is still a concern, the number of schools with exceptional levels of pupil movements between Years 10 and 11 has declined, with 110 schools identified compared with 160 in 2021 and 320 in 2020. Off-rolling has not been a significant issue in our inspections this year either.
However, the pandemic has confused the picture around pupil movements. While the measures we use to identify concerns about off-rolling have moved in the right direction, this does not necessarily mean the problem has gone away. If schools are off-rolling fewer pupils than before, this may be because pupils are attending school less.
Behaviour
Since the pandemic, pupils and teachers are seeing more disruptive behaviour in school. This is affecting both their experience of school and their ability to learn or teach. This is especially true of persistent low-level disruption in class, such as pupils refusing to do as they are told, talking back to teachers or using social media in class. Some kinds of poor behaviour happen more in secondary schools, such as internal truancy, vandalism of school property, bullying, harassment or derogatory language and behaviours.
The top three reasons for both suspensions and permanent exclusions in secondary schools are:[footnote 34],[footnote 35]
- persistent disruptive behaviour
- physical assault against a pupil
- verbal abuse or threatening behaviour against an adult.
Together, these account for three quarters of reasons given for suspensions and two thirds of all exclusions.[footnote 36]
The DfE’s national behaviour survey reported that teachers in primary and secondary schools lost around one fifth of teaching time to managing behaviour.[footnote 37]
We have a research strand on behaviour which we will be reporting on early next year. Preliminary findings from work to date show that the main barriers to schools achieving consistently positive behaviour are:
- lack of parental support and, in particular, less parental support than before the pandemic
- the ongoing legacy of the pandemic, including the impact of children’s limited interaction with others. This can present schools with different types of challenges, including dealing with lower academic achievement, as well as personal challenges for pupils such as loneliness
- poor curriculum provision that is inappropriately adjusted to what pupils know and can do. This includes failing to identify pupils’ special educational needs or, having identified them, failing to take these into account
- not teaching, modelling and reinforcing what positive behaviour looks like and/or low expectations of pupils’ behaviour
- failing to manage ordinary pupil anxiety or, more rarely, not helping pupils to access support for more serious mental health needs
- lack of access to other external services or support.
Schools are, however, taking steps to improve behaviour. Our research highlights a number of effective strategies, including:
- explicit teaching of desired behaviours
- high consistency across the school in managing behaviour
- making sure that parents and pupils understand the school’s culture and expectations, as well as specific rules for behaviour.
Even though schools report deteriorating pupil behaviour since the pandemic, inspection judgements for behaviour and attitudes show a largely positive picture in schools: of the 3,720 schools given a graded inspection this year, 73% were judged good and 17% outstanding on behaviour and attitudes (see Figure 4). This shows that many schools are rising to the challenges they are facing. We recognise the context and the challenges and take schools’ actions to address these challenges into account on inspection.
However, the picture is very different between primary and secondary schools. Ninety-three per cent of primary schools were judged good or outstanding for behaviour and attitudes compared with 76% of secondary schools. To an extent, this reflects the higher grades seen in primary schools more generally and across all judgements. However, it is striking that in primary schools, behaviour and attitudes is often judged more positively than overall effectiveness, whereas in secondary schools the two judgements are more often aligned.

View data in an accessible data format.

Safeguarding
Keeping children safe is a critical part of what schools do. The vast majority of schools do it well: of all schools we inspected this year, 99% had effective arrangements for safeguarding.[footnote 38]
Safeguarding is sometimes mis-characterised as an exercise in paperwork – but it is so much more than that. It is about the culture a school creates to keep its pupils safe so that they can benefit fully from all that schooling offers. A positive and open safeguarding culture puts pupils’ interests first. Everyone who works with children is vigilant in identifying risks and reporting concerns. It is also about working openly and transparently with parents, local authorities and other stakeholders to protect pupils from serious harm, both online and offline and about taking prompt and proportionate action.
This relies on schools making sure that staff who work with children benefit from continued training, communicate effectively about safeguarding matters and cross-check each other’s work. All staff should feel empowered to act if they have concerns.
It is rare that schools have ineffective safeguarding without having other significant problems. Only six state-funded schools inspected this year had ineffective safeguarding but no other significant issues. Nearly all schools with ineffective safeguarding would have been judged requires improvement or inadequate even if safeguarding had not been ineffective.[footnote 39]
In the rare cases where schools are judged inadequate only because of ineffective safeguarding, they are often able, through focused work, to deal with the issues relatively quickly. We have recently announced that we will return to all schools judged inadequate due to safeguarding alone within 3 months of publishing their inspection report.
This year, we carried out 110 graded inspections of schools that had ineffective safeguarding at their previous inspection. All but one of these schools have now been found to have effective safeguarding.
Academy trusts
Nearly half (47%) of schools are now academies and free schools, including 41% of primary schools and 81% of secondary schools. The number of schools that are part of a multi-academy trust (MAT) has increased from 7,680 to 9,100 in the past three years.[footnote 40] The typical MAT has grown from seven schools to eight.
Multi-academy trust summary evaluations
The trust landscape has evolved greatly, especially in the last five years, and continues to be a developing picture. Around half of all pupils in England now attend a school that is part of a MAT.
As a result of this rapid expansion, we know that decisions about children’s education are increasingly being made at trust level. While we continue to try to reflect the increasing role that trusts play in education (through, for example, engagement with trust leaders in our schools inspections), Ofsted’s inspection system does not now fit how the school sector operates and this can cause frustration for trusts. However, we look to provide transparency and accountability on how decisions are made at trust level wherever possible, and the impact they have on their schools, and to give better information to parents about the way trusts operate.
Our recent research supports this ambition.[footnote 41] We found that trust leaders agreed that inspection only of individual schools neither sufficiently credits trusts for their work nor holds the trust sufficiently accountable when things are not right. We intend to continue to work to maximise our knowledge and understanding of the sector.
We do evaluate some trusts though our multi-academy trust summary evaluations (MATSEs), but we are only able to carry out a limited number of MATSEs each year. MATSEs are visits undertaken with the cooperation and consent of the trust. They do not result in graded judgements. The MATSEs draw on EIF themes to look at a MAT’s strengths and areas for improvement.
This year we carried out 12 MATSEs.[footnote 42] The findings have been broadly positive, showing common themes and the different approaches trusts take to secure improvement in their academies.
Many trusts have a centrally planned curriculum and/or a centralised approach to some policies such as behaviour, attendance, safeguarding and human resources. Other trusts offer school leaders some discretion to adapt curriculums and some policies to the local context.
We found that safeguarding was a strength in all the trusts visited this year. Trust leaders, trustees and local governors rightly prioritise safeguarding and maintain effective oversight to assure themselves of safeguarding arrangements within their schools.
Other strengths identified included trusts having strong and well-established leadership, a vision and strategy for their schools and an ambition for all pupils to receive a high-quality education and secure the best outcomes they can.
We saw evidence of trusts reflecting and finding new ways to improve, for example by working with other trusts to share good practice.
There were some common themes for improvement, including making sure that local governing bodies (LGBs) understand their delegated roles and responsibilities. This included the need for clear lines of delegation and training.
In some trusts, further work is needed to monitor and improve pupil behaviour and attendance.
Non-association independent schools
There are around 2,420 independent schools in England. About half of these belong to an association and are inspected by the Independent Schools Inspectorate (ISI). Ofsted inspects the remaining (non-association) independent schools. In this section, we refer to them as ‘independent schools’ for simplicity.
We inspect around 1,150 independent schools, which can be broadly divided into three groups:
- independent special schools, which make up nearly three-fifths of the independent schools Ofsted inspects[footnote 43]
- independent faith schools, which make up a fifth[footnote 44]
- other independent schools (that is, independent schools that have no declared religious character or ethos and are not special schools).
Independent schools are inspected against the independent school standards (ISS). We carry out standard inspections on a three-year inspection cycle.[footnote 45] In a standard inspection, we also make a graded judgement under the EIF. The DfE commissions several kinds of additional inspections, including emergency inspections and progress monitoring inspections.
What we did this year
This year, we carried out around 820 inspections that comprised 410 standard inspections and 410 additional inspections (see annex for data definitions). We also evaluated around 200 independent school action plans at the DfE’s request.
Of the standard inspections:
- 88 were of schools that have not previously been inspected
- 330 were of schools that had a previous inspection
- 40 were previously judged outstanding. Of these, 22 remained outstanding, 14 were judged good, two were judged requires improvement and two were judged inadequate.
Of the additional inspections:
- 140 were progress monitoring inspections of schools that had previously not met one or more of the ISS. Of these, just over half failed to meet the standards that were checked
- 28 were emergency inspections to follow up complaints or concerns about a school. Of these, 11 schools failed to meet the standards that were checked
- the remaining were for pre-registration and material changes to the registration.
Table 4: Overall effectiveness of non-association independent schools this year, by previous overall effectiveness
| Previous overall effectiveness | Total number of inspections | % Outstanding | % Good | % Requires improvement | % Inadequate |
|---|---|---|---|---|---|
| Outstanding | 40 | 55 | 35 | 5 | 5 |
| Good | 190 | 6 | 63 | 16 | 14 |
| Requires improvement | 68 | 1 | 60 | 25 | 13 |
| Inadequate | 31 | 0 | 35 | 35 | 29 |
| Not previously inspected | 88 | 5 | 64 | 19 | 13 |
| Total | 410 | 9 | 58 | 19 | 14 |
Overall, 68% of independent schools inspected this year were judged good or outstanding, eight percentage points higher than last year. Outcomes for quality of education and leadership and management were eight percentage points higher, whereas outcomes for behaviour and attitudes and personal development were similar to last year.

View data in an accessible data format.
State of the nation
Overall, 75% of independent schools were judged good or outstanding at their most recent standard inspection. Special schools have the highest proportion of good or outstanding judgements (82%), followed by other independent schools (70%) and independent faith schools (61%).
At their most recent standard inspection, 83% of independent schools were judged to have met the ISS. Again, special schools have the highest proportion of schools that met the ISS (90%), followed by other independent schools (78%) and independent faith schools (69%).
It is possible for independent schools to meet the ISS and yet be judged requires improvement for overall effectiveness. Of the 165 (16%) independent schools judged as requires improvement, 56% met the ISS and 44% did not.
Where schools do not meet the ISS at a standard inspection, the DfE will request that the provider submits a school action plan, which is often followed by a progress monitoring inspection (PMI).
Schools that have had at least one successful additional inspection (for example, the school met the ISS at a PMI or had an acceptable action plan) are more likely to improve to good or outstanding at their next standard inspection than schools that did not meet the ISS at any additional inspections.
Of the schools that received an inadequate judgement since September 2015, just over half improved to good or outstanding where we had evaluated their school action plan, conducted a PMI and then subsequently re-inspected. This increased to 65% if there was an acceptable action plan before a successful PMI.

View data in an accessible data format.
Overall, the proportion of independent schools judged good or outstanding stayed the same as last year, at 75%. The proportion of schools judged outstanding has decreased from 11% to 10%.
The percentage of independent schools judged inadequate has increased from 8% to 10% since 31 August 2022. Only 4% of independent special schools are inadequate compared with 19% of independent faith schools and 14% of other independent schools. Independent faith schools are far more likely to be judged inadequate than other types of independent school. More detail on the causes of poor inspection outcomes for these schools can be found in the faith schools section below.
The two main reasons why independent schools are judged inadequate under the EIF are leadership and management (which includes safeguarding concerns) and quality of education.
Almost all inadequate schools have been judged inadequate for leadership and management. Safeguarding is also ineffective in 64% of inadequate schools. When safeguarding is ineffective, this is likely to lead to a judgement of inadequate for leadership and management. Of the schools with ineffective safeguarding, 61% have also been judged inadequate in one or more of the other key judgements.
Sixty-three per cent of the inadequate schools provide an inadequate quality of education. Inadequate quality of education is often a result of an incoherent or unambitious curriculum and weaknesses in how the school is implementing this curriculum, leading to poor pupil progress.

Faith schools
Almost a third (31%) of the 23,200 schools that Ofsted inspects are faith schools. This includes both state-funded schools with a religious character and non-association independent faith schools.
Faith schools in the independent sector are a more varied group than in the state-funded sector. The faith schools in the table below include 25 independent faith schools also classed as special schools (19 Christian, five Jewish and one Muslim) and five state-funded special schools (four Christian and one Jewish). These schools are not included in Figure 10 because they are grouped with special schools.
Table 5: Number and proportion of non-association independent and state-funded schools by faith grouping, at year end
| Faith groups | Non-association independent faith schools: Number | Non-association independent faith schools: Percentage | State-funded faith schools: Number | State-funded faith schools: Percentage |
|---|---|---|---|---|
| Christian | 66 | 26 | 6,720 | 98 |
| Jewish | 72 | 29 | 52 | 1 |
| Muslim | 110 | 44 | 34 | <1 |
| Other faith | 2 | <1 | 21 | <1 |
| Total faith schools | 250 | 6,830 |
1. Due to the small number of other faith schools, percentages should be treated with caution.
It is clear that independent faith schools have relatively poor inspection outcomes compared with either faith schools in the state sector or with other independent schools. Of the independent faith schools we inspect, 39% are judged less than good, including 19% judged inadequate.

View data in an accessible data format.
As we have previously reported, there are several distinct strands that contribute to these disappointing outcomes.
First, independent faith schools are often small and poorly resourced. As a consequence, they find it hard to keep up with good practice in many aspects of education and safeguarding.
Second, some of these schools limit the curriculum in areas that are seen to conflict directly with their religion, for example in science, humanities and other subjects where they deem that the national curriculum or exam specification content conflict directly with religious teaching. Some aspects of relationships, sex and health education are also seen to conflict with religious principles. However, these issues are almost never found in state-funded faith schools.
Third, some schools serve communities that want children’s education only to prepare them for life within that community. This means that those schools restrict knowledge about the wider world. For example, some schools give very limited time to the secular curriculum. Some do not teach about fundamental British values, particularly around mutual respect for and tolerance of those with different faiths and beliefs. Again, these issues are almost never found in state-funded faith schools.
Inspection can contribute to helping these schools do better in relation to the first strand. The modest improvements seen in inspection outcomes for these schools in recent years may reflect this. We have seen many schools making real progress in improving the education they offer.
However, in relation to the second and third strands, inspection can only draw attention to the real tension that exists in the most conservative faith communities between education and equalities law, regulations and guidance on the one hand, and religious conviction on the other.
Children we are particularly concerned about
Unregistered schools
It is a criminal offence to run an unregistered school in England. Since 2016, when the unregistered schools team in Ofsted was set up, we have carried out over 1,190 investigations of nearly 1,120 suspected unregistered schools. This has resulted in around 770 inspections, 180 warning notices and six successful prosecutions.[footnote 46] This year, we opened 190 investigations into suspected illegal schools, conducted 110 inspections, and issued 25 warning notices to settings that appeared to be breaking the law.
The Schools Bill was intended to close loopholes in the registration system and to strengthen Ofsted’s powers to investigate unregistered schools. However, it was unfortunately dropped in December 2022. The weaknesses in the legal framework that were publicised during debates on the Bill are now common knowledge. These weaknesses continue to hamper our efforts to investigate unregistered schools and prosecute offenders.
This is a real concern because thousands of children across England are being educated in unregistered settings, some of which are putting children at risk of harm. We have regularly found:
- unregistered schools operating from unsafe and inappropriate premises
- unregistered providers led by profoundly unsuitable people, including some with criminal convictions
- children receiving an extremely limited curriculum, without coverage of basic skills such as English or mathematics.
These issues are not confined to settings operating illegally. They are also widespread in unregistered alternative provision (AP), which we also visit as part of our work. Ofsted does not have the power to make formal judgements of the quality of education in unregistered AP. However, we have seen far too many providers that are clearly substandard:
- some keep no attendance records
- some have no qualified staff
- some do not check that their staff are suitable to work with children
- many offer a very limited curriculum.
Too often, schools and local authorities are sending vulnerable pupils to these providers for most or all their education.
As we note in the SEND and AP chapter of this report, the solution to these problems lies in regulation of unregistered AP. While these settings remain unregulated, the suitability, safety and quality of many remains in doubt.

Elective home education
This year, the DfE published statistics on home education for the first time.[footnote 47] They show that the number of home-educated children is high and rising, with an estimated 116,000 children home educated at some point in 2021/22.[footnote 48] The reasons parents gave for home educating suggest that some are not doing so by choice but due to dissatisfaction with their child’s school, bullying, the risk of school exclusion or failure to secure a place at their preferred school.
These findings are concerning. Home education can work very well for both families and children but only when it is a positive choice and when parents have the necessary skills to educate their children. Sometimes, children who are nominally in home education are actually in illegal schools. In a significant number of cases, the government does not know why parents are deciding to home educate.[footnote 49] While the experience of remote education during the pandemic may have had an influence, numbers of home-educated children were already increasing in the years before the pandemic.[footnote 50] Legislation for a register of children not in school (CNIS) is now needed to improve information – locally and nationally – and to introduce new safeguards so that no child misses out on a suitable education.
Online education accreditation scheme
The online education services sector for children in England has grown in recent years. The DfE has introduced an online education accreditation scheme (OEAS), which is a route for online providers to be accredited by the DfE following quality assurance from Ofsted. Our quality assurance consists of suitability checks on proprietors and an accreditation visit to check compliance with the DfE’s online education standards. The OEAS is non-statutory, but DfE encourages eligible providers to apply.
Since the scheme opened in March this year, we have begun quality assurance activity but have not carried out any accreditation visits. We will report on the insights and key findings from visits in next year’s Annual Report.
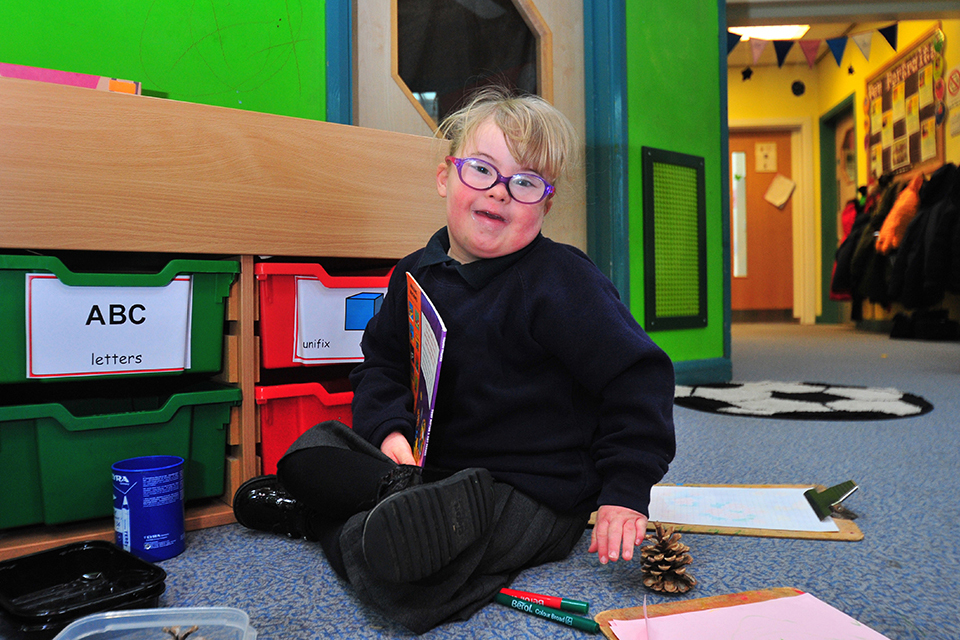
SEND and alternative provision
This year, pressure on the SEND system has increased due to rising numbers of children and young people in this category. Many children, young people and families are experiencing delays in access to services, particularly to wider health and therapeutic services, such as speech and language therapy and mental health services. Local authorities are struggling to meet demand for assessments and follow-on services. These delays are harming the quality of specialist educational provision, which relies on external professional expertise and services to support its pupils.
Given growing pressures on special school capacity, the complexity and range of needs that mainstream schools are having to cater for is continuing to increase. The shortage of special school places also means that alternative provision (AP) is sometimes used as a shadow SEND system. Pupils are being referred to AP while they wait for a suitable placement at a specialist school. As a result, some pupils are spending long periods of time in provision that is not resourced to meet their needs. As a result, their progress is hindered. The government has plans as part of the SEND and AP action plan to address these system-wide shortfalls.
Information on learners with high needs in further education colleges and independent specialist colleges can be found in the further education and skills chapter.
Special schools
Children with SEND
The number of children and young people with SEND continues to increase. We have reported elsewhere on educational delays created as a result of pandemic lockdowns and reduced socialisation. Therefore, some of this increase could be due to children not having the wider input and support as early as they need. This year, the percentage with an EHC plan has risen from 4.0% to 4.3%, and the proportion accessing SEN support has risen from 12.6% to 13%.[footnote 51] This has been a continuing trend: the number of pupils with an EHC plan has risen by 64% and the number with SEN support by 19% since 2015/16.
Most children and young people with SEND are educated in mainstream schools. Around 8% of pupils with SEND are educated in independent schools.
Table 6: Number of pupils in all schools by type of SEN provision, 2022/23
| Type of school | EHC plans | SEN support/SEN without an EHC plan |
|---|---|---|
| State-funded nursery | 670 | 6,380 |
| State-funded primary | 118,000 | 629,000 |
| State-funded secondary | 87,200 | 449,000 |
| State-funded special school | 147,000 | 1,440 |
| Non-maintained special school | 4,000 | 57 |
| Independent school (including independent special schools) | 28,700 | 89,800 |
| State-funded AP school | 3,370 | 7,520 |
| Total | 389,000 | 1,180,000 |
Source: Department for Education
The most common type of need in children and young people with EHC plans is autistic spectrum disorder. For those with SEN support, it is speech, language and communication needs, closely followed by social, emotional and mental health needs and moderate learning difficulties.[footnote 52] This has been a consistent picture since 2015/16.
What we did this year
State-funded special schools
This year, we carried out 120 graded inspections of state-funded special schools (see annex for data definitions). Seventy-five per cent of these schools were judged good or outstanding overall. Judgements for quality of education were very similar to those for overall effectiveness. Outcomes for behaviour and attitudes and personal development were notably more positive. This mirrors the outcomes for state-funded mainstream schools.

View data in an accessible data format.
Ninety-nine per cent of the state-funded special schools that had a graded or ungraded inspection this year had effective safeguarding.
Non-association independent special schools
We inspected nearly 260 independent special schools this year. Seventy-five per cent of these schools were judged good or outstanding overall. The proportion of good and outstanding judgements for behaviour and attitudes and personal development were nine to 12 percentage points higher than judgements for quality of education and leadership and management.

View data in an accessible data format.
Eighty-five per cent of independent special schools met the ISS compared with 63% of non-special independent schools. This difference in independent special and non-special schools meeting the ISS is consistent with last year.
State of the nation
At year end, there were 1,760 special schools. Of these, 1,040 were state-funded, 670 were non-association independent schools and 53 were other non-maintained special schools.
The proportion of good or outstanding special schools has remained relatively stable since last year, for both state-funded schools and independent schools.

View data in an accessible data format.
The growing number of pupils with SEND has put added pressure on both mainstream and specialist schools. There are children who need a special school place but are not getting what they need while they wait for one, either in mainstream schools or while temporarily out of education. Schools are using part-time timetables for some of these children, often for those with behavioural needs. These part-time timetables are not always in the child’s best interests. Schools are not always monitoring the appropriateness and impact of such arrangements. Therefore, pupils can remain on these timetables for extended and indefinite periods, during which they will not be getting a full and suitable education.

Area SEND inspections
In January this year, we and the Care Quality Commission (CQC) jointly launched a new framework for the inspection of local area arrangements for children and young people with SEND.[footnote 53] These inspections are known as area SEND inspections. The new framework represents a significant change of approach. For the first time, we are deploying social care inspectors alongside education and health inspectors. By taking a collaborative approach, we are gaining a holistic understanding of the impact of SEND services. This approach reflects working arrangements in local areas.
The other main changes include:
- placing more emphasis on the impact that local area partnerships are having on the experiences and outcomes of children and young people
- establishing an ongoing cycle of inspection that supports continuous improvement
- assessing how well local authorities plan for, commission and oversee AP in their local area
- introducing monitoring inspections for areas required to produce a priority action plan
- introducing thematic visits that investigate a particular aspect of the SEND system in depth.
These inspections provide an independent, external evaluation of the effectiveness of local area partnerships and whether they are fulfilling their legal duties to make a positive difference to the lives of children and young people with SEND. In addition, and where appropriate, they recommend what is needed to improve arrangements.
What we did this year
Between January and August 2023, Ofsted and CQC inspected 16 local area partnerships. In five local area partnerships, SEND arrangements typically lead to positive experiences and outcomes for children and young people. In six, SEND arrangements lead to inconsistent experiences and outcomes. Five areas were found to have widespread and/or systemic failings.
Inspections under the new framework are showing many of the same concerns as under the previous framework. Most significantly, families continue to experience long waiting times for some assessments and support, such as child and adolescent mental health services (CAMHS), educational psychology and speech and language therapy. The increase in EHC plans is having a negative impact on health and education services. The DfE has reported that services such as educational psychology are struggling to deal with the volume of EHC plan referrals, which is delaying access to other essential services. Educational psychologists are suggesting that better early interventions could reduce the need for EHC plans and the pressure on health and education services.[footnote 54]
In some areas, the pace of creating and reviewing EHC plans remains slow. Inspections show that plans are also often of poor quality. Better-quality EHC plans are often the result of better partnership working between children and young people and their families and professionals in a broad range of services in health, social care and education. These plans tend to be more timely, have clear needs analyses and shared with all relevant professionals and providers. The experiences of children and young people with high-quality plans are better.

A common weakness across local area partnerships is how they use data. Some local areas are not collecting enough or the right information about the needs and outcomes of children and young people. Others do but are not sharing it well across the partnership. Even some local areas that do share information appropriately are not analysing or using data effectively to measure impact, develop or adapt strategies, or inform future decision making.
This year, we have also seen good practice. This is particularly true in terms of the support for children in early years. Partners are identifying and addressing the needs of younger children earlier than they have previously. We have also seen partners working together effectively, and including children and their families (co-production) to design, commission and deliver services around the child. In some instances, we found that the commissioning and oversight of children placed in residential special schools, by children’s social care was improving multi-agency monitoring.
The new framework draws evidence more directly from children and young people, their families and the practitioners who work with them, about their experiences and outcomes. We are also using new point-of-inspection surveys to gather their views. We are very pleased with levels of participation during the first 16 inspections, having received over 23,000 survey responses. This is improving our understanding of the experiences of SEND service users and providers, and of the impact of local area partnership actions.
In autumn 2022, we carried out 13 revisits under the 2016–22 inspection framework, completing that programme. At these revisits, six local areas had made sufficient progress in addressing all significant weaknesses; six had made sufficient progress in addressing some significant weaknesses; and one had made insufficient progress in addressing any significant weaknesses.
Alternative provision
AP is commissioned by schools or local authorities for pupils who have been excluded or cannot attend mainstream school, for example due to medical needs. It is a diverse and complex sector that includes pupil referral units, hospital schools, state-funded AP schools, independent schools and other providers not registered as schools or further education colleges. The size of AP settings is very variable. Some independent schools only have one or two AP placements whereas state-funded AP schools have more. Seventy-two per cent of non-association independent schools with AP placements are special schools. These placements are often the school that is agreed and listed on the child’s EHC plan, so the DfE considers these to be special rather than AP placements (though they are recorded and published as part of the AP census).
We inspect AP in a variety of ways. We inspect registered full-time providers as schools. Those operating part time do not have to register as schools. The small number of providers that are full-time but have fewer than 5 pupils, none of whom have an EHC plan or are looked after by a local authority, do not have to register either. Both of these groups of settings are only inspected either indirectly, through inspection of commissioning schools and local SEND services or by the inspections of the unregistered schools team. However, Ofsted has no power to investigate the quality of education in suspected illegal schools or AP.
The number of placements in AP has increased by 13% from 59,900 in January 2022 to 67,600 in January 2023 across state-funded, all independent and unregistered providers.[footnote 55] The breakdown of increases in AP placements is:
- 10% increase in state-funded schools, to 25,100
- 13% in independent schools, to 31,000[footnote 56]
- 19% in unregistered AP, to 11,600.[footnote 57]
This continues the trend of placements in the independent and unregistered sectors growing at a faster rate than the state-funded sector.[footnote 58]
The number and the proportion of younger children in AP is also rising.[footnote 59] Twenty-one per cent of pupils attending AP this year were aged under 11, an increase from 15% from last year.
We know that the complexity and range of needs that AP is catering for have also increased. The most common needs are social, emotional and mental health.

What we did this year
Inspection outcomes continue to be worse for state-funded alternative provision (AP) than for other state-funded schools. This year, 83% of APs inspected were judged good or outstanding at a graded or ungraded inspection compared with 88% of all schools (see annex for data definitions). The most positive judgements in AP schools were for behaviour and attitudes and personal development (71% good or outstanding).
This year, we carried out 53 ungraded inspections of good and outstanding APs, with concerns identified in 30% of these (16 inspections) compared with 16% of ungraded inspections in all schools.

View data in an accessible data format.
Eighty-three out of the 87 state-funded APs that had a graded or ungraded inspection this year had effective safeguarding.
Some schools are using AP as a last resort, with many using AP for crisis management rather than as a suitable long-term placement for a child. There is a lack of understanding and clarity across the sector around how AP is commissioned. Some schools think it is the responsibility of the local authority rather than the school. Some schools do not commission AP with enough rigour or ambition for the child. This means that they often then lack oversight of curriculum and quality of education.
State of the nation
Overall, 85% of state-funded AP was judged good or outstanding overall compared with 76% of non-association independent schools.[footnote 60],[footnote 61]

View data in an accessible data format.
Many AP settings offer a lifeline to children in difficult circumstances. These providers work hard to change pupils’ attitudes to learning, improve their attendance and make up for gaps in their learning. However, this year’s outcomes for state-funded AP, particularly in the critical area of quality of education, are disappointing. Some of this may be due to increasing number of pupils. Eighty per cent of pupils attending a state-funded AP have a SEND diagnosis.
The issue of quality is not confined to state-funded AP. This year, 57% of unregistered school inspections were of AP providers. This has increased from 33% between January and September 2016 when our unregistered schools team was first set up. As set out in the unregistered schools section, many unregistered providers offer a sub-standard education (though educational quality is not the main focus of unregistered school inspections). With this part of the sector continuing to grow, it is unlikely that quality of education will improve without a new system of regulation and inspection.
This year, we carried out AP thematic visits, working with partners in local areas to review how they work together to commission and deliver AP. We will be sharing our insights from inspections and thematic reviews as part of our contribution to the improvement of AP and AP commissioning practices. We will also increase scrutiny of the misuse of AP.
Teacher development
Teachers’ professional development is crucial to a high-quality education system. When teachers base their everyday practice on an up-to-date, coherent and integrated professional knowledge base, this benefits all pupils and learners.
Recruiting and retaining the very best teachers in our classrooms needs high-quality professional development and training throughout a teacher’s career. The DfE has developed a ‘golden thread’ of professional development that connects initial teacher education (ITE), a framework for early career teachers (ECTs) and national professional qualifications (NPQs).
Our inspections of ITE providers and of the lead providers of the ECF and NPQ programmes give an independent, external judgement of effectiveness. Our frameworks evaluate how well providers prepare teachers in subjects, phases and professional contexts. Where appropriate, we highlight areas for improvement.
Initial teacher education
The current ITE framework was introduced in September 2020 and intentionally raised the bar for ITE providers. It focuses on the quality of the ITE curriculum and emphasises the importance of trainees’ subject- and phase-specific knowledge. The framework also recognises the importance of using up-to-date and relevant evidence, including research specified in the DfE core content framework (CCF).
What we did this year
This year, we inspected 110 age-phase ITE providers, 99 of which are good or outstanding overall (see annex for data definitions). We re-inspected 15 providers that were less than good. All 15 are now good.
By August 2024, all registered ITE providers will have been inspected under the current framework.

View data in an accessible data format.
In early years, primary and secondary ITE, providers judged good or outstanding have high-quality training curriculums that are ambitious and well-sequenced. These providers typically incorporate the expert knowledge, skills and professional behaviours needed by teachers at each phase – and subject-level into their curriculums. They also include the theory that underpins this. They also make sure that mentors give feedback and practical advice to trainees as they develop their teaching practice.
In the best examples, providers consider trainees’ starting points so that they pitch training at the appropriate level for them, and revisit core principles regularly to embed trainees’ understanding. Providers establish strong mentoring programmes that provide support and guidance to trainees’ mentors too. Good and outstanding providers also use purposeful and proportionate quality assurance processes. This ensures that the ITE curriculum is being implemented effectively and mentoring is of high quality and consistently applied across different types and sizes of providers.
Generally, we found that the DfE’s CCF is sufficiently covered in the early years, primary and secondary phases.[footnote 62]
In the four primary and secondary phase providers judged less than good, areas for improvement include:
- initial assessment of trainees’ subject knowledge
- consistency and assurance of the mentoring programme
- specificity in trainees’ formative assessment
- opportunities to plan, teach and assess pupils’ learning of the foundation subjects in primary ITE routes
- preparing trainees on secondary ITE routes to teach post-16 pupils
- preparing trainees on primary ITE routes to teach children in the early years.

ITE provision for further education trainees remains the poorest performing age phase. However, standards have improved since last year. For instance, three providers that were previously less than good improved to good this year.

View data in an accessible data format.
Good further education ITE providers develop research-informed curriculums. This focuses on introducing trainees to highly effective teaching strategies and ensures that they are supported well by their mentors to apply what they learn. They also teach trainees about the breadth of the further education sector. This is to make sure that trainees are well-prepared for the realities of teaching.
Issues in further education ITE providers that are less than good included:
- disjointed curriculums that lacked detailed content or consideration of when content would be taught and re-visited through the course
- too few mentors receiving suitable training, information and support to carry out their role effectively
- trainees not being taught how to adapt to the needs of all their learners.
Commissioned further education ITE inspections
This year, the DfE commissioned us to inspect two previously uninspected providers, with high numbers of trainees studying the Diploma in Education and Training (DET). Both were judged inadequate. We are deeply concerned that trainees were left poorly prepared, and by the findings, which include:
- staff wrongly informing trainees that these qualifications would allow them to teach in primary and secondary schools
- lack of research-informed curriculums
- trainees not having access to suitable teaching placements
- staff not having a clear enough understanding of the further education and skills sector.
The DfE’s commission to inspect DET providers will continue into next year.
State of the nation
At year end, there were around 350 age-phase ITE providers including higher education institutions, school-centred initial teacher training providers, and colleges.
Ninety-six per cent of all age-phase partnerships are currently judged good or outstanding. This proportion is two percentage points higher than a year ago but has fallen since the introduction of the new framework, from 100% at year end 2020. Just over half of the age phase providers inspected have been inspected under the current framework. A provider’s grade under the previous framework may not be the grade they will get when inspected under the new framework.
Inspection outcomes since the start of the 2020 ITE framework
The new framework intentionally raised expectations. Of 220 ITE age-phase partnerships inspected since the introduction of the ITE framework in 2020, 77% have been judged good or outstanding overall, much lower than the 93% under the previous framework. Similarly, fewer providers are outstanding under the new framework: 18% of providers compared with 36% under the previous framework.

View data in an accessible data format.
Outcomes have improved this year compared with the first two years of the new framework, with around nine in 10 providers judged good or outstanding compared with only six in 10 previously. Most of the outstanding judgements received under the new framework have been made this year.
These improved outcomes indicate that more providers are rising to the high expectations of the framework. Many providers have reflected on and revised their ITE curriculum, incorporating the CCF and improving coherence between what is taught and what the trainees practice while on placement.
Early career framework and national professional qualifications
We introduced our ECF and NPQ inspection framework in March 2022. Lead providers are contracted by the DfE to deliver the ECF and NPQ programmes. Inspections of lead providers find out how well they ensure the delivery of high-quality training and professional development through a national network of delivery partners. At year end, there were 11 ECF and/or NPQ lead providers in total. These are made up of 10 NPQ providers and six ECF providers (five of which also deliver NPQ).
What we did this year
This year, we carried out six full inspections of ECF lead providers (see annex for data definitions). Four were judged outstanding and two good.
All six lead providers inspected adhere to the requirements of their contracts by delivering the ECF as it is intended. They take careful account of what ECTs already know from their initial teacher education and use this to inform programme delivery. Lead providers emphasise and remind ECTs of the importance of revisiting key teaching principles so that they can continually deepen their knowledge and practice over time.
The outstanding providers enable delivery partners and mentors to bring the ECF to life, which helps ECTs to build and apply their knowledge over time. They work closely with delivery partners and mentors to exemplify the universal ECF training. This means that ECTs can see how it might look in their subject, setting or phase. Some of these providers group ECTs in similar subjects or specialisms so that they can learn together and share best practice. Outstanding providers also make sure that mentors receive high-quality training. This allows the mentors to understand the starting points of their ECTs and to tailor support appropriately.
Most ECTs we spoke to have a positive experience of their training. They say they are getting the knowledge, understanding and skills needed to progress in teaching in their specific phases.
Lead providers deliver the ECF programme nationally through a network of delivery partners. Our monitoring visits last year found that some lead providers needed to improve their quality assurance processes so that training was of high quality irrespective of where an ECT was receiving it. This year’s inspections found that this had improved.
The outstanding providers prioritise strong collaboration and communication across the delivery partner network. This results in a cohesive and consistent approach to large-scale training delivery, with minimal regional differences. These lead providers communicate regularly and closely with delivery partners through a variety of channels. This helps them to check standards effectively. Furthermore, the open dialogue this creates allows improvements to be explored in partnership. Many lead providers and delivery partners share a focus on continual improvement.
Outstanding providers have clear, transparent and collaborative quality assurance processes and have a clear understanding of what is expected of all parties. This means that delivery partners adapt quickly to programme enhancements and, in some cases, share learning with one another. These providers collect a range of data and feedback to shape training delivery and subject specific materials.
We will start carrying out full inspections of NPQ lead providers in spring 2024.
Findings from year one of the teacher development review
We recently published the findings of the first year of our teacher development review, commissioned by the DfE.[footnote 63] We surveyed approximately 1,950 teachers and leaders and made 44 research visits to primary and secondary schools for views on their recent training and development, including but not limited to ECF and NPQ.[footnote 64]
The review showed that workload pressures were often a barrier to teachers accessing development opportunities. In particular, high levels of staff absence and the need for lesson cover sometimes prevented teachers from attending planned face-to-face training.
The training and development opportunities staff have received are wide-ranging and it is encouraging that many schools have prioritised training and development around the curriculum. However, in some schools visited, staff understanding of planning and designing a curriculum remained limited, even though they had received training. In several cases, teachers had done courses narrowly focused on preparing for inspection instead of addressing a lack of knowledge.
Schools have also focused heavily on mental health and well-being training. It remains unclear whether this is improving how schools address pupils’ wider personal, behavioural and social needs, including how they join up with other agencies supporting children.
Leaders and teachers were often unimpressed with the quality of their recent training and development. Generally, ECTs and staff taking NPQs were more positive about their development experiences than other teachers, in terms of relevance and quality. Only a minority of ECTs said that the ECF and NPQ content can be generic and not implemented consistently.
We are continuing our review for a second year, which will include a focus on special schools.
Specific themes across teacher development
Training to teach pupils with SEND
Our review of teacher development found that many new and experienced teachers want more training on how to teach pupils with SEND. Given the increase in SEND identification and the shortage of special school places, this is not surprising.
On ECF lead provider inspections, we found that ECTs are taught how to adapt teaching for pupils of all abilities. In the most successful cases, learning how to adapt teaching well is linked to ECTs’ subject and phase.
In ITE, the picture is more variable. Some providers are highly effective at teaching trainees how to identify pupils’ needs, to adapt teaching accordingly and to bring in support when needed. These providers are also more likely to seek opportunities for trainees to visit special schools to see this teaching in practice. However, in some cases, training is limited to one-off sessions on SEND, with no opportunity to consolidate any learning in special school settings. The DfE has recently published guidance on how to involve special schools and alternative provision in ITE. This may increase this type of opportunity for trainees.
Training in early reading
In early years and primary ITE, more providers are now teaching trainees how to teach early reading, including the use of systematic, synthetic phonics (SSP).
Trainees on secondary ITE routes are also being better prepared to support weaker readers, irrespective of the subject they are training in. This means that far more trainees are becoming confident and competent in teaching new or struggling readers.
These improvements in ITE are being reinforced by ECF lead providers, whose work to help ECTs practice and refine the skill of teaching early reading is highly effective.

Further education and skills
The further education (FE) and skills sector teaches learners aged 16 and over. Different types of providers offer a wide variety of education, training and apprenticeships to prepare learners for further study, employment or greater independence.
Over three-quarters of FE and skills providers were judged good or outstanding at their most recent inspection. There is variation by provider type but for most types there has been little change in overall effectiveness from last year.
Most colleges are judged good or outstanding overall. This year, we started reporting on how they are meeting skills needs through enhanced skills inspections. Most colleges are making strong or reasonable contributions to meeting local skills needs.
We completed our review of the early implementation of T levels this year. This has shown that providers still have much to do to improve the quality and effectiveness of these programmes.
As reported in previous years, the overall effectiveness of education, skills and work provision in prisons is poor. We continued our research into reading education in prisons this year and made recommendations on how prisons can improve this aspect of education.
What we did this year
This year, we carried out 510 full inspections, 33 short inspections and 160 new provider monitoring visits (NPMVs) (see annex for data definitions).
Seventy per cent of full or short inspections resulted in overall judgements of good or outstanding. In all full inspections that resulted in an overall judgement of good or outstanding this year, the quality of education was also judged good or outstanding. The relationship between overall effectiveness and the key judgements was similar to previous years, with behaviour and attitudes being judged good or outstanding most often, followed by personal development.

View data in an accessible data format.
Over two thirds of the full inspections this year were of independent learning providers or employer providers. Of these, 63% were judged good or outstanding.
We carried out 64 full inspections of colleges, which included 11 colleges inspected for the first time since merging. Overall, 78% were judged good or outstanding. Of the 11 colleges inspected for the first time, one was judged outstanding, five good, four requires improvement and one inadequate.
Common areas for improvement in the colleges that were requires improvement or inadequate at first inspection are that they should:
- ensure that all learners benefit from a high quality and ambitious curriculum
- set higher standards for students’ attendance and punctuality
- give all apprentices effective careers advice and guidance that supports them with their next steps.

Table 7: FE and skills providers judged good or outstanding at full inspections by judgement and provider group, this year
| Provider group | Total number of inspections | Overall effectiveness % good or outstanding | Quality of education % good or outstanding | Behaviour and attitudes % good or outstanding | Personal Development % good or outstanding | Leadership and management % good or outstanding |
|---|---|---|---|---|---|---|
| All FE and skills providers | 510 | 68 | 71 | 89 | 74 | 67 |
| Independent learning providers | 360 | 63 | 65 | 87 | 69 | 62 |
| Colleges | 64 | 78 | 81 | 88 | 84 | 80 |
| Other providers | 87 | 79 | 84 | 95 | 87 | 79 |
1. ‘Independent learning providers’ includes employer providers.
2. ‘Colleges’ includes general FE colleges, sixth-form colleges and specialist FE colleges.
This year, the safeguarding arrangements in seven providers were judged to be ineffective. Safeguarding is ineffective where there are serious or widespread failures in the provider’s safeguarding arrangements. We found:
- leaders unable to identify actions that have been taken following referrals
- weak recording of safeguarding concerns
- learners lacking understanding of safeguarding risks, how to keep themselves safe and how to report concerns
- insufficient safeguarding training for staff.
This year, of the 40 providers inspected that were previously judged outstanding, 18 remained outstanding, 18 were judged good and 4 were judged requires improvement. Sixty-four per cent of the 250 providers having their first full inspection were judged good or outstanding.
Table 8: Overall effectiveness of FE and skills providers this year, by previous overall effectiveness
| Previous overall effectiveness | Total number of inspections | % Outstanding or remains outstanding at short inspection | % Good or remains good at short inspection | % Requires improvement | % Inadequate |
|---|---|---|---|---|---|
| Outstanding | 40 | 45 | 45 | 10 | 0 |
| Good | 210 | 3 | 70 | 23 | 4 |
| Requires improvement | 44 | 0 | 70 | 23 | 7 |
| Inadequate | 5 | 0 | 20 | 60 | 20 |
| Not previously inspected | 250 | 6 | 58 | 28 | 8 |
| Total | 540 | 7 | 62 | 25 | 6 |
1. Due to the small number of previously inadequate providers inspected, percentages should be treated with caution.
State of the nation
At year end, there were 1,970 publicly funded FE and skills providers offering education, training and/or apprenticeships, 75 fewer than on 31 August 2022.
Overall, 78% of FE and skills providers have had a full inspection and a further 15% have had an NPMV. Eight per cent are yet to be inspected.
At year end, 79% of FE and skills providers were judged good or outstanding at their most recent inspection, two percentage points less than last year.

View data in an accessible data format.
Although the overall proportion of providers judged good or outstanding has decreased, it has increased for some provider groups. At year end, 92% of colleges were judged good or outstanding at their most recent inspection. This is an increase of one percentage point compared with last year. This increase follows several merged colleges being inspected for the first time, which was covered in more detail in our statistical commentary earlier this year.[footnote 65]

T levels
T levels are a two-year vocational course taken after GCSEs that are broadly equivalent to three A levels. T levels combine practical and knowledge-based learning with an industry placement. They were introduced in 2020.
The DfE commissioned us to review the early implementation of T levels in 2022. In spring 2023, we returned to providers for the second phase of the review.[footnote 66] This looked at T levels in construction, digital, education, and health and science. We also reviewed implementation of the T level transition programme (TLTP).
Our review shows that there is considerable work still to do to improve the quality and effectiveness of T levels and TLTPs. The best providers engage employers as part of a well-considered curriculum planning process. However, learners’ experiences of the programmes vary substantially. Many prospective learners, parents and school staff are not aware of or do not understand what the qualification entails.
A common weakness is in how providers carry out initial assessments of learners’ abilities and what they do with the information. By not doing this thoroughly enough, providers are not identifying learners’ starting points or using the information to inform curricular planning.
While the teaching of practical aspects of T-level courses is generally good, some vocational teachers struggle to teach theoretical content in enough depth. Likewise, learners have access to good physical resources, such as tools on construction courses. Yet teaching resources for T levels and TLTPs, such as specimen assessment and examination materials, are limited.
Many providers struggle to find suitable industry placements for learners. Employers are also often poorly informed by providers about the content and structure of courses. In these cases, placement activities are not well aligned with the T-level course content. When appropriate work placements are made, they provide beneficial opportunities for learners to develop relevant knowledge and skills.
Most learners who stay on their course achieve the qualification and move on to employment, apprenticeships or higher-level study. However, learner progression from the first to the second year of the course is low in many providers. Many learners do not complete the course.
The TLTP is a one-year, level 2, 16 to 19 study programme that provides a route into T levels for learners who are not ready to enrol on it straight away. Our review found that the number of learners who progress to T levels from TLTPs is low. In many cases, learners do not want to move on to a T level or do not understand what a T level is. We found some learners had been automatically enrolled following their GCSE results or a lack of appropriate level 2 alternative.
We found that the quality and effectiveness of the curriculums on TLTPs has generally improved. On the most effective programmes, learners benefit from tailored work placements. However, the least effective programmes do not include work experience and do not result in any meaningful outcome for learners after a year on the programme.
Adult learning
Since September 2019, funding for adult learning in England has been partially devolved. It is now divided between the Education and Skills Funding Agency (ESFA), mayoral combined authorities (MCAs) and the Greater London Authority (GLA). Each MCA and the GLA has a responsibility to fund adult learning in its area, to fit their local skills and community priorities. The ESFA continues to fund areas outside an MCA. Ofsted inspects all learning funded through the adult education budget, whether or not it is devolved (along with learning funded through some other routes).
At year end, 740 FE and skills providers were delivering adult education. Three quarters of these providers had been judged on the quality of adult education provision at their most recent full inspection or NPMV. Of those inspected, 88% were judged good or outstanding or to be making at least reasonable progress in an NPMV.

View data in an accessible data format.

Skills Bootcamps
Skills Bootcamps are short, flexible programmes for adults, designed to meet employer skills needs. They enable employees and self-employed and unemployed adults to learn new skills. They aim to help people move into skilled jobs in sectors with skills shortages, such as digital, engineering, construction, manufacturing, and green and other new technologies.
We began inspecting Skills Bootcamps in April 2023. Between April and August 2023, we inspected a range of provision. This was usually in providers that already delivered other adult and apprenticeship provision and had been inspected before. We saw a number of examples of good and outstanding provision with strong teaching and assessment and learners that make good progress. We also found examples of weaknesses. In many cases, for example, the quality of teaching and support is not consistent enough, and too many learners are leaving without completing their courses.
In 2022, we published a Skills Bootcamp thematic review.[footnote 67] Some of the weaknesses seen in our recent inspections were apparent in that review.
We found that trainers generally have relevant industrial experience and good technical skills and curriculum knowledge in their specialist areas. However, they do not have sufficient opportunities to develop pedagogical skills, such as in online training.
Providers make good use of regional partnerships and insight into labour markets to provide courses that meet identified skills needs. Nevertheless, some providers need to improve engagement with employers. In other cases, the purpose of the programmes is unclear.
Most providers sequence their curriculums appropriately and use good-quality learning resources. Most help learners to develop both personally and professionally and gain a range of skills, alongside vocational learning. However, the quality of teaching is not consistently high across providers and in many, assessment practice is too weak. Providers’ arrangements for quality assuring Skills Bootcamps need to be more effective, particularly when the training is provided by subcontractors.
Learners who do enrol tend to remain until the end. Most learners were satisfied with the content and quality of their training. However, many of those who are taught entirely online have poor experiences. The help that providers give learners to find work varies substantially. Providers usually support learners with SEND well, although a few providers do not have clear strategies in place or provide specialist support.
Apprenticeships
At year end, 1,390 FE and skills providers were offering apprenticeships. Of those inspected, 76% were judged good or outstanding or to be making at least reasonable progress in an NPMV. Providers that deliver apprenticeships can vary greatly in size but all are inspected in their own right.

View data in an accessible data format.
This year, we graded apprenticeship provision on 120 NPMVs and 410 full inspections. At full inspection, apprenticeships remain the poorest performing provision type this year. Of the apprenticeship providers that had their first full inspection this year, nearly two-thirds are good or outstanding for apprenticeships. This leaves a third that are requires improvement or inadequate.
The strongest providers offer apprenticeships with well-constructed and taught training plans that link on- and off-the job training coherently. Apprentices develop substantial new knowledge and skills as a result, along with good professional behaviours and attitudes. There are some common features of good and outstanding provision, including:
- providers appropriately assess apprentices’ abilities at the start of the apprenticeship to inform the training plan
- employers are committed to using apprenticeships effectively to improve the skills of their workforce
- trainers are experts in their subject and providers train them to be good teachers
- trainers and employers give apprentices appropriate information and guidance about the role of their apprenticeship in their employer’s business, and for their wider, longer-term career
- leaders and managers have thorough oversight of apprenticeship provision and intervene swiftly when they identify areas for improvement
- trainers prepare apprentices well for their end point assessment, making sure that the apprentices get feedback that helps them to improve
- providers make sure that English and mathematics training is relevant to the individual and their industry.
Weaker providers do not take into account learners’ prior knowledge or experience in planning, and teaching is often poor. English and mathematics training is not linked closely enough to relevant industry needs, instead tending to focus on achievement of functional skills qualifications. Providers do not offer enough or appropriate off-the-job training. When they do offer off-the-job training, it is insufficiently linked to on-the-job training. Weaker providers do not involve employers enough in planning or reviewing apprentices’ training. Leaders and managers often do not know the weaknesses in their provision, as they do not have systems in place to evaluate it.
Levels 6 and 7 apprenticeships are mainly taught by higher education institutions and independent learning providers. Ofsted continues to inspect this provision, including providers new to apprenticeships and existing providers who have expanded their range of apprenticeships to include levels 6 and/or 7. We found the same strengths and areas for improvement at these levels as for apprenticeships at levels 2 to 5.
The number of people starting an apprenticeship in 2021/22 increased by 9% from the previous year. Despite this increase, at just under 350,000, this is still 31% fewer apprenticeship starts than in 2015/16. The reduction is particularly acute for levels 2 and 3 apprenticeships, with starts falling by 50% since 2015/16. In the same period, apprenticeship starts at levels 4 to 7 increased in areas such as senior leader, accountancy and taxation.[footnote 68]
Provisional data published by the DfE indicates that overall apprenticeship starts have decreased in 2022/23, with a similar pattern of declines in starts at levels 2 and 3 and increases at levels 4 to 7.[footnote 69] This year, providers have told us about factors contributing to reduced starts at lower levels. Some are narrowing their offer because of challenges recruiting and retaining high-quality trainers, or because costs have risen ahead of funding rates for some apprenticeships. Employers are choosing to improve the skills of existing staff through higher level apprenticeships.
Nearly half (47%) of apprenticeship starters are aged 25 or over. Thirty per cent of apprenticeship starters are aged 19 to 24 and 22% are aged 16 to 18.[footnote 70]


View data in an accessible data format.
Along with a reduction in apprenticeship starts, the proportion of apprentices leaving apprenticeships early has increased. In 2021/22, 45%of apprentices left an apprenticeship early, a four percentage point increase compared with the previous year.[footnote 71]
Poor-quality training can lead to apprentices leaving. Some providers do not offer enough taught content and are over-reliant on independent learning, or use solely online teaching where it is not appropriate or relevant to the industry. A lack of information and guidance can lead to false expectations among apprentices and employers. This is because they are unaware of the level of commitment and time an apprenticeship can take to complete.
In sectors such as retail and hospitality, apprentices are leaving early for better paid but unqualified roles. Recruitment and retention of training staff continues to be a challenge for some providers and in some sectors, particularly in care, early years and education.
Provision for learners with high needs
This section looks at provision for learners with high needs in FE and skills providers. For discussion about school-aged children with SEND, see the SEND and alternative provision chapter.
We inspect ESFA-funded provision for learners with high needs in general FE colleges and other provider types. Independent specialist colleges provide education and training for learners with complex learning difficulties and/or disabilities. There were nearly 47,000 post-16 high needs place allocations this year, an increase of 8% since last year.[footnote 72] This year, we judged the quality of high needs provision at 51 general FE colleges, 29 independent specialist colleges and 46 other providers.
Overall, we judged 76% of high needs provision as good or outstanding. However, rates varied between provider types. Seventy-six per cent of general FE colleges were judged good or outstanding compared with 66% of independent specialist colleges.
Independent specialist colleges judged good or outstanding this year offer an appropriate curriculum that supports learners to develop personal skills and independent life skills, including English and mathematics. Common features included:
- providers focusing on developing learners’ confidence and self-esteem so that they are well prepared for adulthood and employment
- managers who are ambitious for learners with high needs and plan their curriculum well
- support from specialist and therapeutic staff that enables learners with multiple and complex needs to access the curriculum and enrichment activities.
In independent specialist colleges that require improvement, the curriculum is not sufficiently ambitious. For example, they do not support learners’ transition to their further learning or employment destinations, or not everything in the curriculum is purposeful or contributes to learners’ preparation for independence. In some cases, tutors set work for learners that is too easy and too many learners are not being challenged to complete work to the best of their abilities. Consequently, their progress is slow and they stay at the college longer than they need to.
Most learners with high needs who attend general FE colleges also have appropriate curriculums that help them to develop a wide range of personal, social, sporting and employability skills. In some cases, the colleges had designed their curriculums with a strong link to community groups and local employers, preparing learners well for employment.
General FE colleges that required improvement share some weaknesses. They do not support learners with high needs who study on vocational and academic programmes promptly or effectively enough, such as by putting in place appropriate specialist support. For example, learners who would benefit from assistive technologies to promote their independence are not always encouraged to use them.

Enhanced skills inspections
FE colleges, sixth-form colleges and designated institutions have a new duty to review their contribution to meeting skills needs.[footnote 73] In September 2022, we introduced enhanced inspections for these providers in which we make a sub-judgement on their contribution to meeting skills needs.
Inspectors meet senior leaders and governors to discuss their skills strategy. They meet a broad range of representatives from relevant civic, community, education and employer groups. They also meet curriculum managers to discuss how their subject and curriculum areas link with employers and other stakeholders.
This year, we carried out enhanced inspections of 68 providers. Of these, 31% are making a strong contribution to meeting skills needs, 63% are making a reasonable contribution and 6% a limited contribution.
Providers making a strong contribution have some similarities in their approach. They have clear skills strategies, established through close discussion and liaison with a range of employer and other stakeholders. In all the best cases, these skills strategies align closely to existing and emerging local, regional and/or national skills needs. Staff at all levels maintain strong relationships with a range of local and regional stakeholders, which they used to identify new and emerging skills needs. Senior leaders in these providers use their extensive range of contacts to broaden the curriculum and enhance learners’ skills and understanding. Learners and apprentices are taught up-to-date knowledge and skills. In some cases, leaders have very strong relationships with national stakeholders who specialise in a particular subject or field. Curriculum leaders and/or subject heads also maintain good relationships with key stakeholders. They use these to review the curriculum, making sure it is up to date and that it takes account of skills needs in their field. They also work hard to keep staff skills up to date so that teaching gave learners the latest relevant skills in their field.
Providers making a limited or reasonable contribution share some common areas for improvement. Frequently, these providers have no skills strategy in place or have only just begun work in this area. In these cases, strategic links with stakeholders are not yet in place, or are too new to be able to see their impact. Curriculum leaders and subject heads do not always seek the information or involvement from stakeholders that would make sure that teaching is current, relevant and most useful to learners or that the training they provide meets the needs of learners, employers, and sector stakeholders. In most of the colleges making a limited contribution to meeting skills needs, curriculum links with employers and other stakeholders are missing, underdeveloped or partial across a number of subject or sector areas.
Careers guidance
This year, the DfE commissioned us to review careers provision in schools and FE and skills providers.[footnote 74] We found that most FE and skills providers are aware of the importance of an effective career guidance programme. However, many report that time and resource limit their careers programme.
Overall, there is senior oversight of career guidance. The role of careers leader is well embedded. Providers understand the importance of appropriately qualified careers advisers. A few providers struggle to recruit qualified careers advisers and are training internal staff. In the majority of colleges, staff are receiving training to deliver careers guidance. They are positive about the training opportunities on offer.
All providers engage a wide range of employers in their careers programmes. In general, independent learning providers (ILPs) are more focused on working with their apprentices’ employers and engage less with additional employers or higher education providers.
Providers have mixed views on whether schools promoted technical and vocational routes well enough. Some ILPs and colleges say that apprenticeships are not understood or promoted well enough by schools. A few providers say that schools do not tell learners and parents enough about T levels.
Work experience or industry placements are very important in deciding future career paths. We saw many examples of effective practice. However, in a small number of providers, these are limited or irrelevant to learners’ interests. Some providers cite the pandemic as a reason for this. However, many have adapted quickly to changes in working practices, such as home working, since the pandemic. For example, some offer hybrid work placements.
Prisons
We inspect education, skills and work in prisons and in young offender institutions (YOIs) as part of inspections made by His Majesty’s Inspectorate of Prisons (HMIP).
As reported in previous years, the overall effectiveness of education, skills and work provision in prisons is poor and continues to decline. This year, regimes in many prisons continue to be unstable and highly variable so that the provision of education, skills and work has been unpredictable. Staff shortages across much of the year affect the ability of prisons to offer a full range of purposeful activities.
This year, we contributed judgements to 43 prison and YOI inspections. Of these, only four were judged good overall, 20 were judged requires improvement and 19 were judged inadequate. No prison was judged outstanding during this period. Only one prison or YOI of the 43 improved on its previous inspection outcome. Nineteen prisons received the same judgement and 23 declined.
At year end, 27% of prisons and YOIs were judged good or outstanding. This is 10 percentage points less than last year.

View data in an accessible data format.

The quality of reading education in prisons: one year on
In June 2023, we published a follow-up to our 2022 joint report with HMIP on reading education in prisons.[footnote 75],[footnote 76] It considers the progress that prisons have made in prioritising reading education.
We are encouraged to see that many prisons have acknowledged the importance of reading and have developed reading strategies. However, in most cases, there is still substantial work to do. We recognise the continued challenges the prison sector has faced since the pandemic, and the effect of significant recruitment issues that have limited progress in some prisons.
Shortages of qualified English teachers limit more than half of the inspected prisons’ ability to provide effective reading education. Most prisons have committed to teaching reading beyond formal education and have adopted reading strategies that prioritise non-readers and emerging readers. However, their action plans lack detail. Prisons do not use appropriate assessment to identify the reading-related knowledge and skills that prisoners are missing or need to improve. There are not enough courses for non-readers and emerging readers, nor do prisons set clear pathways to help prisoners learn.
There has been some progress in training staff but too few prisons have trained their staff on how to use phonics to teach reading. A lack of specialist training has a negative impact on the quality of teaching and choice of curriculum content. Prison leaders continue to provide libraries in all prisons but access is limited for too many prisoners. Progress in teaching reading to prisoners who speak English as an additional language is slow.
Our review made recommendations for improvement. For example, leaders should make sure that prisoners’ reading skills are properly assessed and should increase the number of teachers who can use phonics. We will continue to focus on this vital aspect of prison education in our inspections.

Social care
We regulate and inspect children’s social care providers using the social care common inspection framework (SCCIF) and local authority children’s services under the inspecting local authority children’s services (ILACS) framework. Across England, local authorities support around 713,000 children (classed as ‘children in need’) each year.[footnote 77] Over 82,000 of these children are in care.[footnote 78]
By the end of 2022, we had inspected all local authorities under the ILACS framework. We are now returning for second ILACS judgement inspections. Local authority children’s services have continued to improve in difficult conditions. This year, we added a separate care leaver judgement, which has highlighted differences between the experiences of care leavers and children currently in care.
For other social care providers, especially children’s homes, little has changed in overall effectiveness from last year. Issues with workforce recruitment and retention continue to challenge all social care providers and local authorities.
In April 2022, we began our amended approach to joint targeted area inspections (JTAIs). These now include inspections of the multi-agency response to identifying need and risk, and a programme of thematic deep dives.
In April, new regulations for supported accommodation came into force. These require providers who accommodate children in care or care leavers aged 16 and 17 to register with Ofsted. We began accepting applications in April. We have also been consulting on proposals for inspections of supported accommodation, which will begin in April 2024.

Local authority children’s services
State of the nation
We inspect all 153 local authority children’s services in England. Our ILACS inspections look at the overall effectiveness of children’s services, including how they help and protect children, the experiences and progress of children in care and of care leavers, and the impact of leaders. The ILACS framework includes inspections (short and standard) that result in judgements, and activities (such as monitoring visits and focused visits) that do not result in judgements.
At year end, 60% of local authorities were judged to be good or outstanding. This is a slight increase from 56% last year (see annex for data definitions).
Almost all local authorities have grades for the three original ILACS key judgements.

View data in an accessible data format.
What we did this year
This year, we carried out 33 standard and 11 short ILACS inspections in 44 local authorities. We also gave 32 authorities focused visits, where we evaluate an aspect of service, a theme or the experiences of a cohort of children. We carried out 21 monitoring visits in local authorities that had been judged inadequate. These visits focus on the areas that the local authority needs to improve. Six local authorities received more than one monitoring visit this year.
Care leavers judgement
In January 2023, we introduced a fourth judgement: experiences and progress of care leavers. Since then, 26 local authorities have been graded on this judgement. The experiences of care leavers were previously captured in judgements about the experiences of all children in care.

View data in an accessible data format.
Of these 26 ILACS inspections, 13 resulted in different judgements for care leavers than for children in care. These differences in quality were less visible under the previous combined judgement. We are now more easily able to highlight good and poor practice for these distinct groups and make more targeted recommendations.
The separate judgement has also raised the profile of care leavers in our inspections. Inspectors have been able to review in greater depth the things that matter most for these young people. This includes access to education or employment, relationships, and whether the local authority engages care leavers themselves in decisions about available services. The greater depth of evidence we now gather has highlighted uneven offers for care leavers between local authority areas.

Findings from first cycle of ILACS
ILACS is a risk-based and proportionate inspection system. The length and type of inspection vary according to the information we hold about the authority. As well as the standard and short inspection every three to four years, ILACS includes non-inspection activity (a self-evaluation and annual engagement meetings) and focused visits.
After a first ILACS inspection, just over half (55%) of local authorities were graded good or better. By contrast, after a first inspection under the previous framework (single inspection framework – SIF), only 36% of local authorities were graded good or better. Fewer local authorities were graded inadequate after a first ILACS inspection (13%) than after a first SIF inspection (22%).
There is no one reason for this change in profile, but we do see:
- local authorities investing in strengths-based models of social work with families
- leaders working across local authority boundaries in and out of regions
- leaders setting clear direction for their social work teams and engaged in strong multi-agency partnerships.
This is alongside an inspection regime that was designed to support improvement better.
This year, we started to return to local authorities for a second ILACS judgement inspection. This is the first time that local authorities are being inspected under the same framework for successive inspections, which allows us to make further comparisons. At year end, 43 local authorities had received a second ILACS inspection.
Most (37) either retained the same grade (19) or improved (18). Five local authorities improved by two grades, all from inadequate to good. The remaining six declined to inadequate, from either good or requires improvement to be good.

View data in an accessible data format.

Regulated social care
What we did this year
Registration
This year, we received 630 applications to register children’s homes (2,000 places), an increase of around 40% from last year. This is a continuing trend but a much larger increase than previous years’ increases of around 10%. We do not yet know whether the new regulation of supported accommodation has prompted decisions to register as a children’s home. Extending regulation to all provision means that existing providers are deciding whether to register children’s homes or as a supported accommodation provider.
We registered 370 applicants (59%) with 1,220 places. The average number of places in newly approved children’s homes has been steady in the last few years, at three to four places, in line with all homes. However, we know that many children’s homes do not operate at capacity, with some having only one resident child. Around four-fifths of the remaining applications were still in progress at year end. The rest had been withdrawn.
This year, we also received 65 applications to register other social care providers. Residential family centres (39) and independent fostering agencies (21) remain the most common other types of applicant.
Just under half of applications from other provider types were approved (29). The remainder were still in progress at year end (25) or had been withdrawn.

Inspection outcomes for children’s homes receiving first full inspection this year
This year, 410 children’s homes received a first full inspection. The majority of these (74%) were judged good or outstanding. A further 19% were judged requires improvement to be good, and the remaining 7% were judged inadequate. This was similar to previous years.
We reviewed all children’s homes judged inadequate at their first inspection to see if registration decision-making can be improved and to gather insights into sector challenges. The main reasons for children’s homes being rated inadequate at first inspection were:
- failures by leadership to oversee and monitor homes to make sure that they are developing and delivering high-quality, safe care for children
- staff who do not have the skills, experience or knowledge to effectively support and safeguard children
- poor assessment and management of risk.
These reasons were common across all regions and provider group sizes, including standalone children’s homes.[footnote 79]
State of the nation
At year end, there were around 4,000 social care providers across a variety of services, including residential care, and fostering and adoption services. Most are children’s homes (3,290).
This year, there was an 11% increase in the number of children’s homes, continuing a year-on-year increase since 2015. Last year, we introduced multi-building registration of children’s homes. This means that a provider can apply to register a single home where care and accommodation are provided in more than one building. So far, we have received 11 applications for multi-building children’s homes, six of which have been approved. Of the remainder, two withdrew their application and three are still in progress.
This year, we carried out around 3,120 full inspections of children’s homes. Of these, 2,410 resulted in one or more requirements. The two most common reasons for requirements were leadership and management (around 1,140) and protection of children (around 1,050).

View data in an accessible data format.
Eighty-three per cent of children’s homes were judged good or outstanding this year. This is slightly higher than last year (80%).
Table 9: Overall effectiveness of children’s homes this year, by previous overall effectiveness
| Previous overall effectiveness | Total number of inspections | % Outstanding | % Good | % Requires improvement to be good | % Inadequate |
|---|---|---|---|---|---|
| Outstanding | 290 | 46 | 51 | 2 | 1 |
| Good | 1,520 | 8 | 80 | 10 | 2 |
| Requires improvement to be good | 280 | 1 | 66 | 28 | 4 |
| Inadequate | 78 | 1 | 65 | 28 | 5 |
| Not yet inspected | 420 | 4 | 76 | 16 | 4 |
| Total | 2,580 | 11 | 74 | 13 | 3 |
This year, we also conducted around 330 full inspections of other social care providers, most commonly independent fostering agencies. The majority of children in care (70%) live with foster carers, who are not overseen directly by Ofsted but are registered and overseen by independent fostering agencies and local authorities.

View data in an accessible data format.
Of the 660 other social care providers, 93% are currently judged good or outstanding, an increase from last year (91%). Nearly half of these providers are independent fostering agencies, of which 95% are good or outstanding.
Table 10: Overall effectiveness of other social care providers this year, by previous overall effectiveness
| Previous overall effectiveness | Total number of inspections | % Outstanding | % Good | % Requires improvement to be good | % Inadequate |
|---|---|---|---|---|---|
| Outstanding | 110 | 68 | 28 | 4 | 1 |
| Good | 150 | 16 | 74 | 8 | 2 |
| Requires improvement to be good | 25 | 0 | 76 | 16 | 8 |
| Inadequate | 6 | 0 | 33 | 33 | 33 |
| Not yet inspected | 46 | 9 | 76 | 9 | 7 |
| Total | 330 | 30 | 59 | 8 | 3 |
1. Due to the small number of previously inadequate providers inspected, percentages should be treated with caution.
Ownership of social care provision
In August 2023, the 10 largest providers owned 30% of private children’s homes and 31% of private children’s homes places (2,760 places). This was similar to previous years. These 10 providers owned from 37 to 210 homes, and from 120 to 680 places.
Because of the risks associated with this concentration of ownership, the DfE intends to implement a financial oversight scheme. We are working with them on this.
More information on providers of children’s homes is available in a separate Ofsted report.[footnote 80]
Complaints, compliance and enforcement
In regulating children’s social care, we receive and act on information from a variety of sources.
Settings must provide monthly reports (regulation 44 reports) from their independent visitor. They must also notify us about serious incidents relating to children and what they have done in response, and about some matters that do not typically require further action (such as child illness). These are known as safeguarding notifications.
We also receive complaints and child protection concerns about children’s social care settings. These can be from parents or guardians, members of the public or staff in a whistle-blowing capacity. Child protection concerns are usually serious alerts about a child’s welfare. An inspector reviews all the information we receive from any of these sources, and decides our next steps, including the focus and timing of an inspection.
We may take enforcement action in response to complaints and child protection notifications, safeguarding notifications from settings, or concerns identified during inspections and visits. Our actions include:
- compliance notice: setting out what a home must do to comply with the law
- restricting accommodation: the home is not allowed to have any more children until the restriction is lifted
- suspending providers: no more children can move into the home, and children already living there have to be moved elsewhere until the suspension is lifted
- cancelling providers: the home is closed permanently and all children living there have to be moved elsewhere.
In most cases, we act because of serious concerns about children’s safety or about the quality of leadership and management. Given the disruption these acts can have on children’s lives, we do not take these steps lightly. In cases where we restrict, suspend or cancel, the provider has the right to appeal the decision to a tribunal.
Complaints and child protection concerns
This year, we received 1,370 complaints and child protection concerns about 920 social care settings, which is similar to the previous year.
Of these complaints and concerns, 1,100 (81%) had one or more actions recorded at year end. The other cases were still open. The mix of actions was very similar to last year.
Table 11: Number and type of actions taken, this year
| Action taken | Number taken |
|---|---|
| Key line of enquiry for next inspection | 480 |
| Continued monitoring by allocated inspector | 370 |
| Provider-led investigation | 300 |
| Inspection brought forward | 210 |
| Monitoring visit | 77 |
| Referred to child protection team in the relevant local authority | 71 |
| Compliance and enforcement action | 61 |
| Referred to another agency | 28 |
| Other action taken not included in other categories | 280 |
| Total actions taken | 1,880 |
1. One case can have multiple actions.
‘Other action’ includes any action that does not fall under one of the named categories, for example a complaint about a possible unregistered children’s home.
Enforcement action
This year, we issued 560 compliance notices to around 180 providers (5%), which is a similar number of providers to last year.
We also restricted accommodation in 78 providers and suspended the registration of 24 providers. We issued notices of proposal to cancel registration to 15 providers, with most of these resulting in the provider either resigning voluntarily or resolving the concerns before cancellation became necessary. Only one home had its registration cancelled, because of poor leadership and management, serious safeguarding concerns and ongoing failure to meet regulations. In some cases, providers remained suspended or unable to accept any more children while they were working to resolve the concerns. In others, the concerns were fully resolved and all enforcement action ended. Resolution of concerns often included appointment of new managers, and in some cases was demonstrated during visits or inspections.
Some homes that had been subject to regulatory enforcement action chose to resign. Of 180 resignations this year, 35% (62 homes) had been subject to regulatory enforcement activity before resigning. This is an increase from 28% last year.
Number and type of notifications
This year, we received around 36,100 regulation 44 reports from children’s homes. Inspectors review all reports, and they inform inspection lines of enquiry and timing.
In addition, we require children’s homes and independent fostering agencies to provide us with their self-evaluation reports into the quality of their services. This gives inspectors insight into the quality and impact of leaders and managers’ oversight.
This year, we received 39,200 safeguarding notifications. Most were from children’s homes, which form the majority of all social care providers, with an average of five notifications per child living in a children’s home. This was, in part, because of the generally greater needs of children in children’s homes compared with fostered children. Not all provider types are required to make safeguarding notifications to Ofsted, particularly local authority fostering agencies. This year, around two-thirds of children in foster care lived with local authority foster carers.
We have grouped notifications by reason. Around two-fifths of notifications were made under the ‘other serious incidents’ category, which settings use for events that do not fit into any of the other categories. These could include, for example, a fire in the home or the death of a carer.
In many cases, we take no further action as a result of a notification because the setting’s response was appropriate. Inspectors review the overall pattern of notifications as part of our ongoing assessment of risk. This affects the timing of inspections. Other actions can include further investigation or including the notification as a key line of enquiry for the next inspection.
Table 12: Number of notifications and providers by notification reason, this year
| Notification reason | Number of notifications | Percentage of notifications | Number of providers |
|---|---|---|---|
| Incident requiring police involvement* | 10,200 | 26 | 2,360 |
| Allegation of abuse against the home or a person working there~ | 4,200 | 11 | 1,630 |
| Serious illness or accident* | 1,840 | 5 | 440 |
| Child protection inquiry outcome* | 1,750 | 4 | 420 |
| Serious concerns over a missing child | 1,270 | 3 | 570 |
| Serious complaint about a carer or member of staff* | 1,010 | 3 | 240 |
| Involvement or suspected involvement in sexual exploitation* | 840 | 2 | 450 |
| Child protection inquiry instigated* | 730 | 2 | 470 |
| Serious incident of self-harm by a child | 340 | 1 | 220 |
| Section 35 referral of an adult or provision of information to DBS* | 180 | <0.5 | 140 |
| Child has been a perpetrator/victim of serious assault | 140 | <0.5 | 110 |
| Outbreak of infectious disease* | 130 | <0.5 | 71 |
| Death of a child* | 37 | <0.5 | 30 |
| Other incident relating to a child that the registered person considered to be serious~ | 16,600 | 42 | 2,850 |
1. This may include duplicate notifications about the same event. Each notification can be counted under multiple reasons.
2. * against a notification reason indicates it is required for most provider types;~ indicates it is required for children’s homes only. Notification reasons with no marker are not required by law.
3. Notification reasons have been created for summary purposes only therefore do not directly correspond with categories in regulations.

Special educational needs among children in care
The rates of special educational needs (SEN) among children in care are much higher than among the general population of children. This is true across all types of social care provision that we regulate, although the rates do differ substantially between the provider types. We only know the SEN status of children in care if we can match them to a child in the school census. From this matching, we know the SEN status for the majority (68%) of children who are living in Ofsted-registered provision.
Of the children whose SEN status we know, just over half (56%) had SEN, and 44% did not. This was split equally between children who receive SEN support and those who had an EHC plan, which is a higher level of support.
As we would expect, rates of SEN were highest in residential special schools, where almost all children had an EHC plan. These schools are for children with learning difficulties and disabilities. Eighty-four per cent of children living in children’s homes had some form of SEN support, with most having an EHC plan. We reported last year that 43% of children’s homes offer care for children with learning difficulties.[footnote 81]
Rates are lower but still high among children living in foster care, where half of children had some form of SEN support though fewer have an EHC plan. As fostering households provide a family environment, carers are not always able to support the higher levels of SEN that residential provision can meet.
Despite the high rates of SEND among children in care, the overlap between the two has not always been fully recognised in local strategy or government policy. As the social care and SEND reforms are being made at the same time, there is a real opportunity to align policy and practice for these children.

Children we are particularly concerned about
Social care providers help and care for the most vulnerable children. In the wake of lockdowns, with increasing numbers of unaccompanied immigrant children (22% rise in the last five years) and with the rising cost of living, local authorities are looking after more children.[footnote 82] The number of children in care has increased by 9% in the last five years. Additionally, some children are coming into care with more complex needs, and we are particularly worried about these children. For example, demand for mental health support is so high that many children in care are not getting help promptly.
Our concern for other children stems from them being out of sight of many services. These are, for example, children living in unregistered children’s homes or those not attending school regularly.
Lack of joined-up working between agencies and local authorities can also limit oversight and risks children falling through gaps between services. This affects children who live away from their home local authority (around 40% of looked after children) and those who need services from multiple agencies.[footnote 83] This includes children who are homeless, involved in serious youth violence, or being exploited. These children need effective working between a large number of services, including children’s social care, health, housing, youth justice, and the police, for their circumstances to improve.
Recognising the need for more integrated working between agencies, the government has made multi-agency working a focus of its social care reforms. This includes a commitment to improve clarity around the roles and responsibilities of each agency.
Our concerns for children who are out of sight of services also extend to children who are living in closed cultures. These environments can develop when children are away from family for long periods of time, such as when they are living, receiving healthcare and being educated in the same setting. Risks of closed environments increase when children have communication difficulties and are therefore less able to complain about poor treatment or negative experiences.
Children’s mental health
Demand for children’s mental health services has increased in recent years.[footnote 84] Many children experience delays in accessing external support, most notably from children and adolescent mental health services (CAMHS). There are shortages of experienced staff in children’s homes, and of foster carers able to care for children with complex mental health needs. Providers report increased staff anxiety because staff are not confident about responding to mental health needs without timely CAMHS support.
Some local authorities are introducing temporary arrangements in the face of these delays. These include purchasing private mental health services, training staff in therapeutic approaches, and providing their own services to support carers, residential workers and social workers. Others are expanding access points to mental health services for children, such as making them available through early help services. We have seen some instances of local authorities and health services working together to combine budgets to build or commission specialist provision for children with complex mental health problems.
Children’s homes are also adapting their approach to children’s mental health. Examples include hiring in-house mental health services for children and increasing staff training to build confidence and skills in helping children with these needs. In some homes, staff form relationships with their local CAMHS team for guidance on providing therapeutic support. But this is not always enough for children with the most acute needs.
We are pleased to see that the government’s reforms recognise the need to upskill staff in this area.[footnote 85] They commit to building social workers’ and other practitioners’ understanding of children’s mental health needs and their skills to respond to them.

Homeless children aged 16 or 17
When children aged 16 or 17 present as homeless, the local authority should make a joint social work and housing needs assessment. Children should be offered either their own tenancy, where this is appropriate, or a place as a child in care.[footnote 86]
The support these children receive is mixed. In many local authorities, children are offered joint assessments that give genuine options for children to exercise their rights and entitlements. In a minority of authorities, however, this is not the case. We have seen confusion around the legal status of these children, poor communication of their rights, and a lack of robust data collection. Where these children are not monitored effectively, they can fall out of sight of services. Some authorities are improving services, but there are still local authorities that fail to respond effectively.
Some two-tier authorities continue to struggle to work in partnership with district councils.[footnote 87] This is the case even for high-performing authorities, where the service for children aged 16 or 17 presenting as homeless too often needs to improve.
Unaccompanied asylum-seeking children
In the past year, the number of unaccompanied asylum-seeking children entering the country has continued to place significant pressure on local authority children’s social care. At points, there have been several hundred children in Home Office-commissioned hotels. There were reports of children being removed by organised crime groups.
The Independent Chief Inspector of Borders and Immigration (ICIBI) inspected the four hotels in use in April 2022. This was in response to concerns raised with the ICIBI by stakeholders and from its own intelligence-gathering activities. Ofsted accompanied ICIBI to help evaluate children’s experiences. The inspections identified serious concerns in the quality of care and the safeguarding of children.
His Majesty’s Chief Inspector has consistently expressed concerns about the use of unregulated hotels to accommodate lone vulnerable children. Ofsted is a member of the cross-government taskforce working to find alternatives. We have advised on how regulatory frameworks for children’s homes and new arrangements for supported accommodation could provide better alternatives to hotels. In July 2023, the High Court ruled that systematic and routine use of hotels to accommodate unaccompanied asylum-seeking children is unlawful. This ruling, along with outcomes from other court cases in the last year, has provided legal clarity around local authorities’ responsibilities to unaccompanied asylum-seeking children and the Home Office’s powers to accommodate them. This clarity had been missing over the previous few years, despite the increase in children entering the country over that period. In September, Ofsted accompanied ICIBI to advise and assist them in their inspection of the remaining two hotels still being used to accommodate children temporarily.
Hotels are being used to accommodate children in Kent before they move to another local authority area under the national transfer scheme (NTS). The scheme was mandated in 2021, to reflect the fact that supporting unaccompanied asylum-seeking children is a UK-wide responsibility and to address the strain on local authorities that are points of entry to the UK. It is expected that local authorities accept transfers until unaccompanied asylum-seeking children make up 0.1% or more of their general child population. The threshold was increased from 0.07% in August 2022 in response to continuing demand on port authorities.
Unaccompanied asylum-seeking children must be looked after by the responsible local authority which owes them the same duties as all other children in care, including permanence planning. Plans should ensure that children have a secure, stable and loving family to support them through childhood and beyond.
The Illegal Migration Act 2023 gained Royal Assent in July 2023. Currently, some aspects of the Act have commenced, but not all. The commencement of the remaining aspects is likely to be ongoing and iterative. The Act introduced provision that could result in some unaccompanied young people being removed from the UK after they turn 18. This creates potentially conflicting expectations and practice standards for asylum-seeking children. Social workers currently help asylum-seeking children plan for their futures while they apply to be allowed to remain. The Illegal Migration Act will require children to be prepared for contingencies such as detention or removal to another country. The DfE’s expectations for the care of these children will need to be clearly defined, so that local authorities can meet them, and we can judge what this means for children’s best interests at inspection. This will be more complicated if there are different entitlements for children in different contexts.

Pressures in social care
For many years, social care services have been under considerable pressure due to high demand, problems with staff recruitment and retention, and insufficient places for children to live. Lockdowns and their aftermath, along with the increased cost of living, have compounded these and other pressures. Local authorities report higher numbers of children having contact with front door children’s services.
The best performing local authorities and providers have mitigated these issues, to provide continually good, and sometimes improved, practice for children and their families. However, there is still too much national disparity in the services and support children receive.
Ongoing challenges for Cafcass and the family court
Demand for Children and Family Court Advisory and Support Service (Cafcass) services remains extremely high as pandemic backlogs in the family court are worked through. Longer case durations and high numbers of new cases, which are outside Cafcass’s control, have exacerbated the problem. To understand how Cafcass is managing in this context, we did a focused visit in January 2023.[footnote 88] At that time, there were approximately 6,600 (14%) more children with cases open to Cafcass than before the pandemic. Around 5,000 children had been in court proceedings for over 52 weeks. Eight hundred and thirty-five children had been in public law proceedings and 3,500 in private law proceedings for over 100 weeks.[footnote 89] The government’s social care reforms recognise the need to tackle court delays.[footnote 90]
Despite the high demand, Cafcass has sustained and improved the focus on children’s safety and welfare. It has led and developed creative and highly effective strategies in collaboration with national and regional partners to maintain high-quality services to children, families and the family court. Senior leaders have a comprehensive understanding of the pressures in the family justice system, and what the associated delays mean for the children involved.
In a challenging context, senior leaders have pushed forward with national and regional improvement priorities. As a result, Cafcass continues to meet its statutory responsibilities for children, the quality of social work practice remains strong and, overall, continues to improve.

Workforce vacancy rates and qualifications
Staffing challenges are still significant in the social care sector. The problems with recruiting and retaining workers are particularly apparent in children’s homes. At year end, 12% of children’s homes did not have a registered manager in post. Of those with a registered manager, 40% had a manager who had been in post for less than a year. A further 2% of children’s homes did not have a responsible individual in post. This was similar to last year. This leaves a significant gap in oversight of what is happening for children.
In 2022–23, 35% of permanent care staff in children’s homes left their role and 42% were newly hired. Although these rates are similar to previous years, local authorities and providers report that many staff, particularly those in roles that require low or no qualifications, are leaving for better paid jobs in other industries. Those with more qualifications are moving to agency work that offers higher pay. Very high turnover creates instability for children and reduces the chances of building the relationships that are important for children’s well-being and sense of belonging.
Permanent staff in children’s homes are required to gain one of three level 3 qualifications within two years of starting work. We collect data on these qualifications. Our latest data shows around half of children’s homes staff held a required level 3 qualification (54%), down from 61% four years ago. Just under two thirds (64%) of registered managers held the level 5 diploma in leadership and management for residential childcare. This proportion has increased over the last few years, from 50% in 2018–19.
Managers have up to three years to gain the level 5 diploma and so many start in post with level 4 (leadership and management for care services). In total, 77% of registered managers had at least the level 4 diploma. This has increased over the last few years, from 71% in 2018–19. Many registered managers without these diplomas may hold other equivalent qualifications.
Movement of children with the highest needs
The reduction in mental health in-patient beds and care means that there are now more children who have complex needs or who are a significant risk to themselves or others but who cannot find a suitable home in the community. This means that children’s social care services are finding and funding provision for children who might otherwise have been in health facilities. These children fall into one or more of the following categories:
- they do not meet the criteria for a secure accommodation order
- they cannot live in a secure children’s home (SCH) because of placement shortages
- they would not get their needs met in an SCH even if there was space available.
At the same time, the shortage of places for children with more complex needs has meant that providers know they are almost guaranteed to fill places. Many are therefore more selective about the children they accept, often preferring those with simpler needs. This leaves local authorities ‘chasing’ homes for children and children living too far away from their family or in a home that cannot fully meet their needs, or both.
Carers for children with complex needs need a broad skillset and input from multiple partner agencies. We surveyed local authorities this year about their experience of finding homes for children with complex needs. Ninety-one per cent said they ‘often’ or ‘always’ experience difficulties, particularly when children’s primary needs relate to behaviour or mental health.[footnote 91] Competition for places for these children pushed up placement costs.
Shortage of secure children’s homes
There is, as there has been for the last few years, a shortage of secure children’s homes places in England. There were 13 secure children’s homes at year end. Of these, 12 are run by local authorities and one by a voluntary organisation. They offer a total of 224 places, of which:
- 123 are for children whom the courts consider to be a significant risk to themselves or others and cannot be kept safe by any other placement
- 101 are commissioned by the Youth Custody Service for children who have been remanded in custody by the courts or are serving a custodial sentence.
On an average day, around 140 children are living in secure children’s homes (around 75 in places for children considered a risk by courts, and around 65 in custody places). Around 50 children each day are waiting for a place and around 10 are placed by English local authorities in Scottish secure units due to the lack of available places in England. As well as the shortage of secure children’s homes places, there is also a lack of in-patient mental health provision. For some children, the kind of provision they need simply does not exist. Local authorities are left creating bespoke arrangements as a result, some of which sit outside any regulatory regime. The distribution of secure homes is uneven across the country, with none in London or the West Midlands, heightening the problem in some areas.
As well as factors affecting the whole children’s social care sector, secure children’s homes’ capacity is limited by some children’s increasingly complex needs and some ageing buildings. As a result, secure children’s homes are often operating at reduced capacity. One is currently closed but expected to reopen.
The difficulties that local authorities face in finding secure accommodation have contributed to the growing numbers of children subject to deprivation of liberty orders. Between July 2022 and May 2023, applications were made for 1,140 children, which is almost double the level of two years before.[footnote 92], [footnote 93] These higher numbers are particularly concerning because many of these children are placed in unregistered settings. Ofsted does not always know where these children are living or under what restrictions.
Use of unregistered children’s homes
As well as being used for children subject to deprivation of liberty orders, unregistered children’s homes are being used as a ‘stop-gap’ for children for whom local authorities cannot find suitable placements. Although these homes are often a last resort and intended to be temporary, the national shortage of placements for children with complex needs means some particularly vulnerable children live in these settings for long periods.
Alongside our regulatory work, we receive and investigate notifications about possible unregistered children’s homes. This year, we completed investigations into 530 possible unregistered settings. Of these:
- 370 settings (70%) should have been registered. In most cases, we sent warning letters to the home, and also to all local authorities to make them aware of the risks. A small number have since applied to register and most of the remainder have ceased operating
- 110 settings (20%) did not need to be registered or were used for very short-term temporary placements that had ended by the time of investigation. These settings were fairly evenly split between providers of supported accommodation and similar unregulated placements, and temporary placements that had since ended
- the remaining 10% were situations that included incorrect notifications and notifications that we were unable to follow up.
As well as the 530 completed investigations, some investigations were still open at the end of the year.
Most of our work (83%) on possible unregistered children’s homes followed a notification of the placement by the placing local authority. Most placements were made because the local authority was unable to find a suitable regulated option (78%). The next most common source of notification (4%) was Ofsted identifying a potentially unregistered children’s home during inspection.
Sufficiency of care places
There are continuing issues with the availability of suitable places in the right location.
Overall, the number of children’s homes and of children’s homes places has increased since last year. The number of children’s homes increased by 9%, and places by 5%. Despite this, local authorities are still struggling to find the right homes for children in their care.[footnote 94] In part, this is because homes, and particularly specialist homes, are not evenly spread across the country. Homes continue to open disproportionately in the regions where numbers are already the highest. The North West accounts for a quarter of all children’s homes and almost a quarter of all places. The distribution of homes, including new home openings, does not reflect the distribution of need.
The number of registered places also does not reflect the number of places available. More homes are operating below their registered capacity. This can be because the complexity of a child’s needs means that a solo placement is commissioned, so other places are blocked. While solo placements might be right for some children, we remain concerned at the continuing rise in children living alone and with very high staffing numbers. In some cases, the home charges the local authority for all the places, despite caring for only one child. In other examples, homes are caring for fewer children because they cannot recruit enough staff.
These factors are resulting in poor experiences for some children. More are living in homes that cannot fully meet their needs, in unregistered places or in places that are far from their previous home. Moving away from their local area can disrupt children’s access to services and education, as well as their contact with friends and family. A report we published last year shows the number of homes in England that can care for children with different types of needs.[footnote 95] It highlighted the unequal regional distribution of homes, as well as the limited numbers of homes able to provide some specialised types of care.
With placements being made based on availability rather than suitability, placement breakdowns are more likely. Moving to a new placement brings further instability for children.
Local authority approaches to addressing sufficiency issues vary a lot.[footnote 96] Some of the better examples focus on:
- investing in ‘edge of care’ and reunification work
- partnership working and joint-commissioning agreements between local authorities or with charities
- improving the fostering offer and recruitment strategies to attract carers.
Sufficiency of fostering places was highlighted as an issue in the care review.[footnote 97] The review stated that 9,000 foster carers need to be recruited over the next three years to provide for children in care, including some children in children’s homes, who would be better suited to living in a family environment with a foster carer. The government’s proposed reforms commit to investing in this area, to boost approvals of new carers in locations where demand is highest and to increase support for foster carers, enabling them to continue fostering.
There are currently just over 35,000 mainstream fostering households in England, down 6% over the past five years.[footnote 98]
In March 2023, there were 72,800 mainstream fostering places, down 7% from five years ago. Of these, 61% were filled (44,600), 17% were vacant (12,100) and the rest were not available (for example, due to the needs of children in placement, carers taking a break or the specific type of care the carers were approved to provide). The proportion of vacant places has fallen from 22% in March 2018. This may make it more difficult for local authorities to find suitable placements to meet a child’s needs around, for example, location, other children in the household and experience level of carers.
In addition to investing in residential care and fostering, the government’s reforms emphasise kinship care. Seen as a way of keeping more children within families, the government has committed to developing a kinship care strategy and to fund and support training for kinship carers. Currently, 19% of foster households are providing kinship care, an increase from 14% five years ago. This equates to around 14% of all fostering places – again, an increase from 10% five years ago. More information on kinship foster care is available in the fostering in England 2023 national statistics.[footnote 99]
Multi-agency child protection work
In April 2022, we introduced a revised approach to our multi-agency inspections. We replaced single joint targeted area inspections (JTAI) with two models. These are:
- inspections of the multi-agency response to identifying initial need and risk (sometimes referred to as ‘the front door’)
- a programme of thematic deep dives.
Early help JTAI
We carried out thematic joint targeted area inspections in five local areas between December 2022 and March 2023, looking at the multi-agency response to children and families who need help.[footnote 100] Inspectors reviewed the effectiveness of multi-agency arrangements that identify families and deliver support.
During these JTAIs, we saw some excellent work at both a strategic and a practice level. However, the most striking finding was the variability in early help between local areas. This was in relation to both what was available to children and families and how support was provided. This includes different understanding in different local authorities about the role of early help, significant variation in strategy and practice, and differing capacity across geographical areas and across partners.
We saw well-trained and knowledgeable early help workers undertaking effective work with children and families, to meet their needs and reduce risk. However, achieving the full vision of the government reforms is likely to be inhibited by a lack of capacity across agencies. More investment and priority will need to be given to early help at all levels and across all agencies. This would maximise what already exists and build more capacity into the system. There needs to be more emphasis on statutory partners to make sure that there is effective oversight of early help, including evaluation of the impact. Critically, schools need to be involved with partners at both a strategic and a practice level.
Resource pressures made it hard for all areas to prioritise early help. We found that strategic oversight and evaluation of partnership arrangements, including information sharing and communication, are critical to successful early help services. These services work well when partners know their communities well. Services can then be tailored to meet local need, making them more accessible. Families need access to the right help at the right time, which in some cases will mean quickly stepping up to statutory social care. Consistent workers through these transitions can improve the experience for families.
The specific weaknesses that we found in some of the local areas we visited included:
- a lack of prioritisation and oversight
- weak processes, such as no identified lead professional, assessment, or plan
- lack of multi-agency working
- children’s needs and risks not always being matched to lead professionals with sufficient skills, experience and knowledge.
Front door JTAI
The multi-agency response at the front door is critical in ensuring that children get the right help at the right time. There is a lot to celebrate in the areas that we have inspected so far. We have seen a strong focus on improving the multi-agency response to children, with professionals from different agencies working well together. They understand their roles well. We saw joint-working with some effective systems and in supportive cultures. The best partnerships are committed to a learning culture and work together towards shared priorities; accountability is clear and challenge is welcome.
The areas for improvement remain similar to those seen on previous JTAIs. Better information-sharing and communication are needed. Strategy meetings do not always consider all the relevant information in decision making and outcomes are not consistently shared in a timely way. Children’s voices and experiences are not always gathered and recorded. In some areas, limited capacity across health, police and children’s services creates challenges and, despite some mitigation, leads to delays in responding to children. As reported previously, the local safeguarding children’s partnership has a critical role in quality assurance and scrutiny. In examples where this partnership was working well, they were able to identify and act on where improvement is needed. Where oversight is strong, children and families benefit.
Serious youth violence JTAI
We are conducting a series of joint targeted area inspections looking at multi-agency responses to children impacted by serious youth violence.[footnote 101] These are looking at how partnership responses are made at a strategic and practice level. We are focusing on children’s experiences to look at how partners work together to improve outcomes for children and meet their needs for protection and support. We are also looking at partnership interventions in places and spaces such as local neighbourhoods, schools and parks, to prevent serious youth violence and make communities safer for all children and families.
Looking forward
Government social care reforms
This year, the government published its strategy for the reform of children’s social care, called ‘stable homes, built on love’.[footnote 102] We welcome the review, because many of the reforms reflect issues that we have previously raised. We have responded formally.[footnote 103] The review’s focus on families is positive. For most children, the family setting is where they will do best. We also welcome the intended review of the regulatory system. We have long said that the Care Standards Act is out of date.
As with any major reform programme, there are areas where reforms could have unintended consequences. Part of the value of inspection is as a system lever that can help mitigate these. We see benefits in a system that brings targeted early help and child in need work together. Managing risk carefully and making sure that the system does not become overwhelmed will require careful work and good oversight, especially given that the workforce is already stretched.
For children with very specialist and multiple needs, the concept of regional care cooperatives (RCCs) is intended to help local authorities work together to find solutions. We have been asked to look thematically at the work of regional adoption agencies and hope this can inform thinking about regional care cooperatives.
We hope that the reform’s focus on social workers will help to develop a bigger pipeline of high-quality leaders in children’s services, to address the national shortage. The reforms would also benefit from extending to the wider workforce, such as those in residential care.
We will continue to offer our best advice to government as the reforms develop. Our ILACS inspections of local authority children’s services will support the changes that occur through reforms, iterating carefully and informed by sector engagement. Our SCCIF inspections will continue to focus on children’s progress and experiences.
We regulate and inspect proportionately and with great care in a time of change. We expect the reforms, if properly resourced and well implemented, to improve both. We will keep children and families front and centre and continue to work collaboratively with local authorities and providers to improve outcomes for children.

Supported accommodation
This year, the government published regulations for supported accommodation for children in care and care leavers aged 16 and 17. We began accepting applications to register providers of supported accommodation in April 2023. All providers were required to apply by 28 October, when the regulations came into force. By the application deadline, there were 680 proposed or active providers, operating a total of 5,930 premises.
Meanwhile, we have consulted on how we propose to inspect this provision, which will begin in April 2024. We have also worked closely with care-experienced people to inform our proposals and consultation. Their experiences and insight are helping us focus on what matters most to children in supported accommodation. We have also had extensive discussions with other interested parties, including local authorities, providers and children’s advocacy charities. The views of users and stakeholders, combined with a review of the available research, will provide a firm evidence base for our inspection methodology. We will publish our consultation response and inspection guidance for providers and inspectors in February 2024.
There is broad agreement in children’s social care that independent oversight of supported accommodation is necessary and long overdue. This is despite the pressure that increased regulation undoubtedly brings to a sector that is challenged by wider sufficiency issues. In particular, the oversight will give much-needed extra intelligence about the extent of unregistered residential provision and will help us to take action when necessary to safeguard children and young people.
The launch of the secure academy and secure children’s home
We welcome the development of the secure academy. Described by government as ‘a school inside the prison walls’, the project is based on international, peer-reviewed research. This shows that small settings that offer high-quality education and healthcare, provided by specialised teachers and youth workers, are valuable in rehabilitating young people in custody.
We have been advising the Ministry of Justice (MoJ) and Youth Custody Service (YCS) on its regulation as the government redevelops a former secure training centre. The academy opening date is planned for March 2024. We will continue to advise MoJ and YCS on this dual status provision (16-19 academy and secure children’s home) and how it can operate within the regulatory frameworks.
Annex
Reference to ‘this year’ or 2022/23 includes inspections that took place between 1 September 2022 and 31 August 2023 and with a report published by 30 September 2023. The exceptions are area SEND and prisons. The reports for area SEND inspections were published by 10 November 2023. Prisons includes all inspections published between 1 September 2022 and 31 August 2023. Some settings or schools or providers can be inspected more than once within the year. The figures show the number of inspections that took place during the year.
Reference to ‘at year end’ includes the latest inspection grades for all settings, schools, providers or local authorities on 31 August 2023 and with a report published by 30 September 2023. The exception is prisons – the reports for these inspections were published by 31 August 2023.
Numbers over 100 have been rounded, with the exception of prisons in Figure 24 and local authorities in Figures 25 and 27, where rounding has not been applied.
On charts and tables, percentages have been rounded and may not add to 100.
Totals may not sum due to rounding.
Further information on how inspection data is counted and calculated can be found in the methodology documents that accompany our official statistics:
Early years: Methodology: childcare providers and inspections as at 31 August 2023.
State-funded schools: Methodology: state-funded schools inspections and outcomes as at 31 August 2023.
Independent schools: Methodology: Non-association independent schools inspections and outcomes in England 2023.
Children’s social care: Methodology: children’s social care in England 2022 to 2023.
Initial teacher education: Methodology: Initial teacher education inspections and outcomes as at 31 August 2023.
Further education and skills: Methodology: further education and skills inspections and outcomes as at 31 August 2023.
Annex: data tables for figures
This section contains data for all figures in an accessible table format.
Data for Figure 1: Overall effectiveness and key judgements of early years providers, this year
| Judgement | Number of inspections | % Outstanding | % Good | % Requires improvement | % Inadequate |
|---|---|---|---|---|---|
| Overall effectiveness | 12,300 | 10 | 75 | 7 | 8 |
| Quality of education | 12,300 | 10 | 77 | 8 | 5 |
| Behaviour and attitudes | 12,300 | 11 | 76 | 7 | 5 |
| Personal development | 12,300 | 10 | 75 | 7 | 8 |
| Leadership and management | 12,300 | 10 | 75 | 7 | 8 |
See Figure 1.
Data for Figure 2: Overall effectiveness of early years providers, at year end
| Provider type | Total number of providers | % Outstanding | % Good | % Requires improvement | % Inadequate |
|---|---|---|---|---|---|
| All EYR providers | 38,000 | 14 | 83 | 2 | 1 |
| Childminders | 21,700 | 12 | 85 | 2 | 1 |
| Nurseries and pre-schools | 16,100 | 16 | 79 | 3 | 1 |
| Childcare on domestic premises | 160 | 18 | 74 | 3 | 4 |
See Figure 2.
Data for Figure 3: Joiners and leavers in the childcare sector, over time
| Academic year | Joiners | Leavers | Total number of providers |
|---|---|---|---|
| 2015/16 | 9,740 | 14,100 | 82,700 |
| 2016/17 | 10,000 | 12,100 | 80,700 |
| 2017/18 | 9,140 | 10,900 | 78,900 |
| 2018/19 | 7,870 | 10,600 | 76,200 |
| 2019/20 | 7,680 | 8,550 | 75,300 |
| 2020/21 | 7,140 | 11,500 | 71,000 |
| 2021/22 | 5,850 | 11,300 | 65,600 |
| 2022/23 | 6,510 | 9,820 | 62,300 |
See Figure 3.
Data for Figure 4: Overall effectiveness, key judgements and provision judgements of state-funded schools at graded inspections, this year
| Judgement | Number of inspections | % Outstanding | % Good | % Requires improvement | % Inadequate |
|---|---|---|---|---|---|
| Overall effectiveness | 3,720 | 7 | 70 | 20 | 3 |
| Quality of education | 3,720 | 7 | 71 | 20 | 2 |
| Behaviour and attitudes | 3,720 | 17 | 73 | 9 | 2 |
| Personal development | 3,720 | 20 | 73 | 7 | 1 |
| Leadership and management | 3,720 | 10 | 71 | 16 | 3 |
| Early years provision | 2,730 | 12 | 75 | 11 | 2 |
| Sixth-form provision | 460 | 24 | 68 | 8 | 0 |
See Figure 4.
Data for Figure 5: Overall effectiveness of state-funded schools by phase, at year end
| Phase | Number of schools | % Outstanding | % Good | % Requires improvement | % Inadequate |
|---|---|---|---|---|---|
| All schools | 21,800 | 16 | 73 | 9 | 3 |
| Primary | 16,700 | 14 | 76 | 8 | 2 |
| Secondary | 3,360 | 16 | 66 | 13 | 5 |
| Special | 1,040 | 35 | 54 | 6 | 4 |
| Nursery | 380 | 62 | 35 | 2 | 1 |
| Alternative provision | 320 | 18 | 68 | 9 | 5 |
See Figure 5.
Data for Figure 6: Overall effectiveness of previously exempt schools at graded inspections by phase, since the lifting of the outstanding exemption
| Phase | Number of schools | % Outstanding | % Good | % Requires improvement | % Inadequate |
|---|---|---|---|---|---|
| All previously exempt schools | 930 | 19 | 65 | 14 | 3 |
| Total primary | 650 | 15 | 68 | 15 | 3 |
| Primary 2022/23 | 380 | 16 | 70 | 12 | 2 |
| Primary 2021/22 | 270 | 14 | 65 | 18 | 4 |
| Total secondary | 270 | 28 | 57 | 11 | 3 |
| Secondary 2022/23 | 170 | 31 | 60 | 8 | 1 |
| Secondary 2021/22 | 110 | 24 | 53 | 16 | 7 |
See Figure 6.
Data for Figure 7: Comparison of the overall effectiveness and behaviour and attitudes judgements of state-funded schools at graded inspections, this year
| Phase | Number of inspections | Judgement | % Outstanding | % Good | % Requires improvement | % Inadequate |
|---|---|---|---|---|---|---|
| Primary | 2,810 | Overall effectiveness | 5 | 73 | 19 | 2 |
| Primary | 2,810 | Behaviour and attitudes | 15 | 78 | 6 | 0 |
| Secondary | 750 | Overall effectiveness | 11 | 60 | 23 | 7 |
| Secondary | 750 | Behaviour and attitudes | 17 | 59 | 18 | 5 |
See Figure 7.
Data for Figure 8: Overall effectiveness, key judgements and provision judgements of non-association independent schools, this year
| Judgement or provision | Number of inspections | % Outstanding | % Good | % Requires improvement | % Inadequate |
|---|---|---|---|---|---|
| Overall effectiveness | 410 | 9 | 58 | 19 | 14 |
| Quality of education | 410 | 10 | 62 | 19 | 9 |
| Behaviour and attitudes | 410 | 22 | 66 | 9 | 3 |
| Personal development | 410 | 23 | 57 | 16 | 4 |
| Leadership and management | 410 | 11 | 58 | 17 | 14 |
| Early years provision | 52 | 12 | 67 | 15 | 6 |
| Sixth-form provision | 66 | 14 | 65 | 14 | 8 |
See Figure 8.
Data for Figure 9: Overall effectiveness and compliance with the independent school standards of non-association independent schools by school type, at year end
| School type | Number of schools | % Outstanding | % Good | % Requires improvement | % Inadequate | % Independent school standards met | % Independent school standards not met |
|---|---|---|---|---|---|---|---|
| All non-association independent schools | 1,060 | 10 | 65 | 16 | 10 | 83 | 17 |
| Independent special schools | 600 | 11 | 70 | 14 | 4 | 90 | 10 |
| Other independent schools | 240 | 11 | 60 | 15 | 14 | 78 | 22 |
| Independent faith schools | 220 | 4 | 57 | 20 | 19 | 69 | 31 |
1. Special faith schools are grouped with special schools.
See Figure 9.
Data for Figure 10: Overall effectiveness of faith schools, at year end
| School type | Number of schools | % Outstanding | % Good | % Requires improvement | % Inadequate |
|---|---|---|---|---|---|
| State-funded faith schools | 6,800 | 15 | 75 | 8 | 2 |
| Non-association independent faith schools | 220 | 4 | 57 | 20 | 19 |
1. Faith schools are defined here as not a special school and with a stated religious character or ethos as declared to the DfE. There are a small number of special schools with a religious character or ethos which are not included in this chart.
See Figure 10.
Data for Figure 11: Overall effectiveness, key judgements and provision judgements of state-funded special schools at graded inspections, this year
| Judgement | Number of inspections | % Outstanding | % Good | % Requires improvement | % Inadequate |
|---|---|---|---|---|---|
| Overall effectiveness | 120 | 17 | 57 | 20 | 5 |
| Quality of education | 120 | 17 | 58 | 22 | 3 |
| Behaviour and attitudes | 120 | 31 | 57 | 10 | 3 |
| Personal development | 120 | 31 | 58 | 9 | 2 |
| Leadership and management | 120 | 18 | 62 | 15 | 5 |
| Early years provision | 33 | 33 | 55 | 12 | 0 |
| Sixth-form provision | 47 | 17 | 72 | 11 | 0 |
See Figure 11.
Data for Figure 12: Overall effectiveness, key judgements and provision judgements of non-association independent special schools, this year
| Judgement or provision | Number of inspections | % Outstanding | % Good | % Requires improvement | % Inadequate |
|---|---|---|---|---|---|
| Overall effectiveness | 260 | 11 | 63 | 19 | 7 |
| Quality of education | 260 | 11 | 66 | 18 | 4 |
| Behaviour and attitudes | 260 | 24 | 65 | 9 | 2 |
| Personal development | 260 | 26 | 60 | 12 | 2 |
| Leadership and management | 260 | 13 | 64 | 16 | 7 |
| Sixth-form provision | 43 | 14 | 70 | 12 | 5 |
1. Early years provision was judged on four inspections, two graded outstanding and two graded good.
See Figure 12.
Data for Figure 13: Overall effectiveness of special schools, at year end
| School type | Number of schools | % Outstanding | % Good | % Requires improvement | % Inadequate |
|---|---|---|---|---|---|
| State-funded special schools | 1,040 | 35 | 54 | 6 | 4 |
| Non-association independent special schools | 600 | 11 | 70 | 14 | 4 |
1. State-funded special schools includes non-maintained special schools.
See Figure 13.
Data for Figure 14: Overall effectiveness and key judgements of state-funded alternative provision at graded inspections, this year
| Judgement | Number of inspections | % Outstanding | % Good | % Requires improvement | % Inadequate |
|---|---|---|---|---|---|
| Overall effectiveness | 34 | 15 | 41 | 24 | 21 |
| Quality of education | 34 | 15 | 44 | 21 | 21 |
| Behaviour and attitudes | 34 | 21 | 50 | 12 | 18 |
| Personal development | 34 | 24 | 47 | 15 | 15 |
| Leadership and management | 34 | 15 | 44 | 21 | 21 |
See Figure 14.
Data for Figure 15: Overall effectiveness of alternative provision, at year end
| School type | Number of schools | % Outstanding | % Good | % Requires improvement | % Inadequate |
|---|---|---|---|---|---|
| State-funded alternative provision | 320 | 18 | 68 | 9 | 5 |
| Non-association independent schools with alternative provision | 740 | 11 | 65 | 15 | 9 |
See Figure 15.
Data for Figure 16: Overall effectiveness and key judgements of ITE age phase partnerships, this year
| Judgement | Number of inspections | Outstanding | Good | Requires improvement | Inadequate |
|---|---|---|---|---|---|
| Overall effectiveness | 110 | 33 | 66 | 4 | 5 |
| The quality of education and training | 110 | 33 | 66 | 6 | 3 |
| Leadership and management | 110 | 37 | 62 | 4 | 5 |
See Figure 16.
Data for Figure 17: Overall effectiveness of ITE age phases, this year
| Age phase | Number of inspections | Outstanding | Good | Requires improvement | Inadequate |
|---|---|---|---|---|---|
| All age phases | 110 | 33 | 66 | 4 | 5 |
| Primary | 31 | 13 | 17 | 0 | 1 |
| Secondary | 29 | 7 | 21 | 0 | 1 |
| Primary and secondary | 32 | 11 | 19 | 2 | 0 |
| Further education | 12 | 0 | 7 | 2 | 3 |
| Early years | 4 | 2 | 2 | 0 | 0 |
See Figure 17.
Data for Figure 18: Overall effectiveness of ITE age phase partnerships inspected, over time
| Academic year | Number of inspections | Outstanding | Good | Requires improvement | Inadequate |
|---|---|---|---|---|---|
| 2022/23 | 110 | 33 | 66 | 4 | 5 |
| 2021/22 | 76 | 6 | 48 | 16 | 6 |
| 2020/21 | 36 | 1 | 16 | 12 | 7 |
| 2019/20 | 7 | 5 | 2 | 0 | 0 |
| 2018/19 | 62 | 29 | 32 | 1 | 0 |
| 2017/18 | 70 | 26 | 39 | 5 | 0 |
| 2016/17 | 48 | 12 | 34 | 1 | 1 |
| 2015/16 | 88 | 33 | 47 | 8 | 0 |
| 2014/15 | 17 | 1 | 13 | 2 | 1 |
See Figure 18.
Data for Figure 19: Overall effectiveness, key judgements and provision judgements of FE and skills providers at full inspections, this year
| Inspection judgement | Total number of providers with an inspection judgement | % Outstanding | % Good | % Requires improvement | % Inadequate | |
|---|---|---|---|---|---|---|
| Overall effectiveness | 510 | 7 | 60 | 26 | 6 | |
| Quality of education | 510 | 8 | 62 | 25 | 5 | |
| Behaviour and attitudes | 510 | 17 | 72 | 10 | 1 | |
| Personal development | 510 | 11 | 63 | 24 | 2 | |
| Leadership and management | 510 | 8 | 59 | 27 | 6 | |
| Education programmes for young people | 140 | 15 | 64 | 19 | 1 | |
| Adult learning programmes | 170 | 10 | 68 | 19 | 3 | |
| Apprenticeships | 410 | 5 | 63 | 27 | 5 | |
| Provision for learners with high needs | 130 | 17 | 60 | 21 | 2 |
See Figure 19.
Data for Figure 20: Overall effectiveness of FE and skills providers, at year end
| Provider group | Total number of providers with an inspection judgement | % Outstanding | % Good | % Requires improvement | % Inadequate |
|---|---|---|---|---|---|
| All FE and skills providers | 1,540 | 9 | 70 | 17 | 4 |
| Colleges | 210 | 13 | 79 | 7 | 0 |
| Independent learning providers | 950 | 5 | 66 | 23 | 6 |
| Adult community education providers | 140 | 1 | 95 | 2 | 1 |
| 16 to 19 academies | 59 | 54 | 44 | 2 | 0 |
| Higher education institutions | 59 | 5 | 83 | 12 | 0 |
| Independent specialist colleges | 97 | 7 | 70 | 21 | 2 |
| Dance and drama colleges | 18 | 83 | 17 | 0 | 0 |
1. ‘Independent learning providers’ includes employer providers.
2. ‘Colleges’ includes general FE colleges, sixth-form colleges and specialist FE colleges.
See Figure 20.
Data for Figure 21: Quality of adult education provision, at year end
| Date as at: | Total number of providers with an adult education judgement | Full inspection % outstanding | Full inspection % good | Full inspection % requires improvement | Full inspection % inadequate | New provider monitoring visit % at least reasonable in all adult education themes | New provider monitoring visit % insufficient in one or more adult education themes | |
|---|---|---|---|---|---|---|---|---|
| 31 August 2023 | 550 | 8 | 72 | 10 | 1 | 8 | 1 |
See Figure 21.
Data for Figure 22: Quality of apprenticeship provision, at year end over time
| Date as at: | Total number of providers with an apprenticeship judgement | Full inspection % outstanding | Full inspection % good | Full inspection % requires improvement | Full inspection % inadequate | New provider monitoring visit % at least reasonable in all apprenticeship themes | New provider monitoring visit % insufficient in one or more apprenticeship themes | |
|---|---|---|---|---|---|---|---|---|
| 31 August 2023 | 1,260 | 5 | 56 | 19 | 3 | 15 | 2 | |
| 31 August 2022 | 1,280 | 5 | 46 | 15 | 4 | 26 | 5 | |
| 31 August 2021 | 1,180 | 4 | 34 | 11 | 1 | 43 | 7 |
See Figure 22.
Data for Figure 23: Apprenticeship starts by level, over time
| Year | Apprenticeship starts at level 2 | Apprenticeship starts at level 3 | Apprenticeship starts at level 4+ | Total |
|---|---|---|---|---|
| 2015/16 | 291,330 | 190,870 | 27,160 | 509,360 |
| 2016/17 | 260,650 | 197,660 | 36,570 | 494,880 |
| 2017/18 | 161,390 | 166,220 | 48,150 | 375,760 |
| 2018/19 | 143,590 | 174,730 | 75,060 | 393,380 |
| 2019/20 | 99,220 | 140,840 | 82,460 | 322,530 |
| 2020/21 | 84,150 | 138,490 | 98,810 | 321,440 |
| 2021/22 | 91,520 | 151,310 | 106,360 | 349,190 |
See Figure 23.
Data for Figure 24: Overall effectiveness of education, skills and work provision in prisons and YOIs, at year end over time
| Date as at: | Total number of providers with an inspection judgement | % Outstanding | % Good | % Requires improvement | % Inadequate |
|---|---|---|---|---|---|
| 2023 | 115 | 1 | 26 | 42 | 31 |
| 2022 | 115 | 2 | 35 | 44 | 19 |
| 2021 | 115 | 2 | 43 | 41 | 14 |
| 2020 | 115 | 2 | 43 | 41 | 14 |
| 2019 | 114 | 3 | 47 | 37 | 13 |
See Figure 24.
Data for Figure 25: Local authority key judgements, at year end
| Key judgement | Number of local authorities | % Outstanding | % Good | % Requires improvement to be good | % Inadequate | % Not yet inspected |
|---|---|---|---|---|---|---|
| Impact of leaders | 153 | 23 | 41 | 25 | 9 | 1 |
| Experiences and progress of children who need help and protection | 153 | 9 | 42 | 40 | 7 | 1 |
| Experiences and progress of children in care | 153 | 14 | 49 | 31 | 5 | 1 |
See Figure 25.
Data for Figure 26: Experiences and progress of care leavers key judgement, at year end
| Key judgement | Number of local authorities | % Outstanding | % Good | % Requires improvement to be good | % Inadequate |
|---|---|---|---|---|---|
| Experiences and progress of care leavers | 26 | 15 | 42 | 38 | 4 |
See Figure 26.
Data for Figure 27: Local authority overall inspection outcomes by framework, at year end
| Framework | Number of local authorities | % Outstanding | % Good | % Requires improvement to be good | % Inadequate | % Not yet inspected |
|---|---|---|---|---|---|---|
| 2023 | 153 | 16 | 44 | 30 | 8 | 1 |
| After each local authority’s first ILACS inspection | 152 | 16 | 39 | 32 | 13 | 0 |
| After each local authority’s first SIF inspection | 152 | 2 | 34 | 43 | 22 | 0 |
See Figure 27.
Data for Figure 28: Overall effectiveness of children’s homes, at year end
| Provider type | Number of children’s homes | % Outstanding | % Good | % Requires improvement to be good | % Inadequate |
|---|---|---|---|---|---|
| All children’s homes | 3,000 | 10 | 73 | 14 | 3 |
| Children’s home | 2,770 | 10 | 73 | 14 | 3 |
| Short-break-only children’s home | 160 | 15 | 76 | 8 | 1 |
| Residential special school (registered as a children’s home) | 56 | 9 | 73 | 16 | 2 |
| Secure children’s home | 13 | 8 | 77 | 8 | 8 |
1. Due to the small number of secure children’s homes, percentages should be treated with caution.
See Figure 28.
Data for Figure 29: Overall effectiveness of all other social care providers, at year end
| Provider type | Number of social care providers | % Outstanding | % Good | % Requires improvement to be good | % Inadequate |
|---|---|---|---|---|---|
| All other social care providers | 660 | 26 | 67 | 5 | 2 |
| Independent fostering agency | 320 | 21 | 74 | 4 | 2 |
| Residential special school | 110 | 40 | 53 | 6 | 1 |
| Residential family centre | 70 | 9 | 80 | 9 | 3 |
| Boarding school | 58 | 21 | 67 | 7 | 5 |
| Further education college with residential accommodation | 33 | 36 | 55 | 9 | 0 |
| Adoption support agency | 34 | 44 | 56 | 0 | 0 |
| Voluntary adoption agency | 30 | 37 | 63 | 0 | 0 |
| Residential holiday scheme for disabled children | 11 | 64 | 36 | 0 | 0 |
1. The secure training centre is not included in this chart.
2. Due to the small number of residential holiday schemes for disabled children, percentages should be treated with caution.
See Figure 29.
Bibliography: Ofsted’s publications this year
A list of Ofsted publications published on GOV.UK in this Annual Report’s reporting period, 1 September 2022 to 31 August 2023.
Research and analysis
‘A review of the quality of T-level courses: interim report’, 24 October 2022.
‘Independent review of tutoring in schools and 16 to 19 providers’, 26 October 2022.
‘“Now the whole school is reading”: supporting struggling readers in secondary school’, 31 October 2022.
‘Alternative provision for primary-age pupils in England: a long-term “destination” or a “temporary solution”?’, 8 November 2022.
‘Ofsted’s thematic review of careers guidance: terms of reference’, 9 November 2022.
‘Skills Bootcamps thematic survey’, 9 November 2022.
‘Best start in life part 1: setting the scene’, 14 November 2022.
‘How local authorities plan for sufficiency: children in care and care leavers’, 18 November 2022.
‘A return to inspection: the story (so far) for previously exempt outstanding schools’, 22 November 2022.
‘Ofsted: gender pay gap report and data 2022’, 24 November 2022.
‘Independent Schools Inspectorate (ISI): annual Ofsted report letters’, 1 December 2022.
‘Inspectorates of British schools overseas: annual Ofsted report letters’, 1 December 2022.
‘Ofsted Annual Report 2021/22: education, children’s services and skills’, 13 December 2022.
‘Children’s social care questionnaires 2022: what children and young people told Ofsted’, 22 December 2022.
‘Ofsted’s equality objectives 2023 to 2027’, 11 January 2023.
‘The emerging picture from 2022/23 inspections’, 17 January 2023.
‘Subject report series: science’, 2 February 2023.
‘A focus on inadequate early years providers’, 7 February 2023.
‘A focus on inadequate independent schools’, 7 February 2023.
‘Research review series: art and design’, 22 February 2023.
‘How multi-academy trusts are involved in school inspections’, 25 April 2023.
‘Teachers’ professional development in schools: phase 1 findings’, 10 May 2023.
‘How mergers have changed the number of colleges we inspect and their inspection outcomes’, 15 June 2023.
‘International perspectives on early years’, 20 June 2023.
‘The quality of reading education in prisons: one year on’, 30 June 2023.
‘Five-Year Ofsted Inspection Data’, 12 July 2023.
‘Subject report series: history’, 13 July 2023.
‘Deep dives in school inspections’, 18 July 2023.
‘T-level thematic review: final report’, 20 July 2023.
‘Largest national providers of private and voluntary social care (March 2023)’, 27 July 2023.
‘Ofsted review into Start for Life services: terms of reference’, 28 July 2023.
‘Evaluating the education inspection framework’, 22 August 2023.
‘Welfare and duty of care in Armed Forces initial training’, 23 August 2023.
Commentaries
‘HMCI commentary: publishing our new area SEND framework’, 29 November 2022.
‘HMCI commentary: improving how we work’, 21 April 2023.
Blogs
Early years
‘Registering to become a childminder with Ofsted – what to expect’, 30 September 2022.
‘The difference between registering with Ofsted or a childminder agency’, 30 September 2022.
‘Committee-run childcare – what you need to know’, 30 September 2022.
‘Giving children the best start in life’, 4 November 2022.
‘Ofsted-registered nannies – What you need to know’, 10 November 2022.
‘Streamlining the early years registration process’, 25 November 2022.
‘”What do I need to do to prepare for my early years inspection?”’, 25 January 2023.
‘Ofsted’s 2023 priorities for early years’, 2 February 2023.
‘How staff-to-child ratios work’, 20 April 2023.
‘Our early years curriculum roadshows on the education inspection framework (EIF)’, 24 May 2023.
‘Expanding our pilot to streamline early years registration’, 28 July 2023.
‘Early years resources, information and updates’, 22 August 2023.
Schools and further education and skills
‘Thousands of year 7s struggle with reading’, 5 September 2022.
‘Ofsted webinars for schools – responses to questions and new webinars’, 7 September 2022.
‘A new early years blog’, 30 September 2022.
‘Education for prisoners with learning difficulties and/or disabilities’, 11 November 2022.
‘Inspection outcomes for further education and skills (FE and skills) initial teacher education programmes in the current ITE inspection cycle’, 29 November 2022.
‘Inspecting the initial stages of the early career framework and national professional qualifications’, 7 December 2022.
‘Ofsted’s 2023 priorities for schools and further education and skills’, 1 February 2023.
‘Ofsted’s webinars for schools – spring season’, 9 February 2023.
‘What does high-quality curriculum and teaching look like in further education and skills?’, 16 February 2023.
‘Pupils with special educational needs and/or disabilities who have fallen behind with reading’, 2 March 2023.
‘Teachers’ professional development remains a work in progress’, 18 May 2023.
‘Ofsted’s webinars for schools - summer season’, 8 June 2023.
‘When will my school be inspected?’, 12 June 2023.
‘Insights from our first full inspections of lead providers of the new early career framework (ECF)’, 13 July 2023.
‘Insights from the inspection of initial teacher education (ITE) providers’, 17 July 2023.
‘More parental complaints don’t mean more inspections’, 30 August 2023.
‘Getting all pupils reading’, 30 August 2023.
Social care
‘Piloting Ofsted Inspectors (OIs) in social care’, 23 September 2022.
‘Children’s homes need strong leadership and a stable workforce’, 24 November 2022.
‘Looking after children with complex needs: Dispelling myths about inspections and the need for suitable homes’, 28 November 2022.
‘Getting ready to regulate supported accommodation’, 6 January 2023.
‘Ofsted’s 2023 priorities for social care’, 1 February 2023.
‘How we use the children’s social care point-in-time surveys results’, 28 February 2023.
‘Secure training centres – introducing assurance inspections’, 10 March 2023.
‘Foster Care Fortnight 2023’, 15 May 2023.
‘Children with complex needs in children’s homes’, 23 May 2023.
‘Ofsted’s response to Stable Homes, Built on Love’, 6 July 2023.
‘Registering children’s homes – principles and hints and tips’, 10 August 2023.
Official statistics and management information
‘Children’s social care statistics’.
‘Early years and childcare statistics’.
‘Further education and skills statistics’.
‘Initial teacher education: inspections and outcomes’.
‘Non-association independent schools statistics’.
‘State-funded schools statistics’.
‘Unregistered schools management information’.
Speeches
‘Amanda Spielman’s speech at the 2022 National Children and Adult Services conference’, 3 November 2022.
‘Amanda Spielman’s speech to the University of Oxford’s department of education’, 16 January 2023.
‘Amanda Spielman’s speech at the Big Conversation 2023’, 30 January 2023.
‘Amanda Spielman launches the art and design research review’, 22 February 2023.
‘Amanda Spielman at the Annual Apprenticeship Conference 2023’, 14 March 2023.
‘Amanda Spielman’s speech to the Festival of Education 2023’, 6 July 2023.
Correspondence (published for transparency and information)
‘Yvette Stanley letter to the Chair of the Child Safeguarding Practice Review Panel’, 26 October 2022.
‘Ofsted’s response to regulating supported accommodation’, 26 January 2023.
‘Letter from Minister for Women and Equalities, to the Ofsted Chief Inspector’, 22 June 2023.
‘Ofsted’s response to the Stable Homes, Built on Love consultation’, 6 July 2023.
‘Ofsted’s response to the children’s social care national framework and dashboard’, 6 July 2023.
‘Ofsted’s response to the child and family social worker workforce consultation’, 6 July 2023.
-
The term ‘nurseries and pre-schools’ is used in this report to describe childcare on non-domestic premises. ↩
-
‘Provision for children under 5 in England: January 2023’, Department for Education, July 2023. ↩
-
State-funded nursery schools and school Nursery and Reception classes are covered in the schools chapter. ↩
-
‘Live births in England and Wales: birth rates down to local authority areas’, Office for National Statistics, September 2022. ↩
-
‘Research on the nature, impact and drivers of nursery closures in England’, Local Government Association, July 2023. ↩
-
‘Childcare Survey 2023’, Coram Family and Childcare, March 2023. ↩
-
‘Provision for children under 5 in England: January 2023’, Department for Education, July 2023. ↩
-
‘Minister urges social landlords to open the door to childminders’, Department for Education, August 2023. ↩
-
New childminders can choose to register with Ofsted directly or to register with a childminder agency (CMA). Those registered with CMAs are a relatively small proportion, which has not changed substantially during the year. ↩
-
‘Research and analysis: A focus on childminders’, Ofsted, September 2023. ↩
-
‘International perspectives on early years’, Ofsted, June 2023. ↩
-
‘Best start in life part 2: the 3 prime areas of learning’, Ofsted, September 2023. ↩
-
‘Provision for children under 5 in England: January 2023’, Department for Education, July 2023. ↩
-
‘International perspectives on early years’, Ofsted, June 2023. ↩
-
‘Education, health and care plans – Reporting year 2023’, Department for Education, June 2023. ↩
-
There were 39 ungraded inspections which converted to graded inspections immediately. These are counted as graded inspections here and in the analysis of outcomes that follows. ↩
-
Based on inspections under the EIF in 2019/20, 2021/22 and 2022/23. 2020/21 not included as graded inspections largely paused due to the pandemic. ↩
-
‘Ofsted Annual Report 2021/22: education, children’s services, and skills’, pp. 38–40, Ofsted, December 2022. ↩
-
‘Schools commentary: Alignment between inspection grades and headline data measures’, Ofsted, November 2023. ↩
-
For the previously exempt schools inspected since the exemption was lifted, and for those inspected in 2022/23, the average length of time since their previous graded inspection was 11 years. For the previously exempt schools that have not yet been inspected, the average length of time since their last graded inspected is 10 years. ↩
-
‘Education inspection framework. Overview of research’, Ofsted, January 2019. ↩
-
‘Getting our bearings: geography subject report’, Ofsted, September 2023. ↩
-
‘Subject report series: history’, Ofsted, July 2023. ↩
-
‘Coordinating mathematical success: the mathematics subject report’, Ofsted, July 2023. ↩
-
‘Striking the right note: the music subject report’, Ofsted, September 2023. ↩
-
‘Levelling the playing field: the physical education subject report’, Ofsted, September 2023. ↩
-
‘Subject report series: science’, Ofsted, February 2023. ↩
-
‘Independent review of tutoring in schools: phase 2 findings’, Ofsted, October 2023. ↩
-
‘Independent review of careers guidance in schools and further education and skills providers’, Ofsted, September 2023. ↩
-
‘Pupil absence in schools in England’, Department for Education, July 2023. Out of the 7.5% possible sessions recorded as absence in the autumn term 2022/23, 4.5% were due to illness. ↩
-
‘Correspondence - Letter to school leaders on mild illness and school attendance’, Department for Education, September 2023. ↩
-
‘Securing good attendance and tackling persistent absence’, Ofsted, February 2022; and ‘Toolkit for schools: communicating with families to support attendance’, Department for Education, September 2023. ↩
-
For a school to be identified by Ofsted as having exceptional levels of pupil movement, a minimum of five pupils and 5% of pupils must have moved between Years 10 and 11; the number of moves must be significantly high (as identified by our statistical model that takes account of pupil characteristics), and the school must have met both criteria for two consecutive years. Based on data from the DfE’s school census each January. ↩
-
A permanent exclusion is the permanent removal of a pupil from a school roll, whereas suspension is temporarily not allowing them to come to school. ↩
-
‘Permanent exclusions and suspensions in England’, Department for Education, July 2023. ↩
-
Schools can list up to three reasons for each suspension or exclusion. ↩
-
‘National behaviour survey: findings from academic year 2021/22’, Department for Education, June 2023. Data combines the opinions of school teachers from mainstream primary and secondary schools. ↩
-
Effective safeguarding means having no serious and/or widespread issues with safeguarding practice that put children at risk from harm, but could mean there are minor issues, such as technicalities in paperwork, that do not put children at risk. 99% of the school inspections we carried out this year (graded and ungraded combined) judged schools to have effective safeguarding. ↩
-
This year, 64 schools were judged ineffective for safeguarding. This usually results in an overall effectiveness and leadership and management grade of inadequate, with the other judgements not affected. Out of these 64 schools, 58 were graded requires improvement or inadequate for at least one of the other key judgements (quality of education, personal development, behaviour and attitudes). The other six were graded good or outstanding for these key judgements. Ungraded inspections do not have key judgements, but would usually convert to a graded inspection if there were safeguarding concerns. ↩
-
A MAT is defined by its legal status rather than the number of schools it has. There are a number of trusts with MAT status that only have one school. These are excluded from these numbers as they are in effect a single academy trust, despite technically legally being a MAT. ↩
-
‘How multi-academy trusts are involved in school inspections’, Ofsted, April 2023. ↩
-
To see the 12 reports go to reports.ofsted.gov.uk, select the category of ‘Education and training’, the sub category of ‘Multi academy trusts’, and publication dates between September 2022 and September 2023. ↩
-
A small number of special schools also identify themselves as faith schools. For the purposes of our data we have grouped these schools with special schools and not faith schools. ↩
-
The faith of a school is defined by whether the school has declared a religious character or ethos on the DfE’s Get Information about Schools site. If the school does not declare a religious character or ethos, it is categorised in our statistics as ‘non-faith’, although it is possible that some of these schools also operate as faith schools. ↩
-
The new inspection cycle for independent schools started in January 2023. ↩
-
Inspectors from Ofsted have powers to inspect suspected unregistered independent schools under section 97 of the Education and Skills Act 2008. ↩
-
‘Elective home education’, Department for Education, May 2023. ↩
-
Data was collected from local authorities by the Association of Directors of Children’s Services until 2021 and then by DfE from autumn 2021 onwards. While data is not fully comparable between these different data collections, the substantial rise in the numbers still suggest a considerable rise since the pandemic. The most recent full year of data available is for 2021/22. ↩
-
DfE data on the reasons for home educating is from the autumn 2022 census rather than the 2021/22 data quoted earlier. ↩
-
’Elective home education survey 2019’, Association of Directors of Children’s Services, November 2019. ↩
-
‘Special educational needs in England’, Department for Education, June 2023. ↩
-
‘Special educational needs in England’, Department for Education, June 2023. ↩
-
‘Area SEND inspections: framework and handbook’, Ofsted, November 2022. ↩
-
‘Educational psychology services: workforce insights and impact’, Department for Education, June 2023. ↩
-
Based on pupil-level data from the DfE’s school and AP censuses, and refers to actual rather than planned placements. Some children may have multiple part-time placements at different providers. ↩
-
‘Independent schools’ includes independent special schools, other independent schools and non-maintained special schools. These are not registered as AP providers; pupils are sent there for AP places funded by the local authority. ↩
-
Unregistered provision includes any provision not registered as a school in England, such as further education providers, providers in Wales, prisons, secure units, one-to-one tuition, work-based placements and other unregistered providers, and provision attended by pupils because it is the placement named in their education, health and care plan. ↩
-
See Figure 22 of last year’s report for a chart showing the detail of AP placements between 2010 and 2021. This analysis combines data from the AP census (pupils placed by LAs) and the school census (pupils in state-funded schools). It does not include pupils placed by schools. ↩
-
This is the total number of pupils attending state-funded AP as their main registration, plus the number of pupils attending local authority funded AP. ‘Schools, pupils and their characteristics’, Department for Education, June 2023. ↩
-
Number of placements is taken from the Department for Education’s alternative provision census, January 2022. The number of placements may vary across the year and over time. ↩
-
An independent school is counted as having AP if they have at least one AP placement in the school (recorded in the DfE’s AP census). This includes specific AP schools and other mainstream schools, both of which are included in the non-association independent schools section of the schools chapter of this report. This data is only collected annually and will not reflect movement in pupils with AP within cohorts. ↩
-
‘Initial teacher training (ITT) core content framework’, Department for Education, November 2019. ↩
-
‘Terms of reference: Ofsted’s independent review of teachers’ professional development’, Ofsted, September 2021. ↩
-
‘Teachers’ professional development in schools: phase 1 findings’, Ofsted, May 2023. ↩
-
‘How mergers have changed the number of colleges we inspect and their inspection outcomes’, Ofsted, June 2023. ↩
-
‘T level thematic review: final report’, Ofsted, July 2023. ↩
-
‘Skills Bootcamps thematic survey’, Ofsted, November 2022. ↩
-
‘Achievement rates learner characteristics – volumes and rates by level, age, sex, LLDD, Ethnicity’, Department for Education. ↩
-
‘Latest Apprenticeships in year data’, Department for Education. ↩
-
‘Headline Full year - Starts, Achievements, Participation by Level, Levy, Age, Region, Provider type’, Department for Education. ↩
-
‘Achievement Rates Learner Characteristics - Volumes and Rates by Level, Age, Sex, LLDD, Ethnicity’, Department for Education. ↩
-
‘High needs: allocated place numbers’, Education and Skills Funding Agency, July 2023. ↩
-
Designated institutions have specially designated educational status under section 28 of the Further and Higher Education Act 1992. ↩
-
‘Independent review of careers guidance in schools and further education and skills providers’, Ofsted, September 2023. ↩
-
‘The quality of reading education in prisons: one year on’, Ofsted, June 2023. ↩
-
‘Prison education: a review of reading education in prisons’, Ofsted, March 2022. ↩
-
‘Characteristics of children in need’, Department for Education, October 2023. ↩
-
‘Children looked after in England including adoptions’, Department for Education, November 2022. ↩
-
The review of children’s homes inadequate at first inspection refers to the 2022-23 financial year. ↩
-
‘Largest national providers of private and voluntary social care (March 2023)’, Ofsted, July 2023. ↩
-
‘What types of needs do children’s homes offer care for?’, Ofsted, July 2022. ↩
-
‘Children looked after in England including adoptions’, Department for Education, November 2022. ↩
-
‘Children looked after in England including adoptions’, Department for Education, November 2022. ↩
-
‘Yearly referrals to young people’s mental health services have risen by 53% since 2019’, Young Minds, June 2023. ↩
-
‘Stable Homes, Built on Love: strategy and consultation’, p. 20, Department for Education, February 2023. ↩
-
‘Provision of accommodation for 16 and 17 year olds who may be homeless and/or require accommodation’, Department for Levelling Up, Housing and Communities, Department for Education, and Ministry of Housing, Communities and Local Government, April 2010. ↩
-
In two tier local authorities, each county council area is subdivided into districts. Each district has an independent district council. ↩
-
Focused visits look at a specific area of service or a specific cohort of children. They do not result in an inspection judgement. Our published reports of focused visits to Cafcass can be found here: reports.ofsted.gov.uk. ↩
-
Figures from the self-evaluation submitted by Cafcass for its annual engagement meeting in May 2023. ↩
-
‘Stable Homes, Built on Love: strategy and consultation’, p. 20, Department for Education, February 2023. ↩
-
‘Children with complex needs in children’s homes’, Ofsted, May 2023. ↩
-
‘National deprivation of liberty court: Latest data trends – May 2023’, Nuffield Family Justice Observatory, May 2023. ↩
-
‘What do we know about children and young people deprived of their liberty in England and Wales? An evidence review’, Nuffield Family Justice Observatory, February 2022. ↩
-
‘How local authorities plan for sufficiency: children in care and care leavers’, Ofsted, November 2022. ↩
-
‘What types of needs do children’s homes offer care for?’, Ofsted, July 2022. ↩
-
‘How local authorities plan for sufficiency: children in care and care leavers’, November 2022. ↩
-
‘The independent review of children’s social care’, Josh MacAlister, May 2022. ↩
-
‘Mainstream’ fostering households refers to fostering arrangements where the carer is not a friend or family member of the fostered child. ↩
-
‘Fostering in England 1 April 2022 to 31 March 2023, Ofsted, November 2023. ↩
-
‘The multi-agency response to children and families who need help’, Ofsted, November 2023. ↩
-
‘Joint targeted area inspections of the multi-agency response to serious youth violence’, Ofsted, August 2023. ↩
-
‘Children’s social care: Stable Homes, Built on Love’, Department for Education, February 2023. ↩
-
‘Ofsted’s response to the Stable Homes, Built on Love consultation’, Ofsted, July 2023. ↩