A focus on inadequate independent schools
Published 7 February 2023
Applies to England

© Crown copyright 2023
This publication is licensed under the terms of the Open Government Licence v3.0 except where otherwise stated. To view this licence, visit nationalarchives.gov.uk/doc/open-government-licence/version/3 or write to the Information Policy Team, The National Archives, Kew, London TW9 4DU, or email: psi@nationalarchives.gov.uk.
Where we have identified any third party copyright information you will need to obtain permission from the copyright holders concerned.
This publication is available at https://www.gov.uk/government/publications/non-association-independent-schools-inspections-statistical-commentaries-2022-to-2023/a-focus-on-inadequate-independent-schools
This commentary draws on the most recent inspection outcomes for non-association independent schools as at 31 December 2022.
Introduction
Three quarters of independent schools were judged good or outstanding for overall effectiveness at their most recent standard inspection. However, in a small minority, issues with the quality of education and leadership and management, and concerns over safeguarding, resulted in a judgement of inadequate.
This commentary considers why these independent schools have been judged inadequate and what happens after they receive a judgement of inadequate.
There are 1,171 non-association independent schools in England. As of 31 December 2022, we have inspected 1,076 of these schools and have judged 90 (8%) as inadequate. This percentage has improved since 31 August 2018, when 132 schools (13%) were judged inadequate. For comparison, we have judged 3% of state-funded schools to be inadequate, as at 31 December 2022.
Figure 1: Overall effectiveness of non-association independent schools following their most recent inspection, by year
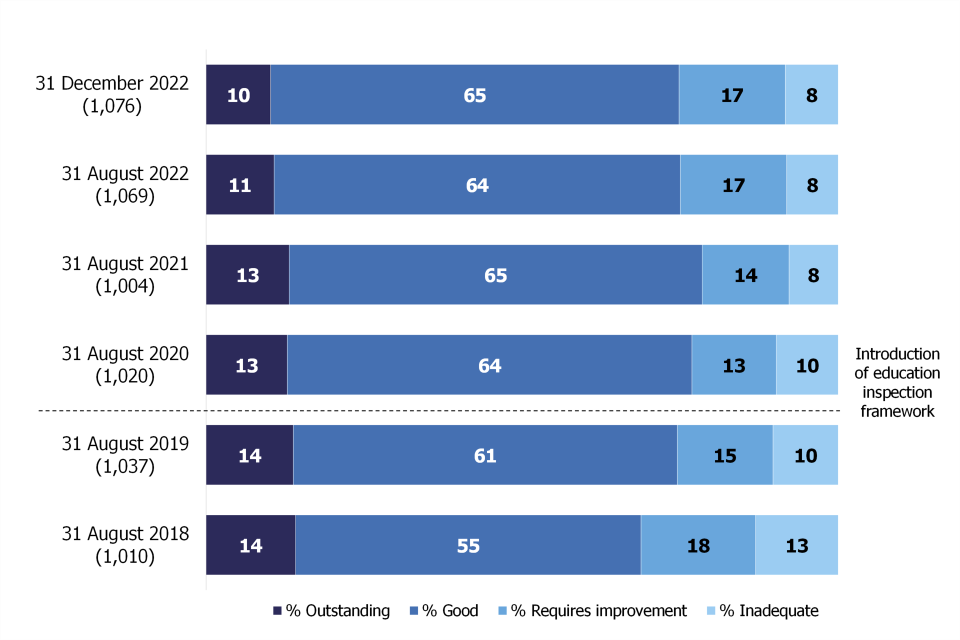
Note: Total number of schools is shown in brackets.
View data in an accessible table format.
Schools judged inadequate at the beginning of the cycle
Independent schools are normally inspected on a 3-year cycle. The most recent cycle began on 1 September 2018 and was completed at the end of December 2022.[footnote 1]
Of the 132 schools that were inadequate at the beginning of the cycle, only 19 remained inadequate at the end of December 2022. Of the others:
- 47 (36%) schools are no longer inspected by Ofsted (35 have closed and 12 are now inspected by the Independent Schools Inspectorate (ISI)[footnote 2] following an inspection where they met the independent school standards (ISS))
- 52 (39%) have improved to good or outstanding
- 14 (11%) were judged requires improvement
Schools judged inadequate at 31 December 2022
Of the 90 schools that are currently inadequate, we had previously inspected 73 (81%). For the other 17 (19%) schools, it was their first standard inspection.
Over a third of the inadequate schools (33 schools) were previously judged good, and almost a quarter (22 schools) were inadequate for a second consecutive inspection.
Table 1: Previous overall effectiveness judgements for inadequate independent schools: 31 December 2022
| Previous overall effectiveness judgement | Number of inadequate schools | % of inadequate schools |
|---|---|---|
| Outstanding | 3 | 3 |
| Good | 33 | 37 |
| Requires improvement | 15 | 17 |
| Inadequate | 22 | 24 |
| No previous inspection | 17 | 19 |
| Total | 90 | 100 |
Independent special schools are less likely to be judged inadequate than other independent schools. They make up over half of all non-association independent schools but less than a third of inadequate schools (53% compared with 30%).
Independent faith schools are disproportionately represented among inadequate schools. Faith schools make up less than a quarter of the independent schools inspected nationally, but 41% of those graded inadequate.
Figure 2: Proportion of all independent schools compared with those judged inadequate, by school type: 31 December 2022
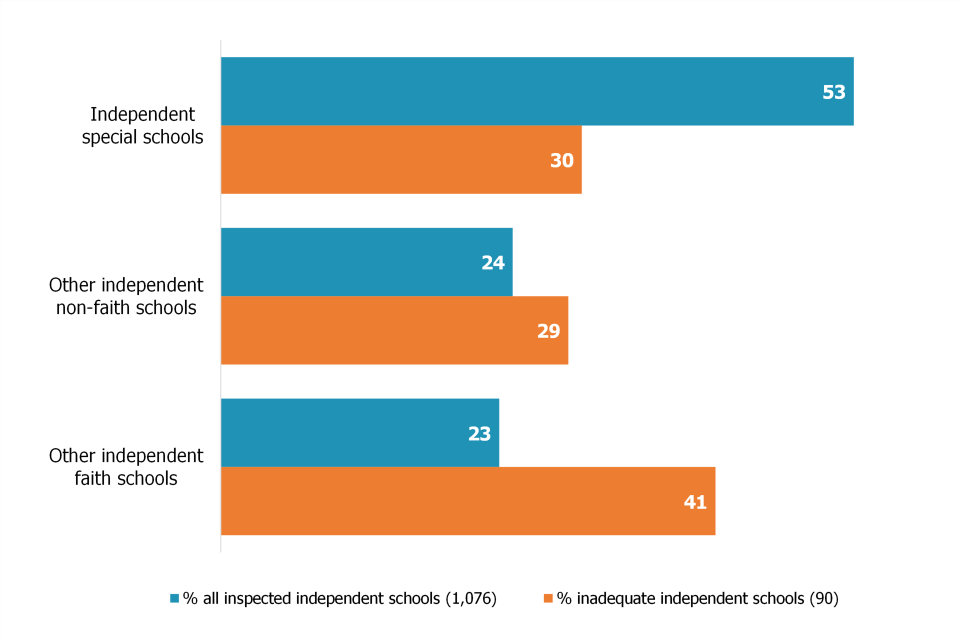
Note: Total number of schools is shown in brackets.
A small number of special schools are also faith schools (including one inadequate school). These are included in the special schools group.
View data in an accessible table format.
Why independent schools are judged inadequate
The 2 main reasons why schools are judged inadequate under the education inspection framework (EIF)[footnote 3] relate to their leadership and management and the quality of the education they provide.
Almost all inadequate schools have been judged inadequate for leadership and management. Safeguarding is ineffective in around two thirds of inadequate schools. When safeguarding is ineffective, this is likely to lead to a judgement of inadequate for leadership and management. Two thirds of these schools have also been judged inadequate in one or more of the key judgements other than leadership and management. The proportion with ineffective safeguarding is lower than 2018, when 76% of the inadequate schools were judged to have ineffective safeguarding.
Nearly two thirds of the inadequate schools provide an inadequate quality of education. A judgement of inadequate for quality of education is often a result of an incoherent or unambitious curriculum and pupils not making good progress due to weaknesses in how this curriculum is implemented.
Figure 3: Outcome of key judgements for inadequate independent schools: 31 December 2022
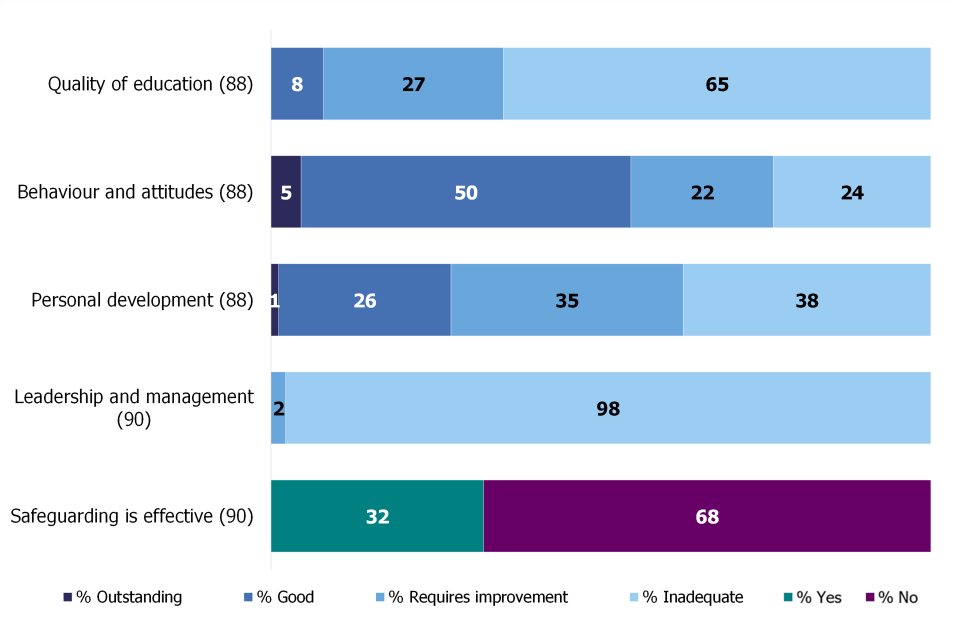
Note: Total number of schools is shown in brackets.
Two schools have not been inspected under the EIF, so do not have judgements for all the EIF judgements.
Percentages are rounded and may not add to 100.
View data in an accessible table format.
In a standard inspection, we also check the school’s compliance with the ISS. The ISS set out the standards that all independent schools must meet and are divided into 8 parts.
The ISS are related to the judgements we make under the EIF, in particular for quality of education and leadership and management. Of the independent schools judged inadequate:
- all failed to meet the standards related to the quality of leadership in and management of schools (part 8)
- 83% did not meet the standards relating to the quality of education provided (part 1)
- 79% did not meet the standards related to the welfare, health and safety of pupils (part 3)
Monitoring of inadequate schools
We carry out progress monitoring inspections of schools judged inadequate. These visits check the progress made by a school to address weaknesses identified at its previous inspection.
As of 31 December 2022, 34 of the currently inadequate schools had received a progress monitoring inspection following their most recent inspection. Of these, 20 schools (59%) were still not meeting the standards checked. Despite improvement in the proportion of schools judged inadequate since 2018, this shows that a small number of schools are failing to meet certain standards on more than one visit.
Annex: data tables for figures
This section contains the underlying data in an accessible table format for all figures.
Data for Figure 1: Overall effectiveness of non-association independent schools following their most recent inspection, by year
| Year | Number of schools | % Outstanding | % Good | % Requires improvement | % Inadequate |
|---|---|---|---|---|---|
| 31 December 2022 | 1,076 | 10 | 65 | 17 | 8 |
| 31 August 2022 | 1,069 | 11 | 64 | 17 | 8 |
| 31 August 2021 | 1,004 | 13 | 65 | 14 | 8 |
| 31 August 2020 | 1,020 | 13 | 64 | 13 | 10 |
| 31 August 2019 | 1,037 | 14 | 61 | 15 | 10 |
| 31 August 2018 | 1,010 | 14 | 55 | 18 | 13 |
See Figure 1
Data for Figure 2: Proportion of all independent schools compared with those judged inadequate, by school type: 31 December 2022
| School type | % all inspected independent schools | % inadequate independent schools |
|---|---|---|
| Independent special schools | 53 | 30 |
| Other independent non-faith schools | 24 | 29 |
| Other independent faith schools | 23 | 41 |
| All inspected independent schools | Inadequate independent schools | |
|---|---|---|
| Total number of schools | 1,076 | 90 |
See Figure 2
Data for Figure 3: Outcome of key judgements for inadequate non-association independent schools: 31 December 2022
| Judgement | Number of schools | % Outstanding | % Good | % Requires improvement | % Inadequate | % Yes | % No |
|---|---|---|---|---|---|---|---|
| Quality of education | 88 | 0 | 8 | 27 | 65 | Na | Na |
| Behaviour and attitudes | 88 | 5 | 50 | 22 | 24 | Na | Na |
| Personal development | 88 | 1 | 26 | 35 | 38 | Na | Na |
| Leadership and management | 90 | 0 | 0 | 2 | 98 | Na | Na |
| Safeguarding is effective | 90 | Na | Na | Na | Na | 32 | 68 |
See Figure 3
-
The inspection cycle was extended by 4 terms to the end of December 2022 because of the pandemic. ↩
-
ISI inspects schools that are members of an association. ↩
-
We introduced the education inspection framework (EIF) in September 2019. It covers a range of key judgements, as well as overall effectiveness. ↩