Weekly NHS test and trace bulletin, England: 2 July to 8 July 2020
Updated 17 July 2020
Applies to England

© Crown copyright 2020
This publication is licensed under the terms of the Open Government Licence v3.0 except where otherwise stated. To view this licence, visit nationalarchives.gov.uk/doc/open-government-licence/version/3 or write to the Information Policy Team, The National Archives, Kew, London TW9 4DU, or email: psi@nationalarchives.gov.uk.
Where we have identified any third party copyright information you will need to obtain permission from the copyright holders concerned.
This publication is available at https://www.gov.uk/government/publications/nhs-test-and-trace-statistics-england-2-july-to-8-july-2020/weekly-nhs-test-and-trace-bulletin-england-2-july-to-8-july-2020
The data in the tables below reflect the first 5 weeks of operation of NHS Test and Trace.
For testing, they include:
- people tested for coronavirus
- people testing positive for coronavirus
- time taken for test results to become available
For contact tracing, they include:
- people transferred to the contact-tracing system, and the time taken for them to be reached
- close contacts identified for complex and non-complex cases, and the time taken for them to be reached
This week we’re also publishing a statistical note which provides further information on the impact of COVID-19 on the care sector. The note contains the latest figures on testing for social care staff, their household members and residents of care homes.
Main points
NHS contact tracing went live on 28 May.
Between 2 July and 8 July 2020:
- 320,124 new people were tested for coronavirus (COVID-19) under pillars 1 and 2 in England
- 3,818 new people tested positive for coronavirus (COVID-19)
- 3,579 people had their case transferred to the contact-tracing system
- of these, 2,815 people (78.7%) were reached and asked to provide details of recent close contacts. 2,201 people (78.2%) provided details for one or more recent close contacts and 614 people (21.8%) said that they had no recent close contacts
- 618 people (17.3%) could not be reached. An additional 146 people (4.1%) could not be reached at all because no communications details were provided for them
As a result of this, between 2 July and 8 July 2020:
- 13,807 people were identified as close contacts. Of these, 9,811 people (71.1%) were reached and asked to self-isolate.
In total, since 28 May 2020:
- 1,956,198 new people have been tested for coronavirus (COVID-19) under pillars 1 and 2 in England
- 34,750 new people have tested positive for coronavirus (COVID-19)
- 34,990 people had their case transferred to the contact-tracing system,[footnote 1] of whom 26,742 (76.4%) were reached and asked to provide details of their recent close contacts
- 155,889 (84.1%) close contacts were reached and asked to self-isolate through the contract-tracing system out of 185,401 people identified
Terminology
People in England who have a positive coronavirus (COVID-19) test are transferred to NHS Test and Trace. These are people who were tested under pillar 1 or pillar 2 of the government testing strategy:[footnote 2]
- pillar 1: swab testing in Public Health England (PHE) labs and NHS hospitals for those with a clinical need, and health and care workers
- pillar 2: swab testing for the wider population, through commercial partnerships[footnote 3]
Pillar 1 testing is conducted in hospitals and at outbreak locations. Pillar 2 testing can be carried out through several different routes:
- regional test sites, which includes drive-through testing centres with limited walk-up facilities. This also includes local test sites, which are similar to regional test sites but specifically for walk-ups
- mobile testing units, which travel around the UK to increase access to coronavirus testing. They respond to need, travelling to test essential workers at sites including care homes, police stations and prisons
- satellite test centres, which includes test kits provided directly to ‘satellite’ centres at places like hospitals or care homes that have a particularly urgent or significant need
- home test kits, which are delivered to someone’s door so they can test themselves and their family without leaving the house
People tested refers to people who have newly been tested for COVID-19 and does not re-count people who have been tested more than once in either pillar 1 or pillar 2. People testing positive refers only to people who have newly tested positive for COVID-19 and does not include people who have had more than one positive test.
NHS Test and Trace has 2 ways of handling cases depending on their complexity:
- PHE local health protection teams to manage complex cases linked to outbreaks (referred to as complex cases hereafter)[footnote 4]
- wider online and other call centre capacity for less complex cases (referred to as non-complex cases hereafter)
More details can be found in the methodology document.
Figure 1: flowchart showing how people move through the NHS Test and Trace service
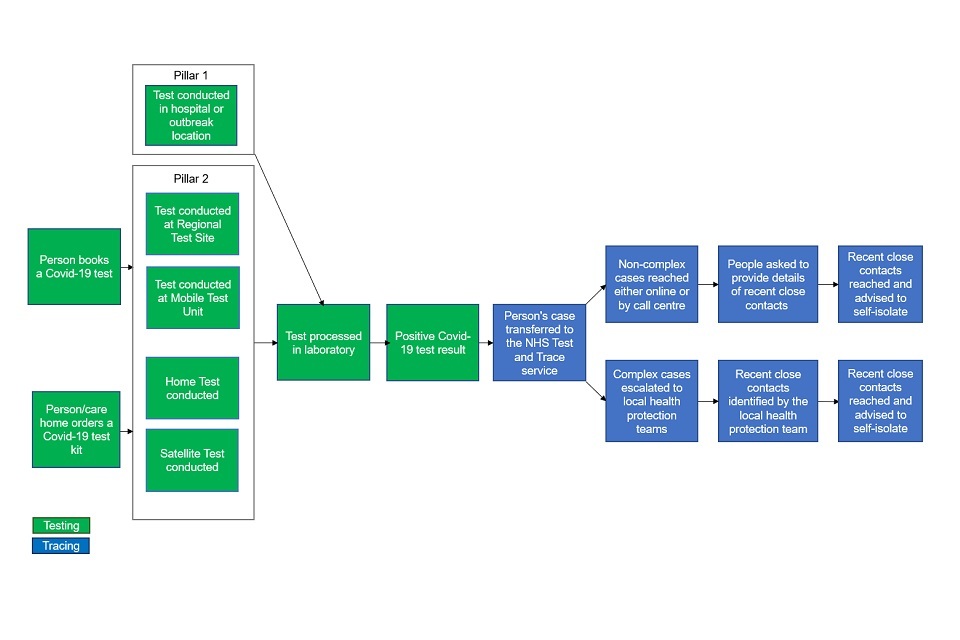
Figure 1: Flowchart showing how people move through the NHS Test and Trace service
Revisions for the publication from 25 June to 1 July
Figures for people testing positive for coronavirus in previous releases have been revised. These revisions are because:
- there are sometimes delays in laboratories submitting data to PHE
- quality checks are conducted on the data to refine figures over time
Figures for pillar 2 testing turnaround times in the previous release have been revised. These revisions are because:
- data was previously compiled using an interim operational data platform, which was designed to facilitate operation of the testing service. Data is now being compiled using a different data platform which allows for more accurate reporting of management information
- data for regional test sites now also includes local test sites. These were previously included in the regional test site data but in very small numbers. From week 4, local test sites have increased in number, but they still make up less than 10% of the total number of tests for regional test sites
Figures for contact tracing in previous releases have been revised. These revisions are because:
- the figures presented are based on a data cut several days after the end of the reporting period, to give time for cases reported towards the end of the 7-day period to have an outcome. Some cases may continue to be in progress after this period, and therefore data may need to be revised over time (the methodology document gives more detail about this).
Testing
Between 2 July and 8 July, 320,124 people were newly tested for COVID-19. 3,818 had a positive result
Table 1: people tested for COVID-19 under pillars 1 and 2, England
| 25 June to 1 July: number of people | 2 July to 8 July: number of people | Since Test and Trace launched, 28 May to 8 July: number of people | |
|---|---|---|---|
| Pillar 1 | 122,300 | 124,884 | 702,160 |
| Tested postive | 1,031 | 898 | 10,078 |
| Pillar 2 | 186,033 | 195,240 | 1,254,038 |
| Tested postive | 3,000 | 2,920 | 24,672 |
| Total | 308,333 | 320,124 | 1,956,198 |
| Tested postive | 4,031 | 3,818 | 34,750 |
Figure 2: number of people newly tested for COVID-19 by pillar, England
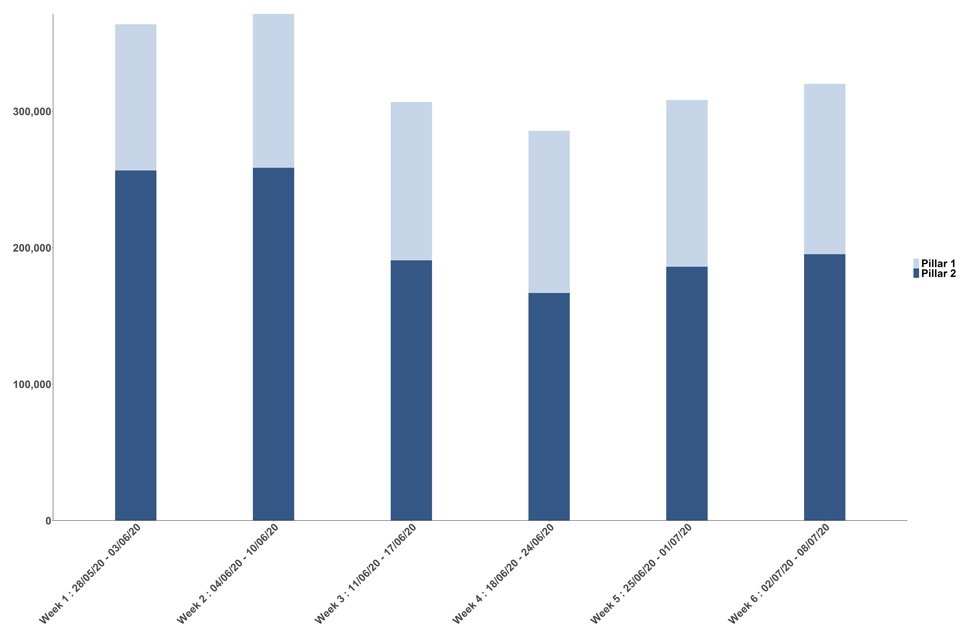
Figure 2: Number of people newly tested for Covid-19 by Pillar, England
Figure 3: number of people newly testing positive for COVID-19 by pillar, England
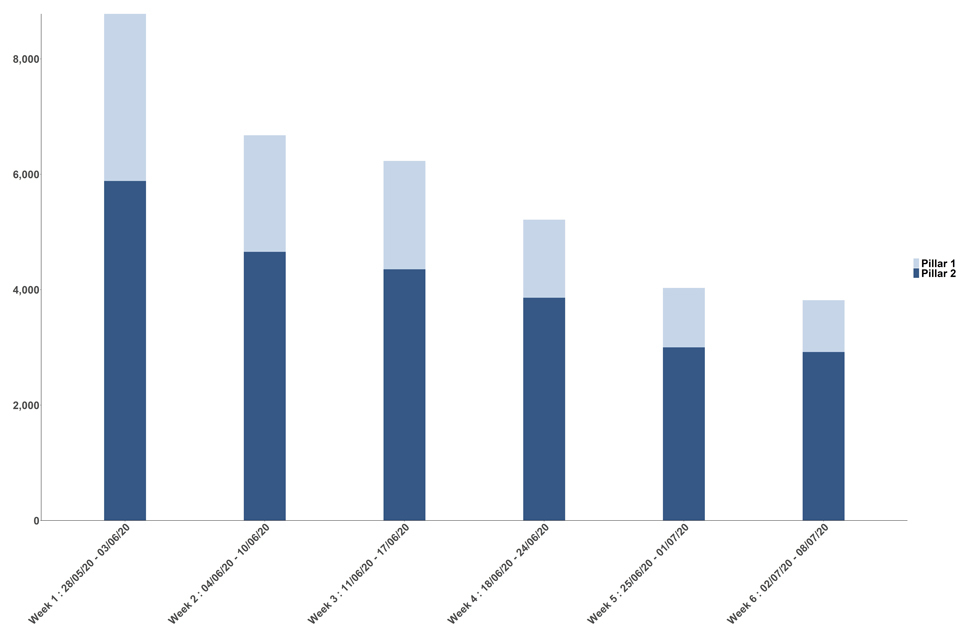
Figure 3: Number of people newly testing positive for Covid-19 by Pillar, England
When combined, pillar 1 and pillar 2 give the total number of confirmed cases of coronavirus in the given time period and these people should all have had their cases transferred to the contact-tracing system.[footnote 5]
The number of positive cases transferred to the contact-tracing system may not always align with the number of people testing positive for coronavirus. There are several reasons for this:
- delays between a sample being taken, tested and reported, and being passed from PHE to the contact-tracing system mean that weekly totals transferred to NHS Test and Trace may include people who were tested in the previous week
- the number of people testing positive in pillar 1 may also include people tested anonymously and therefore will not have their case transferred to contact tracing
- there is not a rigorous process for de-duplication of the data being passed into the contact-tracing system each day, so some people may have their case transferred to the contact-tracing system more than once
More information is given in the methodology document.
Note that these figures do not align with other published figures for people tested and people testing positive for COVID-19 under pillars 1 and 2. This is due to:
- differences in the date used for someone testing positive (this release uses the date the specimen was taken)
- differences in geography (this figure is for England rather than the UK)
More details on how our figures compare to other published figures is given in the methodology document.
Pillar 1 testing turnaround times
The time taken to receive a COVID-19 test result has been included in the weekly NHS Test and Trace publication for pillar 2 testing only. We will be providing this for pillar 1 in a future publication.
We’re working towards aligning the NHS and PHE reporting methodologies in order to add testing turnaround times for pillar 1 into the publication. Pillar 1 methodologies differ from pillar 2 methodology as the majority of tests are provided to hospital patients.
Pillar 1 is calculated as the number of tests results available within and after 24 hours of the test being received by the laboratory.
Pillar 2 testing turnaround times
For pillar 2, there are 2 measures of the time taken to receive a COVID-19 test result:
- the time taken to receive a COVID-19 test result from time of booking is measured from the time that a person books an appointment on the website to the time when the person receives a notification of their test result via an email or an SMS. This data is only available for regional test sites and mobile testing units, as test booking and registration processes for home testing and satellite test centres are currently undertaken on different systems
- the time taken to receive a COVID-19 test result from time of test is measured from the time a person completes a test registration (or the time a person indicates their test was taken for home testing kits) until the time that they receive a notification of the result of their test via an email or an SMS.
For all measures of time taken to receive a COVID-19 test result, there are a number of tests that were not completed. This covers any test where the results were not communicated, which may be because communication details (for example, phone number or email address) were not provided or were incorrect, or because the test was cancelled or abandoned, or no result was available.
Data on the time taken to receive a COVID-19 test result is split up to show the different routes for getting tested, as this will have an impact upon the time taken. More details can be found in the methodology document.
Since 28 May when Test and Trace launched, the time taken to receive a test result after taking a test has improved (decreased) in pillar 2
Figure 4: time taken from taking a test to receiving the results, pillar 2 all routes, England, 28 May to 8 July 2020
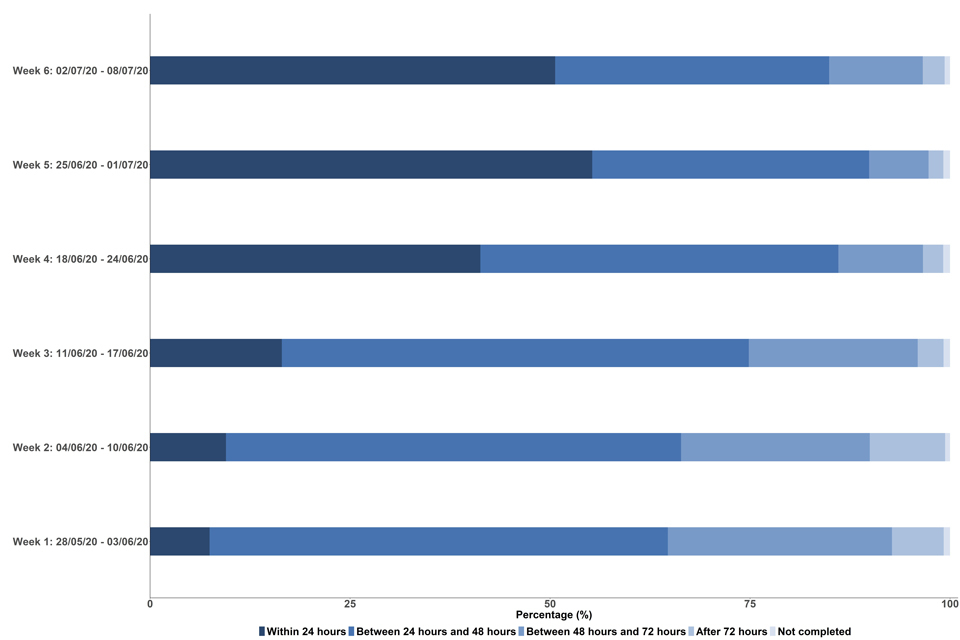
Figure 4: Time taken from taking a test to receiving the results, Pillar 2 all routes, England, 28 May to 08 July
Table 2: time from taking a test to receiving test results,[footnote 6] pillar 2 all routes, England
| 25 June to 1 July: number of people (percentage) | 2 July to 8 July: number of people (percentage) | Since Test and Trace launched, 28 May to 8 July: number of people (percentage) | |
|---|---|---|---|
| Within 24 hours | 132,161 (55.3%) | 145,240 (50.6%) | 446,766 (29.5%) |
| Between 24 and 48 hours | 82,770 (34.6%) | 98,243 (34.3%) | 722,301 (47.7%) |
| Between 48 and 72 hours | 17,782 (7.4%) | 33,577 (11.7%) | 263,868 (17.4%) |
| After 72 hours | 4,434 (1.9%) | 7,809 (2.7%) | 69,509 (4.6%) |
| Not completed | 1,994 (0.8%) | 1,960 (0.7%) | 11,446 (0.8%) |
| Total | 239,141 | 286,829 | 1,513,890 |
All routes includes regional test sites, mobile testing units, satellite test centres and home test kits. Combined, 50.6% of tests from all test sites were received within 24 hours of a test being taken in the week 2 July to 8 July. Excluding home testing kits, this is 66.9% of all tests.
The largest improvements (decrease in time taken) since week 1 of Test and Trace were for in-person tests (regional testing sites and mobile testing units). For in-person tests only (excluding both home tests and satellite tests), 87.7% of tests from all test sites were received within 24 hours of a test being taken, in the same time period. If we consider the day the test was taken, this means 96.4% of in-person tests results were received the next day after the test was taken.
Figure 5: percentage of results received within 24 hours (in-person tests) or within 48 hours (home/satellite tests), by route,[footnote 7] 28 May to 8 July 2020
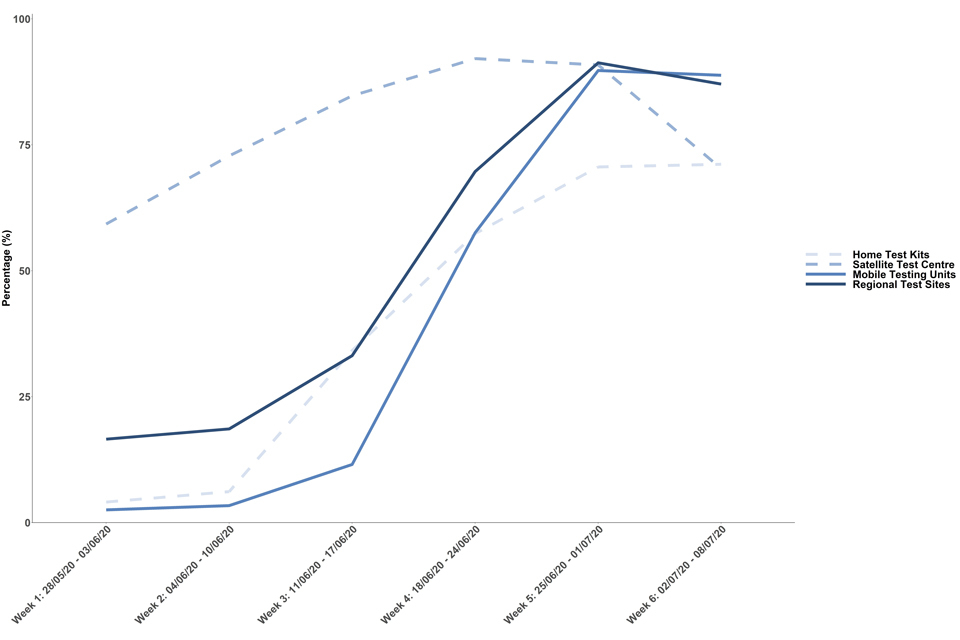
Figure 5: Percentage of results received within 24 hours (in-person tests) or within 48 hours (home/satellite tests), by route7, 28 May to 08 July 2020
There has been a small increase in test turnaround times compared to the previous week (25 June to 1 July). This is mainly due to a drop in the percentage of tests undertaken at satellite test centres returned within 48 hours.
Regional test sites
In the week 2 July to 8 July, 87.1% of test results were received within 24 hours of the test being taken. If we consider the day the test was taken, this means that 96.7% of tests results were received the next day after the test was taken. 98.4% of test results were received within 48 hours of booking a test.
Table 3a: time from taking a test to receiving test results,[footnote 8] pillar 2 regional test sites, England
| 25 June to 1 July: number of people (percentage) | 2 July to 8 July: number of people (percentage) | Since Test and Trace launched, 28 May to 8 July: number of people (percentage) | |
|---|---|---|---|
| Within 24 hours | 76,204 (91.3%) | 80,210 (87.1%) | 265,619 (53.2%) |
| Between 24 and 48 hours | 6,078 (7.3%) | 10,637 (11.5%) | 218,493 (43.7%) |
| Between 48 and 72 hours | 290 (0.3%) | 307 (0.3%) | 7,840 (1.6%) |
| After 72 hours | 127 (0.2%) | 160 (0.2%) | 2,695 (0.5%) |
| Not completed | 774 (0.9%) | 817 (0.9%) | 4,957 (1%) |
| Total | 83,473 | 92,131 | 499,604 |
Mobile testing units
In the week 2 July to 8 July, 88.8% of test results were received within 24 hours of the test being taken. If we consider the day the test was taken, this means that 95.8% of tests results were received the next day after the test was taken. 97.6% of test results were received within 48 hours of booking a test.
Table 3b: time from taking a test to receiving test results,[footnote 9] pillar 2 mobile testing units, England
| 25 June to 1 July: number of people (percentage) | 2 July to 8 July: number of people (percentage) | Since Test and Trace launched, 28 May to 8 July: number of people (percentage) | |
|---|---|---|---|
| Within 24 hours | 41,805 (89.8%) | 48,769 (88.8%) | 120,453 (41.0%) |
| Between 24 and 48 hours | 3,478 (7.5%) | 4,965 (9.0%) | 155,879 (53.1%) |
| Between 48 and 72 hours | 246 (0.5%) | 234 (0.4%) | 9,975 (3.4%) |
| After 72 hours | 243 (0.5%) | 122 (0.2%) | 2,594 (0.9%) |
| Not completed | 805 (1.7%) | 819 (1.5%) | 4,677 (1.6%) |
| Total | 46,577 | 54,909 | 293,578 |
Satellite test centres
In the week 2 July to 8 July, 70.3% of test results were received within 48 hours of the test being taken. If we consider the day the test was taken, this means that 60.1% of tests results were received the next day after the test was taken.
Table 3c: time from taking a test to receiving test results,[footnote 10] pillar 2 satellite test centres,[footnote 11] England
| 25 June to 1 July: number of people (percentage) | 2 July to 8 July: number of people (percentage) | Since Test and Trace launched, 28 May to 8 July: number of people (percentage) | |
|---|---|---|---|
| Within 24 hours | 13,118 (25.7%) | 13,824 (20.9%) | 53,866 (15.8%) |
| Between 24 and 48 hours | 33,258 (65.2%) | 32,793 (49.5%) | 199,079 (58.5%) |
| Between 48 and 72 hours | 3,916 (7.7%) | 15,993 (24.1%) | 69,019 (20.3%) |
| After 72 hours | 405 (0.8%) | 3,439 (5.2%) | 16,789 (4.9%) |
| Not completed | 344 (0.7%) | 248 (0.4%) | 1,343 (0.4%) |
| Total | 51,041 | 66,297 | 340,096 |
Home testing kits
Home tests take time to be posted to a person and be couriered back to the lab. Because of this a low proportion of test results will be available within 24 hours of the test being taken. In the week 2 July to 8 July, 71.1% of test results were received within 48 hours of the test being taken.
Table 3d: time from taking a test to receiving test results, pillar 2 home testing kits, England
| 25 June to 1 July: number of people (percentage) | 2 July to 8 July: number of people (percentage) | Since Test and Trace launched, 28 May to 8 July: number of people (percentage) | |
|---|---|---|---|
| Within 24 hours | 1,034 (1.8%) | 2,437 (3.3%) | 6,828 (1.8%) |
| Between 24 and 48 hours | 39,956 (68.8%) | 49,848 (67.8%) | 148,850 (39.1%) |
| Between 48 and 72 hours | 13,330 (23%) | 17,043 (23.2%) | 177,034 (46.5%) |
| After 72 hours | 3,659 (6.3%) | 4,088 (5.6%) | 47,431 (12.5%) |
| Not completed | 71 (0.1%) | 76 (0.1%) | 469 (0.1%) |
| Total | 58,050 | 73,492 | 380,612 |
Contact tracing
Between 2 July and 8 July, around 4 in every 5 people transferred to the contact-tracing system were reached and asked to provide information about their contacts.
Table 4: people transferred to the contact-tracing system (includes complex and non-complex cases) by whether they were reached and asked to provide contact details, England[footnote 12]
| 25 June to 1 July: number of people (percentage) | 2 July to 8 July: number of people (percentage) | Since Test and Trace launched, 28 May to 8 July: number of people (percentage) | |
|---|---|---|---|
| People who were reached and asked to provide details of recent close contacts | 3,389 (78.0%) | 2,815 (78.7%) | 26,742 (76.4%) |
| People classified as non-complex | 2,987 | 2,555 | 21,738 |
| People classified as complex | 402 | 260 | 5,004 |
| People who were not reached | 819 (18.8%) | 618 (17.3%) | 7,124 (20.4%) |
| People whose communication details were not provided | 139 (3.2%) | 146 (4.1%) | 1,124 (3.2%) |
| Total | 4,347 | 3,579 | 34,990 |
Between 2 July and 8 July, 260 people, who were reached and asked to provide details of close contacts, were classified as complex cases. If NHS Test and Trace is not able to reach an individual testing positive or if no communication details are available, then it is not always possible to know if the case is complex or non-complex. Therefore, these breakdowns are not available.
Figure 6: number of people transferred to the contact-tracing system (includes complex and non-complex cases) by whether they were reached and asked to provide contact details, England, 28 May to 8 July 2020[footnote 13]
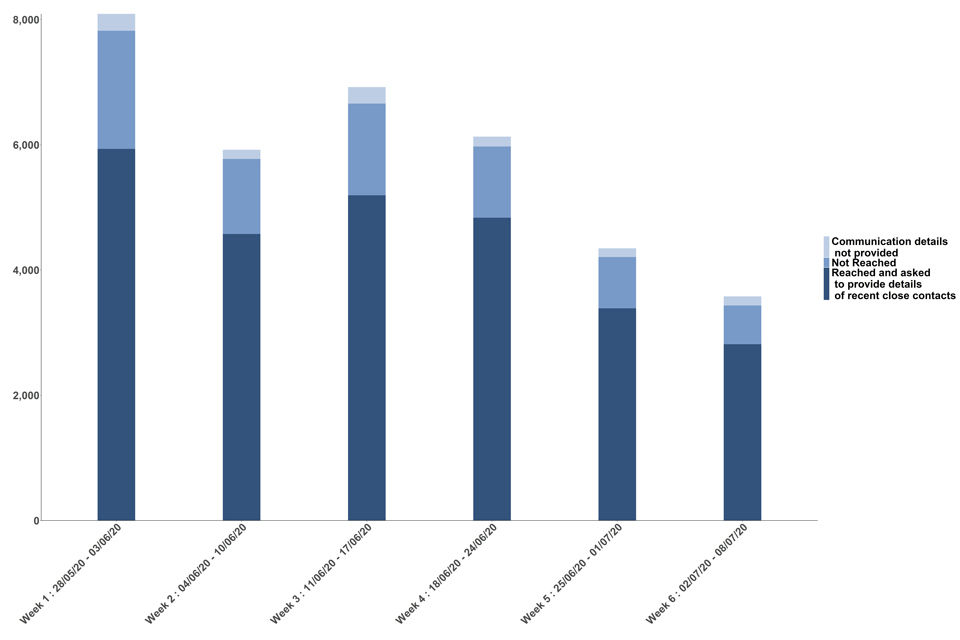
Figure 6: Number of people transferred to the contact tracing system (includes complex and non-complex cases) by whether they were reached and asked to provide contact details, England, 28 May to 08 July 2020
After a person’s coronavirus test is confirmed as positive, they will be transferred to the contact-tracing system to be contacted. The number of these people who were reached and provided details of recent close contacts includes complex cases investigated by local public health teams and people who said that they had no recent close contacts.
People who had no communication details provided are those people for whom there were no contact details (for example, phone number or email address). This information is only available for people whose cases were non-complex and handled through the contact-tracing system, because those handled by local public health teams are managed at a situation rather than individual level.
The number of people who were not reached includes those people who the service has been unable to reach because there has been no response to text, email and call reminders. It also includes people who were reached but declined to give details of close contacts. There may also be a small number of people who have not been reached but where contact tracers are still in the process of trying to make contact.
Between 2 July and 8 July, around 4 in every 5 people who were reached and asked to provide information about their contacts provided one or more close contacts
Table 5: people transferred to the contact-tracing system (includes complex and non-complex cases) who were reached and asked to provide details of recent close contacts by how many contacts they provided details, England
| 25 June to 1 July: number of people (percentage) | 2 July to 8 July: number of people (percentage) | Since Test and Trace launched, 28 May to 8 July: number of people (percentage) | |
|---|---|---|---|
| People who provided details of one or more close contacts | 2,555 (75.4%) | 2,201 (78.2%) | 18,339 (68.6%) |
| People who were not able to give any recent close contacts | 834 (24.6%) | 614 (21.8%) | 8,403 (31.4%) |
| Total | 3,389 | 2,815 | 26,742 |
Not everyone who was reached and asked to provide details of recent close contacts will have had any recent close contacts. The number who were not able to give any recent close contacts therefore refers to people who were successfully reached by NHS Test and Trace, but could not provide details of close recent contacts to pass on for further contact tracing (for example, recent close contact with strangers on the bus).
Figure 7: proportion of people transferred to the contact-tracing system (includes complex and non-complex cases) who were reached and asked to provide details of recent close contacts by how many contacts they provided details for, England, 28 May to 8 July 2020
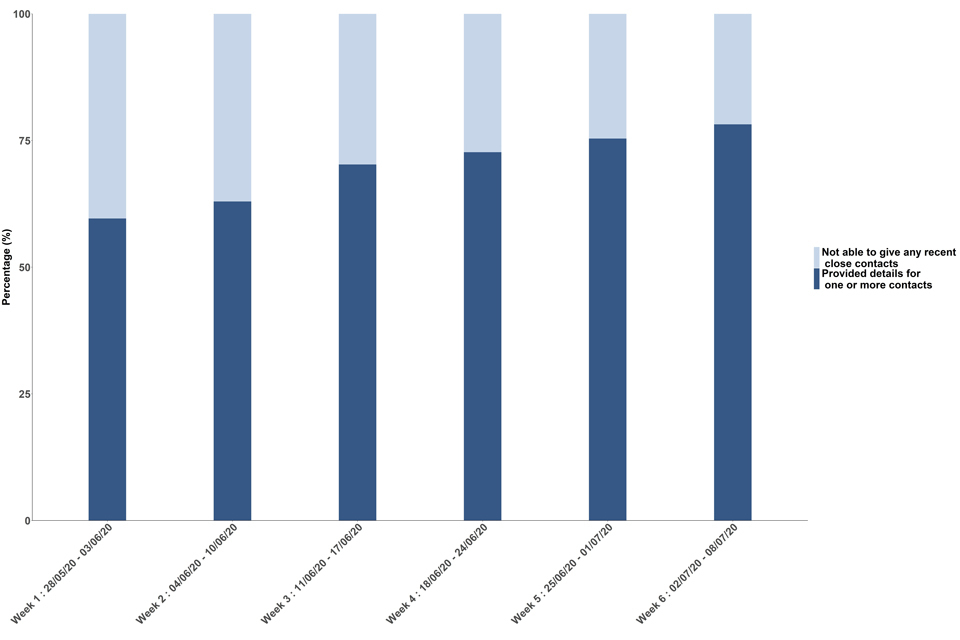
Proportion of people transferred to the contact tracing system (includes complex and non-complex cases) who were reached and asked to provide details of recent close contacts by how many contacts they provided details for, England, 28 May to 08 July 2020
For non-complex cases most people continued to be successfully reached and asked to provide details about recent close contacts within 24 hours of their case being transferred to contact tracing
Figure 8: proportion of people who were reached and asked to provide details about recent close contacts by time taken to reach them, England, 28 May to 8 July 2020 (excludes complex cases)
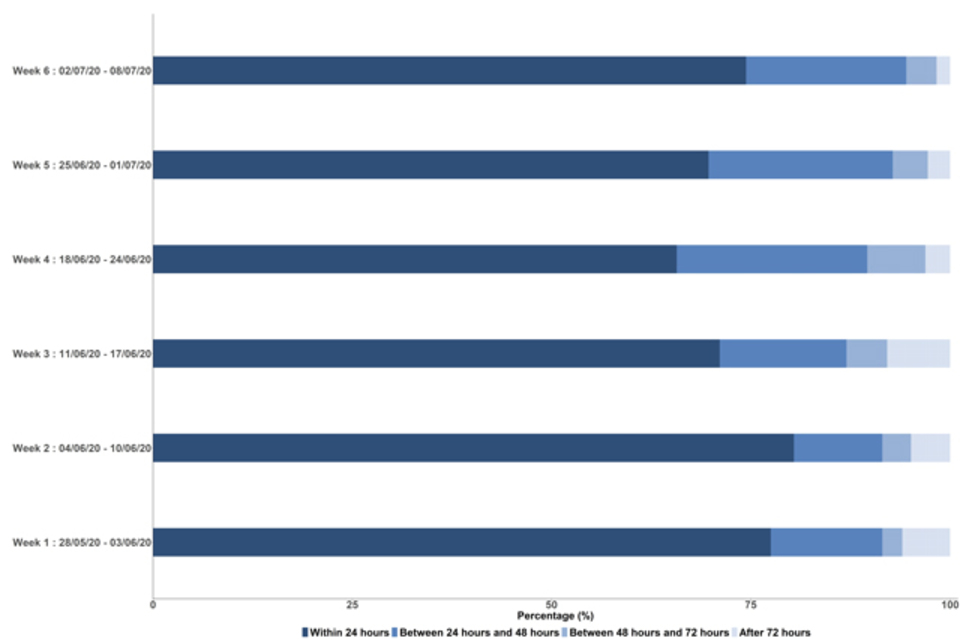
Figure 8: Proportion of people who were reached and asked to provide details about recent close contacts by time taken to reach them, England, 28 May to 08 July 2020, this excludes complex cases
Table 6: people who were reached and asked to provide details about recent close contacts by time taken to do so, England, 28 May to 8 July 2020 (excludes complex cases)
| 25 June to 1 July: number of people (percentage) | 2 July to 8 July: number of people (percentage) | Since Test and Trace launched, 28 May to 8 July: number of people (percentage) | |
|---|---|---|---|
| Within 24 hours | 2,082 (69.7%) | 1,900 (74.4%) | 15,863 (73.0%) |
| Between 24 and 48 hours | 690 (23.1%) | 513 (20.1%) | 3,870 (17.8%) |
| Between 48 and 72 hours | 131 (4.4%) | 98 (3.8%) | 983 (4.5%) |
| After 72 hours | 84 (2.8%) | 44 (1.7%) | 1,022 (4.7%) |
| Total | 2,987 | 2,555 | 21,738 |
Number of recent close contacts identified through the contact-tracing system
Close contacts are those people who have been identified as being in recent close contact with someone who has tested positive for coronavirus.
Table 7: number of people identified as recent close contacts by whether they were reached and asked to self-isolate, England, 28 May to 8 July 2020. Includes both complex and non-complex contacts
| 25 June to 1 July: number of people (percentage) | 2 July to 8 July: number of people (percentage) | Since Test and Trace launched, 28 May to 8 July: number of people (percentage) | |
|---|---|---|---|
| Total number of close contacts identified | 15,272 | 13,807 | 185,401 |
| Close contacts reached and asked to self-isolate | 10,929 (71.6%) | 9,811 (71.1%) | 155,889 (84.1%) |
| Close contacts not reached (includes those where no communication details were provided) | 4,343 (28.4%) | 3,996 (28.9%) | 29,512 (15.9%) |
Table 8: number of people identified as recent close contacts by complex and non-complex contacts, England, 28 May to 8 July 2020
| 25 June to 1 July: number of people (percentage) | 2 July to 8 July: number of people (percentage) | Since Test and Trace launched, 28 May to 8 July: number of people (percentage) | |
|---|---|---|---|
| Total number of non-complex close contacts | 8,861 | 8,464 | 59,456 |
| Close contacts reached and asked to self-isolate | 4,943 (55.8%) | 4,667 (55.1%) | 31,768 (53.4%) |
| Close contacts not reached | 1,995 (22.5%) | 1,984 (23.4%) | 13,687 (23.0%) |
| Communication details not provided | 1,923 (21.7%) | 1,813 (21.4%) | 14,001 (23.5%) |
| Total number of complex close contacts | 6,411 | 5,343 | 125,945 |
| Close contacts reached and asked to self-isolate | 5,986 (93.4%) | 5,144 (96.3%) | 124,121 (98.6%) |
| Close contacts not reached | 425 (6.6%) | 199 (3.7%) | 1,824 (1.4%) |
Of the people who were identified as recent close contacts but not reached, some of these could not be reached because no communication details were provided for them (for example, a phone number or email address). This information is only available for recent close contacts classified as non-complex. This data is not available for recent close contacts classified as complex because these are usually managed at a situation (for example, a care home) rather than individual level.
The number of non-complex close contacts identified has fallen by approximately 16% since the start of contact tracing. This is likely due to the decrease in people testing positive, and therefore a decrease in people transferred to contact tracing
Out of all the non-complex contacts that were identified between 2 July and 8 July, 21.4% did not have communication details. Out of all the non-complex contacts that were identified between 28 May and 8 July, 23.5% did not have communication details.
The number who were not reached includes those people who the service has been unable to reach because there has been no response to text, email and call reminders, or those for which no contact details were provided to NHS Test and Trace (for example, phone number or email address). Further, there are some contacts who were reached but have not agreed to self-isolate.
Figure 9: number of recent close contacts classified as non-complex by whether they were reached and asked to self-isolate, England, 28 May to 8 July 2020
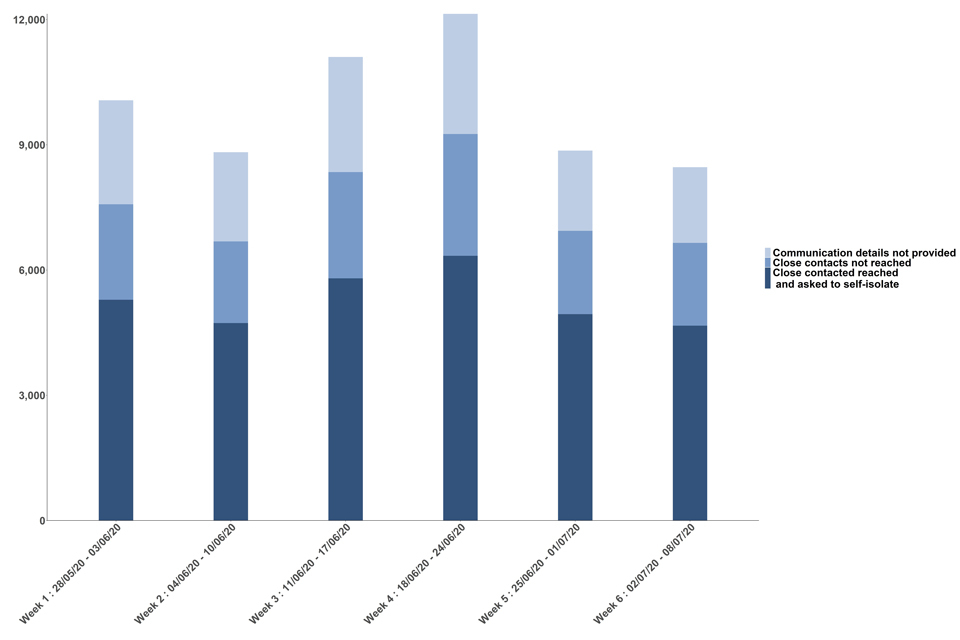
Figure 9: Number of recent close contacts classified as non-complex by whether they were reached and asked to self-isolate, England, 28 May to 08 July 2020.
The number of complex close contacts identified has fallen by approximately 88% since the start of contact tracing
The number of close contacts identified in complex cases has fallen more than the number in non-complex cases since the start of contract tracing (87.6% and 15.9% respectively). As non-complex cases have a higher proportion of contacts who are unable to be reached, this has contributed to the reduction in the overall percentage of contacts who were reached and asked to self-isolate, from 90.8% in week 1 to 71.1% in week 6.
Figure 10: number of recent close contacts classified as complex by whether they were reached and asked to self-isolate, England, 28 May to 8 July 2020
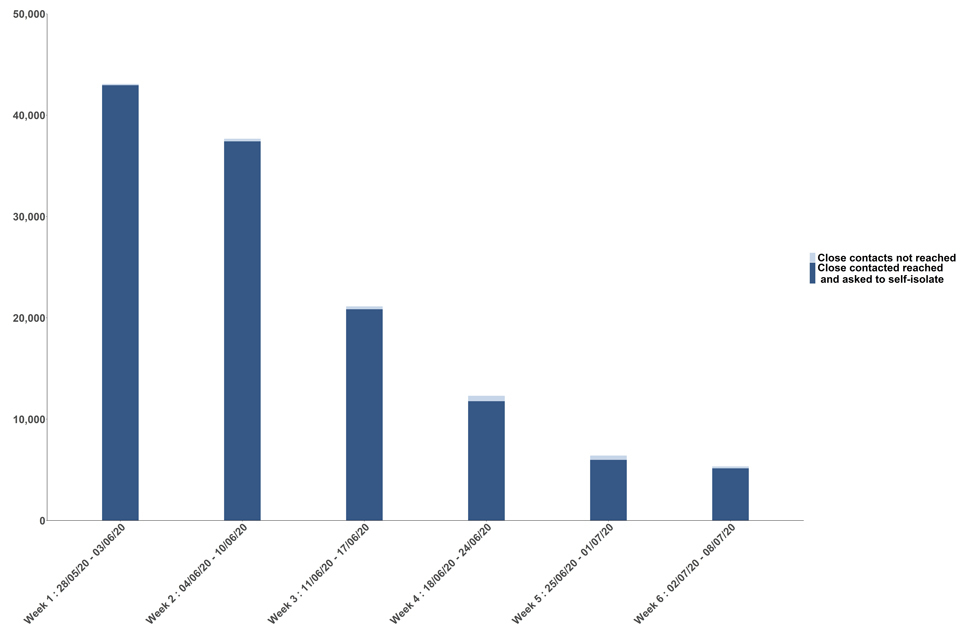
Figure 10: Number of recent close contacts classified as complex by whether they were reached and asked to self-isolate, England, 28 May to 08 July 2020.
For non-complex contacts who were advised to self-isolate, more than 4 out of 5 of them were reached within 24 hours of being identified
Figure 11: proportion of recent close contacts who were advised to self-isolate by time taken to reach them, England, 28 May to 8 July 2020. This does not include complex contacts
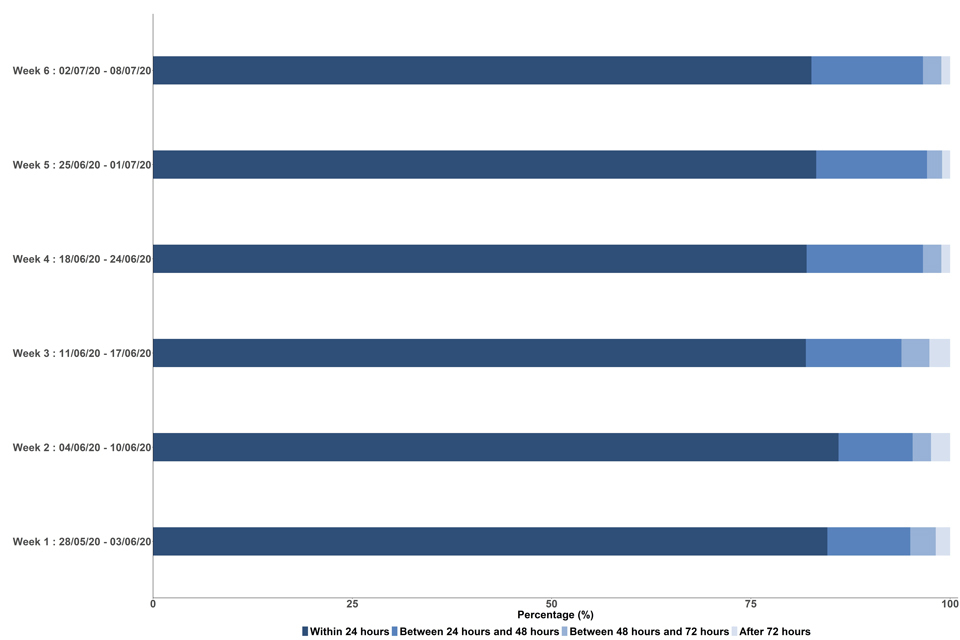
Figure 11: Proportion of recent close contacts who were advised to self-isolate by time taken to reach them, England, 28 May to 08 July 2020. This does not include complex contacts.
Table 9: people identified as recent close contacts who were advised to self-isolate by time taken to reach them England, 28 May to 8 July 2020. This excludes complex contacts
| 25 June to 1 July: number of people (percentage) | 2 July to 8 July: number of people (percentage) | Since Test and Trace launched, 28 May to 8 July: number of people (percentage) | |
|---|---|---|---|
| Within 24 hours | 4,109 (83.2%) | 3,853 (82.6%) | 26,413 (83.3%) |
| Between 24 and 48 hours | 684 (13.9%) | 653 (14.0%) | 3,943 (12.4%) |
| Between 48 and 72 hours | 96 (1.9%) | 107 (2.3%) | 826 (2.6%) |
| After 72 hours | 48 (1.0%) | 49 (1.1%) | 529 (1.7%) |
| Total | 4,937 | 4,662 | 31,711 |
Measuring the data
How the data were collected
These data are collected from management information from the NHS Test and Trace service. More details about the methodology used can be found in the methodology document.
Future development
We have integrated these data with those from other parts of NHS Test and Trace, particularly testing, to provide an end-to-end view of the service that follows the user journey. So far, testing data for pillars 1 and 2 and testing turnaround times for pillar 2 have been added. We are working towards aligning the NHS and PHE reporting methodologies in order to add testing turnaround times for pillar 1 into the publication.
The intention is for the NHS Test and Trace service to publish weekly statistics. In addition, NHS Test and Trace will provide information for local authorities and their partners so that they have the information they need to help contain any outbreaks.
In time, NHS Test and Trace intends to publish detailed data from across the programme to support secondary analysis, for example in academic institutions. Over the coming weeks, as the service matures, more information will be provided on a weekly basis. For future releases, we are working to develop statistics for home-testing kit return rates and details about testing in care homes.
Quality
These statistics have been put together by NHS Test and Trace with advice from the Office for National Statistics.
More information on quality and how this publication adheres to the Code of Practice for statistics is available in the statement of compliance.
Strengths and limitations
Given the importance of this service and the commitment of NHS Test and Trace to be open and transparent with the public it serves, these data are being released at the earliest possible opportunity.
However, new IT systems and statistical outputs often take a period of time to bed in. These data should therefore be treated with caution as the system and understanding of the data develops.
The figures presented are based on a data cut 6 days after the end of the reporting period, to give time for test results and cases reported at the end of the 7-day period to have an outcome. Some cases and test results may continue to be in progress after this period, and therefore data may need to be revised over time.
Feedback
For feedback and questions about the release, please contact statistics@dhsc.gov.uk.
-
Some people may have had their case transferred to the contact-tracing system more than once. Currently, there is not a rigorous process for de-duplication of the data being passed into the contact-tracing system each day, as the emphasis is on transferring these cases quickly. Therefore, there may be more people transferred to contact tracing than test positive for coronavirus within a given period. ↩
-
People tested under pillar 3 (serology testing to show if people have antibodies from having had COVID-19) and pillar 4 (serology and swab testing for national surveillance) do not have their cases transferred to NHS Test and Trace. ↩
-
More details can be found in the policy paper Coronavirus (COVID-19): scaling up our testing programmes. ↩
-
For example, if someone works in or has recently visited: a health or care setting, such as a hospital or care home; a prison or other secure setting; a school for people with special needs; critical national infrastructure or areas vital for national security. ↩
-
Figures for people testing positive have been de-duplicated so people who have multiple tests in both pillars 1 and 2 would only appear once. The number of people testing positive in pillar 1 may also include people tested anonymously as part of surveillance studies, and therefore will not have their case transferred to contact tracing. ↩
-
Please note the number of people receiving results within a given time is not the same as the number of people tested, because people may be tested more than once. ↩
-
In-person tests are those from regional test sites and mobile testing units. Home/satellite tests are those from satellite test centres and home testing kits. ↩
-
Please note the number of people receiving results within a given time is not the same as the number of people tested, because people may be tested more than once. ↩
-
Please note the number of people receiving results within a given time is not the same as the number of people tested, because people may be tested more than once. ↩
-
Please note the number of people receiving results within a given time is not the same as the number of people tested, because people may be tested more than once. ↩
-
This data does not include Randox tests, as these are handled through a different system. Randox tests make up a significant proportion of the tests conducted in care homes, which form part of the satellite test centres. ↩
-
Between 11 and 24 June, more people were transferred to the contact-tracing system than tested positive because this includes some cases from the previous week. This is a result of the time between a sample being taken, tested and reported and being passed from PHE to the contact-tracing system. ↩
-
Data has been split to show those cases whose communication details were not provided. Previous publication included cases where communication details were not provided under ‘Not reached and asked to provide contact details’. Numbers have been revised for previous weeks to account for new methodology. ↩