HPR volume 12 issue 46: news (21 December)
Updated 21 December 2018

© Crown copyright 2018
This publication is licensed under the terms of the Open Government Licence v3.0 except where otherwise stated. To view this licence, visit nationalarchives.gov.uk/doc/open-government-licence/version/3 or write to the Information Policy Team, The National Archives, Kew, London TW9 4DU, or email: psi@nationalarchives.gov.uk.
Where we have identified any third party copyright information you will need to obtain permission from the copyright holders concerned.
This publication is available at https://www.gov.uk/government/publications/health-protection-report-volume-12-2018/hpr-volume-12-issue-46-news-21-december
SSIs in England: annual report in summary
Public Health England (PHE) has published the latest annual report summarising data submitted by 201 NHS hospitals, and 8 independent sector NHS treatment centres, in England to the national SSI Surveillance Service (SSISS) in 2017 to 2018. The SSISS covers 17 surgical categories spanning general, cardiothoracic, neurosurgery, gynaecology, vascular, gastroenterology, and orthopaedic surgery [1].
For the orthopaedic surveillance categories, NHS trusts carrying out these procedures are required by the Department of Health to undertake surveillance of SSI for a minimum of one 3-month surveillance period per financial year in at least one of four categories (hip replacement, knee replacement, reduction of long bone fracture and repair of neck of femur). The annual report includes accompanying supplementary tables presenting trust level SSI risk results for these mandatory orthopaedic categories [2].
Surveillance of SSIs is undertaken using standard definitions for infections that affect the superficial incisional site, deeper incisional layers or those involving the joint or organ-space [3]. Patients are systematically, prospectively followed up to identify infections occurring within 30 days of surgery or within one year if a prosthetic implant is used.
The annual report presents inpatient and readmission SSI risk, trends in SSI incidence and variation in SSI risk among participating hospitals. It also includes risk-stratified SSI rates and characteristics of SSI including microbial aetiology.
Key findings
- surveillance data for 134,119 procedures and 1,338 surgical site infections (SSIs) detected during inpatient stay or on readmission to hospital were submitted to SSISS in 2017 to 2018
- for the mandatory orthopaedic surveillance categories, 3 NHS trusts were identified as high outliers and 1 trust as a low outlier. Trust-level SSI risk results for the mandatory surveillance showed much less variation in 2017 to 2018 than previous years. For hip and knee replacement surgery, most trusts grouped around the national benchmark (0.6% and 0.5%, respectively).
- cumulative SSI incidence (data from April 2013 to March 2018) varied by surgical category depending on the level of wound contamination inherent to those procedures; as in previous reports, SSI incidence remained highest for large bowel surgery (8.7%) and lowest for hip and knee replacement surgery (<1%)
- assessment of trends identified a slight decrease in the annual SSI risk for hip and knee replacement in 2017/18 (from 0.6% and 0.5% in 2016/17 to 0.5% and 0.4%, respectively). In contrast, large and small bowel surgery both saw increases in annual SSI risk after recent downward trends (from 7.8% and 5.0% in 2016/17 to 8.5% and 6.5% in 2017/18, respectively)
- cranial surgery had the highest proportion of SSI classified as deep incisional or organ/space (85%); small bowel surgery had the highest proportion (58%) of SSI classified as superficial incisional
- Enterobacteriaceae made up the largest proportion of causative microorganisms, accounting for 31% of SSIs in 2017/18 across all surgical categories. Prevalence of Enterobacteriaceae was highest in large bowel surgery (53%) and coronary artery bypass graft (29%)
- between 2016 to 2017, to 2017 to 2018, the prevalence of SSI-causing coagulase-negative staphylococci (CoNs) showed the greatest relative increase, accounting for 20% of SSIs in 2017 to 2018
References
- PHE (19 December 2018). Surveillance of surgical site infections in NHS hospitals in England, 2017 to 2018.
- PHE (19 December 2018). Surgical site infections surveillance: NHS Trust tables 2017 to 2018.
- PHE (June 2013). Protocol for the surveillance of surgical site infection (version 6).
Mandatory HCAI reports quarterly trends: July to September 2018
PHE’s latest quarterly epidemiological commentary on trends in reports of Staphylococcus aureus (MRSA and MSSA) and Gram-negative bacteraemia, and of Clostridium difficile infections, mandatorily reported by NHS acute trusts in England up to July to September 2018, has been published on the GOV.UK website [1]. Some key facts are listed below.
MRSA bacteraemia
There was a steep decline of 85% in the incidence rate of all reported cases between April to June 2007 and January to March 2014 from 10.2 cases per 100,000 population to 1.5. The rate has remained broadly stable at around 1.5 cases per 100,000 population between January to March 2014 and July to September 2018. Since January to March 2014, the rate of hospital-onset cases has remained broadly stable at around 1.0 cases per 100,000 bed-days.
MSSA bacteraemia
All reported cases of MSSA bacteraemia increased by 36% from 2,199 to 2,989 between January to March 2011 and July to September 2018, and the rate increased from 16.8 to 21.3 per 100,000 population. Counts and incidence rate of community-onset cases increased by 48% and 38%, respectively: from 1,464 to 2,166 cases, and from 11.2 to 15.5 cases per 100,000 population. Over the same period, counts of hospital-onset case increased by 12% (735 to 823 cases) and the incidence rate increased 15% (8.4 to 9.6 cases per 100,000 bed-days).
Escherichia coli bacteraemia
Between July to September 2011 and July to September 2018, both counts and incidence rate of all reported cases of E. coli bacteraemia increased by 34%: from 8,725 to 11,275 cases, and from 61.8 to 82.9 cases per 100,000 population, respectively. Similarly, over the same period, both counts and incidence rate of community-onset cases increased by 46%, from 6,279 to 9,632, and from 46.9 to 68.7 cases per 100,000 population.
Unlike community-onset cases, the incidence rate of hospital-onset cases has remained relatively stable with rates of 23.7 (n=1,996) and 23.2 (n=1,986) per 100,000 bed-days in July to September 2011 and July to September 2018, respectively.
Klebsiella spp. bacteraemia
Between April to June 2017 and July to September 2018, there was a 22% increase in counts, and a 20% increase in the incidence rate, of all reported Klebsiella spp. bacteraemia cases: from 2,334 to 2,840 and from 16.8 to 20.3 cases per 100,000 population, respectively. The counts and incidence rate of community-onset cases also increased by 16% from 1,669 to 1,943 cases, and by 15% from 12.0 to 13.9 cases per 100,000 population, respectively. Over the same period, the counts and the incidence rate of hospital-onset cases increased by 35%, from 664 to 897 cases, and by 36% from 7.7 to 10.5 cases per 100,000 bed-days, respectively.
Pseudomonas aeruginosa bacteraemia
Between April to June 2017 and July to September 2018, there was a 17% increase in the counts of P. aeruginosa from 1,009 to 1,184 cases; accordingly, the incidence rate also increased during this period by 16% from 7.3 to 8.4 cases per 100,000 population. Over the same period both counts and the incidence rate of community-onset cases increased 20% and 19%, respectively: from 636 to 763 cases, and from 4.6 to 5.4 cases per 100,000 population, respectively. Over the same period, the counts and incidence rate of hospital-onset cases increased: by 13% – from 373 to 421 cases – and by 14% from 4.3 to 4.9 cases per 100,000 bed-days, respectively.
C. difficile infection (CDI)
Between April to June 2007 and January to March 2012 there was a 78% decrease in all reported cases of CDI – from 16,864 to 3,711 cases, and an associated 79% reduction in incidence rate (per 100,000 population) from 131.6 to 27.9. Subsequently, between January to March 2012 and July to September 2018, the count of all reported cases fell by 3% from 3,711 to 3,592 cases and the incidence rate reduced by 8% from 27.9 and 25.6.
There were similar but greater, reductions among hospital-onset CDI cases: an 85% reduction in cases from 10,436 to 1,613 cases and an 84% reduction in incidence rate from 112.5 to 18.2 per 100,000 bed-days between April to June 2007 and January to March 2012. This was followed by a further 24% decrease in the count of cases from 1,613 to 1,220 cases, and a decrease of 22% in the incidence rate from 18.2 to 14.3 cases per 100,000 bed-days, between January to March 2012 and July to September 2018.
Reference
- PHE (13 December 2018). Quarterly epidemiological commentary: mandatory MRSA, MSSA, Gram-negative bacteraemia, and C. difficile infection data (up to July to September 2018).
EVD outbreak in eastern DRC: fourth update
The outbreak of Ebola virus disease declared on 1 August in eastern Democratic Republic of the Congo continues unabated despite significant efforts at control by the DRC government, the World Health Organization and international partners.
To date, 506 confirmed cases and 48 probable cases have been reported across 15 health zones in North Kivu and Ituri provinces [1], representing an increase of 152 new and eight retrospectively confirmed cases since the last update on 23 November [2].
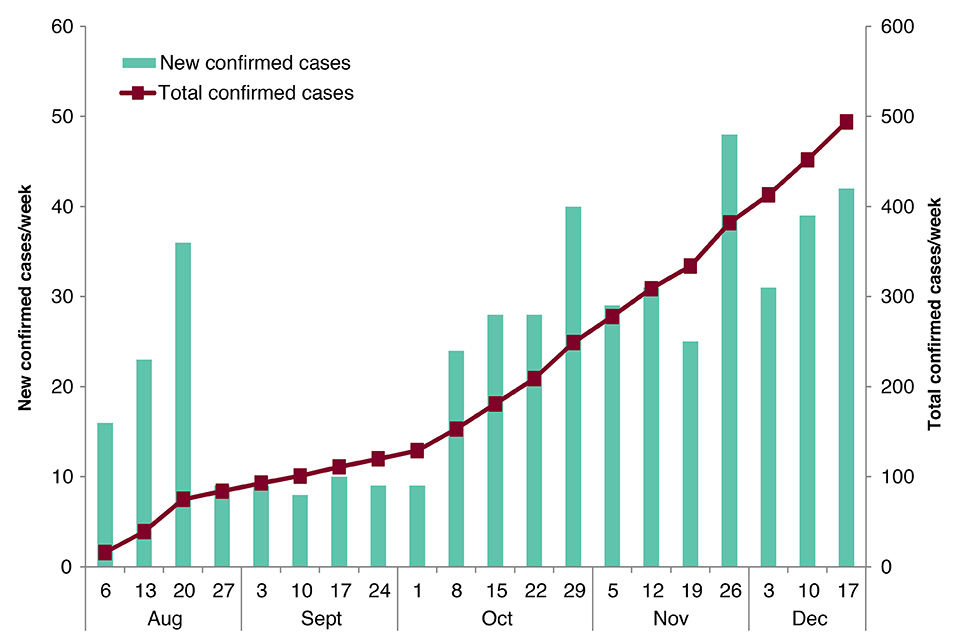
New and total confirmed cases by week. Data provided by DRC MoH [1]. Note: data have been retrospectively adjusted to reflect late reporting of eight confirmed cases diagnosed in October. As no epidemiological information was supplied, all eight cases have been attributed to week-ending 29 October.
There are 2 main issues of concern. Firstly, a high proportion of new cases continue to be reported in individuals either not identified as contacts of confirmed cases or known contacts not under active monitoring at the time of symptom onset or diagnosis. Secondly, the increasing geographical distribution of new cases in the last month and this has resulted in a stretching of resources to support Ebola control measures (for example contact tracing, vaccination and safe burials). Cases have re-emerged in health zones where transmission appeared to be controlled highlighting the high risk of both spread and reintroduction of the virus to previously affected areas [3]. These latest data indicate ongoing, and possibly undetected, transmission within multiple communities.
Over 30,000 contacts have been registered to date of which more than 7,000 are currently under surveillance [3].
The risk to the UK public remains very low to negligible. The situation is being monitored closely and the risk assessment is regularly reviewed.
Further information sources
- PHE website Ebola collection Ebola virus disease: clinical management and guidance
- NaTHNaC website for travel advice Travel Health Pro website
- WHO website EVD homepage Ebola virus disease
- FCO website DRC advice
References
-
DRC Ministry of Health (in French).
-
“EVD outbreak in eastern DRC: third update”, HPR 12(42), 23 November 2018.
-
WHO AFRO Situation Report No. 20.
PHE call for reporting of acute flaccid paralysis cases
Public Health England has seen an increase in reports of unexplained acute neurological symptoms, particularly acute flaccid paralysis (AFP), in 2018, the majority being in children [1].
As elsewhere in Europe and in the USA, where similar increases have been seen, relevant clinical networks have been alerted to report all suspected cases of AFP [2-3]. PHE is investigating the aetiology of the current increase, to understand the clinical history and the outcome.
Viruses known to cause AFP include polioviruses and non-polio enteroviruses. To date, polio has not been excluded as an explanation of the current increase. PHE is investigating the role of other enteroviruses including enterovirus D68 (EV-D68) as a putative cause of AFP. Twenty-eight cases of acute flaccid paralysis (AFP) and acute flaccid myelitis (AFM) had been reported in England, as at 19 December 2018 [1]. Information on the reporting, investigation and management of AFP, including information for patients, is brought together in a new PHE website collection [4].
References
- “PHE investigating rise in reports of rare illness”, GOV.UK news story, 19 December 2018.
- GOV.UK. Acute flaccid paralysis: investigating and reporting a case.
- GOV.UK. Acute flaccid paralysis: reporting form.
- GOV.UK collection. Acute flaccid paralysis syndrome.
PHE coordinates UK’s first National Radon Action Plan
Radon is the second most important cause of lung cancer, and is linked to more than 1,000 deaths each year in the UK.
The PHE Radon Group has been coordinating a cross-government programme to produce a National Radon Action Plan (NRAP) for the UK [1]. The NRAP describes the national radon strategy and arrangements for managing exposure to radon in homes and workplaces, and considers possible new areas of work.
Delivery of the Plan is one of a number of new legal radon requirements (in Statutory Instrument 2018/482), which implements part of the 2013 EU Basic Safety Standards Directive on protection against ionising radiation. PHE already delivers a number of these including:
- providing reference levels of radon concentration in homes
- providing radon information and guidance [2,3]
- providing maps that identify areas of radon risk [3]
References
- GOV.UK National Radon Action Plan.
- GOV.UK Radon collection.
- www.ukradon.org.
HPR subscriber satisfaction survey
To inform improvements in the Health Protection Report, we invite readers and subscribers to complete this survey.
Infection reports in this issue
This issue includes: