Fire and rescue incident statistics, England, year ending June 2020
Updated 13 November 2020
Applies to England

© Crown copyright 2020
This publication is licensed under the terms of the Open Government Licence v3.0 except where otherwise stated. To view this licence, visit nationalarchives.gov.uk/doc/open-government-licence/version/3 or write to the Information Policy Team, The National Archives, Kew, London TW9 4DU, or email: psi@nationalarchives.gov.uk.
Where we have identified any third party copyright information you will need to obtain permission from the copyright holders concerned.
This publication is available at https://www.gov.uk/government/statistics/fire-and-rescue-incident-statistics-england-year-ending-june-2020/fire-and-rescue-incident-statistics-england-year-ending-june-2020
Frequency of release: Quarterly
Forthcoming releases: Home Office statistics release calendar
Home Office responsible statistician: Deborah Lader
Press enquiries: pressoffice@homeoffice.gov.uk Telephone: 0300 123 3535
Public enquiries: firestatistics@homeoffice.gov.uk
This release contains statistics about incidents attended by fire and rescue services (FRSs) in England for the year ending June 2020. The statistics are sourced from the Home Office’s online Incident Recording System (IRS) and include statistics on all incidents, fire-related fatalities and casualties from fires, with long term comparisons.
Key results
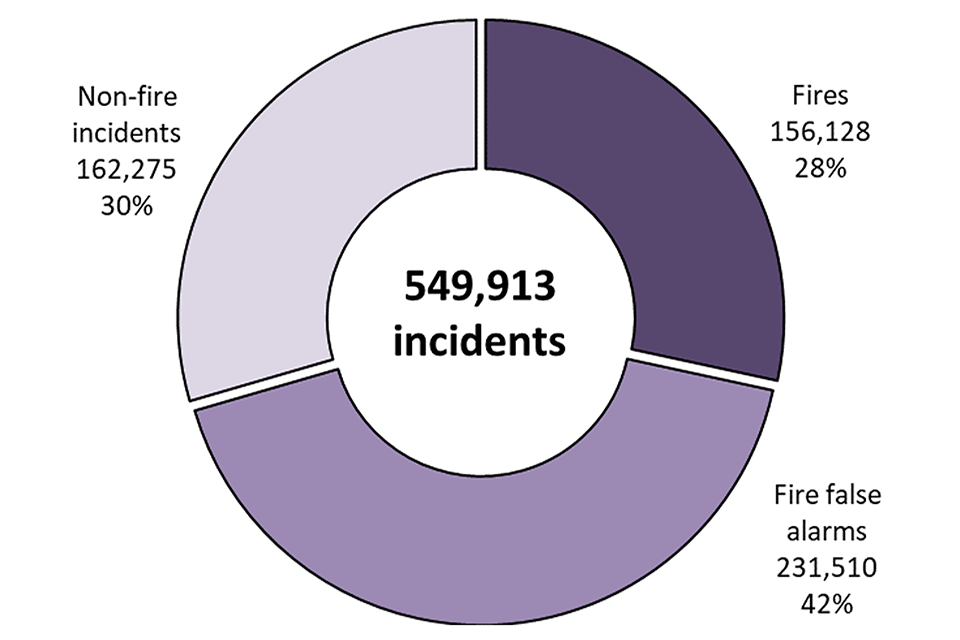
FRSs attended 549,913 incidents in the year ending June 2020. This was a four per cent decrease compared with the previous year (573,776). Of these incidents, there were 156,128 fires. This was a 15 per cent decrease compared with the previous year (182,661) with falls in all types of fires but particularly driven by a 20 per cent fall in secondary fires now that the hot, dry 2018 summer is in the comparator year.
There were 231 fire-related fatalities in the year ending June 2020 compared with 271 in the previous year. Weekly figures during the National COVID-19 Lockdown generally show that incident figures were no higher or lower than typically seen in 2015 to 2019. The only exception to this is Road Traffic Collisions which saw fewer incidents than our analysis would describe as typical.
1. Incident summary
Incidents that FRSs attend are categorised into three main types - fires attended, non-fire incidents and fire false alarms.
Key results
In the year ending June 2020:
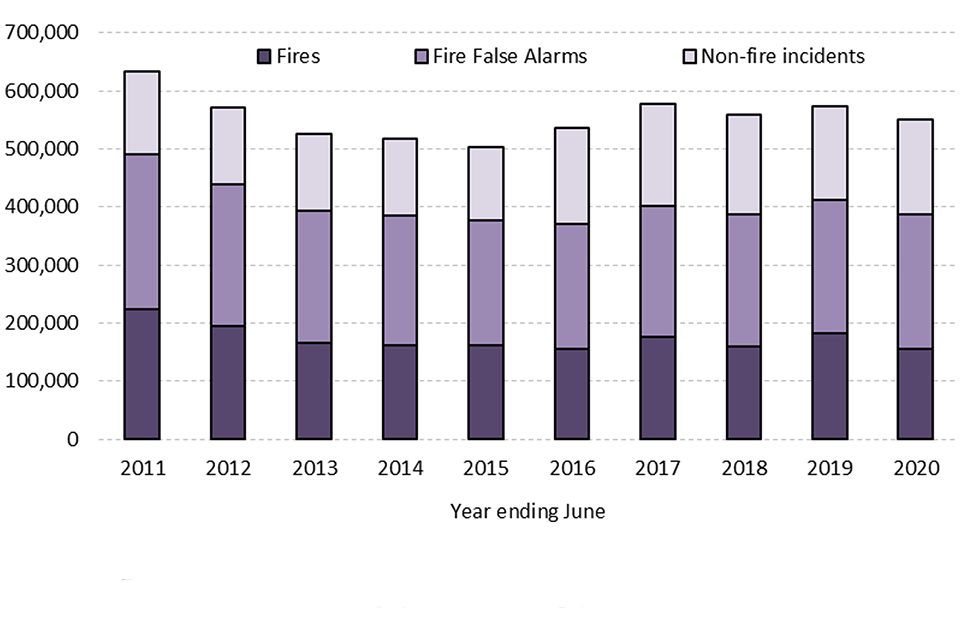
- 549,913 incidents were attended by FRSs. This was a four per cent decrease compared with the previous year (573,776), an 11 per cent increase compared with five years ago (496,136) but a 19 per cent decrease compared with ten years ago (680,634). The decrease this year compared with last year was driven by a decrease in the number of fires attended, particularly secondary fires. (Source: FIRE0102)
- Of all incidents attended by FRSs, fires accounted for 28 per cent, fire false alarms 42 per cent and non-fire incidents 30 per cent. This compares with fires accounting for 35 per cent, fire false alarms 42 per cent and non-fire incidents 23 per cent ten years ago. (Source: FIRE0102)
The number of incidents attended by FRSs in England peaked in 2003/04, at over one million incidents. For around a decade, there was a general decline in all three categories of incidents attended and between 2012/13 and 2015/16 there were around half a million a year. Since 2015/16 this number rose to around 576,000 incidents in 2018/19 then fell to around 550,000 in the year ending June 2020.
In contrast to the earlier decreases (caused by a reduction in fire and fire false alarm incidents), the increase in total incidents between 2014/15 and 2018/19 was driven by increases in fire and non-fire incidents. The increase in non-fire incidents was mainly due to the changes in the number of medical incidents and collaboration incidents attended, which are discussed in Section 4. This year’s decrease compared with the year ending June 2019 was driven by a decrease in the number of fires attended due to the hot, dry summer of 2018 being in the comparator year.
Figure 1.1: Total incidents attended by incident type, England; year ending June 2020
Source: FIRE0102
Notes:
- Non-fire incidents include non-fire false alarms
2. Fires attended
Fire incidents are broadly categorised as primary, secondary or chimney fires depending on the location, severity and risk levels of the fire, and on the scale of response needed from FRSs to contain them.
Primary fires are those that meet at least one of the following criteria – occurred in a (non-derelict) building, vehicle or outdoor structure or involved a fatality, casualty or rescue or were attended by five or more pumping appliances.
Secondary fires are generally small outdoor fires, not involving people or property.
Chimney fires are in (non-industrial) buildings where the flame was contained within the chimney structure.
Key results
In the year ending June 2020:
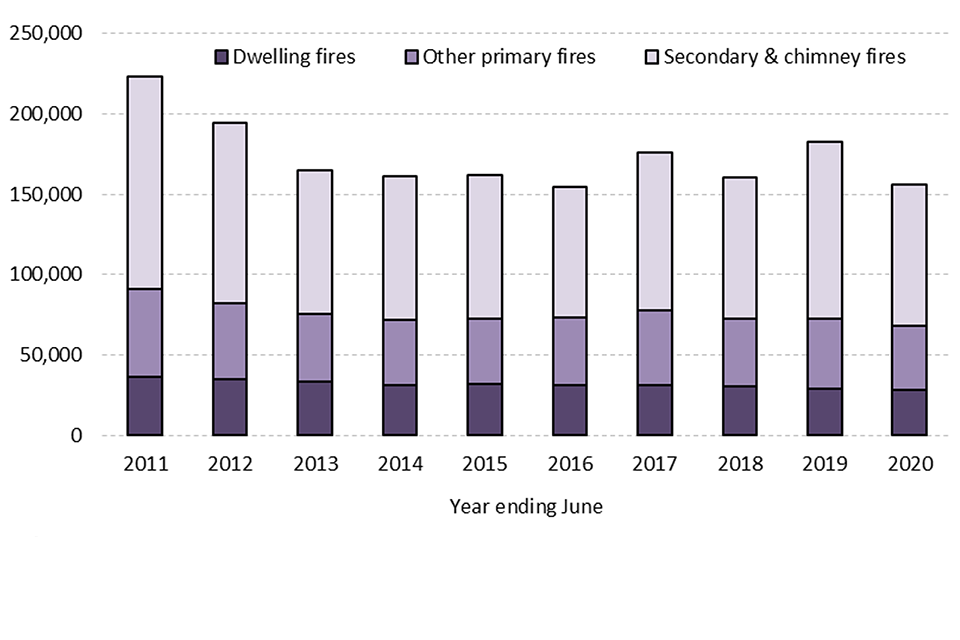
- FRSs attended 156,128 fires, a 15 per cent decrease compared with the previous year (182,661) particularly driven by a 20 per cent decrease in secondary fires (from 107,190 to 85,400) as the hot, dry summer of 2018 is in the comparator year. (Source: FIRE0102)
- There were 67,720 primary fires, a six per cent decrease compared with the previous year (72,091) with all four categories of primary fires (dwelling fires, other building fires, vehicle fires and outdoor primary fires) showing decreases over this time. (Source: FIRE0102)
- FRSs attended 783 fires in purpose-built high-rise (10+ storeys) flats, a two per cent decrease compared with the previous year (800) and three per cent of the 28,398 primary dwelling fires attended. (Source: FIRE0205)
The long-term picture shows that the total number of fires attended by FRSs decreased for around a decade – falling by around two thirds from a peak of around 474,000 in 2003/04 to around 154,000 in 2012/13. The total number of fires has fluctuated since 2012/13.
The total number of fires decreased by 15 per cent from 182,661 in the year ending June 2019 to 156,128 in the year ending June 2020 (Figure 2.1). There were decreases in all fire types with falls of six per cent (from 72,091 to 67,720) in primary fires and 20 per cent (from 107,190 to 85,400) in secondary fires. The driver of the decrease in secondary fires was the hot, dry summer of 2018 being in the comparator year. Secondary fires display seasonality, with more occurring during the hotter and drier months. The number of fires in the year ending June 2020 showed a one per cent increase compared with five years ago (155,040) and a 35 per cent decrease compared with ten years ago (241,462).
2.1 Primary Fires
In the year ending June 2020 there were 67,720 primary fires (43% of the 156,128 fires attended). This was a six per cent decrease compared with the previous year (72,091), a five per cent decrease compared with five years ago (71,116) and a 33 per cent decrease compared with ten years ago (101,159). Compared with last year, there were decreases of three per cent in dwelling fires, seven per cent in other buildings fires and eight per cent in road vehicle fires. Other outdoor fires decreased by 11 per cent, they are however a relatively small category of primary fire. As with the decrease in secondary fires compared to last year, this is likely due to the hot, dry summer of 2018 now being in the comparator year.
Of the 28,398 primary dwelling fires attended by FRSs, around three-quarters (74%) were in houses, bungalows, converted flats and other properties, whilst around a quarter (26%) were in purpose-built flats.
When looking at fires in purpose-built flats in more detail, 17 per cent of all dwelling fires were in purpose-built low-rise (1-3 storeys) flats/maisonettes; seven per cent were in purpose-built medium-rise (4-9 storeys) flats and three per cent were in purpose-built high-rise (10+ storeys) flats.
Figure 2.1: Total fires attended by type of fire, England; year ending June 2011 to year ending June 2020
Source: FIRE0102
3. Fire false alarms
Fire false alarms are where an FRS attends a location believing there to be a fire incident but, on arrival, discovers that no such incident exists or existed. They are broadly categorised by motive into ‘due to apparatus’, ‘good intent’ and ‘malicious’.
Due to apparatus calls are where a fire alarm or fire-fighting equipment operate (including accidental initiation by persons) in error.
Good intent calls are made in good faith in the belief that the FRS really would be attending a fire.
Malicious false alarms are made with the intention of getting the FRS to attend a non-existent incident.
Key results
In the year ending June 2020:
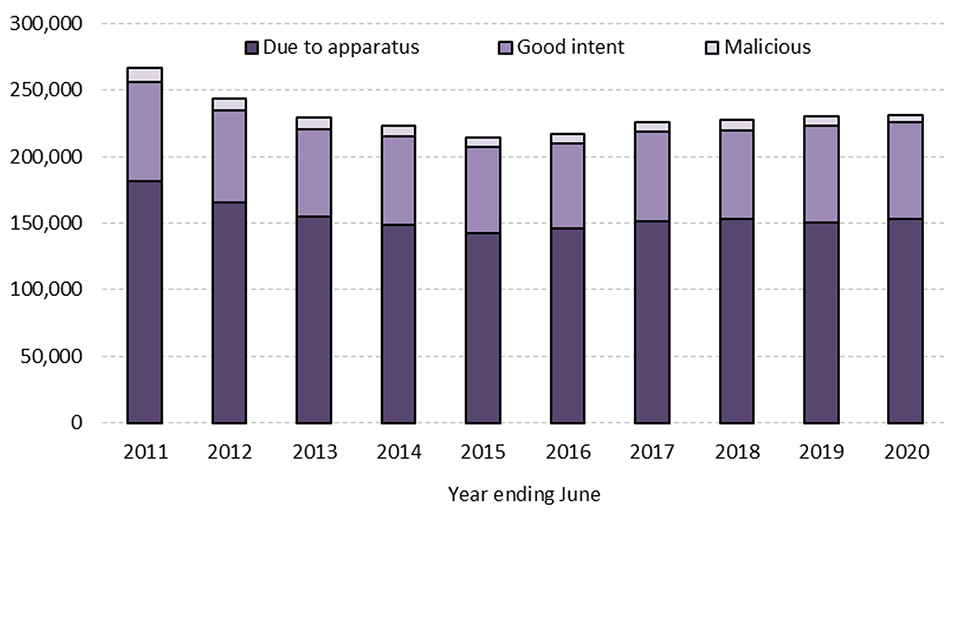
- FRSs attended 231,510 fire false alarms, a one per cent increase with the previous year (229,961), a seven per cent increase compared with five years ago (215,857) and a 19 per cent decrease compared with ten years ago (285,368).
The number of fire false alarms attended by fire and rescue services in England was on a general downward trajectory, from a peak of around 393,900 in 2001/02 to a low of around 214,400 in 2015/16. The number has since climbed to around 231,500 in the year ending June 2020. The proportion of incidents that were fire false alarms has been relatively stable over the past decade, varying between 40 and 44 per cent.
Figure 3.1: Total fire false alarms by type of false alarm, England; year ending June 2011 to year ending June 2020
Source: FIRE0102
Fire false alarms are broadly categorised by motive into ‘due to apparatus’, ‘good intent’ and ‘malicious’. In the year ending June 2020 there were:
- 152,697 fire false alarms due to apparatus: a two per cent increase from the previous year (150,391), a six per cent increase from five years previously (143,711) but a 21 per cent decrease from ten years previously (194,002);
- 72,914 fire false alarms due to good intent: an increase of one per cent from the previous year (72,534), an increase of 12 per cent from five years previously (65,335) and a decrease of eight per cent from ten years previously (78,961); and
- 5,899 malicious fire false alarms: decreases of 16 per cent from the previous year (7,036), 13 per cent from five years previously (6,811) and 52 per cent from ten year previously (12,405). (Source: FIRE0104)
4. Non-fire incidents attended
FRSs attend many types of incident that are not fires or fire false alarms. These are known as non-fire incidents or special service incidents. Examples include flooding incidents, responding to road traffic collisions, animal assistance and collaboration incidents such as effecting entry/exit and assisting other agencies (a complete list can be found in fire data table FIRE0902).
Key results
In the year ending June 2020:
- FRSs attended 162,275 non-fire incidents, a one per cent increase compared with the previous year (161,154) but a 30 per cent increase compared with five years ago (125,239). (Source: FIRE0901, FIRE0902)
- FRSs attended 45,714 collaborating incidents[footnote 1]. This was an eight per cent increase compared with the previous year (42,482) caused by a 20 per cent increase in assisting other agencies over that time.
In April to June 2020
- FRSs attended 4,087 road traffic collisions, the lowest quarterly figure since before this detailed breakdown was first collected in 2009 - this low figure was probably due to the COVID-19 National Lockdown covering much of this time period and the subsequently reduced traffic on the roads . (Source: FIRE0901, FIRE0902)
- FRSs attended 2,642 medical incidents[footnote 2], the lowest quarterly figure since April to June 2010 - This low figure was probably due to the COVID-19 National Lockdown covering much of this time period. (Source: FIRE0901, FIRE0902)
There was a general decline in the number of non-fire incidents attended between 2007/08 and 2014/15 (Figure 4.1). This was followed by a large increase of almost two-fifths to 2016/17 coinciding with the introduction, in 2015, of the National Joint Council (NJC) supported trials of emergency medical responding (EMR) where FRSs formed agreements with ambulance trusts to undertake health and care related work, in particular, co-responding. Following the withdrawal of FBU support in September 2017, the number of these incidents has decreased to a level slightly higher than before the trials and the total number of non-fire incidents has been broadly stable.
Between the year ending June 2015 and the year ending June 2020 the number of collaborating incidents attended has more than doubled (from 21,362 to 45,714), as can be seen in Figure 4.1. The increases coincide with the duty to collaborate legislation, whereby each emergency service “must keep under consideration whether entering into a collaboration agreement with one or more other relevant emergency services in England could be in the interests of the efficiency or effectiveness of that service and those other services.” In the year ending June 2020 FRSs attended 162,275 non-fire incidents. This was a one per cent increase compared with the previous year (161,154), a 30 per cent increase compared with five years ago (125,239) and a six per cent increase compared with ten years ago (153,804). The one percent increase against the previous year encompassed different stories in the largest categories of non-fire incident, as shown in Table 4.1.
Table 4.1: The five largest categories of non-fire incidents attended by FRSs in England in the year ending June 2020, compared with the year ending June 2019
| Year ending | Road traffic collisions | Effecting entry/exit | Assisting other agencies | Medical incidents | Flooding incidents |
|---|---|---|---|---|---|
| June 2019 | 31,222 | 25,071 | 15,463 | 18,499 | 12,810 |
| June 2020 | 27,714 | 25,187 | 18,541 | 16,285 | 15,040 |
| Change | -11% | = | +20% | -12% | +17% |
Source: FIRE0901, FIRE0902
For more detailed information on EMR and collaborating incidents see table FIRE0901 and the Detailed analysis of non-fire incidents: England, April 2018 to March 2019 statistical release.
Figure 4.1: Total non-fire incidents attended by FRSs, England; year ending June 2011 to year ending June 2020
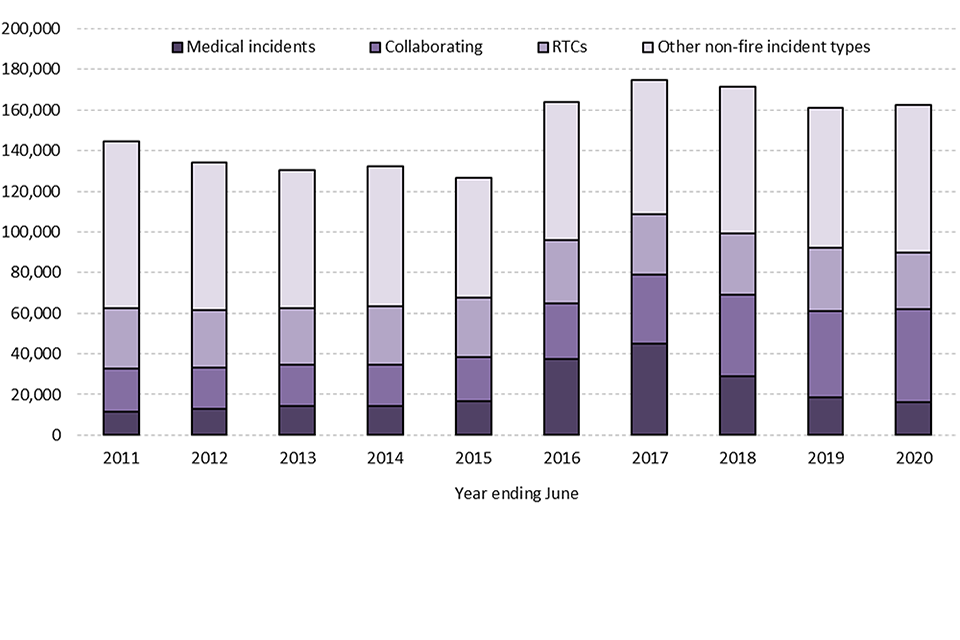
Source: FIRE0901
Notes: Consistent detailed non-fire incident information is only available from April 2010.
5. Fire-related fatalities and casualties
As the Incident Recording System (IRS) is a continually updated database, the statistics published in this release may not match those held locally by FRSs, and revisions may occur in the future (see the revisions section for further detail). This may be particularly relevant for fire-related fatalities, where a coroner’s report could lead to revisions in the data some time after the incident. It should also be noted that the numbers of fire-related fatalities are prone to year-on-year fluctuations due to relatively low numbers.
Fire-related fatalities are those that would not have otherwise occurred had there not been a fire. For the purpose of publications, a fire-related fatality includes those that were recorded as ‘don’t know’.
Non-fatal casualties are those resulting from a fire, whether the injury was caused by the fire or not.
Key results
In the year ending June 2020:
- There were 231 fire-related fatalities (see Figure 4.1) compared with 271 in the previous year (a decrease of 15%) and after a period of fluctuation the lowest 12 month figure since quarterly data became available in 2001/02. (Source: FIRE0502)
- There were 183 fire-related fatalities in dwelling fires, compared with 219 in the previous year (a decrease of 16%).
- There were 6,714 non-fatal casualties[footnote 3], a seven per cent decrease compared with 7,212 in the previous year, this includes 2,878 casualties requiring hospital treatment, a nine per cent decrease compared with the 3,165 in the previous year. (Source: FIRE0502)
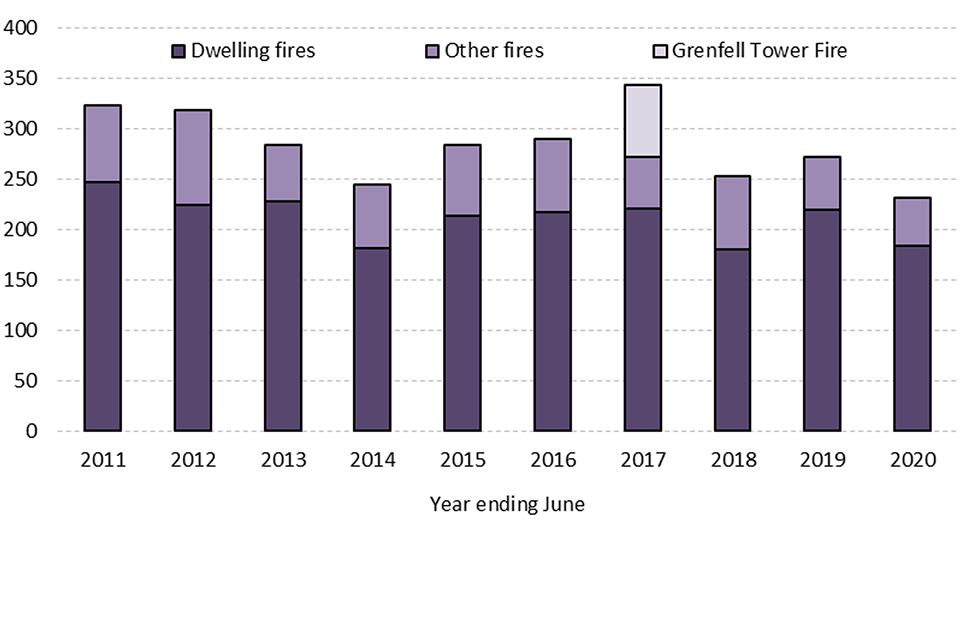
The number of fire-related fatalities in England was on a general downward trend from 1981/82, when comparable figures first became available. Though the numbers have fluctuated due to the relatively small numbers involved, over recent years the number of fatalities has plateaued. There was an exceptionally high figure in year ending June 2017 (Figure 5.1) due to the Grenfell Tower fire[footnote 4]. The 231 fire-related fatalities in the year ending June 2020 was the lowest 12 month figure since quarterly data became available in 2001/02.
A very small proportion of fires resulted in a fire-related fatality: 223 out of the 67,720 primary fires (0.33%). This proportion is a slight decrease compared with the previous year, when there were 247 fires with a fire-related fatality out of the 72,091 primary fires (0.34%). There were four fires from the 800 fires in purpose-built high-rise (10+ storeys) flats in the year ending June 2020 which resulted in a fatality, compared with five in the previous year.
Figure 5.1: Total fire-related fatalities, England; year ending June 2011 to year ending June 2020
The number of non-fatal casualties in fires in England had been on a downward trend since the mid-1990s and since the introduction of the online IRS in 2009 the hospital slight and first aid categories have shown the biggest decline, but it appears the overall downward trend has slowed in recent years due to slight increases in precautionary checks. Casualties recorded as hospital severe have remained low but fluctuate from year to year. (Figure 5.2)
Figure 5.2: Total non-fatal casualties in fires by injury severity, England; year ending June 2011 to year ending June 2020
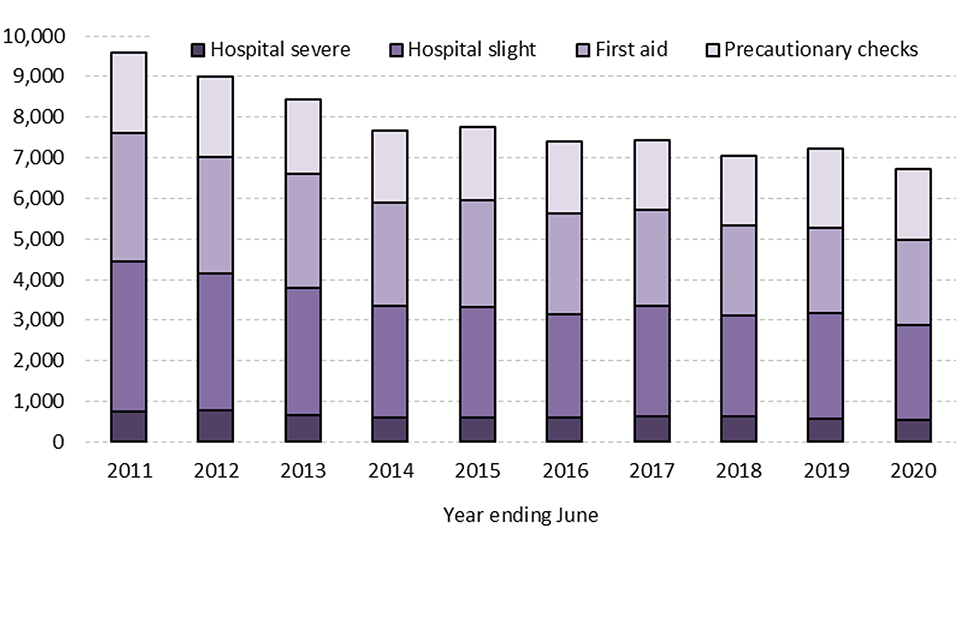
Source: FIRE0502
Notes: These figures are for all casualties in fires, whether the fire caused the casualty or not.
6. Fire and rescue incidents during COVID-19 National Lockdown
In response to the coronavirus (COVID-19) pandemic, lockdown restrictions came into effect from 23rd March 2020 and imposed strict limits on daily life. These included significant restrictions on freedom of movement and a requirement by law for a range of businesses to close.
This section shows, for various incident types attended by FRSs, weekly incident numbers under the lockdown compared against a baseline of the previous five years (2015 to 2019). Weekly figures are highly susceptible to fluctuation and so an upper and lower range, using the mean and standard deviation of the 2015-2019 baseline figures, was calculated. Any figures beyond this range would fall outside of what would be expected, although these results could be explained by various factors such as the weather, school/bank holiday dates and not simply the lockdown.
Key results
Generally, the results show that incident figures were not higher or lower than typically seen in 2015 to 2019 and some that could be explained by the weather. The only exception to this is Road Traffic Collisions which saw fewer incidents than our analysis would describe as typical.
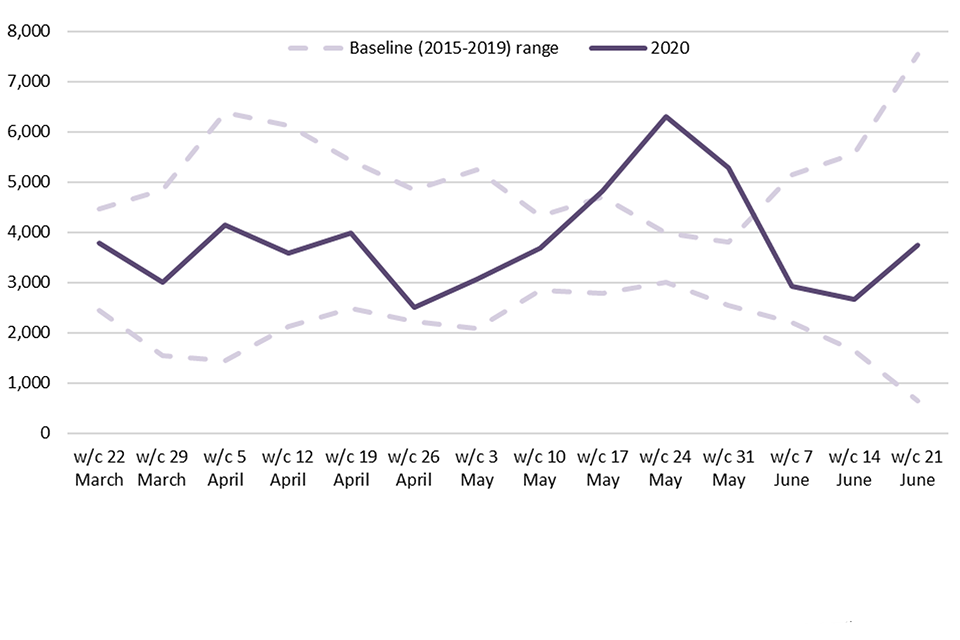
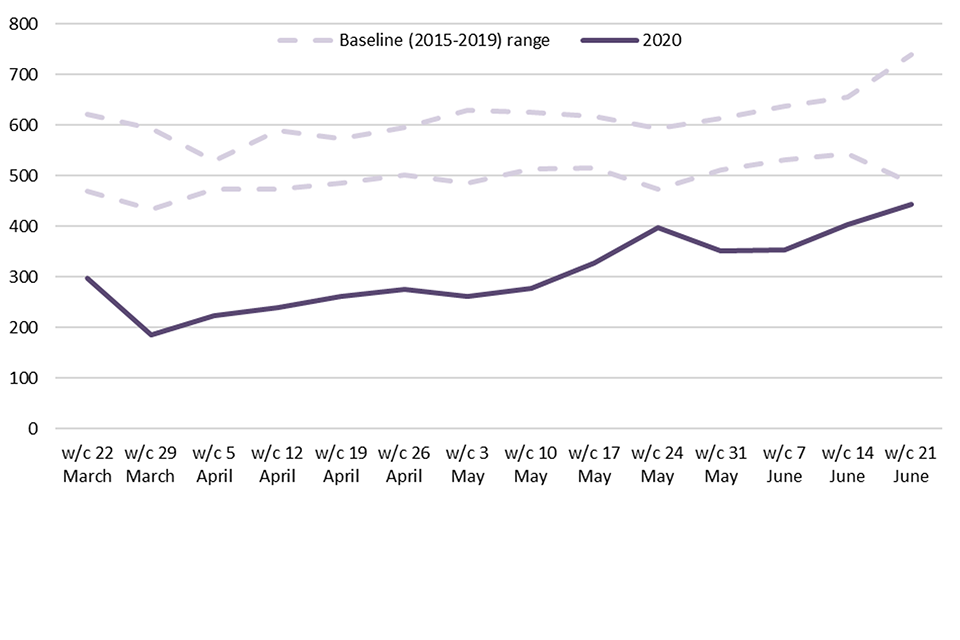
6.1 Total incidents
The number of incidents attended by FRSs between 22nd March and 27th June 2020 was generally not out of the ordinary despite the lockdown. Four weeks out of the 14 captured by this analysis fell slightly outside of the range of what would be expected (i.e. outside the 2 dotted lines in figure 6.1) with two above and two below.
Figure 6.1: Total incidents attended by FRSs, England, 22nd March to 27th June 2020 compared with the 2015-2019 baseline

6.2 Total fires
The number of fires attended by FRSs between 22nd March and 27th June 2020 was generally not out of the ordinary despite the lockdown. Three weeks out of the 14 captured by this analysis fell outside of the range of what would be expected (i.e. outside the 2 dotted lines in Figure 6.2) with all three above the line and during a period of hot, dry weather across much of England.
Figure 6.2: Total fires attended by FRSs, England, 22nd March to 27th June 2020 compared with the 2015-2019 baseline
6.3 Total dwelling fires
The number of dwelling fires attended by FRSs between 22nd March and 27th June 2020 was generally not out of the ordinary despite the lockdown. Five weeks out of the 14 captured by this analysis fell slightly outside of the range of what would be expected (i.e. outside the 2 dotted lines in Figure 6.3) with one above and four below. This goes against the hypothesis that the lockdown caused more dwelling fires as people cooked more at home, although these were only the fires attended by FRSs.
Figure 6.3: Total dwelling fires attended by FRSs, England, 22nd March to 27th June 2020 compared with the 2015-2019 baseline

6.4 Total RTCs
The number of RTCs attended by FRSs between 22nd March and 27th June 2020 was out of the ordinary during the lockdown. All 14 weeks captured by this analysis fell below the range of what would be expected (i.e. below the 2 dotted lines in Figure 6.4). This supports the hypothesis that the lockdown caused fewer vehicle journeys and hence fewer RTCs[footnote 5].
Figure 6.4: Total RTCs attended by FRSs, England, 22nd March to 27th June 2020 compared with the 2015-2019 baseline
7. Summary of changes over time
Table 7.1: Number of incidents, comparing the year ending June 2020 with the year ending June 2019, five years previously in 2014/15 and ten years previously in 2009/10
| Incident type | Year ending June 2020 compared with year ending June 2019 |
Year ending June 2020 compared with 2014/15 |
Year ending June 2020 compared with 2009/10 |
|||
|---|---|---|---|---|---|---|
| 549,913 all incidents | 573,776 | -4% | 496,136 | +11% | 680,634 | -19% |
| 156,128 fires | 182,661 | -15% | 155,040 | +1% | 241,462 | -35% |
| 67,720 primary fires | 72,091 | -6% | 71,116 | -5% | 101,159 | -33% |
| 28,398 dwelling fires | 29,165 | -3% | 31,334 | -9% | 38,376 | -26% |
| 25,417 accidental dwelling fires | 26,246 | -3% | 28,321 | -10% | 33,032 | -23% |
| 85,400 secondary fires | 107,190 | -20% | 78,743 | +8% | 132,941 | -36% |
| 231,510 fire false alarms | 229,961 | +1% | 215,857 | +7% | 285,368 | -19% |
| 162,275 non-fire incidents | 161,154 | +1% | 125,239 | +30% | 153,804 | +6% |
| 16,285 medical incidents | 18,499 | -12% | 15,807 | +3% | 10,241 | +59% |
Table 7.2: Number of fire-related fatalities and non-fatal casualties, comparing the year ending June 2020 with the year ending June 2019, five years previously in 2014/15 and ten years previously in 2009/10
| Fatalities and non-fatal casualties | Year ending June 2020 compared with year ending June 2019 |
Year ending June 2020 compared with 2014/15 |
Year ending June 2020 compared with 2009/10 |
|||
|---|---|---|---|---|---|---|
| 231 fire-related fatalities | 271 | -15% | 264 | -12% | 340 | -32% |
| 183 fire-related fatalities in dwellings | 219 | -16% | 195 | -6% | 257 | -29% |
| 6,714 non-fatal casualties | 7,212 | -7% | 7,596 | -12% | 8,864 | -24% |
| 2,878 non-fatal casualties requiring hospital treatment | 3,165 | -9% | 3,252 | -12% | 4,155 | -31% |
| 5,053 non-fatal casualties in dwellings | 5,214 | -3% | 5,926 | -15% | 6,863 | -26% |
Source: Fire statistics data tables
8. Further information
This release contains statistics about incidents attended by fire and rescue services (FRSs) in England. The statistics are sourced from the Home Office’s online Incident Recording System (IRS). This system allows FRSs to complete an incident form for every incident attended, be it a fire, a false alarm or a non-fire incident (also known as a Special Service incident). The online IRS was introduced in April 2009. Previously, paper forms were submitted by FRSs and an element of sampling was involved in the data compilation process.
Fire and Rescue Incident Statistics and other Home Office statistical releases are available via the Statistics at Home Office page on the GOV.UK website.
Data tables linked to this release and all other fire statistics releases can be found on the Home Office’s ‘Fire statistics data tables’ page.
Guidance for using these statistics and other fire statistics outputs, including a Quality Report, is available on the fire statistics guidance page.
The information published in this release is kept under review, taking into account the needs of users and burdens on suppliers and producers, in line with the Code of Practice for Statistics. If you have any comments, suggestions or enquiries, please contact the team via email using firestatistics@homeoffice.gov.uk or via the user feedback form on the fire statistics collection page.
8.1 Revisions
The IRS is a continually updated database, with FRSs adding incidents daily. The figures in this release refer to records of incidents that occurred up to and including 31 June 2020. This includes incident records that were submitted to the IRS by 16 September 2020, when a snapshot of the database was taken for the purpose of analysis. As a snapshot of the dataset was taken on 16 September 2020, the statistics published may not match those held locally by FRSs and revisions may occur in the future. This is particularly the case for statistics with relatively small numbers, such as fire-related fatalities. For instance, this can occur because coroner’s reports may mean the initial view taken by the FRS will need to be revised; this can take many months, even years, to do so.
8.2 COVID-19 and the impact on the IRS
The figures presented in this release relate to incidents attended by FRSs during the period July 2019 to the end of June 2020. In response to the coronavirus pandemic, restrictions in England and Wales started from 12 March 2020 and lockdown was applied on 23 March 2020, which imposed strict limits on daily life. The restrictions and lockdown are therefore captured in IRS data for the year ending June 2020.
Home Office statisticians have been monitoring incidents on the IRS since the beginning of the Covid-19 pandemic lockdown to ensure that data quality has not been reduced, and that all incidents are recorded. In addition, FRSs were asked to upload the information more quickly after attending an incident so that the IRS could be used to produce Management Information to monitor the impact of COVID-19 on FRSs capacity.
8.3 Changes to this release and future releases
This release has been published using the new Home Office statistical release template. We welcome comments on the new format of release. Please send any comments to FireStatistics@homeoffice.gov.uk.
8.4 Other related publications
Home Office publish five other statistical releases covering fire and rescue services:
- Detailed analysis of fires attended by fire and rescue services in England: focuses on fires attended by fire and rescue services across England, fire-related fatalities and non-fatal casualties in those fires; including analyses of the causes of fires and smoke alarms ownership and operation.
- Detailed analysis of non-fire incidents attended by fire and rescue services, England: focuses on non-fire incidents attended by fire and rescue services across England, including analysis on overall trends, fatalities and non-fatal casualties in non-fire incidents, and further detailed analysis of different categories of non-fire incidents.
- Fire and rescue workforce and pensions statistics: focuses on total workforce numbers, workforce diversity and information regarding leavers and joiners; covers both pension fund income and expenditure and firefighters’ pension schemes membership; and includes information on incidents involving attacks on firefighters.
- Fire prevention and protection statistics, England: focuses on trends in smoke alarm ownership, fire prevention and protection activities by fire and rescue services.
- Response times to fires attended by fire and rescue services, England covers statistics on trends in average response times to fires attended by fire and rescue services.
The Ministry of Housing, Communities & Local Government publish one statistical release on fire:
- English housing survey: fire and fire safety report: focuses on the extent to which the existence of fire and fire safety features vary by household and dwelling type.
Fire statistics are published by the other UK nations:
Scottish fire statistics and Welsh fire statistics are published based on the IRS. Fire statistics for Northern Ireland are published by the Northern Ireland Fire and Rescue Service using data from a system similar to the Incident Recording System, which means that they are not directly comparable to English, Welsh and Scottish data.
National Statistics
These statistics have been assessed by the UK Statistics Authority to ensure that they continue to meet the standards required to be designated as National Statistics. This statistical bulletin is produced to the highest professional standards and is free from political interference. It has been produced by statisticians working in accordance with the Home Office’s Statement of compliance with the Code of Practice for Official Statistics, which covers Home Office policy on revisions and other matters. The Chief Statistician, as Head of Profession, reports to the National Statistician with respect to all professional statistical matters and oversees all Home Office National Statistics products with respect to the Code, being responsible for their timing, content and methodology. This means that these statistics meet the highest standards of trustworthiness, impartiality, quality and public value, and are fully compliant with the Code of Practice for Statistics.
-
Medical incidents include “First responder” and “Co-responder” incidents; collaborating incidents are “Assisting other agencies”, “Effecting entry/exit” and “Suicide/attempts”. ↩
-
For more detailed technical definitions of fire-related and non-fatal casualties, see the Fire Statistics Definitions document. A further breakdown of the different types of non-fatal casualties is available in the published fire data tables. ↩
-
London Fire Brigade’s records of the number of fatalities are based on information provided by the Metropolitan Police Service. The fire-related fatalities figure of 80 was announced by the Metropolitan Police Service (MPS) on 10 July 2017. MPS have since revised this number to 71 fire-related fatalities on 16 November 2017. The non-fatal casualty numbers are derived from numbers published by the London Ambulance Service for people who attended hospital together with those recorded by the London Fire Brigade who received first aid or required a ‘precautionary check’. On 29 January 2018, a further victim, who had initially survived the fire, passed away in hospital. As a result, a figure of 72 fatalities from the Grenfell Tower fire has been widely cited in the media and the Grenfell Tower inquiry honoured her memory at the commemoration hearings. However, at the time of writing the Metropolitan Police had not yet added her to the official list of fatalities from the fire, pending the results of a coroner’s report which will determine whether her death was a direct result of the fire or caused by her pre-existing medical condition. She, therefore, remains counted in the list of non-fatal casualties pending a final decision from the coroner and the subsequent updating of any formal records in the police and fire systems regarding this case. ↩